Determination of 13 Azithromycin Impurities in Pharmaceutical Formulations by HPLC-UV
Abstract
Azithromycin (AZM) is a broad-spectrum, semi-synthetic antibiotic from the macrolide family, used for decades to treat infections caused by bacteria, such as pharyngitis and tonsillitis. During the pandemic, it was possible repositioning azithromycin against the new coronavirus (SARS Cov-2) as widely publicized, however, the World Health Organization (WHO) does not recommend this therapy. Drugs may contain impurities, which are inevitably produced during their synthesis route, but may also originate throughout the shelf life of the drug, as degradation products. In the case of AZM, these impurities can reduce the antibacterial activity and increase the toxicity of the drug. To evaluate these impurities, a HPLC-UV/Vis method was developed based on the United States Pharmacopoeia, using 210 nm as the detection wavelength, a C18 column (250 × 4.6 mm; 5 µm), and a mobile phase gradient composed of anhydrous dibasic sodium phosphate buffer, methanol, and acetonitrile. The column temperature and mobile phase flow parameters were determined after the application of 32 factorial experiment as being 55 ºC and 0.9 mL min-1, respectively. The method presented adequate selectivity, precision, accuracy, linearity and robustness, in accordance with the specifications contained in resolutions of the collegiate board (RDC) 166/17. Finally, it was possible to monitor the quality of six batches from five different registration holders available on the Brazilian market.
Keywords:
HPLC-UV/Vis; organic impurity; drug degradation; pharmaceutical; impurities; analytical validation; drug stability
Introduction
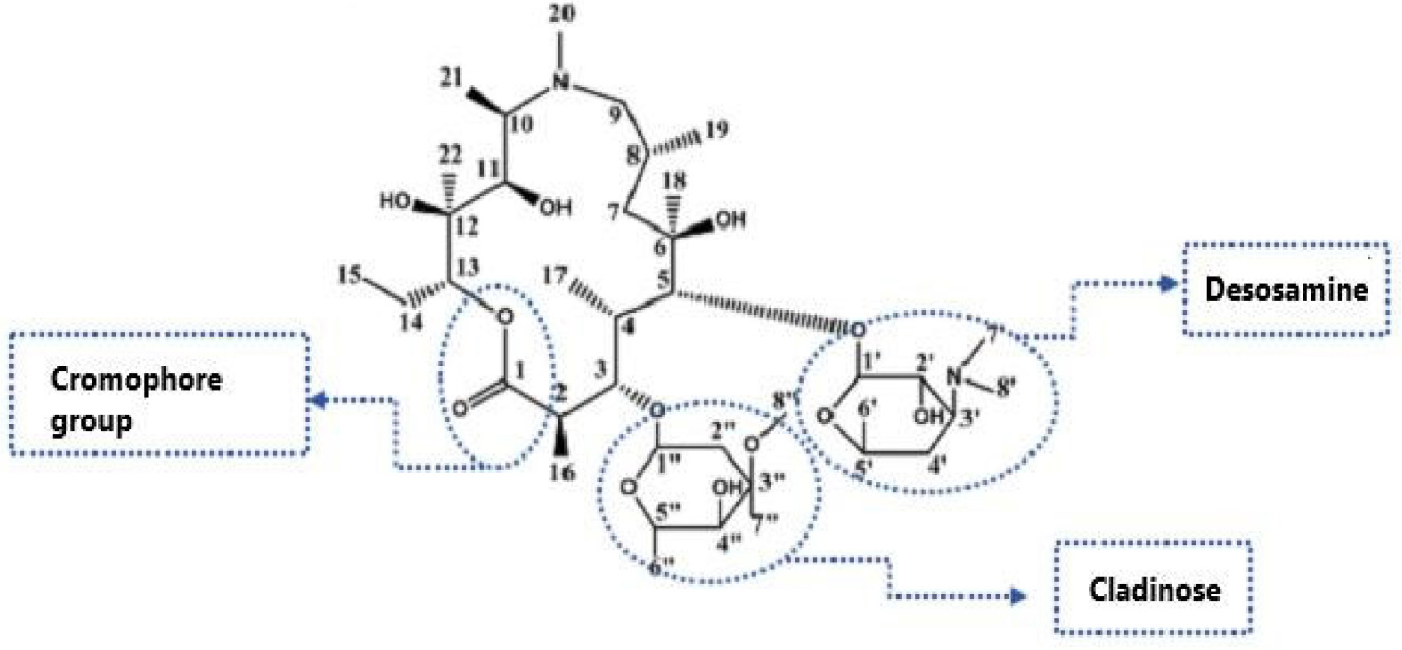
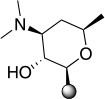
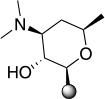
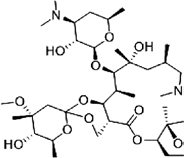
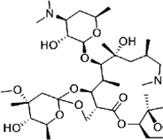
Azithromycin (AZM) is classified as an azalide, a subclass of macrolides, structurally characterized by a 15-membered macrocyclic lactone ring containing two sugar residues as substituents: cladinose in position 3, desosamine in position 5 and a chromophore group (function ester),1 in position 1 as shown in Figure 1.
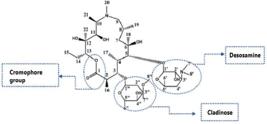
Structure of azithromycin dihydrate: sugar residues (cladinose and desosamine, and function ester) chromophore group.1
Used since the mid-1980s in the clinical treatment of respiratory infections and sexually transmitted infections, lately, non-antimicrobial effects and immunomodulatory activity have also been demonstrated for this drug, expanding its use in the long-term therapy of chronic lung pathologies.1,2
The 15-membered lactone ring results in better acid stability and consequent greater oral bioavailability compared to erythromycin. It is this group that binds to the 50S ribosomal subunit of susceptible bacteria and suppresses protein synthesis. Therefore, macrolides are known to exert both bactericidal and bacteriostatic effects.3
It is known that drugs contain impurities from the synthesis process or that can originate throughout the production process of the pharmaceutical form or the shelf life of the medicine, as degradation products, which can reduce the antibacterial activity and increase the toxicity of the drug. Therefore, it is important to identify, characterize and control such impurities as well as quantify them, mainly in formulated medicines.4-6
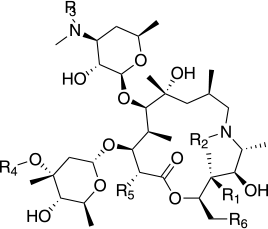
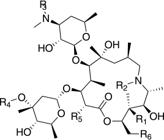
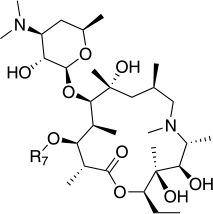
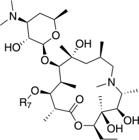
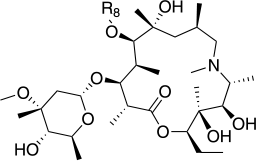
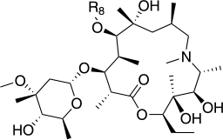
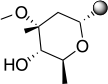
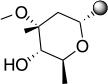
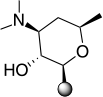
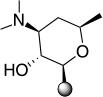
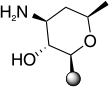
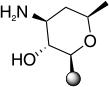
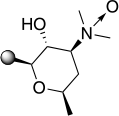
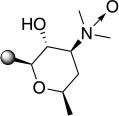
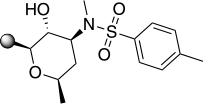
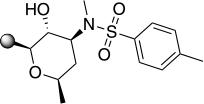
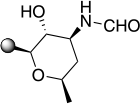
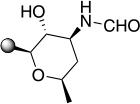
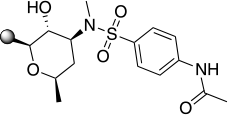
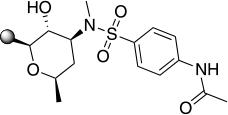
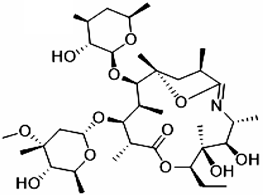
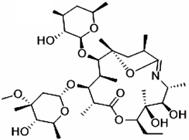
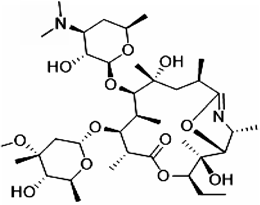
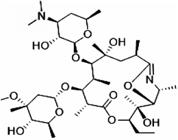
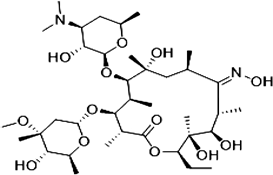
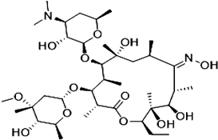
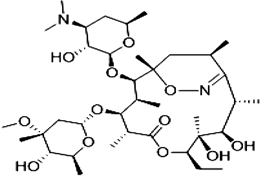
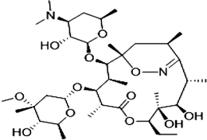
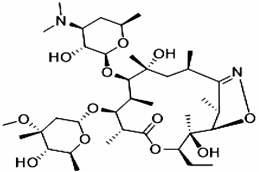
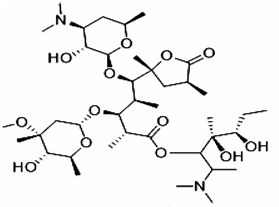
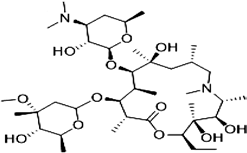
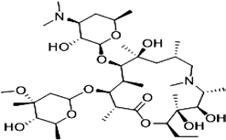
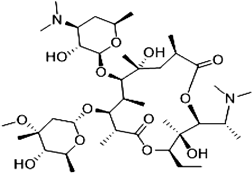
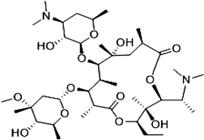
Twenty-three AZM impurities were reported, including the structure of impurity P, which was also elucidated. Among the impurities, there are synthetic sub-products, intermediate compounds from its semi-synthesis and, seven of them are degradation products of the active pharmaceutical ingredient (API) in the formulated medicine, all of them are structural analogues of AZM.7Table 1 shows all the chemical structures of the 23 known organic impurities of AZM.
For safety reasons, impurities that exceed 0.1% (identification limit) in the finished product containing AZM must have their structures confirmed to comply with the limits proposed by the International Conference on Harmonization of Requirements for Registration of Pharmaceutical Products for Use Human - ICH (International Conference of Harmonization).5 High performance liquid chromatography (HPLC), using an ultraviolet-visible (UV-Vis) detector, has been widely used as a tool for identifying and quantifying impurities related to AZM.8
When using the analytical method described in the official compendium, the suitability of this method must be demonstrated.9 Thus, the pharmaceutical industry sought to meet regulatory requirements by having AZM coated tablets in one of its products, finding difficulties in the suitability of the method regarding good resolution between the peaks of desosaminylazithromycin (impurity J) and 3’-(N-demethyl)-3’-N-formylazithromycin (related compound F of AZM), as well as the non-reproducibility of the impurity response factors: J, related compound F of AZM and N-demethylazithromycin (impurity I).7
With this context, this work aims to improve the analytical method for impurities in order to search a better resolution for impurities peaks of impurity J, I and F. Afterall, proceed with the expected analytical method validation.
Experimental
Reagents, standards and solutions
Acetonitrile (HPLC grade) and methanol (HPLC grade) were purchased from the company Merck/Sigma-Aldrich Brazil Ltd, Barueri, SP. Other chemicals, including mono ammonium diphosphate anhydrous basic (NH4H2PO4) and di-basic sodium phosphate heptahydrate (Na2HPO4.7H2O) were purchased from the company Neon Reagents Analytics, Suzano, SP. Ultra-pure water was used, coming from reverse osmosis treatment, through the Milli-Q Direct 8/16 system, filtered through a PVDF (polyvinylidene fluoride filtration membrane) 0.22 µm before use. EPCRS (Ph. European Standard - azithromycin for peak identification) was the impurity standard, purchased from the European Pharmacopeia, Cat. Code Y000637, batch 5.0, Id 00M6FN.
Equipment and instruments
These equipment were used: an Ohaus Analytical Balance - Model DU215CD - Class I, for accurate weighing of the samples; a Methrom Peagameter - model 827 pH Lab, used to measure the pH of solutions; an ultrasound - Unique - Model USC-5000, used in sonication of samples to promote dispersion and homogenization; an Agilent Technologies 1260 Infinity II high performance liquid chromatography (HPLC) system, equipped with a diode array detector (DAD) and operated by Waters Empower 3 software, used for quantitative analysis of the substances present in the samples. The chromatogram images illustrated in this work were obtained from reports issued by the Empower 3 software licensed validated and supported by data integrity assumptions ALCOA (attributable, legible, contemporary, original and accurate). Therefore, it was not possible to export data to obtain the chromatograms in another format.
Chromatographic conditions
Gradient-type elution was used, in reverse phase, with variation in time and concentration of mobile phases, as detailed in Table 2. The wavelength chosen, after performing the spectral scan, was 210 nm (λ), as at this length greater absorption of the chromophore group of the AZM molecule was observed. This appropriate wavelength was an essential requirement for obtaining satisfactory Design of Experiments (DoE) results, which was later confirmed when conducting the validation of the analytical method.
Experimental design
A 32 factorial experiment planning, with triplicate analysis at the central point, was constructed to support the choice of chromatographic parameters of column oven temperature and injection flow, considering resolution as a response factor, attesting to the suitability of the analytical method, according to Table 3.
Factorial design 32 with triplicate at the central point - chromatographic parameters of the column oven temperature and injection flow, considering resolution as a response factor
After conducting the experiment planning, the column temperature was defined at 55 °C and mobile phase flow at 0.9 mL min-1.
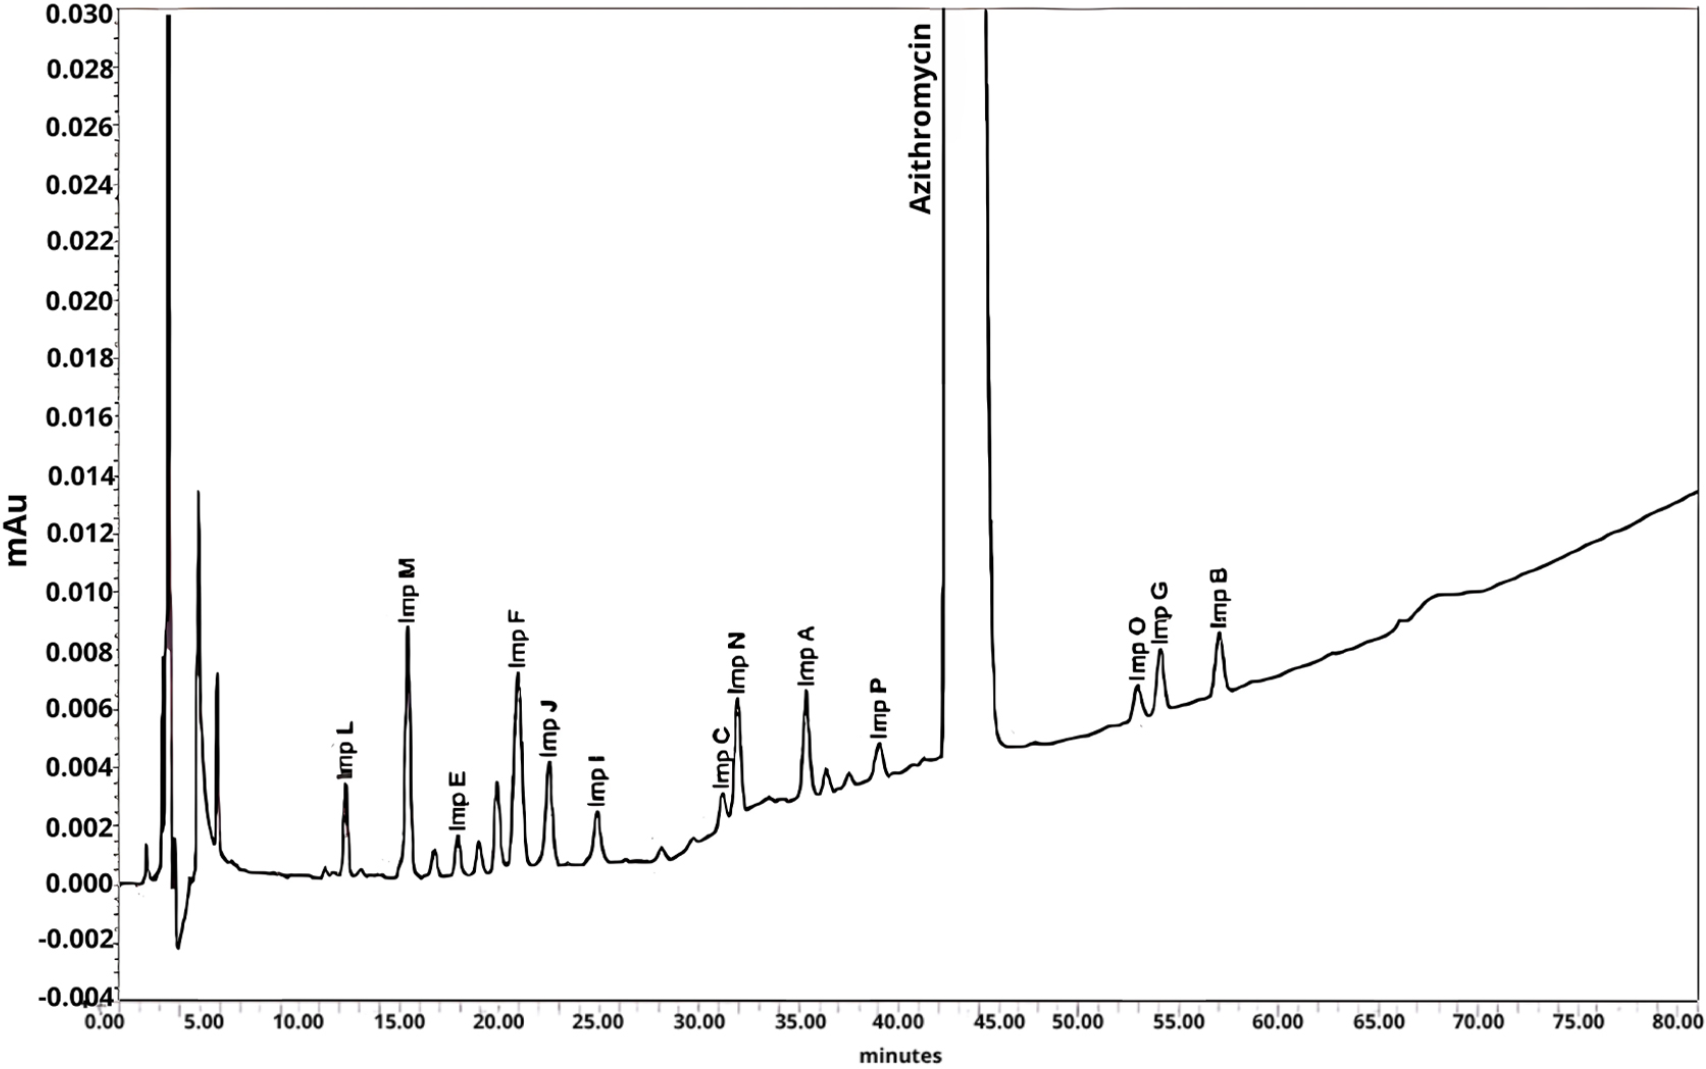
The experiment planning was based on the chromatographic profile of the reference standard for identifying azithromycin peaks as shown in Figure 2.9 This standard, provided by the European Pharmacopoeia (EP), is composed of thirteen known impurities, seven of them originated from the drug degradation, and the rest arising from the synthesis of the active pharmaceutical ingredient.
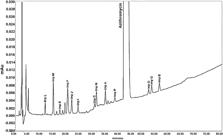
Among the seven impurities arising from degradation, impurity 3’-(N,N-didemethyl)-3’-N-formylazithromycin and the related compound F of AZM have rotamer compounds. As United States Pharmacopeia - National Formulary (USP-NF) azithromycin tablets, the relative retention time (RTT) are: 0.29 and 0.30 for impurity 3’-(N,N-didemethyl)-3’-N-formylazithromycin and 0.46 and 0.47 for azithromycin related compound F.10-12
Preparation of the EPCRS standard
About 4.0 mg of the EPCRS batch 5 reference standard for identifying azithromycin EP peaks was weighed on an analytical balance directly into a glass vial. 1.0 mL of diluent (solution A (methanol:acetonitrile): solution B (ammonium phosphate buffer pH 10): methanol 1:1) 7:6:7 v/v, respectively, was added volumetrically and dissolved in ultrasonic bath for 15 min, at room temperature. The solution was filtered with a 0.22 µm PVDF filter unit and transferred to a 1.5 mL amber vial, followed by homogenization.
Validation of the analytical method
Due to the variability of equipment, reagents, environmental conditions, consumables, among other factors, most of the time it is necessary to adapt the method and consequently submit it to analytical validation, complying with the evaluation of the parameters of selectivity, linearity, accuracy, precision, robustness and, in the case of impurities or related compounds, limits of detection and quantification.13,14 After carrying out the experiment planning and choosing the optimized parameters for injection flow and temperature, the method was subjected to validation in accordance with the requirements established by current Brazilian legislation, (ANVISA) RDC No. 166, of July 24, 2017,9 as well as the ICH guide Q2(R2) - Validation of Analytical Procedures (European Medicine Agency, 2022).15 The equipment used was the HPLC model Shimadzu LC-2030 C - DAD detector and the processing were carried out by the LC Solution software.
Analysis of six lots from different registration holders available on the Brazilian market
To demonstrate the method applicability, six batches of coated tablets were acquired from five different medicine industries, the benchmarking (product A) and four holders of generic medicine registration.
For the formulated medicines, 500 mg coated tablet, coming from the product registration holder B, called B1 and B2, two different batches were monitored, processed with APIs coming from different manufacturers: Alpha and Beta. For the formulated medicines, called products A, C, D and E, one batch of each of these was monitored, processed with the API from the manufacturers “Not Informed”, Zeta, Gama and Alpha, respectively. The calculation of concentrations was carried out according to the equations 1-5.16
where, ST is the sample test of the AZM 500 mg tablet product (mg); Pot. Pad. is the potency of the AZM substance standard on the percentage basis as is (%); AA is the area of impurities detected in the sample solution; AP is the area of the AZM substance in the standard AZM solution; Fr is the relative response factor for each impurity evaluate in the USP-NF azithromycin tablets.11,12
where, CP is the concentration of azithromycin in µg mL-1 in the AZM standard solution and PP is the weight of the azithromycin standard in mg.
where CA is the azithromycin concentration in µg mL-1 in the sample solution, X is the sample weight (azithromycin base).
Preparation of solutions: mobile phases, standards and sample
To prepare the mobile phase (solution A), about 1.8 g of anhydrous dibasic sodium phosphate was weighed and diluted in 1000 mL of ultra-purified water. The pH was adjusted to 8.9 with dilute phosphoric acid. The mobile phase (solution B) was prepared by measuring 250 mL of methanol and 750 mL of acetonitrile.
Preparation of reference standard for identifying azithromycin EP peaks was described in “Preparation of the EPCRS standard” sub-section. To prepare the standard AZM analysis solution, approximately 8.0 mg of the AZM reference standard were weighed and transferred to a 100 mL volumetric flask. About 60 mL of diluent were added and dissolved in an ultrasonic bath for 15 min at room temperature. The volume was completed, homogenized and filtered through 0.22 µm PVDF filter media.
For the sensitivity standard solution, approximately 1 mL of the AZM analysis standard solution was volumetrically transferred to a 20 mL volumetric flask. The volume was made up with diluent, homogenized and filtered through 0.22 µm PVDF filter media.
The preparation of the sample solution of the drug AZM 500 mg coated tablet followed by weighing 20 tablets from each of the six batches listed: A, B1, B2, C, D and E. The average weight was determined. Then, they were transferred to a porcelain bowl and, with the help of a pestle, they were crushed until a fine powder was obtained. The equivalent of approximately 100.0 mg of AZM was transferred quantitatively to a 25 mL volumetric flask. About 15 mL of diluent solution was added and dissolved in an ultrasonic bath for 15 min. The volume was made up with diluent solution, homogenized and filtered.
The placebo sample solution of the 500 mg coated tablet medication was obtained by weighing, approximately 72.34 mg of the placebo (equivalent to 100.0 mg of AZM) and transferred to a 25 mL volumetric flask. Approximately 15 mL of diluent solution were added and dissolved in an ultrasonic bath for 15 min at room temperature. The volume was made up with diluent solution, homogenized and filtered.
A single injection was performed for each sample of the medicine, one injection of diluent/blank and one injection for each of the placebos. For the peak identification solution (EP azithromycin peak identification reference standard) was performed in a single injection. For the API AZM standards, five injections of standard S1 were performed and for S2 (recovery standard) a single injection.
Results and Discussion
The advantage of adopting experimental planning with the aim of choosing assertiveness parameters in conducting and completing the validation of the analytical method was the possibility of optimizing time, reducing expenses with reagents and consumables in the process of internalizing analytical methods into laboratory routine.
Experimental design analysis
According to Table 4, all the fitted coefficients were considered significative within 95% confidence interval, since all p-values were minor than 0.05. On the other hand, the model presented lack-of-fit. For this reason, is not possible to consider the application of response surface methodology to optimize the system. Thus, it was only considered qualitative results based on the obtained separation chromatogram profile. In this sense the experiment 6 (x1 = 1.1 mL min 1, x2 = 55 °C) presented the minor result for chromatographic resolution (CRS) value. However, the experiments carried out in the central point 6 (x1 = 0.9 mL min-1, x2 = 55 °C) was select due to present smaller backpressure and only a marginal loss on the separation efficiency according to CRS.
Figure 3 described the effects on CRS values when the chromatographic variables of the method are changed, making it possible to check, graphically, the impact of changing the flow and temperature on the resolution of AZM impurities.

Response surface and interaction plots illustrating the combined effect of flow rate (x1) and column temperature (x2) on the chromatographic resolution (CRS) of azithromycin (AZM) impurities.
Figure 4 shows the chromatogram in the selected condition, where adequate resolution of critical pairs was evident (related compound F of AZM, impurities I and J). All the calculated resolutions can be found listed in the Table S1 (Supplementary Information (SI) section).
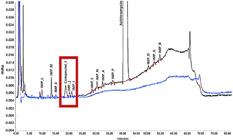
Chromatogram of the EPCRS standard (0.9 mL min-1 and 55 °C). Retention time (in min) of the impurities: impurity F (22.750); impurity J (24.408); impurity I (25.506), where adequate resolution of critical was evident.
Analytical method validation
A validation of the analytical method was conducted and included the parameters established by current Brazilian legislation,9,17-22 as well as the ICH Q2(R2) guide.15,23,24 The methodology presented acceptable selectivity, precision, accuracy, linearity and recovery, limit of detection (LOD) and limit of quantification (LOQ) compatible and suitable for monitoring AZM and impurities arising from drug degradation in the formulated medicine.
Selectivity
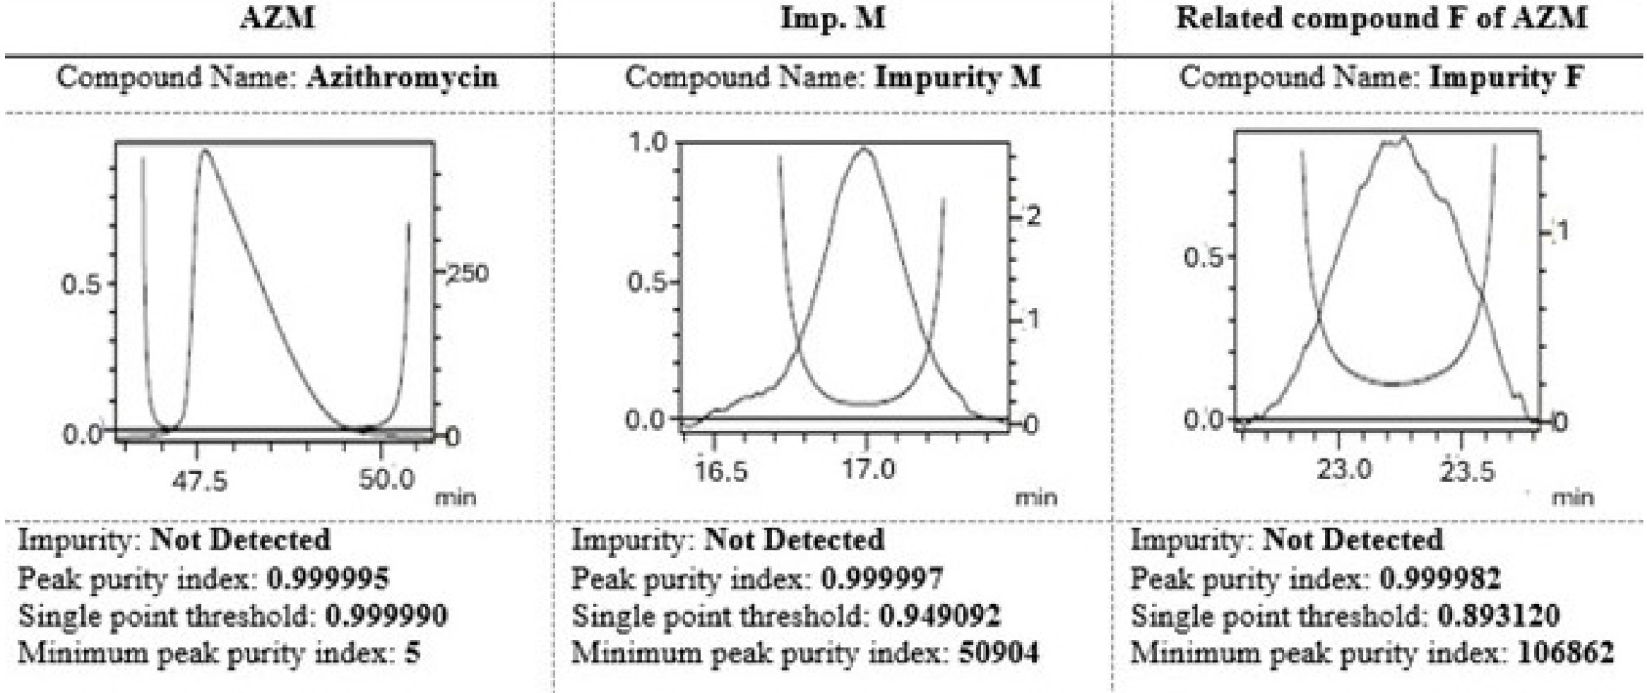
The selectivity of the method was demonstrated since there was no interference in the integration of the peaks in the retention times of the standard solutions and sample of AZM, impurities L, M, E, I, J, N and related compound F of AZM. In the evaluation evaluation recovery, the stipulated values were reached and the purity of the analyte peaks, calculated using the Lab Solutions software (Shimadzu Corporation, version 6.115, 2023), where all peak impurity index values, which could be calculated, were greater than or equal to the values single point threshold, confirming peak purity.
All impurities under stress conditions peak purity were evaluated. To illustrate, Figure 5 shows the purity peak of AZM, impurity M and the related compound F of AZM where the selectivity parameter of purity index equal to or greater than zero has been reached.
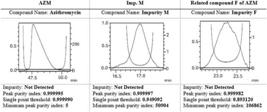
Stress conditions peak purity - AZM, impurity M (Imp. M) and related compound F (Imp. F) of AZM.
LOD and LOQ
The chromatographic parameters relating to the determination of LOD and LOQ were evaluated, at 3 levels, for AZM and known organic impurities.
Linearity
The substance AZM was established as the standard of analysis for the organic impurities’ method, therefore, an evaluation was carried out to ensure the linear relationship of the impurities quantified against it in the same linearity range. Considering that all mathematical models proved to be adjusted to the range evaluated, the definition of response factors became essential for obtaining assertive results.
The working range adopted was from LOQ to 120% of the specification limit for the impurities under evaluation. For AZM, the LOQ was up to 120% of the working concentration of the analysis standard, that is, up to 96.0 µg mL-1 equivalent to 2.4%. Therefore, the specified range was reached for all specified organic impurities considered, in addition to covering the range of unknown impurities and the working range of the analysis standard. The results of statistical calculations for linearity were demonstrated in Table 5. The data show a satisfactory linear correlation (R2) for azithromycin and its impurities.
Precision and accuracy
The results found for the precision (repeatability) and intermediate precision tests demonstrated that the method is precise and accurate, since the values obtained for individual recovery (%), average recovery (%) for both analysts and coefficient of variation (CV%) were within the stipulated limits for both known organic impurities and unknown/unspecified impurities. The maximum acceptable CV% for repeatability and intermediate precision were defined based on the sample concentration, adopting the maximum allowed value of up to 7.3% for each of the impurities, according to Miguel and Barbas.25 The specification for intermediate precision adopted was based on the proportional concentration of the Active Pharmaceutical Ingredient (API) in the sample, with the maximum allowed value being 11.0%. For unknown impurities, the maximum acceptable values for CV% and recovery were calculated considering the proportional concentration of IFA in the drug sample, with the theoretical average weight of 885.8 mg and the amount of AZM of 500 mg.
Robustness
Regarding robustness, the method proved to be robust for the column oven temperature condition evaluated as well as the flow condition adopted except for the flow parameter of 0.7 mL min-1 where low results were observed for the recovery of impurities I and J also for the condition “no extraction”. After DoE, the parameters filter test, sample extraction with ultrasonic bath, and pH of solution A, as shown in Table 6, were evaluated and the results achieved the expected Relative Standard Deviation (RSD) of ≤ 2.0%.
Results of the analyses of six lots from different holders available on the Brazilian market
In Tables 7 and 8 the values of retention time (min) and content (%) calculated for all related impurities/substances are compiled.
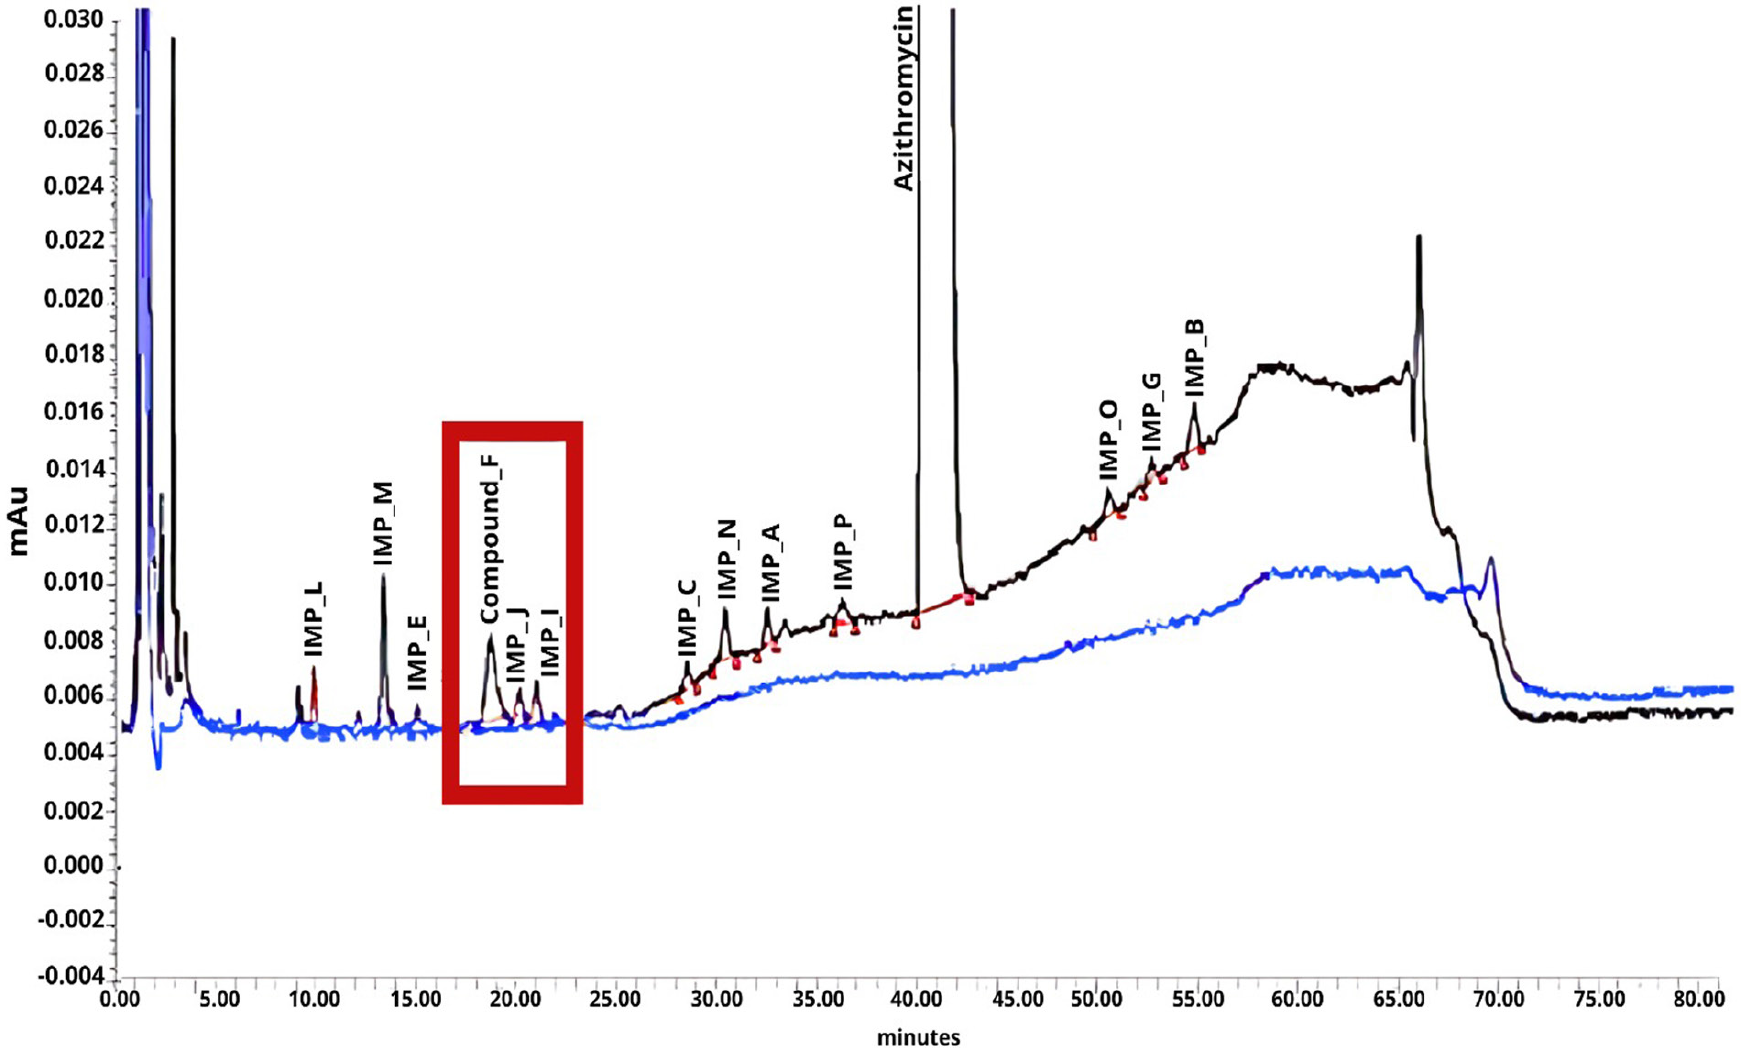
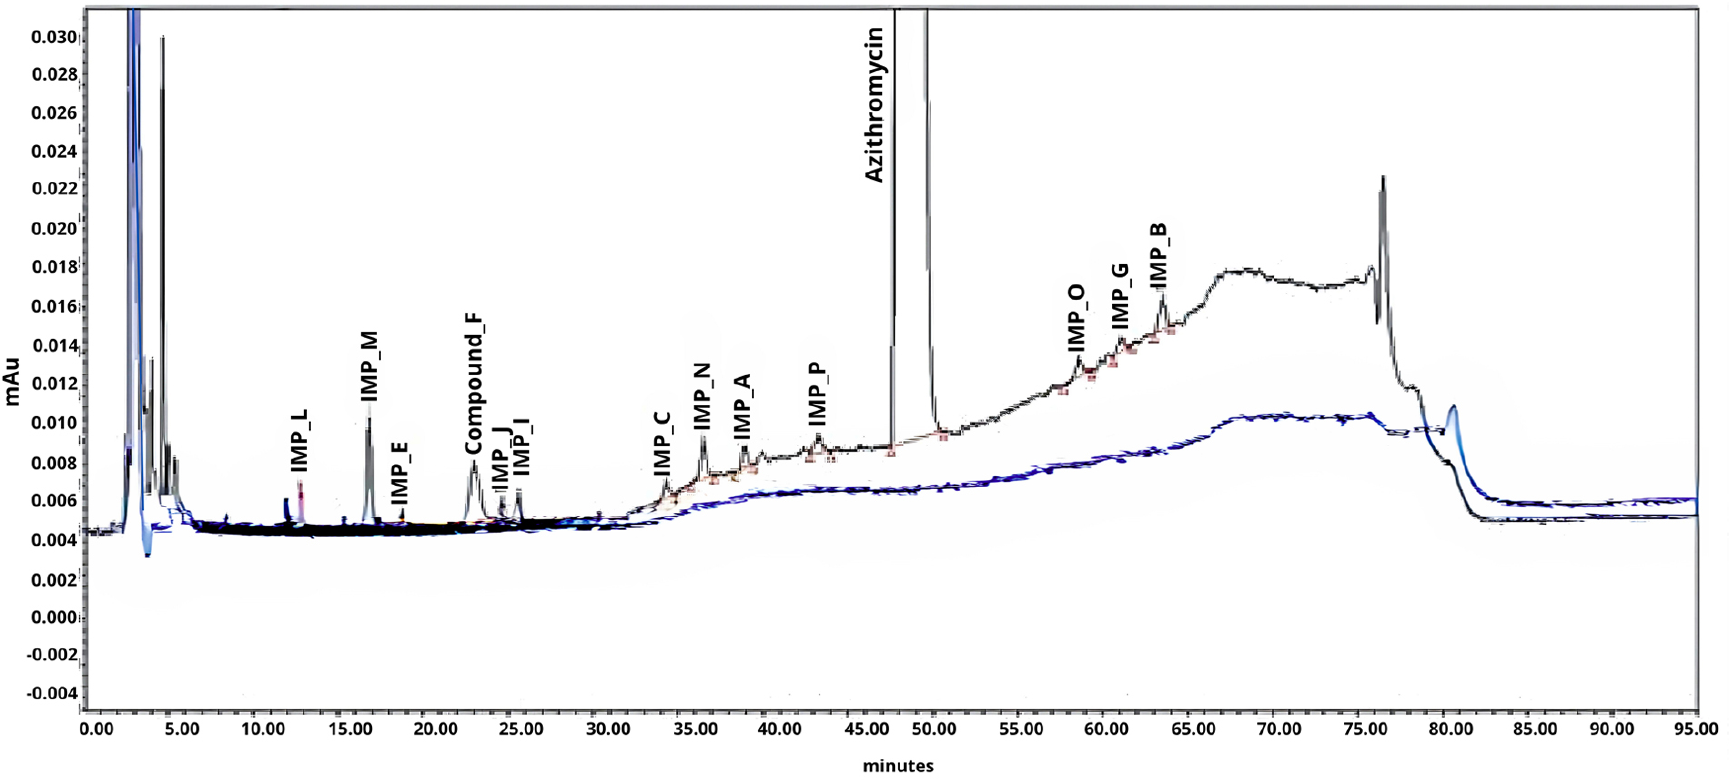
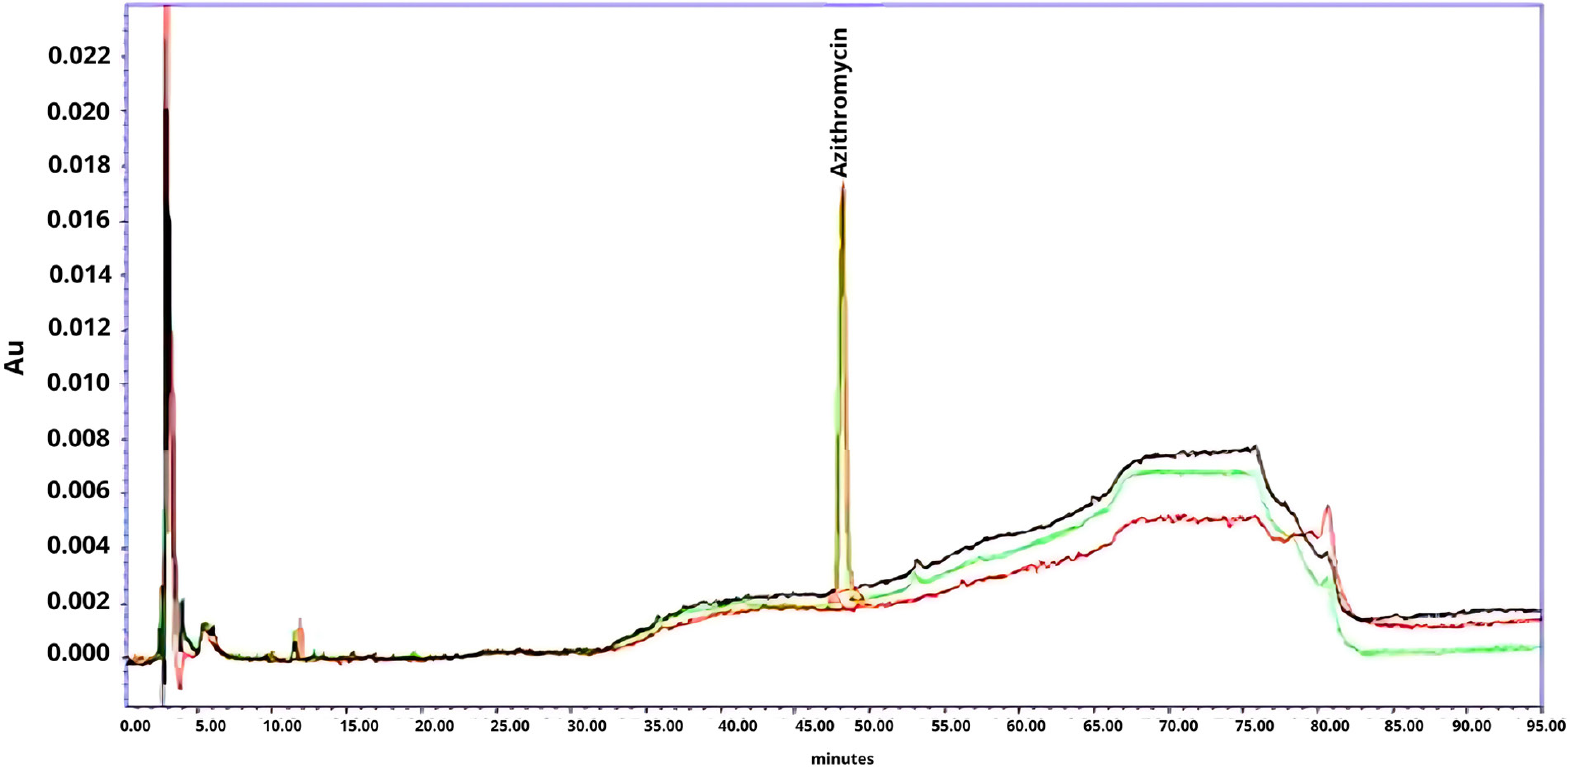
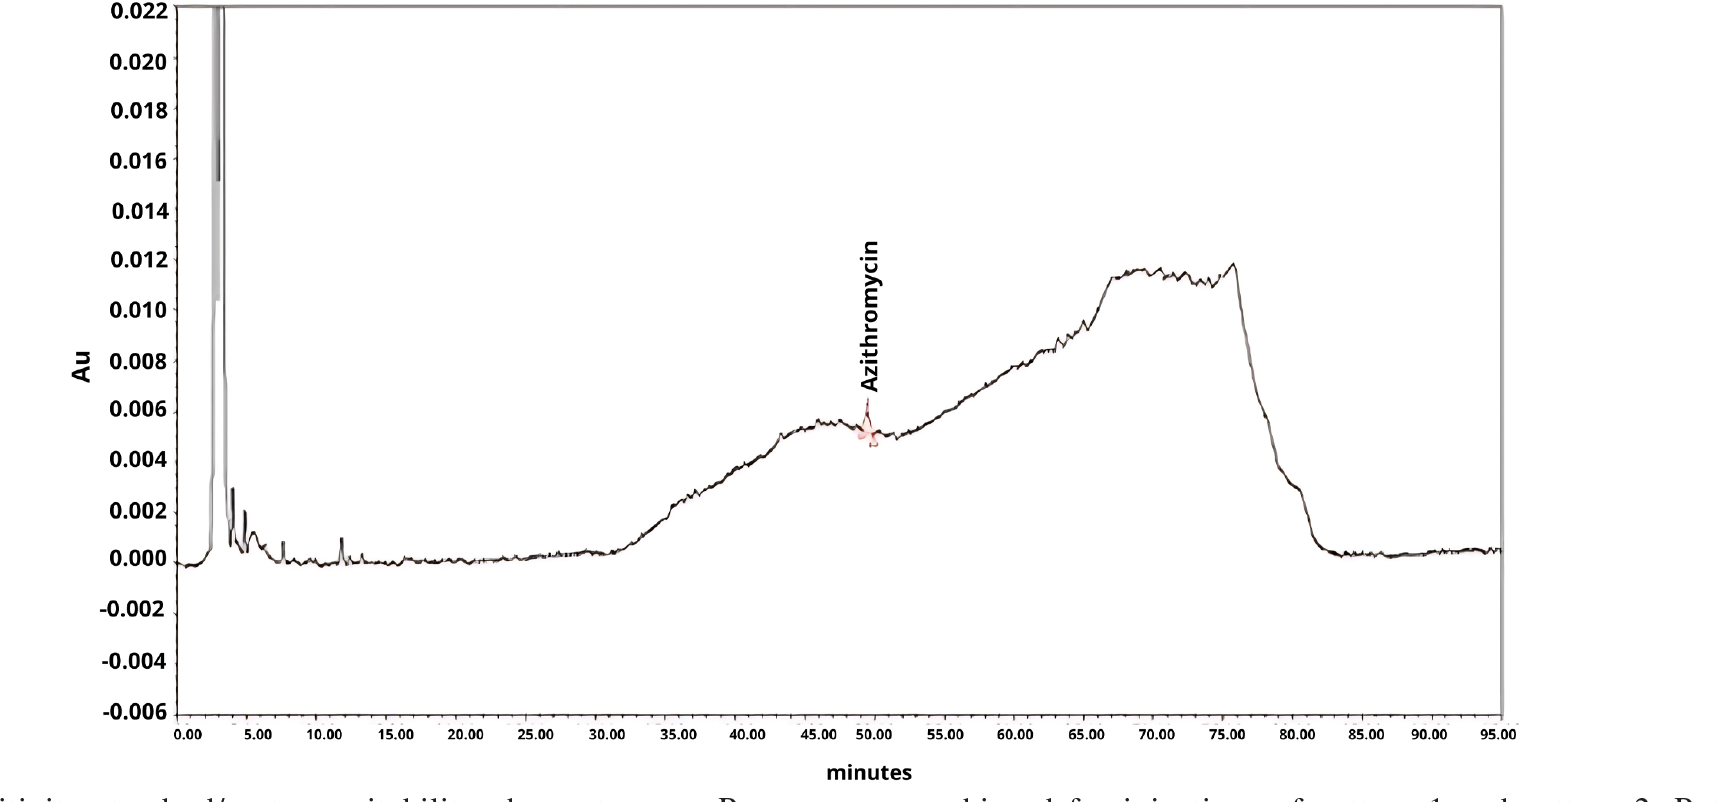
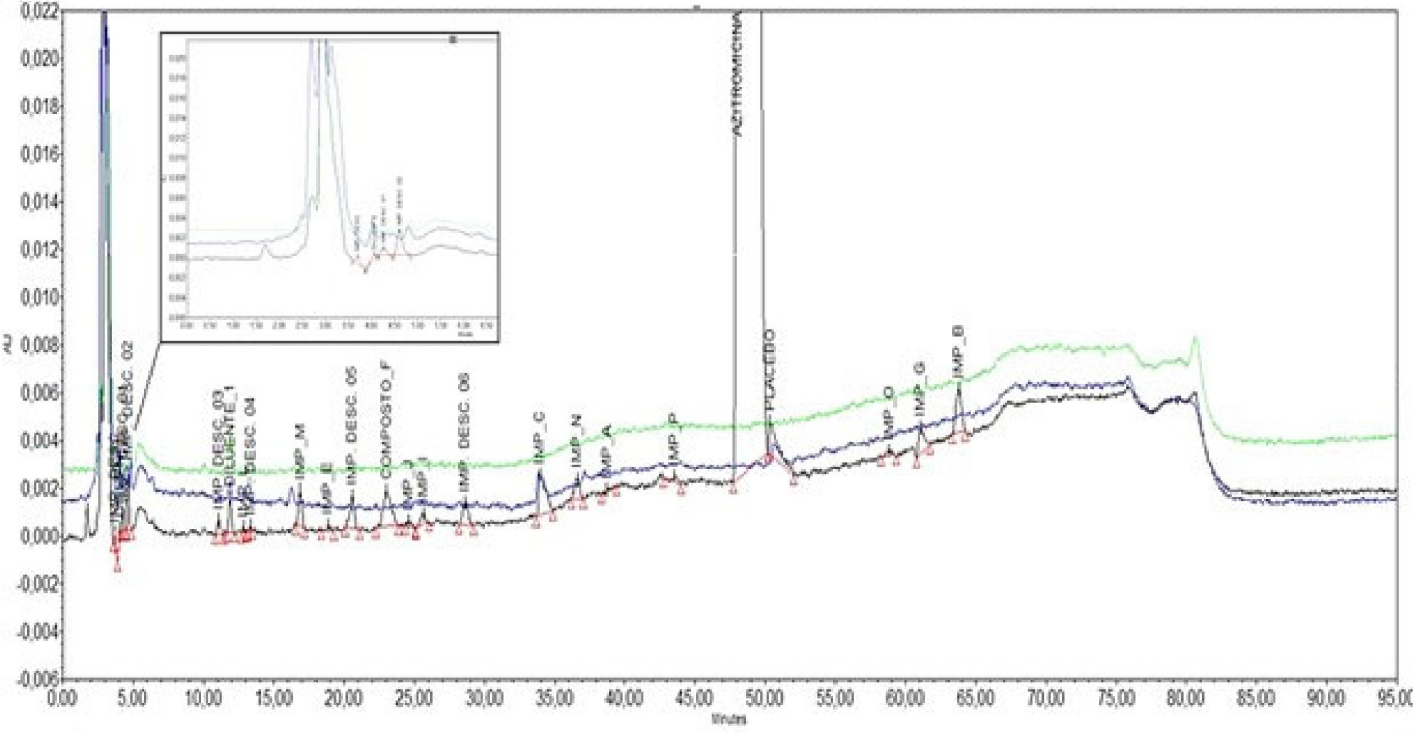
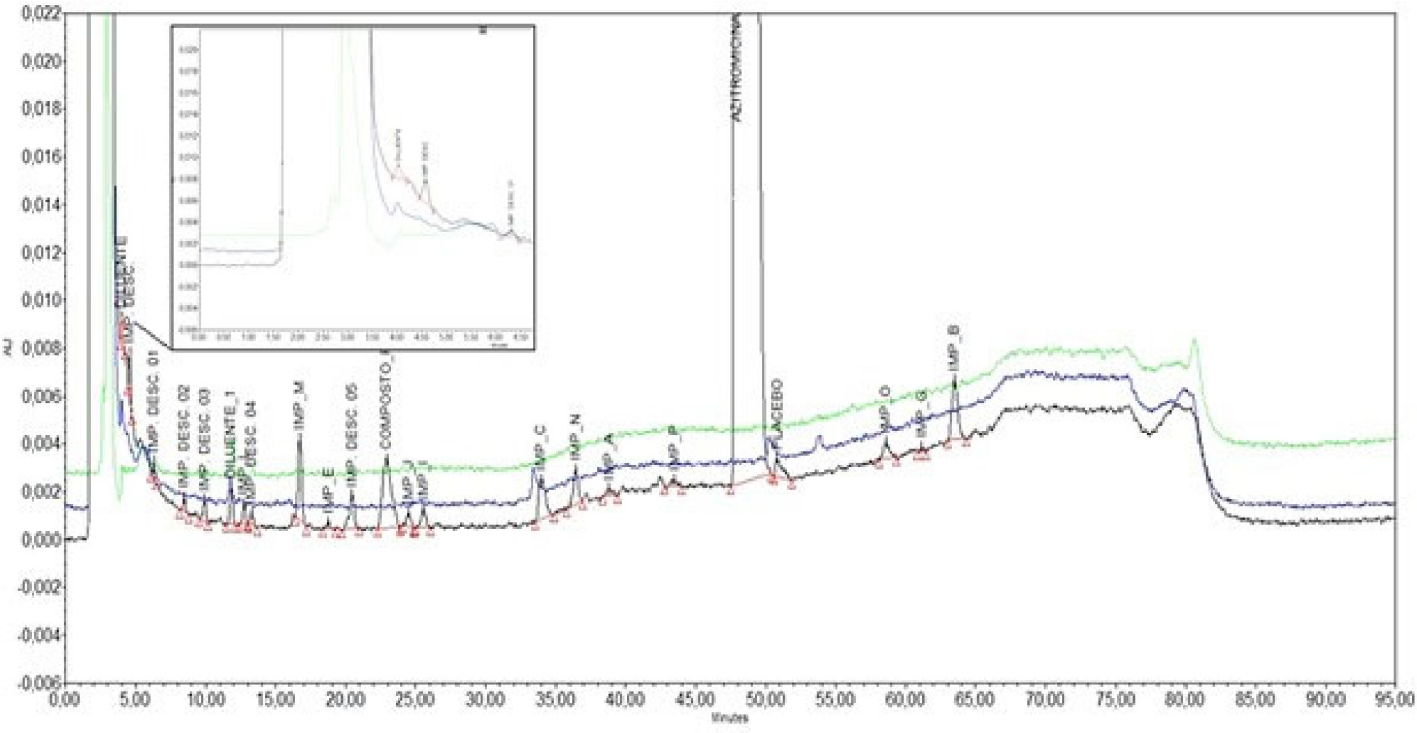
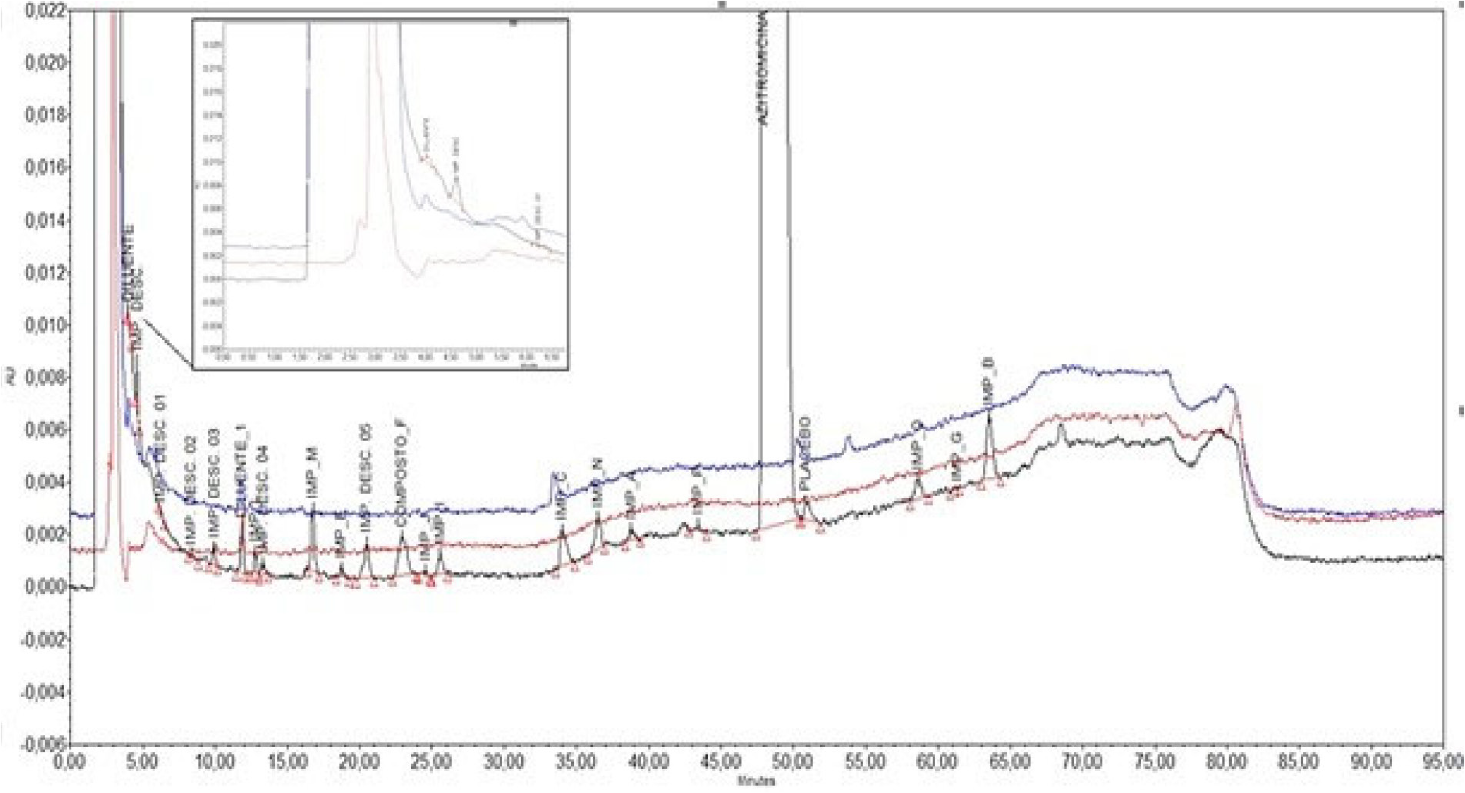
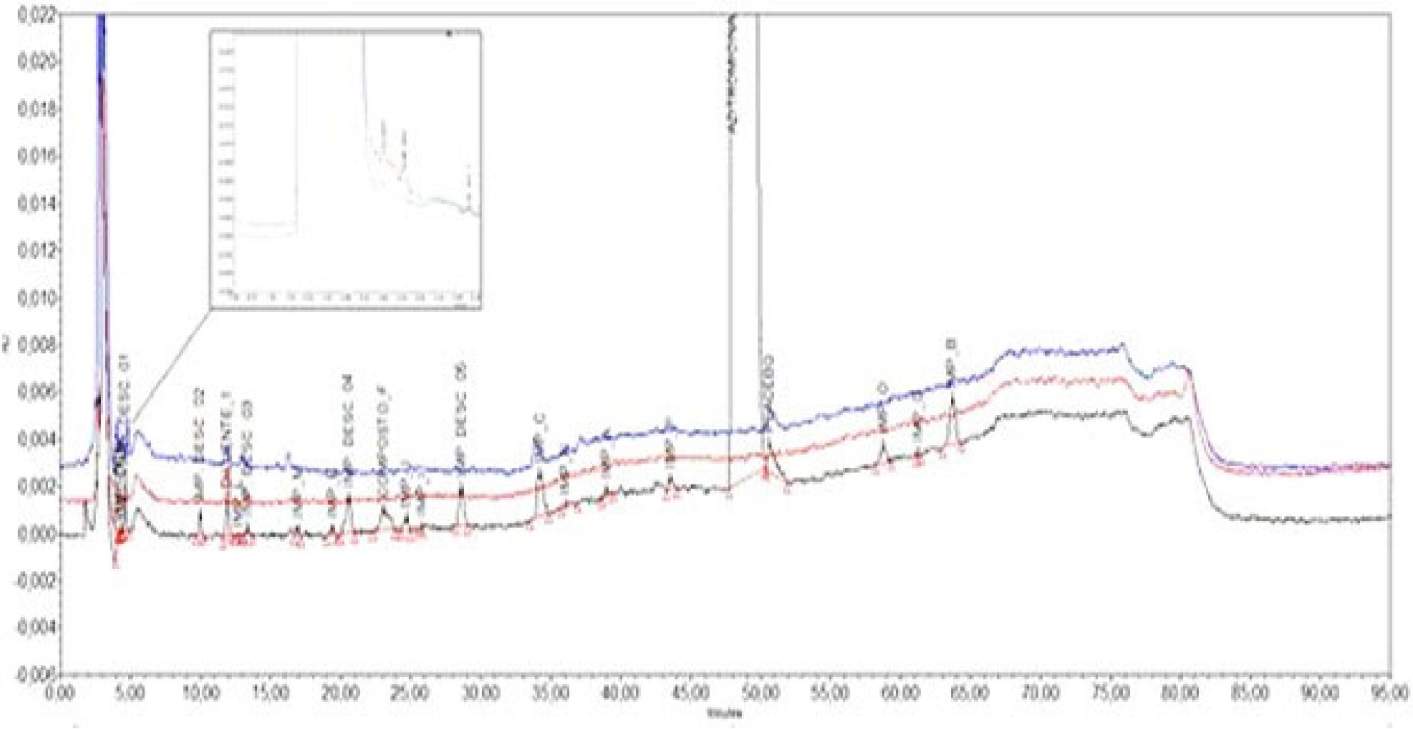
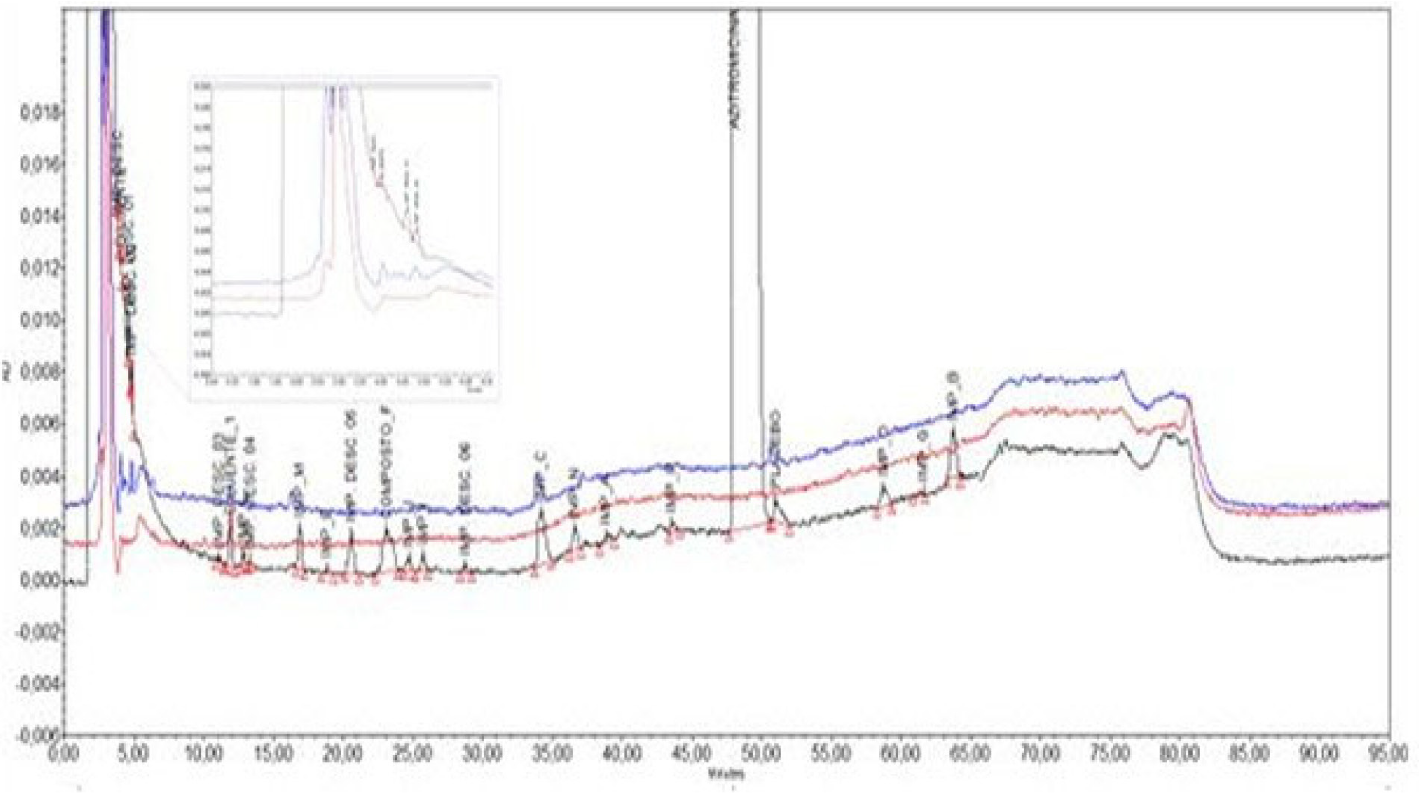
Figures 6 to 14 present the chromatograms obtained for: (i) the reference standard used to identify the AZM EP peaks compared with the standard diluent/blank; (ii) the recovery tests of AZM in standards S1 and S2 compared with the diluent/blank; (iii) the sensitivity standard/system suitability compared with the diluent/blank; and (iv) the placebo, the medicine, and the diluent/blank across the six evaluated batches.
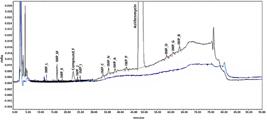
Chromatogram of the reference standard for identification of azithromycin EP peaks and diluent/blank. Standard reference AZM - EP (black); diluent/blank (blue). Retention times (min): impurity L (12.801); impurity M (16.819); impurity E (18.764); impurity F (22.993); impurity J (24.662); impurity I (25.646); impurity N (36.496) and AZM (47.879).
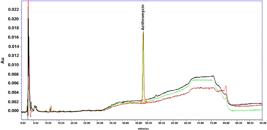
Chromatogram of standards S1 and S2 (recovery) of AZM and diluent/blank. Analysis standard/P1 (red); recovery standard/P2 (green); diluent/blank (black). Retention times (min): S1 (48.206) and S2 rec. (48.763).
The chromatograms demonstrate that the resolutions between the peaks of each of the impurities studied, as well as the azithromycin standard, were achieved.
In Figure 8, it can be seen that the recovery criterion was reached for injections of standard 1 and standard 2. Figure 9 demonstrates that the system suitability parameter was reached.
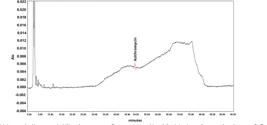
Sensitivity standard/system suitability chromatogram. Recovery was achieved for injections of pattern 1 and pattern 2. Retention time 48.477 min.
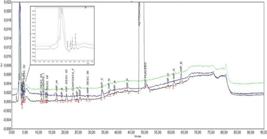
Chromatogram of placebo A, product A and diluent/blank. Sample (black); placebo (blue); diluent/blank (green). Retention times (min): impurity L (12.850); impurity M (16.878); impurity E (18.861); impurity F (23.035); impurity J (24.609); impurity I (25.667); impurity N (36.611) and AZM (48.041).
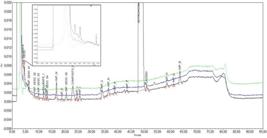
Chromatogram of placebo B, product B1 and diluent/blank. Sample (black); placebo (blue); diluent/blank (green). Retention times (min): impurity L (12.739); impurity M (16.716); impurity E (18.773); impurity F (22.920); impurity J (24.502); impurity I (25.550); impurity N (36.441) and AZM (47.883).

Chromatogram of placebo B, product B2 and diluent/blank. Sample (black); placebo (blue); diluent/blank (red). Retention times (min): impurity L (12.780); impurity M (16.747); impurity E (18.713); impurity F (22.929); impurity J (24.577); impurity I (25.561); impurity N (36.481) and AZM (47.925).
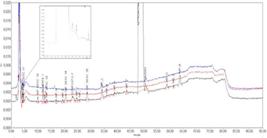
Chromatogram of placebo C, product C and diluent/blank. Sample (black); placebo (blue); diluent/blank (red). Retention times (min): impurity L (12.692); impurity M (16.953); impurity E (19.418); impurity F (23.069); impurity J (24.673); impurity I (25.797); impurity N (36.066) and AZM (48.018).
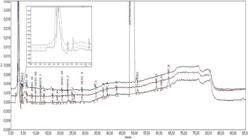
Chromatogram of placebo D, product D and diluent/blank. Sample (black); placebo (blue); diluent/blank (red). Retention times (min): impurity L (13.394); impurity M (16.920); impurity E (19.548); impurity F (23.058); impurity J (24.793); impurity I (25.551); impurity N (37.408) and AZM (48.197).
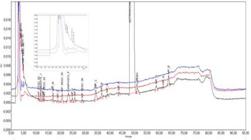
Chromatogram of placebo E, product E and diluent/blank. Sample (black); placebo (blue); diluent/blank (red). Retention times (min): impurity L (12.823); impurity M (16.862); impurity E (18.796); impurity F (23.093); impurity J (24.697); impurity I (25.698); impurity N (36.577) and AZM (48.051).
It was observed that all samples from the evaluated batches showed peaks corresponding to known impurities (L, M and E) and AZM-related compound (F, I, J and N). All results found were in accordance with the specified pharmacopeial limits.11,12 For all elutions, peak formation for the diluent was also observed at retention times of approximately 4 11 min. Peaks for unknown impurities was observed, which were numbered in chronological order. For the evaluated batches of products A and E, seven unknown impurities were identified in approximate retention times in both products. For the other products, six unknown impurities were identified, with the last impurity eluted in the retention time of approximately 28 min occurring only in products C and D and the unknown impurity eluted in the retention time of approximately 13 min not occurring in product D. For the six batches of products monitored in this study: A, B1, B2, C, D and E, coming from five registration holders and four different API manufacturers, the results found for the AZM related substances (impurities) were satisfactory, which means, they complied with the current specification. Based on this sampling, we can infer that the azithromycin 500 mg coated tablet available on the Brazilian market are safe, effective and have their quality assured.
Conclusions
After conducting the experiment planning, for the successful separation of the compounds in sample, the best optimized conditions consisted of: column oven temperature at 55 °C , mobile phase flow at 0.9 mL min-1 and wavelength at 210 nm.
The planning 32 factorial design with triplicate in central point used acted as an integral part of a systematic optimization strategy to research and identify favorable conditions for a separation. Furthermore, it can be used advantageously as a pedagogical tool to examine the effect of a variety of parameters on separation.
Finally, it is worth highlighting that Brazilian legislation improved over the last two decades through successive updates of the resolutions of the collegiate board (RDC) of ANVISA, established that an analytical method must necessarily be indicative of stability, that is, capable of identifying and quantify the drug in the presence of its degradation products in the pharmaceutical form submitted for analysis. Therefore, a properly established experiment plan could contribute assertively to achieving this objective.
Supplementary Information
Supplementary information is available free of charge at http://jbcs.sbq.org.br as PDF file.
Data Availability Statement
All data are available in the text.
Acknowledgments
The authors acknowledge UFJF; CNPq and CAPES (Brazilian research fundies agencies) and FAPEMIG (Minas Gerais Research Foundation). We are also grateful to CENTRALBIO/UFJF for the technical support. We acknowledge Dr Mateus José Fernandes Martins for the improvement of the images of the manuscript.
References
-
1 Saita, M. G.; Aleo, D.; Melilli, B.; Mangiafico, S.; Cro, M.; Sanfilippo, C.; Patti, A.; J. Pharm. Biomed. Anal. 2018, 158, 47. [Crossref]
» Crossref -
2 Bartra, M. S.; García, R. L.; Wong, M. V.; Jáuregui, A. M. M.; Acevedo, M. B.; Ceccarelli, J. G.; Laos, F. S.; Ayala, P.; Pineda Pérez, M.; Yarasca, A. T. A.; Rev. Cuba. Med. Mil. 2021, 50, e02101284. [Crossref]
» Crossref -
3 Kwiecien, A.; Krzek, J.; Walczak, M.; J. AOAC Int. 2012, 95, 1418. [Crossref]
» Crossref -
4 Nageswara Rao, R.; Nagaraju, V.; J. Pharm. Biomed. Anal. 2003, 33, 335. [Crossref]
» Crossref -
5 Guidance for Industry; Andas: Impurites in Drug Products; https://www.fda.gov/regulatory-information/search-fda-guidance-documents/andas-impurities-drug-products, accessed in June 2025.
» https://www.fda.gov/regulatory-information/search-fda-guidance-documents/andas-impurities-drug-products -
6 European Medicines Agency (EMA); Guideline on setting specifications for related impurities in Antibiotics;https://www.ema.europa.eu/en/documents/scientific-guideline/adopted-guideline-setting-specifications-related-impurities-antibiotics_en.pdf, accessed in June 2025.
» https://www.ema.europa.eu/en/documents/scientific-guideline/adopted-guideline-setting-specifications-related-impurities-antibiotics_en.pdf -
7 Guo, N.; Hen Q.; Jin, Y.; Hou, Z.; Pan, Y.; Liu, J.; Sun, C.; J. Pharm. Biomed. Anal. 2021, 195, 113853. [Crossref]
» Crossref -
8 Jin, Y.; Xy, Y.; Zhou, Z.; Wang, J.; Rapid Commun. Mass Spectrom. 2020, 34, e8772. [Crossref]
» Crossref -
9 Agência Nacional de Vigilância Sanitária (ANVISA); Resolução No. 166. de 24 de julho de 2017, Dispõe sobre a Validação de Métodos Analíticos e dá outras Providências; Diário Oficial da União (DOU), Brasília, 2017. [Link] accessed in June 2025
» Link -
10 Pesachovich, M.; Isaacs, S.; Singer, C.; Schwartz, E.; Berger, E.; EP1606299A1, 2021 [Crossref]
» Crossref - 11 The United States Pharmacopoeia (USP); USP 37-NF 2014, 32, 1895.
- 12 The United States Pharmacopoeia (USP); USP 43-NF 2014, 38, 457.
-
13 Mcguffin, V. L.; Tavares, M. F. M.; Anal. Chem. 2017, 69, 152. [Crossref]
» Crossref - 14 Skoog, D. A.; West, D. M.; W.; Holler, F. J.; Crouch, S. R.; Fundamentos de Química Analítica, 8th ed.; Cengage Learning: USA, 2011.
-
15 European Medicines Agency (EMA); ICH Q2(R2): Validation of Analytical Procedures; https://www.ema.europa.eu/en/ich-q2r2-validation-analytical-procedures-scientific-guideline, accessed in June 2025.
» https://www.ema.europa.eu/en/ich-q2r2-validation-analytical-procedures-scientific-guideline -
16 Saha, P.; Pandey, M. M.; J. Chromatogr. Sci. 2021, 60, 35. [Crossref]
» Crossref -
17 Agência Nacional de Vigilância Sanitária (ANVISA); Resolução No. 658. de 30 de março de 2022, Dispõe sobre as Diretrizes Gerais de Boas Práticas de Fabricação de Medicamentos e Dá Outras Providências; Diário Oficial da União (DOU), Brasília, No. 62, de 31/03/2022, p. 320. [Link] accessed in June 2025
» Link -
18 Agência Nacional de Vigilância Sanitária (ANVISA); Resolução da Diretoria Colegiada (RDC) No. 53. de 04 de dezembro de 2015, Estabelece Parâmetros para a Notificação, Identificação e Qualificação de Produtos de Degradação em Medicamentos com Substâncias Ativas Sintéticas e Semissintéticas; Diário Oficial da União (DOU), Brasília, 2015. [Link] accessed in June 2025
» Link -
19 Agência Nacional de Vigilância Sanitária (ANVISA); Resolução da Diretoria Colegiada (RDC) No. 171. de 22 de agosto de 2017, Revisa a Aplicabilidade da RDC No. 53, de 4 de dezembro de 2015; Diário Oficial da União (DOU), Brasília, 2017. [Link] accessed in June 2025
» Link -
20 Farmacopeia Brasileira 2019; 6ª ed.; Brasília, 2019. [Link] accessed in June 2025
» Link -
21 Agência Nacional de Vigilância Sanitária (ANVISA); Publicado Guia para Tratamento Estatístico de Validação Analítica; https://www.gov.br/anvisa/pt-br/assuntos/noticias-anvisa/2017/publicado-guia-para-tratamento-estatistico-de-validacao-analitica, accessed in June 2025.
» https://www.gov.br/anvisa/pt-br/assuntos/noticias-anvisa/2017/publicado-guia-para-tratamento-estatistico-de-validacao-analitica -
22 Agência Nacional de Vigilância Sanitária (ANVISA); Resolução No. 58. de 20 de dezembro de 2013, Estabelece Parâmetros para a Notificação, Identificação e Qualificação de Produtos de Degradação em Medicamentos com Substâncias Ativas Sintéticas e Semissintéticas, Classificados como Novos, Genéricos e Similares e dá Outras Providências; Diário Oficial da União (DOU), Brasília, 2013. [Link] accessed in June 2025
» Link -
23 International Council for Harmonisation of Technical Requirements for Pharmaceuticals for Human Use (ICH); Harmonization for Better Health; https://www.ich.org/, accessed in June 2025.
» https://www.ich.org/ -
24 International Council for Harmonisation of Technical Requirements for Pharmaceuticals for Human Use (ICH); Impurites in New Drug Products - Q3B (R2); https://database.ich.org/sites/default/files/Q3B%28R2%29%20Guideline.pdf, accessed in June 2025.
» https://database.ich.org/sites/default/files/Q3B%28R2%29%20Guideline.pdf -
25 Miguel, L.; Barbas, C. L. C.; J. Pharm. Biomed. Anal. 2003, 33, 211. [Crossref]
» Crossref
-
Editor handled this article:
César Ricardo Teixeira Tarley (Associate)