Plasma Levels of Organochlorine Pesticides in Historically Exposed Vector Control Workers from Rio de Janeiro, Brazil
Abstract
In Brazil, organochlorines pesticides (OCP) were used to combat vectors until the 2000s, and their residues are still present in environmental and biological matrices. Therefore, it is essential to assess the historical exposure of vector control workers (VCW). This article has two main objectives, to describe the validation of analytical methodology, and to assess simultaneous quantification of 26 analytes, between OCP and related transformation products, in blood plasma for VCW exposure levels. The occupational exposure of 127 VCW from Rio de Janeiro State, Brazil, to 26 analytes in blood plasma samples was evaluated using solid-phase extraction (SPE) for sample preparation and gas chromatography coupled to mass spectrometry (GC-MS/MS). The method performance met acceptance criteria according to Brazilian guideline showing linearity with correlation coefficients (R) between 0.936 and 0.994 in 0.2 to 15 ng mL-1 range; recovery between 93 to 105%; limit of detection (LOD) of 0.015 to 0.468 ng mL-1, and limit of quantification (LOQ) of 0.045 to 1.419 ng mL-1; precision with coefficients of variation < 20%. VCW samples presented 52% dichlorodiphenyltrichloro-ethane (DDT) isomers and related transformation products (0.15 to 8.22 ng mL-1), and 12% contained beta-hexachlorocyclohexane (HCH) residues (0.09 to 0.28 ng mL-1). It was possible to demonstrate high prevalence of VCW with residues, even after the cessation of exposure years ago.
Keywords:
vector control workers; occupational exposure; organochlorines pesticides; persistent organic pollutant; occupational health; public health
Introduction
Since the 1950s, organochlorines pesticides (OCP), especially dichlorodiphenyltrichloro-ethane (DDT), hexachlorocyclohexane (HCH), and hexachlorobenzene (HCB), have been the most widely used insecticides in agriculture and in public health campaigns to combat urban vectors.1,2 In 1972, at the Stockholm Conference, OCP were classified as persistent organic pollutants (POPs), and their production and use were gradually banned, being replaced by other classes of pesticides.3 However, the Stockholm Convention was only signed in 2001, coming into force in 2004. In Brazil, OCP were only definitively banned in 2009.4
Because they lack selective toxicity to insects, OCP can contaminate other species, including humans, due to their liposolubility, environmental stability, and bioaccumulation capacity.5 Therefore, given their widespread use, the entire population was exposed environmentally, and agricultural and vector control workers (VCW) were exposed occupationally as well.6,7 OCP cause harmful health effects, such as neurotoxicity, carcinogenicity and endocrine disruption, and despite being prohibited, they are still considered a public health problem in Brazil.5
VCW are civil servants who perform fundamental functions for Brazilian public health, such as controlling endemic diseases by combating urban vectors (including rats, mosquitoes, and other vectors that transmit diseases like dengue, Zika, and Chikungunya fever). They are linked to the Ministry of Health and municipalities in positions currently referred to as “Agents to Combat Endemic Diseases (ACE)” and were occupationally exposed to OCP between the 1980s and 2000s.6 Toxicological evaluation and quantification of persistent OCP concentrations in the bodies of these workers are necessary. For this purpose, samples from 127 VCW were analyzed, from Rio de Janeiro state, Brazil.
Analytical methodologies used for the detection and quantification of organochlorine pesticides in human blood and serum have evolved significantly in recent decades, incorporating increasingly efficient sample preparation techniques and highly sensitive chromatographic systems. The most commonly used procedures include liquid-liquid extraction, solid-phase extraction (SPE), and solid-phase microextraction (SPME), predominantly followed by gas chromatography coupled to selective detectors, such as electron capture detectors (GC-ECD), or mass spectrometry (GC-MS/MS). International studies have consolidated robust and widely used approaches in human biomonitoring, demonstrating the consistent application of these techniques in complex biological matrices.8-16
Given the ongoing need for analytical techniques to monitor exposure to these compounds, this work aimed to quantify 26 analytes, between OCP and related transformation products in blood plasma through a validated method for multi-residue analysis by solid-phase extraction (SPE) for pretreatment and gas chromatography-coupled to mass spectrometry (GC-MS/MS) for identification and quantification. This method has already been used to perform organochlorine analyses in the Rio Birth Cohort Pilot Study of Environmental Exposure and Childhood Development (PIPA Study) and The Pró-Saúde Study,17,18 but the details of its optimization and validation within the normative criteria were never published.
Experimental
Study design and sample collection
This is a cross-sectional study composed of VCW from the state of Rio de Janeiro, gathered through the “Multicenter integrative project: Study of the health impact of agents fighting endemic diseases/endemic guards due to exposure to pesticides in the state of Rio de Janeiro,” developed by the Center for Studies on Workers’ Health and Human Ecology linked to the Sergio Arouca National School of Public Health of the Oswaldo Cruz Foundation (Cesteh/Ensp/Fiocruz) and the José Alencar Gomes da Silva National Cancer Institute (Inca) in partnership with other institutions and universities. The project was approved by the Research Ethics Committee on March 29, 2019 (CAAE No. 03323018.4.0000.5240).
The sample for this study was non-probabilistic, selected by convenience, and composed of workers who spontaneously agreed to participate in the data collection activities. The eligible population for the study consisted of VCW from the state of Rio de Janeiro, over 18 years of age, of both sexes and with different types of employment, including tenured civil servants, employees under a regular labor and social security contract, and temporary contract workers. For this study, blood samples were collected and questionnaires were auto-filled by 127 VCW.
The online questionnaire used in this study was developed remotely through a participatory approach in 2020 - in the context of the coronavirus (COVID-19) pandemic - with the direct contribution of disease control agents within the Expanded Research Community (ERC).19 The instrument was made available via Google Forms and included Free and Informed Consent Form (FICF) and 107 questions distributed across six areas: sociodemographic profile, work characteristics, health and COVID-19, occupational and environmental exposure to chemical substances, mental health (SRQ-20), and sleep quality.20 This questionnaire was auto-filled by VCW between August 2020 and August 2022.
Before blood collection, all participants were informed of the research terms and, after freely agreeing, signed the FICF. The collection took place between October 2021 and July 2022 at Cesteh/Ensp/Fiocruz ambulatory. Blood samples were collected in 4 mL vacuum tubes containing the anticoagulant ethylenedinitrilotetraacetic acid (EDTA, Vacuplast® brand) and were subsequently centrifuged to obtain plasma.
The blood tubes were centrifuged at approximately 1,600 g (3,500 rpm) for 10 min at room temperature. Then, the resulting plasmas were separated and stored individually in glass tubes at -70 °C (ultra-freezer) until analysis. The evaluation of the OCP was conducted at the Toxicology Laboratory of the same institution, in a 3-month period between collection until analysis.
Reagents
The solvents used were ultrapure water, methanol, formic acid, petroleum ether, acetone, isooctane, and n-hexane. All reagents were pesticides residue grade (Merck®). Anhydrous sodium sulfate (JT Baker) was previously dried in an oven at 70 °C for 12 h. The internal standard (IS) used was 4.4-dibromobiphenyl (Merck) at a concentration of 1 µg mL-1 with a purity level of 98%. Cartridges were from Applied Separations, C18 cartridges, 500 mg, 6 mL volume and Florisil cartridges, 1000 mg, 6 mL volume.
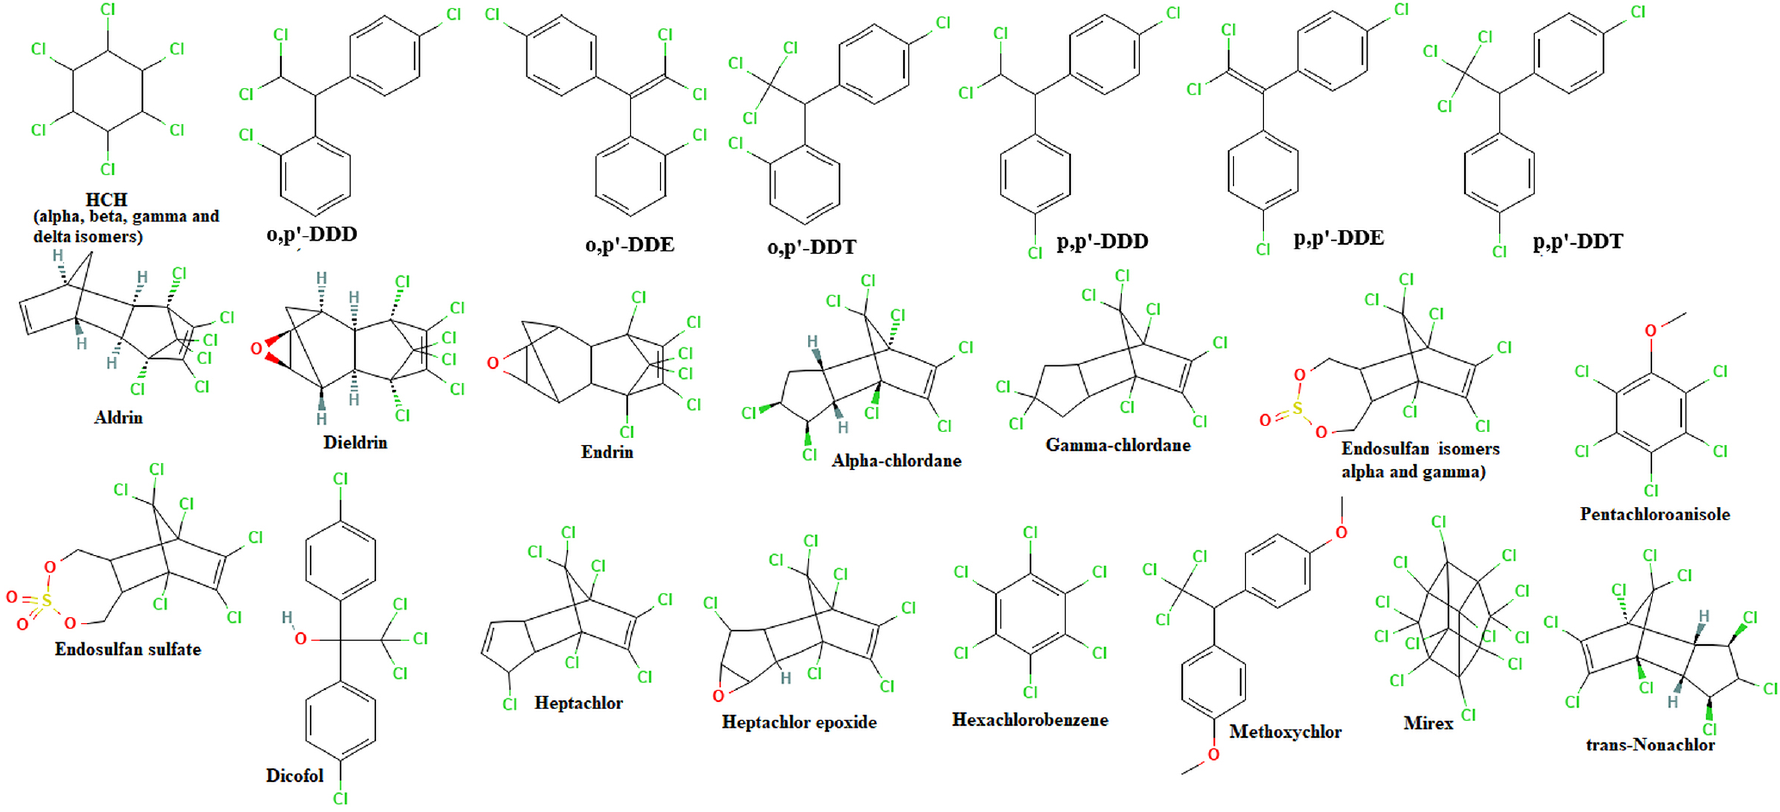
The organochlorine standards alpha-endosulfan, beta-endosulfan, endosulfan sulfate, p,p’-dichloro--diphenyl-dichloroethylene (DDE), p,p’-dichloro-diphenyldichloroethane (DDD), p,p’-DDT, o,p’-DDE, o,p’-DDD, o,p’-DDT, alpha-HCH, beta-HCH, delta-HCH, dicofol, endrin, mirex, aldrin, dieldrin, and hexachlorobenzene were purchased from Dr. Ehrenstorfer. The standards of alpha-chlordane, gamma-chlordane, heptachlor epoxide, methoxychlor, gamma-HCH, trans-nonachlor, pentachloroanisole, and heptachlor were purchased from Accustandard. All standards (26) were > 99% pure (Figure 1).
Sample preparation
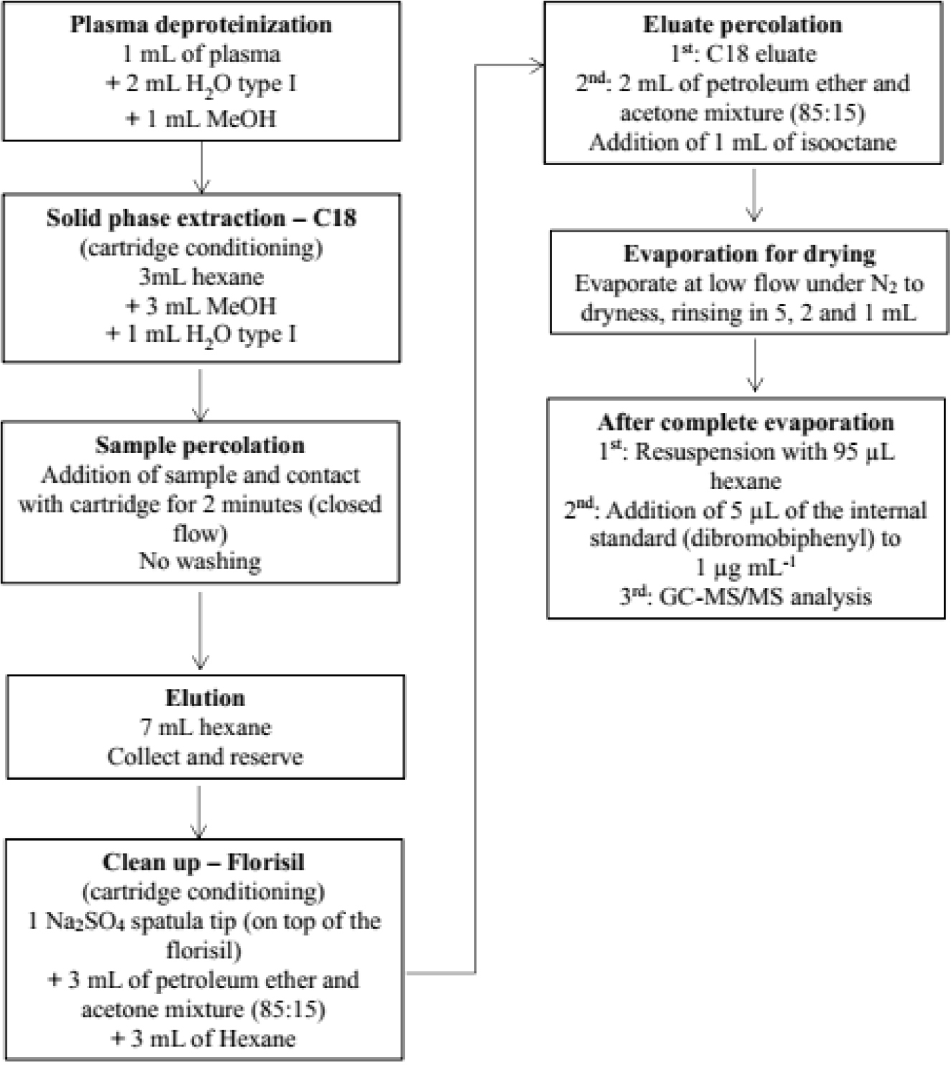
For protein removal, two protein precipitation procedures were tested, with formic acid and methanol. The treatment with methanol was chosen due to its availability and lower cost, in addition to having promoted protein precipitation efficiently (Figure 2).
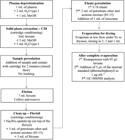
Sample preparation scheme for the quantification of OCP and related transformation products in plasma samples. SPE: solid-phase extraction; C18: octadecylsilane; MeOH-methanol; N2: nitrogen; GC-MS/MS: gas chromatography tandem mass spectrometry.
For the deproteinization step, 2 mL of ultrapure water and 1 mL of methanol were added to 1 mL of plasma, followed by 30 s of agitation by vortex. A SPE manifold was used with the addition of 3 mL of each solvent (in order): hexane, methanol, and ultrapure water, to precondition C18 cartridges. The samples were added to cartridges and remained in contact with the solid phase for 2 min before proceeding the extraction. The samples were passed through the cartridges without the use of vacuum. The cartridges were washed with 5 mL of ultrapure water and dried for 40 min under a vacuum of -20 in Hg. The cartridges were eluted with 7 mL of hexane collected in 10 mL tubes.
We performed cleanup procedure in florisil SPE cartridges preconditioned with 3 mL of petroleum ether:hexane (85:15 v/v) and 3 mL of hexane. Approximately 500 mg of anhydrous sodium sulfate, previously dried in an oven for 12 h at 70 °C, were added to the top of florisil cartridge to remove any remaining moisture. The eluate (from previous step) was then added to florisil cartridges, collecting the new eluate in a 15 mL tube. 2 mL of petroleum ether:hexane mixture (85:15 v/v) were added, with final volume collected being approximately 9 mL, containing pesticide residues. 1 mL of isooctane was added to avoid loss of analytes in evaporation step. The extract was brought to dryness under an atmosphere of N2 at 20 ºC, flow rate at 1.5 L min-1 in an automated evaporator (Auto EVA 20 plus, Raykol Instrument, USA), rinsing the walls of the tube with n-hexane in 5, 1, and 0.5 mL aliquots, to remove any OCP residue from tube, and then resuspended with 95 µL of n-hexane and 5 µL of the internal standard (IS), 4.4-dibromobiphenyl, at 1 µg mL-1, prior to analysis, resulting in a 50 ng mL-1 final concentration in vial. This IS addition was to check only chromatographic analysis.
Chromatography and mass spectrometry conditions
A gas chromatography equipment (model Trace 1310) coupled to a triple quadrupole mass spectrometer (model TSQ EVO 8000) performed the analyses and the column used was model TG-5SILMS (length: 30 m; internal diameter: 0.25 mm; film thickness: 0.25 µm), all from the Thermo Fisher Scientific Inc® brand, USA. The spectrometric and chromatographic conditions were optimized through the software of the equipment and manual adjustments, such as oven programming time and temperature, injector temperature, and carrier gas flow, which were determined to be the best for obtaining signals that were more abundant for all analytes simultaneously. The results were satisfactory concerning the abundance of the observed signals.
The results of the analytical method validation and analysis of real samples were evaluated using the recommendation criteria from National Institute of Metrology, Quality, and Technology (Inmetro/Brazil).21 Qualification was performed by identifying transitions selected in select reaction monitoring (SRM) in the mass spectrometer and ratio between quantifier ions (transition with the highest abundance) and two qualifier ions (transitions with lower abundances), identified by the equipment software, after defining such ions by comparing NIST® software library and some manual adjustments according to high-purity standards.8,21 Quantification was performed using the quantifier ion, applied to calibration slope.
The verification of area integration was performed one by one for all experiments and samples, then signal-to-noise ratio observed was calculated by Trace Finder (version: 3.2, Thermo Fisher Scientific Inc., United States, 2014), for acquiring and processing the results. If there were less than 100 abundance counting, the area was discarded. Although the standards recommend that signal-to-noise ratio be greater than or equal to 1:3, it was observed during area integration process that, for the algorithm used by the equipment software, a ratio lower than 100 abundance counting represented a very low signal of same intensity or even lower than the noise signals.
The retention time used as a qualification criterion was consistent with the time observed in a standard mixture injected on the same day of analysis. In the validation experiments and analysis of real samples, variations of up to 0.1 min in retention time were also observed throughout the same injection sequence.
The internal standard, 4,4’-dibromobiphenyl, was introduced only to monitor injection precision and chromatographic performance. It was not used for analyte quantification or response normalization. In accordance with guidelines from the European Commission Directorate (2016),22 sample acceptance was contingent upon internal standard peak area stability; deviations exceeding ± 30% necessitated reinjection or reanalysis, but in any sample batch it was necessary.
The optimized gas chromatograph conditions comprised ultrapure helium flow (column carrier gas) at 1 mL min 1; constant pressure carrier mode and splitless injection; splitless time of 1 min; purge flow of 30 mL min-1 and time to purge of 0 min; injector temperature of 280 °C; injected volume of 2 µL; oven temperature gradient starting at 50 °C for 2 min, increasing by 10 °C per min to 180 °C, then increasing by 3 °C min-1 to 230 °C, increasing by 5 ºC min-1 to 280 °C, increasing by 15 °C min-1 to 310 °C, holding for 7 min; total run time of 50.68 min; and detector temperature of 300 °C.
The spectrometric conditions were defined according to the NIST® libraries available in Tracefinder® software, and some confirmations were required using AutoSRM. Thus, the transitions defined based on their fine specificity combined with good abundance are listed in Supplementary Information (SI) section (Table S1), showing selective reaction monitoring transitions of the 26 quantified analytes of OCP.
Method validation
The tests for validation parameters included selectivity, linearity, sensitivity, limits of detection (LOD), limits of quantification (LOQ), recovery, repeatability, and intermediate precision tests. Reproducibility parameters and interlaboratory comparisons could not be performed due to the difficulty in establishing cooperation with a laboratory that had similar equipment and a validated method or the availability of proficiency tests during the period of execution of this work.21
The calculation of organochlorine concentrations was performed through external standardization using a linear regression equation and the application of angular and linear coefficients for each analyte, calculated from a calibration curve of fortified plasma at concentrations of 0.2, 0.5, 1, 2, 5, 7, 12, and 15 ng mL-1. Internal standard was used for checking chromatographic and spectrometric performance, not for quantifying analytes.
To demonstrate method selectivity, fortifications were performed at concentrations of 0.5 and 1 ng mL-1 in two pools composed of 10 different plasmas, with no apparent presence of hemolysis or lipemic aspect, as well as an analysis in ultrapure water, at the same concentrations, analyzed in the same plasma conditions. Fortifications were performed before and after the analytical method, to determine analytes recovery percentage in the method.
The presence of interferents mainly alters the ratio of product ions in two transitions selected for each analyte. To control this relationship, the ratio was observed through injections of standards and fortified samples, establishing accepting or rejecting criteria for the ion found area. Using the Tracefinder® software, SRM transitions were defined in standards pure solutions prepared in solvent and confirmed in samples prepared from plasma fortified with OCP standards.
To evaluate matrix effect, the results obtained in selectivity experiment (fortification results after method procedure) were compared with concentrations results from calibration curves equivalent to fortification in water to verify if matrix effect was observed on analyte precision across evaluated concentration levels, applying F-test, according to Inmetro guidelines, and comparing variances of the two regression models (Tables S2 and S4, SI section). For the number of replicates, F tabulated was compared with calculated and compared for each analyte. For carry over assessment, solvent injections were performed every 10 samples and the remaining areas were observed for memory effect and cleanness of chromatographic system.
For calibration curve range, three replicates of the same plasma were performed for each curve concentration level of the entire preparation. According to Inmetro’s guidelines,21 the number of replicates in validation procedures must be close with laboratory routine. Due to high costs of SPE cartridges, only one analysis is performed for each real sample. The construction of calibration curve was performed using linear regression, and outlier values were disregarded by applying Grubbs test.21
The highest intensity transition was considered for pesticides quantification. The homoscedasticity of calibration curve was also tested using Cochran test.21 In Table S3 (SI section), p,p’-DDE, p,p’-DDT, delta HCH and gamma-HCH were mentioned as examples for homoscedasticity evaluation, as they were the only detected OCP in real samples. Linear model was applied to all analytes, for quantification, only the slope was used. The intercept was forced to zero. All residues quantification were performed using external standardization with calibration curve. Linearity was evaluated through the ordinary least squares method, and the intercept was evaluated using Student’s t-test. Since the intercept was not significantly different from zero (p > 0.05), linear model was forced through the origin. This procedure was adopted to prevent mathematically biased results, such as negative concentrations - a physical impossibility that occurs in linear regressions models. Forcing the curve through the origin ensures higher accuracy and consistency, particularly for residues near the LOQ, where instrumental signal and concentration must maintain a direct physical correlation.
When data showed heterocedasticity, weighted least squares method was used for adjusting the model, through 1/x2 weight, Table S2 (SI section).
The LOD and LOQ were calculated by seven replicates standard deviation at lowest concentration level of analytical curve (0.2 ng mL-1) multiplied by 3.3 and 10, respectively, divided by angular coefficient of the same analytical curve.21
Recovery was assessed by fortifying three replicates at three concentration levels of calibration curve: low (0.5 ng mL-1), intermediate (5 ng mL-1), and high (15 ng mL-1). The first fortification was performed before executing analytical method, corresponding to the obtained concentration. The second fortification was performed after executing analytical method, corresponding to 100% recovery. The standard deviation and variation coefficient were calculated for each concentration level. The criterion used to determine method acceptance was the average recovery of all concentration levels, which should be within the range of 40 to 120%, according to Inmetro/Brazil.21 The recovery percentage values were compared, and a Student’s t-test was applied to compare the means.21
Repeatability was assessed by the same analyst, analyzing 2 ng mL-1 concentration of the calibration curve in tests performed in duplicate on the same day (intraday), with the evaluation of the coefficient of variation between replicates, as well as comparing the same tests performed by the same analyst on 2 consecutive days (interday). The acceptance criteria were coefficient of variation (CV) bellow or equal 20%, according to Inmetro guidelines,21 which were observed for all analytes as demonstrated in Table S2. The reproducibility and robustness were not fully evaluated, nor were interlaboratory comparisons conducted.
Quantification and quality control of analyses
Blood samples supplied by 10 volunteers were used to produce a 100 mL pool, which was then used to produce plasma. After fortification with OCP standard mix, plasma was frozen and kept in a freezer (-20 °C) until the performance of validation experiments.
The internal standard was added to all samples and controls to evaluate injection and chromatographic conditions of sample batch. The area was monitored over time, as well as that of all analytes in a mixture of standards at a concentration of 1 µg mL-1. In the same way as in validation procedures, solvent injections performed every 10 samples for cleanness assessment.
Analytical quality controls were performed on each batch of VCW samples using fortified plasmas at 1 ng mL-1 concentration level and a blank. The results were controlled by monitoring abundance values in fortified plasma with all standards. If variation exceeded 15%, the samples batch was reprocessed. This control was performed to ensure that the results for a given day are within this established limit.
The angular coefficient of calibration curve in plasma was used to quantify the samples.
Statistical analysis of results
All sample evaluation procedures, concentration calculations, and statistical analyses used to verify validation parameters (F-test, Cochran test, t-test, Grubbs test) were performed using Microsoft Excel software, version 2010 (Microsoft Corporation, WA/USA).
External standardization using calibration curve fortified in plasma calculated OCP concentrations. The expression applied to calculate concentration was linear regression equation.
The descriptive frequencies of central tendency measures and continuous variables dispersion related to the concentration levels (mean, standard deviation, and distribution percentiles) were calculated in sample characterization using SPSS® Statistics software, version 20, (IBM Corporation, Released 2011. Armonk, NY/USA: IBM Corp).
Results and Discussion
Method performance
The accepted retention time variation was 0.1 min. There was a check on total ion chromatogram and full scan mass spectra. The F-test compared abundances, and there was no matrix influence on recovery, nor was there any non-intensity of ions.21 There was no significant difference between the variances of each analyst’s replicates (Tables S2 and S4, SI section).
The correlation coefficients (R) of calibration curves ranged from 0.936 to 0.994, indicating good linearity for all OCP, also determination coefficients (R2) varied from 0.876 to 0.989, showing that model was adequate to explain data variability.
The LOD and LOQ were calculated from standard deviations at the lowest concentration level of analytical curve, as described in methods, and were within the range of 0.02 to 0.47 ng mL-1 and 0.05 to 1.42 ng mL-1, respectively. The recovery ranged between 93 and 105% for all pesticides.
The validation details such as slope of the curve, LOD, LOQ, recovery values and repeatability and intermediate precision tests are available in Table S2, which shows method validation parameters: calibration slope, intercept, R-2, LOD, LOQ, recovery at low/mid/high levels and mean (with standard deviation (SD)/CV), repeatability (intraday CV), intermediate precision (interday CV) values, homoscedasticity and matrix effect evaluation.
The developed method in this work demonstrated excellent analytical results comparable to methods presented in other OCP quantification studies, such as Butler Walker et al.,13 Côté et al.,12 Carrizo et al.,9 Fisher et al.,11 Fang et al.8 and Shin.10 Briefly, these studies used liquid-liquid extraction (LLE) or solid-phase extraction (SPE) as the extraction method, and gas chromatography (GC) tandem electron capture detector (ECD) or mass spectrometry (MS) as the detection/quantification method. These studies showed LOD between 0.001 and 0.13 ng mL 1; LOQ between 0.002 and 0.08 ng mL-1; recoveries ranging from 68 to 95%; and coefficients of variations (CVs) ranged from 3.9 to 26.2% (Table 1).
All studies presented CV values below 20%, as was the guideline followed in this work. CV values above 20% were observed only in Côté et al.12 However, that study does not provide detailed information on method validation procedures, including precision assessment criteria and acceptance limits. Thus, the reported CV values should be interpreted in the context of differences in validation approaches and reporting standards. The present study adopts clearly defined and more stringent validation criteria, which may account for differences when compared to earlier literature.8-13
Evaluation of VCW samples from the state of Rio de Janeiro
Table 2 presents a descriptive summary of the demographic characteristics, employment conditions and work processes of the VCW included in the study. These indicators are essential for understanding the profile of this workforce and the contextual factors that shape their exposure to pesticides. The variables include age distribution, sex, race/ethnicity, region of residence, employment relationship and duration of work activities, as well as information related to handling pesticides and the occurrence of self-reported intoxication symptoms. This overview provides the basis for interpreting the subsequent analyses of exposure and health outcomes.
Socio-economic characterization, living and work process conditions of VCW, Rio de Janeiro, Brazil (n = 127)
Additionally, it was observed that 98% of the workers had been working in vector control since the 1980s, meaning they were exposed to OCP during the 1980s and 2000s, when definitive ban on OCP occurred in Brazil through Law No. 11,936/2009.4
In a self-administered questionnaire, among 115 workers, 87% reported contact with OCP until the 2000s, directly in applications during public health campaigns (77%) and/or due to inadequate storage in support points (SP) in the same room they used (49%). The SP are used as a base where VCW who work on the streets, change their clothes, eat, as well as store work materials. These SP are often located in inappropriate locations, spaces borrowed/granted by community, with inadequate engineering and sanitary infrastructure for storing pesticides, in accordance with country’s regulatory standards, increasing population and workers exposure.6
The study observed that 66 VCW (49.6%) presented only DDT residues (p,p’-DDE and p,p’- DDT) ranging from 0.15 to 8.22 ng mL-1. In addition, 12 VCW (9.4%) showed only beta-HCH residues ranging from 0.09 to 0.28 ng mL-1 and 3 (2.4%) presented residues of both. Briefly, in total, 61.4% of VCW presented OCP residues in plasma. The other pesticides also evaluated in the multi-residue method were not present in this group of workers (Table 3).
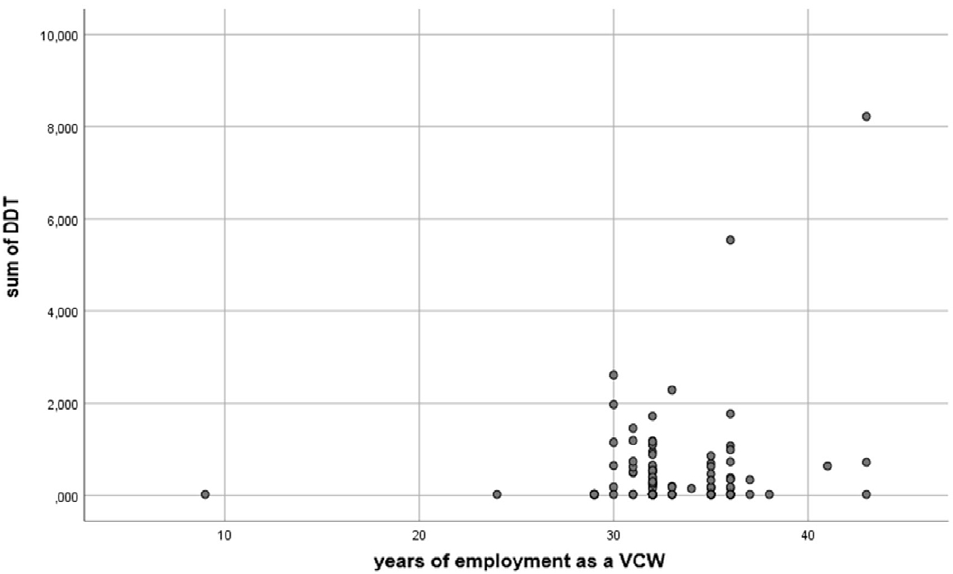
Figure 3 presents scatterplot that demonstrates workers’ employment time as VCW (x-axis) and sum of DDT isomers and related transformation products concentration in plasma (y-axis).
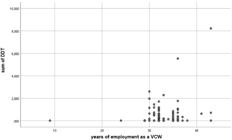
Scatterplot of the employment time of the workers as VCW (x-axis) and sum of DDT isomers and related transformation products concentration in plasma of VCW (ng mL-1) (y-axis).
It is observed that most workers are concentrated in the range between 30 and 40 years of employment. Given the OCP lipophilicity, it is expected that they will accumulate in adipose tissue and maintain a transport relationship to plasma, and that with longer occupational exposure, total DDT levels will also remain detectable.5
Table 4 compared data from other studies conducted in Brazil and other countries. The comparisons with external studies were conducted only descriptively (medians and percentage > LOD), as is the practice used in environmental and occupational biomonitoring, precluding the application of inferential statistical tests across datasets.
DDT and HCH analysis methods and concentration levels found in studies with the general population
When comparing the VCW results with data from other Brazilian populations, important differences emerge. Verly et al.,18 in a study with 471 civil servants of similar average age, reported a median DDT concentration of 0.07 ng mL-1, lower than the 0.16 ng mL-1 observed among VCW. Fróes-Asmus et al.,16 evaluating 139 pregnant women in Rio de Janeiro, reported an average concentration of 0.14 ng mL-1, also below the VCW median.
Populations living in historically contaminated regions present markedly higher levels. In the Cidade dos Meninos community, a municipality of Duque de Caxias, in Rio de Janeiro state, an OCP factory owned by Ministry of Health was abandoned in the 1960s, leaving an environmental liability of hundreds of tons of OCP. Freire et al.23 (n = 787) reported median concentrations of 11.41 ng mL-1 for DDT and 6.95 ng mL-1 for HCH, and Rosa24 (n = 716) reported a median DDT level of 0.98 ng mL-1.
Both values exceed those observed among VCW, although 17 workers (13.4%) exhibited DDT concentrations above the median reported for Cidade dos Meninos (0.98 ng mL-1). This type of exposure is comparable to those considered major exposures. It is noteworthy that 17 VCW (13.4%) had median DDT levels above median from Cidade dos Meninos. Therefore, VCW have intermediate plasma DDT levels when compared to those observed in highly exposed populations and in groups with only environmental exposure.24
In the North region of the country, a population survey conducted between 2010 and 2011 (n = 978) in Rio Branco, Acre state, revealed higher median values: 0.58 ng mL-1 for DDT and 0.16 ng mL-1 for HCH, with 68% of samples exceeding the LOD.14 This study highlights OCP accumulation in local population, which has its origins in past public health campaigns, which used DDT to combat malaria, an endemic disease in this region.
In international context, Bloom et al.25 evaluated 114 aging residents (55-74 years) from upper Hudson River communities (New York State), reporting sum of serum DDT levels with median concentrations of 3.05 ng mL-1 (2.76 ng mL-1 in women and 3.34 ng mL-1 in men). Meanwhile, a 2011 study in South Africa (n = 252) reported a median concentration of 0.85 ng mL-1 for HCH, with 100% of the samples exceeding the LOD.26 In Bolivia, in 2010, 93% of the 112 samples analyzed showed detectable levels of DDT, with a median of 1.21 ng mL-1.27
Although VCW do not have current occupational exposure to OCP, the half-life of DDT is estimated to be 4.2 to 5.6 years,5 indicating the required time for plasma levels to decrease, if the exposure was entirely interrupted. However, due to the lipophilicity of these compounds, they persist in food chain for years, allowing for ingestion through contaminated food and water. For HCH, half-life is approximately 7 years, also providing enough time for the plasma level to decrease. Thus, estimated concentrations of DDT could be in the order of 1.6 to 2.0 ng mL-1 and 0.1 ng mL-1 for HCH.28
Furthermore, it is essential to note that, although these are not high concentration levels, as this occupational exposure ceased many years ago, no concentration of these substances is safe or acceptable. Currently, International Agency for Research on Cancer (IARC) classifies isomers alpha, beta e delta-HCH as possibly carcinogenic (group 2B), DDT is classified as probably carcinogenic (group 2A) and gamma-HCH (lindane) is classified as proven carcinogenic to humans (group 1).29,30 This only reinforces the importance of these substances in the context of Public Health, especially when we discuss their carcinogenic potential.
Additionally, exposure to OCP contributes to other health problems besides cancer. These substances are known to disrupt endocrine and reproductive systems, as well as have immunotoxic, hepatotoxic, and neurotoxic effects.5,12,31-39 Previous exposure of VCW to OCP, combined with more recent exposure to multiple pesticides from other chemical classes, such as organophosphates, pyrethroids, benzoylureas, and neonicotinoids, cause cumulative harmful effects on the health of this class of workers.6,40,41
Conclusions
The method proved to be suitable for the multi-residue quantification of OCP levels in plasma, with recommended parameters within the criteria of Brazilian guideline, such as LOD and LOQ, as well as good linearity, selectivity, and high recovery rates.
It was possible to demonstrate a high percentage of VCW with OCP residues in plasma, even after many years of exposure cessation. It is essential to note that these substances possess carcinogenic, mutagenic, and endocrine-disrupting potential, in addition to other health hazards. Therefore, any level of exposure is considered unacceptable and unsafe to human health.
Furthermore, this study provides information that demonstrates the importance of monitoring OCP residue levels and their impact on population health, especially among workers, as this issue remains understudied in Brazil.
To make progress on this issue, it is essential to promote changes in the country’s disease control practices. Alternatives must be sought that do not rely exclusively on indiscriminate pesticides usage to combat vectors, but rather invest in environmental sanitation, such as improvements to sewage systems, urban drainage, and solid waste collection, to reduce disease-transmitting vectors. This is still a distant reality in many countries, which, as a result, depend heavily on pesticides in their public health campaigns, thus harming human and environmental health.
Supplementary Information
Supplementary data of the methodology validation are available free of charge at http://jbcs.sbq.org.br as PDF file.
Supplementary PDF
Acknowledgments
To the workers in the fight against endemic diseases, especially Eliza Abrantes, Luiza Dantas, José Luiz do Nascimento Cardoso and Jayme Inácio Ferreira Neto, in memoriam; to the teams of the toxicology laboratory and the outpatient clinic of the Center for Studies on Workers’ Health and Human Ecology (Cesteh); to Health Surveillance Department/Department of Health; Fapergs-INOVA-Fiocruz/Rede Saúde-RS Notice; Carlos Chagas Filho Foundation for Research Support in the State of Rio de Janeiro and Oswaldo Cruz Foundation (FIOCRUZ).
Data Availability Statement
All data is available in the article and SI section.
References
- 1 Bull, D.; Hathaway, D.; Pragas e Venenos: Agrotóxicos no Brasil e no Terceiro Mundo; Vozes/OXFAM/FASE: Petrópolis, Brazil, 1986.
- 2 Peres, F.; Moreira, J. C.; É Veneno ou é Remédio? Agrotóxicos, Saúde e Ambiente; Editora Fiocruz: Rio de Janeiro, Brazil, 2003.
- 3 Valle, D.; Pimenta, D. N.; da Cunha, R. V.; Dengue: Teorias e Práticas; Editora Fiocruz: Rio de Janeiro, Brazil, 2015.
-
4 Lei No. 11.936, de 14 de maio de 2009, Proíbe a Fabricação, a Importação, a Exportação, a Manutenção em Estoque, a Comercialização e o Uso de Diclorodifeniltricloretano (DDT) e dá outras Providências; Diário Oficial da União, Brasília, Brazil, 2009. [Link] accessed in March 2026
» Link -
5 Agency for Toxic Substances and Disease Registry (ATSDR); Toxicological Profile for DDT, DDE, and DDD; ATSDR: Atlanta, USA, 2022. [Link] accessed in March 2026
» Link - 6 Larentis, A.; Carvalho, L.; Gonçalves, E.; Figueiredo, V. O.; Santos, M. V. C.; Vidal, P. J. S. R.; Silveira, G. R.; Silva, A. P. N.; Dantas, L. F.; In Saber Operário, Construção de Conhecimento e a Luta dos Trabalhadores pela Saúde; Pina, J. A.; da Costa, A. B., eds.; Hucitec: São Paulo, Brazil, 2021.
-
7 Associação Brasileira de Saúde Coletiva (Abrasco), Escola Nacional de Saúde Pública Sérgio Arouca (ENSP); Dossiê Danos dos Agrotóxicos na Saúde Reprodutiva: Conhecer e Agir em Defesa da Vida; Rio de Janeiro, 2024. [Link] accessed in March 2026
» Link -
8 Fang, J.; Wu, Q.; Zhao, Y.; Zhao, H.; Xu, S.; Cai, Z.; J. Chromatog. B 2017, 1040, 180. [Crossref]
» Crossref -
9 Carrizo, D.; Grimalt, J. O.; Ribas-Fito, N.; Sunyer, J.; Torrent, M.; Environ. Sci. Technol. 2006, 40, 1420. [Crossref]
» Crossref -
10 Shin, H.-S.; Biomed. Chromatogr 2022, 36, e5360. [Crossref]
» Crossref -
11 Fisher, M.; Arbuckle, T. E.; Liang, C. L.; LeBlanc, A.; Gaudreau, E.; Foster, W. G.; Haines, D.; Davis, K.; Fraser, W. D.; Environ. Health 2016, 15, 59. [Crossref]
» Crossref -
12 Côté, S.; Ayotte, P.; Dodin, S.; Blanchet, C.; Mulvad, G.; Petersen, H. S.; Gingras, S.; Dewailly, É.; Environ. Health 2006, 5, 33. [Crossref]
» Crossref -
13 Butler Walker, J.; Seddon, L.; McMullen, E.; Houseman, J.; Tofflemire, K.; Corriveau, A.; Weber, J.-P.; Mills, C.; Smith, S.; Van Oostdam, J.; Sci. Total Environ. 2003, 302, 27. [Crossref]
» Crossref -
14 Freire, C.; Koifman, R. J.; Koifman, S.; Sci. Total Environ 2017, 598, 722. [Crossref]
» Crossref -
15 Centers for Disease Control and Prevention; Fourth National Report on Human Exposure to Environmental Chemicals - Updated Tables; CDC: Atlanta, USA, 2019. [Link] accessed in March 2026
» Link -
16 Fróes-Asmus, C. I. R.; Meyer, A.; Cunha, A. J. L. A.; Damasceno, N.; Gomes, L. E.; Luiz, R. R.; Rosa, A. C. S.; do Couto Jacob, S.; Barbosa, A. P.; Fernandes, T. V. R. B.; Medronho, R.; de Magalhães Câmara, V.; Expos. Health 2021, 13, 431. [Crossref]
» Crossref -
17 Santos, A. S. E.; Moreira, J. C.; Rosa, A. C. S.; Câmara, V. M.; Azeredo, A.; Asmus, C. I. R. F.; Meyer, A.; Int. J. Environ. Res. Public Health 2022, 20, 778. [Crossref]
» Crossref -
18 Verly Jr., E.; Meyer, A.; Sichieri, R.; Rosa, A. C. S.; Faerstein, E.; J. Health Pollut 2024, 12, 017003. [Crossref]
» Crossref - 19 Oddone, I.; Marri, G.; Gloria, S.; Briante, G.; Chiattella, M.; Re, A.; Ambiente de Trabalho: a Luta dos Trabalhadores pela Saúde; Hucitec Editora: São Paulo, 1986.
-
20 Vidal, P. J. S. R.; Larentis, A. L.; Gomes, L.; Silva, A. P. N.; Marçal, D. M.; Santos, M. V. C. D.; Rev. Contexto Saúde 2025, 25, 50. [Crossref]
» Crossref -
21 Instituto Nacional de Metrologia, Qualidade e Tecnologia (Inmetro); Orientação sobre Validação de Métodos Analíticos: Documento de Caráter Orientativo DOQ-CGCRE-008 Rev. 09; Inmetro: Brasília, Brazil, 2020. [Link] accessed in March 2026
» Link - 22 European Commission, Directorate-General for Health and Food Safety; Guidance Document on Analytical Quality Control and Method Validation Procedures for Pesticide Residues Analysis in Food and Feed - SANTE/11945/2015; Brussels, 2016.
-
23 Freire, C.; Koifman, R. J.; Sarcinelli, P. N.; Simões Rosa, A. C.; Clapauch, R.; Koifman, S.; Environ. Res 2013, 127, 7. [Crossref]
» Crossref -
24 Rosa, A. C. S.: Avaliação dos Níveis Basais de Metabólitos de Agrotóxicos Piretroides na População Adulta da Cidade do Rio de Janeiro: Contribuição para a Vigilância em Saúde no País; PhD Thesis, FIOCRUZ, Rio de Janeiro, 2017. [Link] accessed in March 2026
» Link -
25 Bloom, M. S.; Jansing, R. L.; Kannan, K.; Rej, R.; Fitzgerald, E. F.; Int. J. Hyg. Environ. Health 2014, 217, 473. [Crossref]
» Crossref -
26 Channa, K. R.; Röllin, H. B.; Wilson, K. S.; Nøst, T. H.; Odland, J. Ø.; Naik, I.; Sandanger, T. M.; J. Environ. Monit. 2012, 14, 2952. [Crossref]
» Crossref -
27 Arrebola, J. P.; Cuellar, M.; Claure, E.; Quevedo, M.; Antelo, S. R.; Mutch, E.; Ramirez, E.; Fernandez, M. F.; Olea, N.; Mercado, L. A.; Environ. Res. 2012, 112, 40. [Crossref]
» Crossref -
28 Agency for Toxic Substances and Disease Registry (ATSDR); Toxicological Profile for Alpha-, Beta-, Gamma-, and Delta-Hexachlorocyclohexane; Agency for Toxic Substances and Disease Registry: Atlanta, USA, 2005. [Link] accessed in March 2026
» Link -
29 International Agency for Research on Cancer (IARC); List of Classifications Agents classified by the IARC Monographs, Volumes 1-140; International Agency for Research on Cancer: Lyon, France, 2025. [Link] accessed March 2026
» Link -
30 Lewis, K. A.; Tzilivakis, J.; Warner, D. J.; Green, A.; Hum. Ecol. Risk Assess 2016, 22, 1050. [Crossref]
» Crossref -
31 Araki, A.; Miyashita, C.; Mitsui, T.; Goudarzi, H.; Mizutani, F.; Chisaki, Y.; Itoh, S.; Sasaki, S.; Cho, K.; Moriya, K.; Shinohara, N.; Nonomura, K.; Kishi, R.; Environ. Int. 2018, 110, 1. [Crossref]
» Crossref -
32 Aronson, K. J.; Wilson, J. W. L.; Hamel, M.; Diarsvitri, W.; Fan, W.; Woolcott, C.; Heaton, J. P. W.; Nickel, J. C.; Macneily, A.; Morales, A.; J. Expo. Sci. Environ. Epidemiol 2010, 20, 434. [Crossref]
» Crossref -
33 Bae, J.; Kim, S.; Barr, D. B.; Buck Louis, G. M.; Environ. Res 2018, 161, 9. [Crossref]
» Crossref -
34 Bapayeva, G.; Issayeva, R.; Zhumadilova, A.; Nurkasimova, R.; Kulbayeva, S.; Tleuzhan, R.; Reprod. Toxicol. 2016, 65, 67. [Crossref]
» Crossref -
35 Lee, D.-H.; Porta, M.; Jacobs, D. R.; Vandenberg, L. N.; Endocr. Rev. 2014, 35, 557. [Crossref]
» Crossref -
36 Lopez-Espinosa, M.-J.; Vizcaino, E.; Murcia, M.; Llop, S.; Espada, M.; Seco, V.; Marco, A.; Rebagliato, M.; Grimalt, J. O.; Ballester, F.; Environ. Res. 2009, 109, 479. [Crossref]
» Crossref -
37 Robledo, C. A.; Yeung, E.; Mendola, P.; Sundaram, R.; Maisog, J.; Sweeney, A. M.; Barr, D. B.; Louis, G. M. B.; Environ. Health Perspect 2015, 123, 88. [Crossref]
» Crossref -
38 Toft, G.; Dan. Med. J 2014, 61, B4967. [Link] accessed in March 2026
» Link -
39 Vrijheid, M.; Casas, M.; Gascon, M.; Valvi, D.; Nieuwenhuijsen, M.; Int. J. Hyg. Environ. Health 2016, 219, 331. [Crossref]
» Crossref -
40 Friedrich, K.; Gurgel, A. M.; Sarpa, M.; Bedor, C. N. G.; Siqueira, M. T.; Gurgel, I. G. D.; Augusto, L. G. S.; Saúde Debate 2022, 46, 293. [Crossref]
» Crossref -
41 Neves, A. P.; Gonçalves, E.; Rosa, A. C. S.; Vidal, P. J. S. R.; Mattos, D.; Santos, M. V. C.; Cardoso, A. C. S.; Fonseca, A. S. A.; Carvalho, L. V. B.; Teixeira, L. R.; Almeida, M. S.; Rosa, J. C. S.; Mattos, R. C. O. C.; Meirelles, L. C.; Bergamini, F. P. B.; Pereira, C. D.; Santos, T. O.; Guillermo, L. V. C.; Mello, M. S. C.; Larentis, A. L.; Rev. Bras. Saúde Ocup. 2025, 51, e11. [Crossref]
» Crossref
Edited by
-
Editor handled this article:
Andrea R. Chaves (Executive)