Enhanced Conformational and Configurational Analysis of Furofuran Lignans by VCD Spectroscopy
Abstract
The correct reproduction of key vibrational circular dichroism (VCD) spectral features of furofuran lignans commonly requires the inclusion of explicit acetonitrile solvation in density functional theory calculations. This requirement, however, seems to be neither universal nor restricted to acetonitrile. In order to better understand the conformational stabilization promoted by different solvents, and consequently its effect on VCD spectra, herein, we report experimental and computational VCD investigations of kobusin, sesamin, and episesamin in acetonitrile and chloroform solutions. These molecules differ from previously reported furofuran lignans in their aromatic ring substitution, symmetry, flexibility, and H-bonding affinity. The simulation of explicit solvation using molecular dynamics combined with hybrid quantum mechanics/molecular mechanics calculations was found to be critical for the correct reproduction of VCD patterns in kobusin and sesamin in acetonitrile, whereas the VCD spectrum of episesamin was satisfactorily simulated using implicit solvation. For sesamin, simulations of explicit chloroform were also performed, leading once again to a better correlation with experiment. These results indicate that explicit solvation becomes necessary for VCD simulations as molecular symmetry and flexibility increase, which affects both conformation and vibrational coupling. Finally, some VCD spectral markers are proposed for the assignment of both relative and absolute configurations of furofuran lignans.
Keywords:
stereochemistry; solvent effects; DFT; MD; natural products; chiroptical methods
Introduction
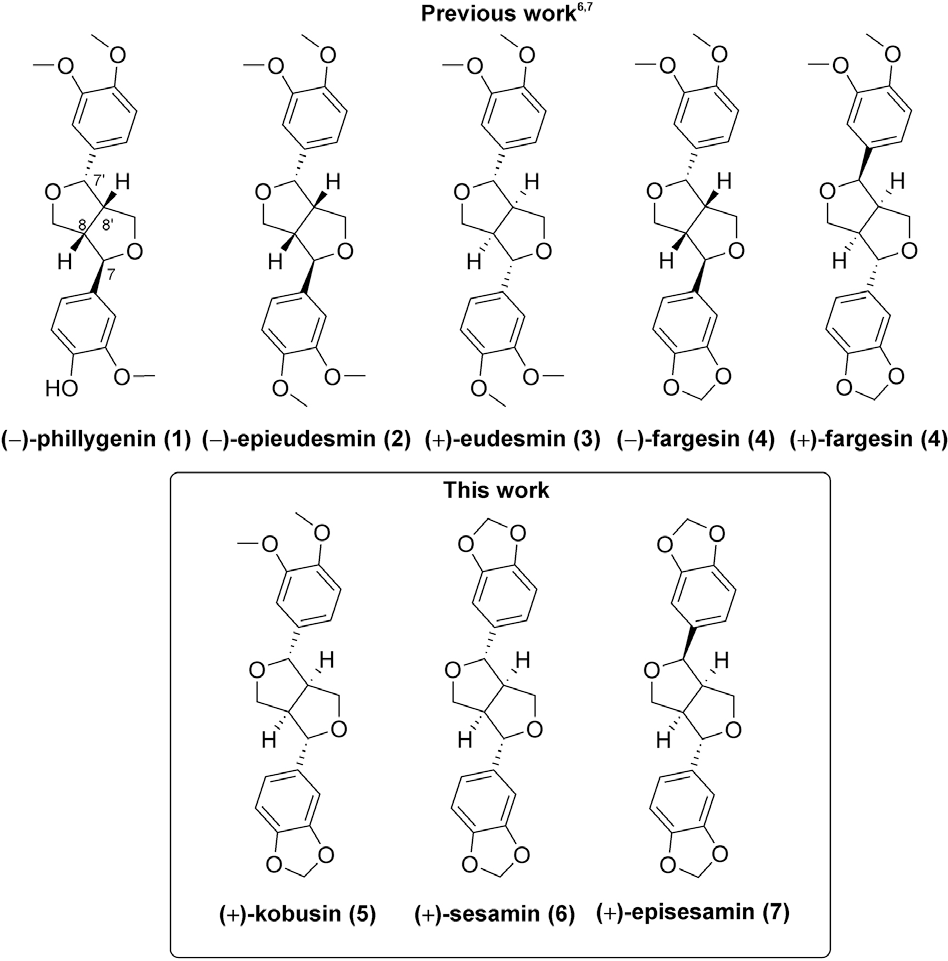
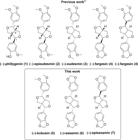
Furofuran lignans represent one of the most important classes of bioactive plant secondary metabolites.1 While their relative configurations are readily determined by nuclear magnetic resonance (NMR) methods,2 the assignment of the absolute configurations is challenging3 and may be considered ambiguous in the literature, as they are mostly based on empirical correlations of optical rotation (OR) and electronic circular dichroism (ECD) data obtained for structurally related molecules.4,5 Recently, the stereochemistry of the furofuran lignans phillygenin (1), epieudesmin (2), eudesmin (3), and fargesin (4) (Figure 1) was investigated by means of a combination of chiroptical methods and density functional theory (DFT) calculations.6,7 Vibrational circular dichroism (VCD)8 was shown to be more sensitive and reliable than both OR and ECD for stereochemical investigations of this class of secondary metabolites.7 Such sensitivity, however, comes at the expense of accurate computational protocols to reproduce the effects of solvents in the experimental spectra.9 For compounds 1-3, key VCD spectral features at around 1500 cm-1 were correctly reproduced in acetonitrile only in the presence of explicit solvent molecules.6 The inclusion of explicit solvation was found to be critical for the stabilization of dihedral angles that allowed for proper normal mode coupling and correct reproduction of the couplet-like signal. Interestingly though, these requirements were not observed for compound 4, which presented only a low intensity feature at the above-mentioned vibrational region in chloroform solution.7 Given that the main difference between compounds 1-3 and 4 resided in the aromatic ring substitution pattern, it was suggested that the presence of a rigid methylenedioxy group in 4, as opposed to the more flexible methoxy/hydroxy groups in 1-3, directly influenced the 1500 cm-1 feature.6 In order to further investigate and understand the role of lignan structural features, their resulting conformations, solute-solvent interactions, as well as the best computational protocols to reproduce experimental VCD spectra, herein, we report an extensive experimental and computational study on kobusin (5), sesamin (6), and episesamin (7) (Figure 1) in acetonitrile and chloroform solutions. These molecules differ from previously reported lignans in their aromatic ring substitution pattern, symmetry, flexibility, and H-bonding affinity. Interestingly, the inclusion of explicit solvation was considered crucial for the correct reproduction of the experimental features of compounds 5 and 6, including measurements performed in chloroform. This trend, however, was not universal, as the spectra of 7 were satisfactorily reproduced using implicit solvation. The rationale for these observations will be presented in the following sections.
Results and Discussion
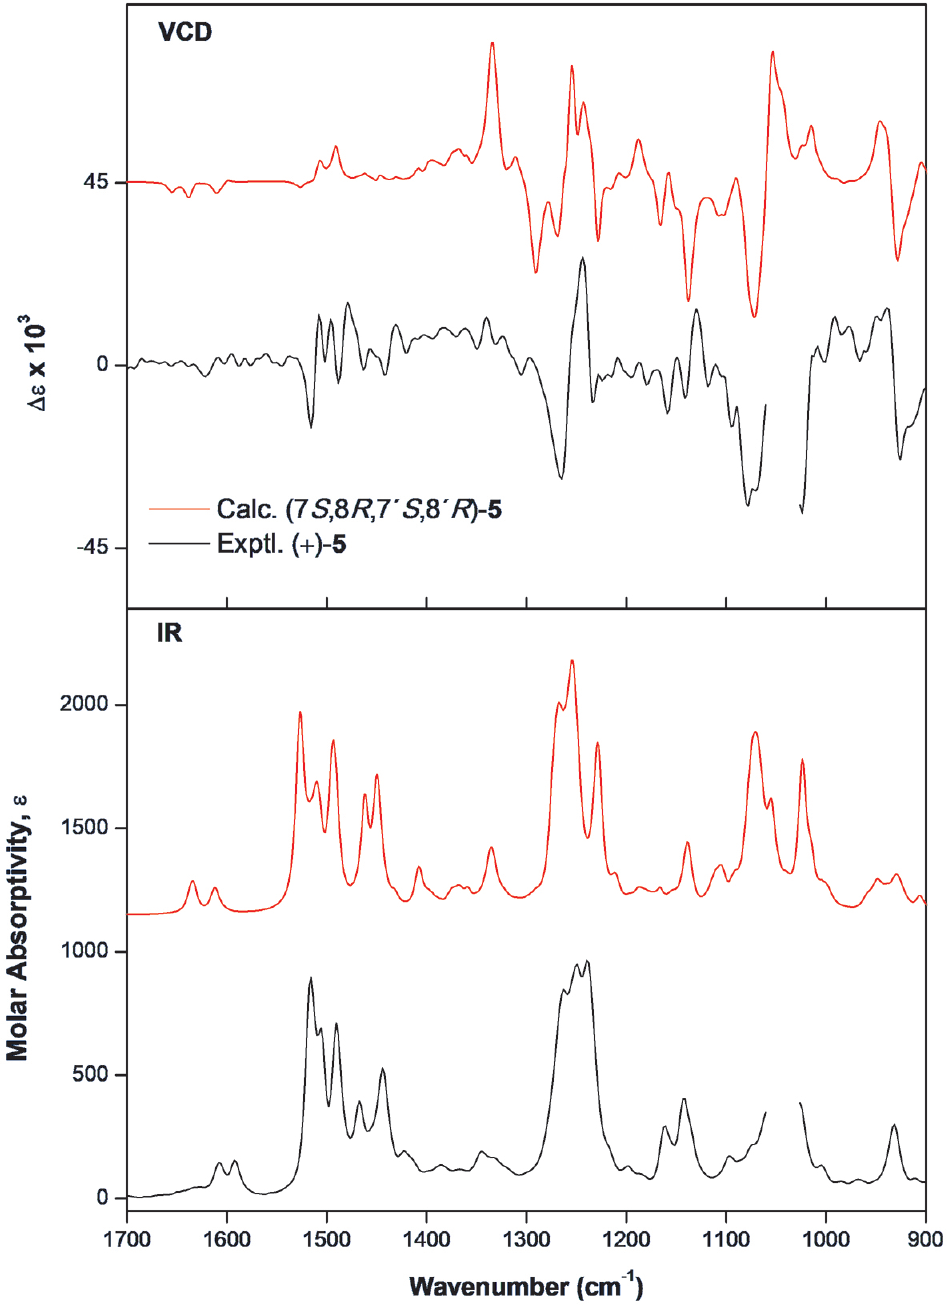
The furofuran lignans 5-7 were initially confirmed to be enantiomerically pure by chiral high-performance liquid chromatography (HPLC) analysis, (Figures S1 S3, Supplementary Information (SI) section). The first compound subjected to infrared (IR) and VCD investigation was kobusin (5) {[α]D23 = +48 (c 0.1, CHCl3)}. It differs from fargesin (4) in the relative configuration of the 2,6-diaryl-3,7 dioxabicyclo[3.3.0] octane skeleton, while maintaining the same aromatic ring substitution pattern. Since 4 exhibited a much less intense spectral feature at 1500 cm-1, the investigation of 5 allowed us to assess the influence of the relative configuration of the furofuran ring (sesamin-type vs. epi-type) on the VCD spectra. The IR spectrum of (+)-5 was very similar to that of (+)-4, while their VCD spectra showed some bands with opposite signs, including the spectral feature around 1500 cm-1 (Figure S4, SI section). These findings highlight their epimeric relationship. It is noteworthy, however, that the 1500 cm-1 spectral feature alone is not indicative of the absolute configuration of the molecules.6 The IR and VCD spectra of (+)-5 were recorded in both acetonitrile-d3 (MeCN-d3) and chloroform-d1 (CDCl3) and resulted in nearly superimposable spectra (Figure S5, SI section), indicating similar conformational ensembles in these two solvents. DFT simulations using a classic static approach based on stochastic conformational searches, followed by geometry optimizations and VCD calculations using implicit solvation (PCM), resulted in a good overall agreement with experiment in MeCN-d3. However, the spectral feature around 1500 cm-1 was not satisfactorily reproduced (Figure S6, SI section), nor was the strong couplet-like signal centered at 950 cm-1 (-,+ from low to high wavenumbers). Despite this, the absolute configuration of (+)-5 could be unambiguously assigned as (7S,8R,7’S,8’R). Subsequently, molecular dynamics (MD) simulations under periodic boundary conditions, including explicit solvent molecules, were conducted for 5. Snapshots were taken and subjected to geometry optimizations and IR/VCD calculations using a two-layer QM/MM ONIOM approach10 (B3PW91/6 311G(d,p):UFF). By using a simple average of snapshots from the final 1 ns of the simulation, a better correlation was observed between experimental and calculated IR and VCD spectra, including the spectral features at 1500 and 950 cm-1 (Figure 2).
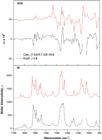
Comparison between experimental IR and VCD spectra of (+)-kobusin (5) recorded in MeCN-d3 (black solid trace) with calculated data for (7S,8R,7’S,8’R)-5 using the QM/MM ONIOM approach [B3PW91/6-311G(d,p):UFF] (red trace). Gap represents intense solvent absorption. See SI section for spectra of individual snapshots.
The spectral pattern around 1500 cm-1 was found to arise from vibrations of the two aromatic rings, including scissoring of the methylenedioxy group coupled to aromatic C-H bending and C=C stretching for the lower wavenumber range, as well as C=C and =C-O stretching coupled to aromatic C-H bending and methyl deformation modes for the higher wavenumber range. Interestingly, however, the vibrations of the aromatic rings in 5 were found to be uncoupled from each other, resulting in a +,+,- (from low to high wavenumbers) pattern instead of a couplet-like signal, as observed previously for compounds 1-3.6 Even though couplets around 1500 cm-1 in furofuran lignans were found to arise from coupled vibrational modes of the two aromatic rings with the methoxy substituents coplanar with the aromatic hydrogens, in the case of 5, coupling was not observed even with most of the conformers presenting the above-mentioned coplanarity. This is probably due to the different vibrational energy levels of the methylenedioxy and methoxy substituents. This assumption is corroborated by the lack of coupling between the aromatic rings also observed in 4. The couplet centered at 950 cm-1 originated mainly from asymmetric C-O stretching of the methylenedioxy moiety coupled to C-H2 rocking, C-H bending of ring fusion hydrogens, and out-of-phase symmetric C-O stretching of the tetrahydrofuran rings. The main structural differences between the lowest-energy conformers generated by the classic approach, which failed to reproduce the experimental spectra, and those from of MD simulations resided in the furofuran moiety. The latter presented predominantly skewed conformations of the fused furan rings, while the implicitly solvated conformers presented nearly periplanar orientation of the C7-C8-C8’-C9’, C7’-C8’-C8-C9, and H8-C8-C8’-H8’ bonds of the bicyclic furofuran moiety for the lowest-energy conformations (Figure S7, SI section).
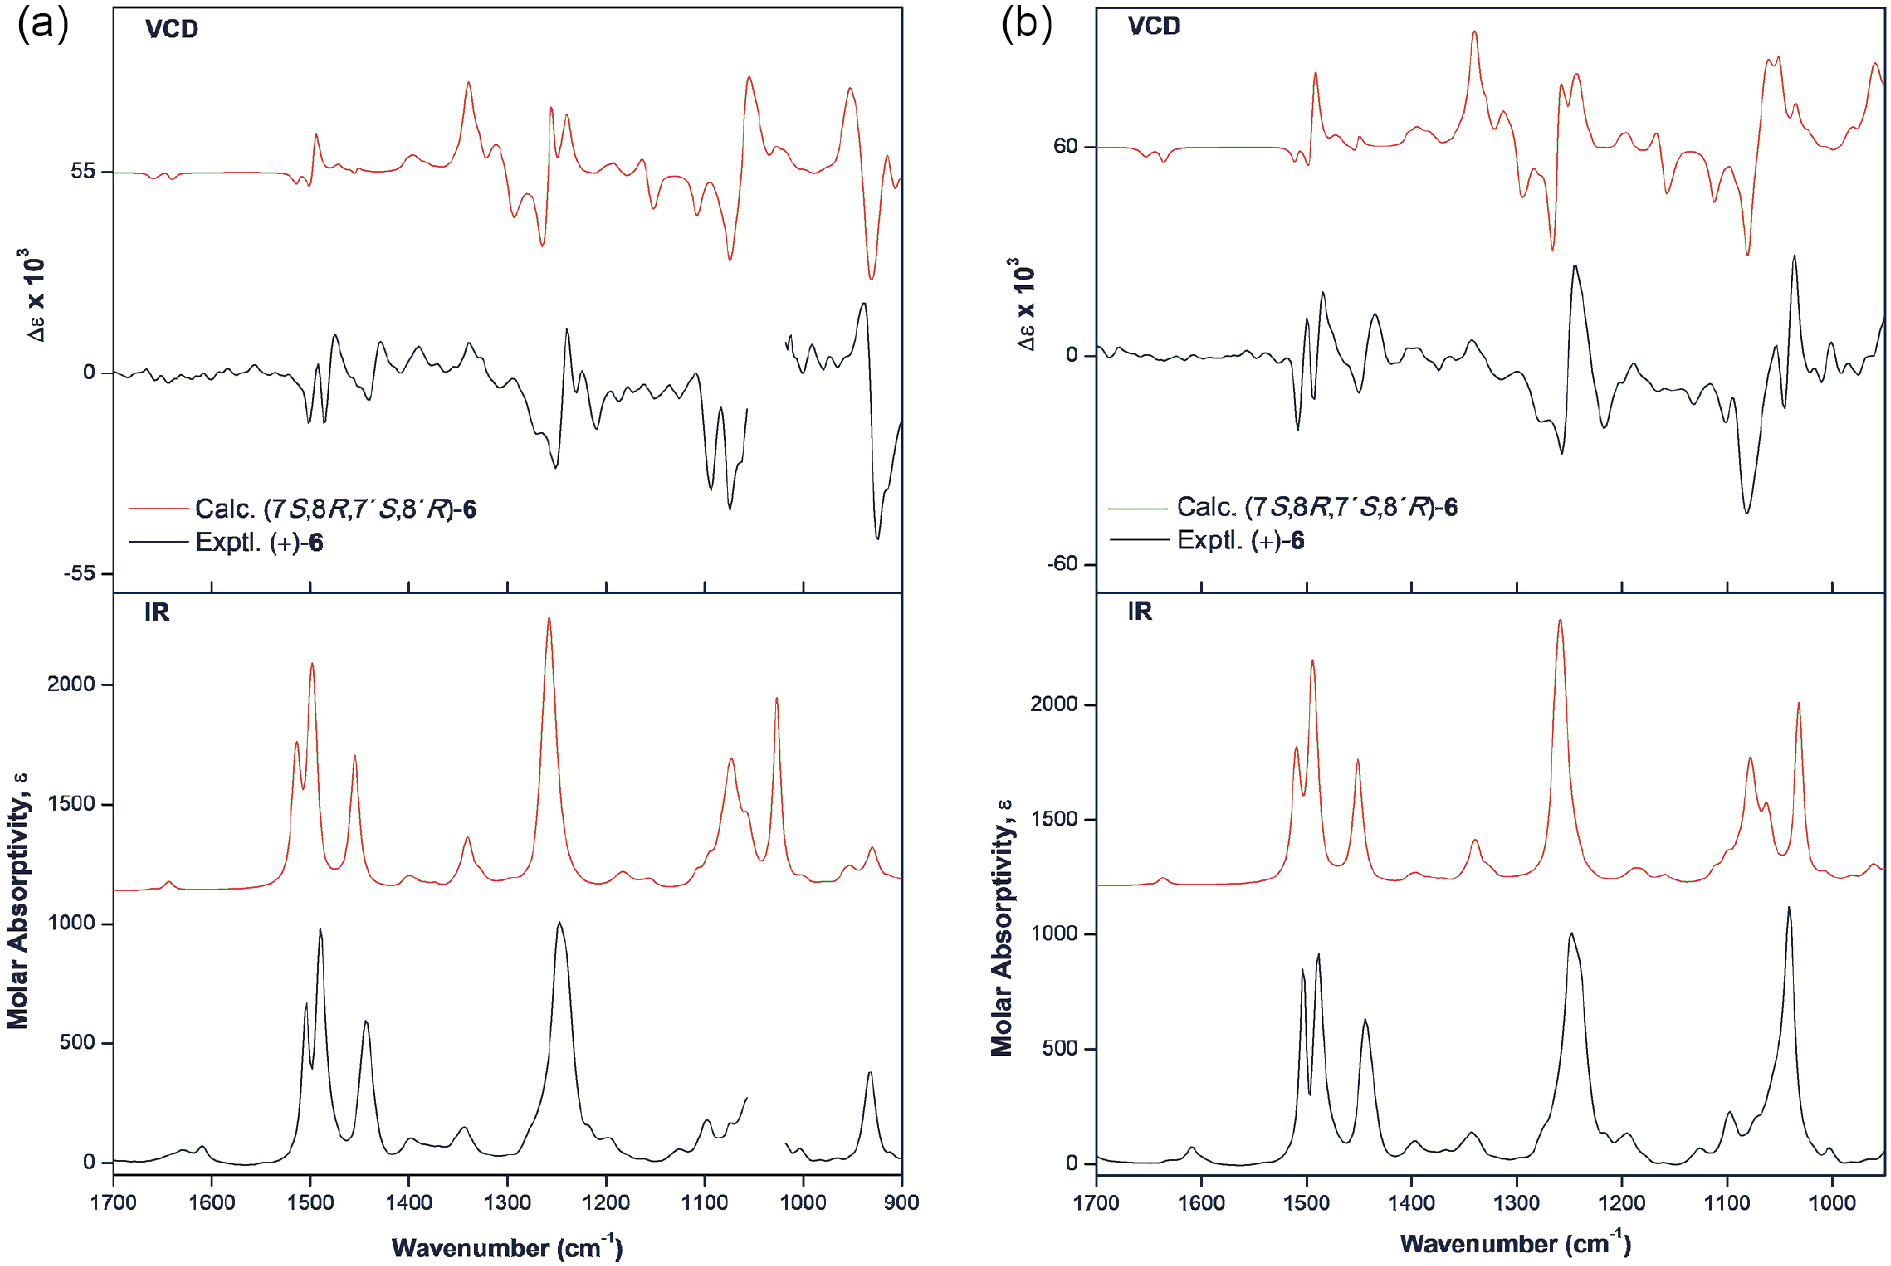
Considering the results obtained for 5, the next molecule investigated was sesamin (6) {[α]D25 = +35 (c 0.1, CHCl3)}. Compound 6 exhibits the same relative configuration of the furofuran moiety as 5 but contains both aromatic rings replaced by methylenedioxy groups. These characteristics result in less flexibility for 6 and endow the molecule with C2 symmetry. The experimental IR and VCD spectra of (+)-6 were also recorded in MeCN-d3 and CDCl3 resulting in nearly superimposable spectra (Figure S8, SI section), as observed for 5. Once again, comparison between the experimental and calculated data using the so-called classic approach using PCM led to reasonable overall agreement, but failed to reproduce the 1500 cm-1 feature in both solvents (Figures S9 and S10, SI section). However, it did succeed in reproducing the couplet centered at 950 cm-1. The absolute configuration of (+)-6 could be unambiguously assigned as (7S,8R,7’S,8’R). In an attempt to fully reproduce the VCD spectrum of (+)-6, including the spectral feature at 1500 cm-1, the MD-QM/MM approach was also applied. In the case of 6, MD simulations were performed for both acetonitrile and chloroform. In line with the trend observed for all furofuran lignans investigated, the 1500 cm-1 bands were correctly reproduced only by means of explicit solvation, and in this case even for the non-coordinating CDCl3 (Figure 3).
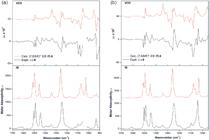
Comparison between experimental IR and VCD spectra of (+)-sesamin (6) recorded in MeCN-d3 (a) and CDCl3 (b) (black solid traces) with calculated data for (7S,8R,7’S,8’R)-6 using the QM/MM ONIOM approach [B3PW91/6-311G(d,p):UFF] (red traces). Gaps represent intense solvent absorption. See SI section for spectra of individual snapshots.
The requirement of explicit simulation of CDCl3 molecules to accurately reproduce the VCD spectra of furofuran lignans such as compound 6 is unprecedented. The main differences between the conformations obtained by implicit vs. explicit solvation were, once again, located in the furofuran bicyclic moiety. The lowest-energy conformers generated using implicit solvation, in both acetonitrile and chloroform, led to nearly planar tetrahydrofuran rings with only the oxygen atoms protruding either above or below these planes (envelope conformation).11 In addition to planar furofuran rings, their relative orientation was also consistent among the conformational ensemble with a predominance of nearly periplanar fusion hydrogens H8 and H8’. Such conformations prevented proper coupling between the aromatic moieties and led to a poorer reproduction of the experimental feature at 1500 cm-1. The conformers from MD-QM/MM approach, on the other hand, presented the tetrahydrofuran rings predominantly in a twisted conformation with deviations from planarity of 15-20o. Given the symmetry properties of the molecule, the fusion hydrogens were consequently also out-of-plane by up to 25o. These features can either bring the rings closer in space or lead to their correct alignment along the molecular axis (Figure S11, SI section), which allows vibrational coupling and correct reproduction the VCD spectrum. It is noteworthy that the spectral pattern at 1500 cm-1 was also reproduced for some conformers, even in the absence of strong vibrational coupling. In these cases, it seemed more sensitive to the relative position of the aromatic moieties. Interestingly, both acetonitrile and chloroform, when considered explicitly, stabilized similar conformations. This is relevant given the differences in polarity and H-bond capabilities of the two solvents. Such stabilization, however, did not result from direct H-bond interaction between solute and solvent. Instead, bulk intermolecular solvent interactions supported proper lignan conformations through weaker interactions. Even though MD simulations without explicit solvation could lead to some similar conformations along the trajectory, geometry optimizations of the snapshots in the absence of explicit solvent molecules converged to implicit-like geometries and, consequently, poorer reproduction of the experimental spectrum in the 1500 cm-1 region. The 1500 cm-1 spectral feature in 6 results from C-H2 scissoring of the methylenedioxy group coupled to C=C and =C-O stretches, as well as from aromatic C-H bending modes. Such modes vibrate both in-phase and out-of-phase. As the two aromatic rings are identical and properly oriented in space, these modes couple, resulting in a more complex spectral signature within the observed spectral resolution. It is noteworthy that the conformational requirements described above for 6 are similar to those observed for other C2-symmetric furofuran lignans, such as 3.6
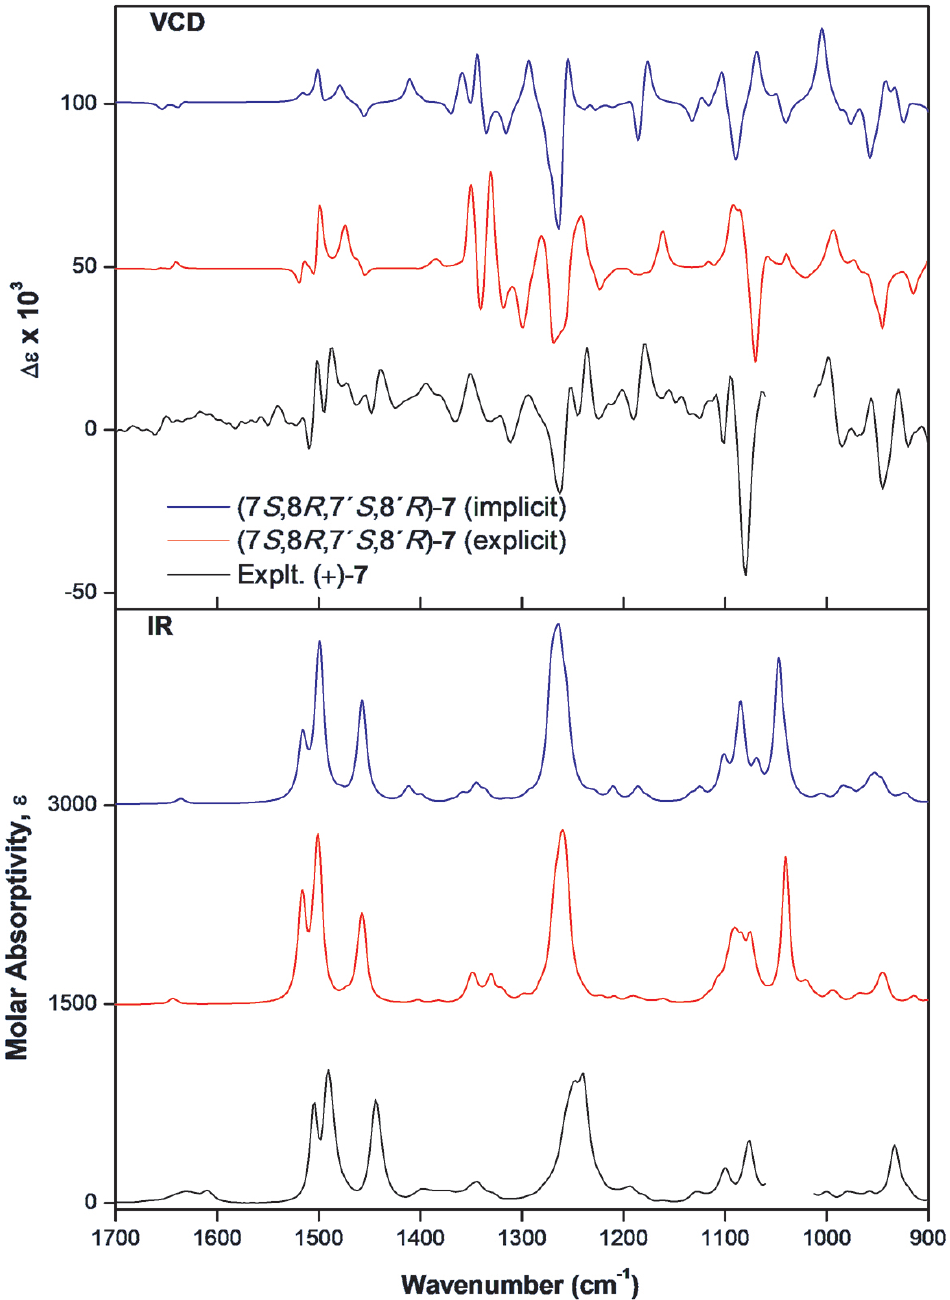
The last molecule investigated was episesamin (7) {[α]D25 = +63 (c 0.1, CHCl3)}. Compound 7 shares the same aromatic ring substitution pattern as 6 but differs in the relative configuration of the furofuran moiety, thus lacking C2 symmetry. In the case of (+)-7, the VCD spectrum simulated using the classic approach with implicit solvation was sufficient to reproduce the experimental spectrum, partially including the feature at 1500 cm-1. This was the only furofuran lignan investigated for which explicit solvation was not strictly required for the simulation of the aromatic ring vibrational region. The QM/MM ONIOM approach still led to better correlation with experiment at around 1500 cm-1 (Figure 4), however, implicit and explicit solvation provided comparably good agreements for the 900-1400 cm-1 region. In the region between ca.1300 1400 cm-1, the QM/MM approach led to some overestimated intensities, compromising the reproduction of experimental data compared to the implicit method. This is due to a large number of similar conformations repeated along the MD trajectory that present the same sign for the rotational strengths and almost identical vibrational frequencies. The lack of intensity cancelation for the C-H bendings modes of the furofuran ring resulted in more prominent features in the above-mentioned region.
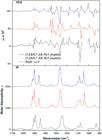
Comparison between experimental IR and VCD spectra of (+)-episesamin (7) recorded in MeCN-d3 (black solid trace) with calculated data for (7S,8R,7’S,8’R)-7 using the QM/MM ONIOM [B3PW91/6 311G(d,p):UFF] (red trace) and classic [B3PW91/PCM(MeCN)/6-311G(d,p)] (blue trace) approaches. See SI section for spectra of individual snapshots.
In spite of that, by comparing theoretical and experimental data, the absolute configuration of 7 was unambiguously confirmed as (7S,8R,7’R,8’R). Similarly to compounds 5 and 6 described above, the lowest-energy conformers identified for 7 using the classic static approach with implicit solvation showed envelope conformations for the tetrahydrofuran rings with periplanar fusion hydrogens. The conformers obtained by the MD-QM/MM approach, on the other hand, presented a mixture of envelope and twisted conformations, with a predominance of the latter (Figure S12, SI section). Interestingly, both the envelope and twisted conformations allowed the coupling of the aromatic rings in 7, leading to better reproduction of the experimental VCD spectrum, regardless of the conformational search, solvation, and optimization methodology used. It is noteworthy that similar conformations for the bicyclic furofuran ring were obtained for epieudesmin (2).6 However, only the twisted conformations generated by the MD-QM/MM protocol were able to reproduce experimental patterns. The main difference between 2 and 7 is the flexibility of the aromatic substituents. The more rigid methylenedioxy groups in 7, combined with nearly parallel orientations of the aromatic rings, seems to lead to more significant coupling of the identical aromatic rings. The main factor affecting the sign of the 1500 cm-1 pattern is the angle between the two aromatic rings and the consequent orientation of the aromatic ring dipole moments, which can point in the same or opposite directions. These results, combined with those of previously investigated furofuran lignans, indicate that the inclusion of explicit solvation becomes necessary for VCD simulations as both molecular symmetry and flexibility increase.
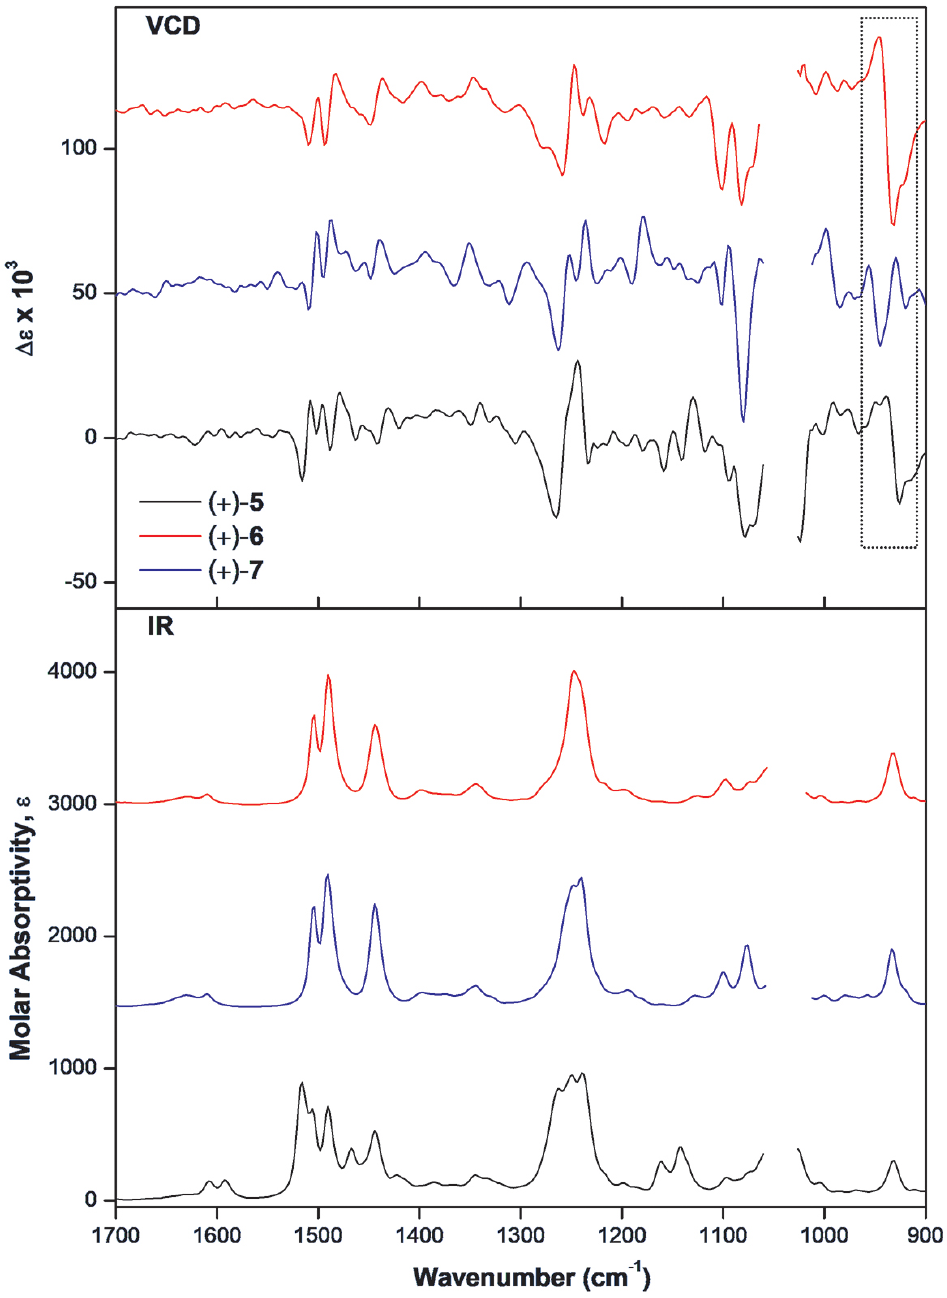
Based on the wealth of vibrational chiroptical spectroscopic information available for furofuran lignans, as well as their biological and chemotaxonomic importance, the experimental IR and VCD spectra of compounds 1-7 were investigated in a search for spectral markers that could be used by non-experts, and without the requirement of additional DFT calculations, for stereochemical assignments. This approach has already been successfully applied to monoterpenes.12 The couplet-like signal around 1500 cm-1, however, does not directly reflect the absolute configuration furofuran lignans and therefore may not be considered a spectral marker. The fingerprint region between 1100-1300 cm-1, on the other hand, provides improved stereochemical discriminative power. Interestingly, in the case of the dextrorotatory compounds 5-7, their VCD spectra recorded in CDCl3 are nearly superimposable, even with the epimeric configuration at C-7’ for 7 (Figure S13, SI section). To unambiguously assign their stereochemistry, the spectral region between 900-950 cm-1 needs to be analyzed, which is available only in MeCN-d3. Sesamin-type compounds 5 and 6 exhibit a -,+ (from low to high wavenumbers) band centered at 950 cm 1, while the epi type 7 exhibits a +,- (from low to high wavenumbers) pattern (Figure 5). Regarding the epimeric compounds (+)-4 and (+)-5, more bands with opposite signs can be identified across the mid-IR region in both solvents (Figures S4 and S14, SI section). This is probably due to the different substitution patterns of the two individual aromatic rings, which impacts their symmetry properties.
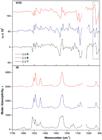
Comparison between experimental IR and VCD spectra of (+)-kobusin (5), (+)-sesamin (6), and (+)-episesamin (7) recorded in MeCN-d3. Dotted frame highlights spectral markers for relative and absolute configurations.
Conclusions
The investigation of the IR and VCD properties of (+)-kobusin (5), (+)-sesamin (6) and (+)-episesamin (7), isolated from Aristolochiaceae species, provided a detailed understanding of the effects of solvent molecules on their conformational equilibria. The correct reproduction of their experimental VCD spectra in acetonitrile was only possible by using explicit solvation, even for molecules devoid of H-bond donor groups. As demonstrated for 6, such a requirement is valid even for non-coordinating CHCl3.13 To date, except in cases involving chirality transfer to the solvent,14 neither implicit nor explicit chloroform simulation has been considered indispensable to correctly reproduce IR and VCD spectra recorded in this solvent, even though implicit solvation generally provides better correlations to experiment than gas phase simulations. The most solvent-sensitive VCD spectral pattern for 5-7 was found to be the feature at around 1500 cm-1. This spectral feature originates mainly from coupling of the aromatic ring vibrational modes, which is made possible by the conformational stabilization induced by explicit solvation shells. Such stabilization included appropriate conformations of the bicyclic furofuran moiety and the consequent alignment of the aromatic rings. Interestingly, for epi-type molecules that present rigid aromatic substituents, the dependence on these conformations becomes less pronounced. These results evidence the enhanced sensitiveness of VCD spectroscopy to minor conformational variations of chiral natural product molecules. This conclusion is supported by UV and ECD data for (+)-6 in MeCN, which indicated no significant differences in the spectra simulated using both implicitly and explicitly solvated geometries (Figure S20, SI section). Finally, the combined conformational and configurational sensitivity of VCD spectroscopy led to identification of spectral markers of both relative and absolute configuration of 5-7.
Experimental
General
Chiral HPLC analyses were performed on a JASCO chromatograph equipped with a LC-NetII/ADC controller, PU-2086 Plus pumps, AS-2055 Plus automatic injector, CO-2060 Plus column thermostat, and MD-2018 Plus photodiode array and CD-2095 Plus detectors. Chromatographic analyses were conducted using a Lux Cellulose-1 column (Phenomenex®, 4.6 × 250 mm, 5 μm) with a flow rate of 1.0 mL min-1, detection at λ = 280 nm, and mobile phase of Hex/EtOH 80:20 ((+)-5 at 22.7 min, (+)-6 at 14.9 min, (+)-7 at 16.4 min). Additional analyses were performed using a CHIRALPAK® IC column (Daicel, 4.6 × 250 mm, 5 μm) under the same conditions ((+)-5 at 52.8 min, (+)-6 at 15.4 min, (+)-7 at 16.9 min).
Optical rotations (OR) were measured in chloroform and acetonitrile on a Jasco P2000 polarimeter equipped with a sodium lamp (589 nm), using a cylindrical glass sample cell of 1 dm pathlength and 10 mm inner diameter. OR values were reported as a mean of 3-5 measurement blocks of 5 repetitions each. IR and VCD experimental spectra were recorded simultaneously with a BioTools dual-PEM ChiralIR-2X FT-VCD spectrometer using a resolution of 4 cm-1 and a collection time of 14 h. The optimum retardation of the ZnSe photoelastic modulators (PEMs) was set at 1400 cm-1. The IR and VCD spectra of 5-7 were recorded in chloroform-d1 and acetonitrile-d3 solutions (6.0 8.0 mg in 150 mL) in a BaF2 cell with 100 µm path length. Minor instrumental baseline offsets were eliminated by subtracting the VCD spectra of the solvent recorded under identical conditions.
Plant material and lignan isolation
Compounds 5-7 were isolated from three different Aristolochia species (Aristolochiaceae): 5 from the rhizomes of A. gigantea Mart., 6 from the roots and stems of A. pubescens Willd., and 7 from the roots of A. galeata Mart. & Zucc. The procedures for lignan isolation, as well as structural identification and relative configuration assignment using NMR and mass spectrometry (MS) data, have been previously described in the literature.15-17
Calculations
The initial conformational searches of compounds 5-7 were carried out at the molecular mechanics level of theory employing both the MM+ and MMFF force fields incorporated in HyperChem 8.0.1018 and Spartan 0819 software packages, respectively. The DFT calculations were carried out at 298 K in either chloroform or acetonitrile solutions using the polarizable continuum model (PCM) in its integral equation formalism version (IEFPCM), incorporated in Gaussian 09 software (Revision A.02).20 The configurations (7R,8S,7’R,8’S), (7R,8S,7’R,8’S) and (7R,8S,7’S,8’S) were arbitrarily chosen for 5, 6, and 7, respectively, based on the relative configuration determined by NMR and reported in the literature.2 The VCD properties of their enantiomers were obtained by multiplying the calculated data by (-1). Initially, 85, 13 and 12 conformers were identified for 5, 6 and 7, respectively, within a 10 kcal mol-1 energy window. These conformers were then geometry optimized at the B3PW91/PCM(MeCN)/6 311G(d,p) level. The 10, 7 and 9 lowest-energy conformers of 5, 6 and 7, respectively, which contributed ≥ 2% of the total Boltzmann population, were selected for IR/VCD calculations. IR and VCD were simulated at the B3PW91/PCM(MeCN or CHCl3)/6 311G(d,p) level and the spectra were created using dipole and rotational strengths from Gaussian, which were converted into molar absorptivity (M-1 cm-1). Each spectrum was plotted as a sum of Lorentzian bands with half-widths at half-maximum (HWHM) of 6 cm-1. The calculated wavenumbers were multiplied with a scaling factor of 0.985 and the Boltzmann-average-composite IR and VCD spectra were plotted using Origin 8 software.21 Data were processed and visualized using GaussView 6 software.22 Molecular dynamics (MD) simulations were performed using GROMACS software23 (version 2024.1) in periodic conditions with explicit MeCN for 5-7, and additionally in CHCl3 for 6. A cubic box of 50 × 50 × 50 Å dimensions was used and filled with a single lignan molecule and 1600 molecules of either MeCN or CHCl3. Simulations were performed at 300 K and 1 bar using the V-rescale thermostat and the Berendsen barostat for 10 ns with an integration time step of 2 fs. OPLS-AA parameters24 were used with a cut-off radius of 1.2 nm for both Coulomb and Lennard-Jones interactions with PME (particle-mesh Ewald)25 correction for long-rang Coulomb interactions. Snapshots were taken at every 50 ps and subjected to geometry optimization and IR/VCD calculations using the two-layer ONIOM method. Only solvent molecules within a 7-8 Å distance from any atom of the lignan were kept. The high layer/QM region was treated at the B3PW91/6 311G(d,p) level of theory for geometry optimizations and harmonic frequency calculations. The low layer/MM MeCN or CHCl3 region was treated with UFF force field without electronic embedding. The final QM/MM IR and VCD spectra to be compared to experiment were generated by simple averages of the snapshots. Two different scaling factors were used for IR/VCD spectra, 0.96 for the region between 900-1300 cm-1 and 0.98 for 1300-1700 cm-1.
Supplementary Information
Supplementary Information
Data Availability Statement
All data are available in the text.
Acknowledgments
This work was supported by grants from Fundação de Amparo à Pesquisa do Estado de São Paulo - FAPESP (grants No. 2023/12475 5 and 2023/09350-6) and by resources supplied by the Centre for Scientific Computing (NCC/GridUnesp) of São Paulo State University (Unesp). E.Y.L thanks FAPESP for a scholarship (grant No. 2024/17686-7). The authors are also thankful to Jordan Nafie and BioTools, Inc. for additional VCD measurements.
References
-
1 Xu, W.-H.; Zhao, P.; Wang, M.; Liang, Q.; Nat. Prod. Res. 2019, 33, 1357. [Crossref]
» Crossref -
2 Shao, S.-Y.; Yang, Y.-N.; Feng, Z.-M.; Jiang, J.-S.; Zhang, P.-C.; J. Nat. Prod. 2018, 81, 1023. [Crossref]
» Crossref -
3 Li, W.; Zu, F.; Tang, L.; Xu, J.; Zhang, X.; Duan, Z.; Zhang, W.; Hai, P.; Zheng, Y.; Liu, H.; Li, X.; Su, Y.; Phytochemistry 2025, 238, 114552. [Crossref]
» Crossref -
4 Biavatti, M. W.; Vieira, P. C.; da Silva, M. F. G. F.; Fernandes, J. B.; Degani, A. L. G.; Cass, Q. B.; Schefer, A. B.; Ferreira, A. G., Phytochem. Anal. 2001, 12, 64. [Crossref]
» Crossref -
5 Li, C.; Yao, Z.-H.; Qin, Z.-F.; Zhang, J.-B.; Cao, R.-Y.; Dai, Y.; Yao, X.-S.; Fitoterapia 2014, 97, 92. [Crossref]
» Crossref -
6 Lee, E. Y.; Sousa, V. M. S.; Mestriner, E. R.; Bernardino, K.; Nascimento, I. R.; Batista Jr., J. M.; Phys. Chem. Chem. Phys. 2025, 27, 3908. [Crossref]
» Crossref -
7 Mestriner, E. R.; Lee, E. Y.; Cunha, C. L.; Sousa, V. M. S.; Nascimento, I. R.; Batista Jr., J. M.; Chirality 2024, 36, e70003. [Crossref]
» Crossref -
8 Batista, A. N. L.; Valverde, A. L.; Nafie, L. A.; Batista Jr., J. M.; Chem. Commun. 2024, 60, 10439. [Crossref]
» Crossref -
9 Merten, C.; Phys. Chem. Chem. Phys. 2023, 25, 29404. [Crossref]
» Crossref -
10 Giovannini, T.; Olszòwka, M.; Cappelli, C.; J. Chem. Theory Comput 2016, 12, 5483. [Crossref]
» Crossref -
11 Stocka, J.; Čeponkus, J.; Šablinskas, V.; Rodziewicz, P.; Spectrochim. Acta, Part A 2020, 238, 118425. [Crossref]
» Crossref -
12 Vermeyen, T.; Batista, A. N. L.; Valverde, A. L.; Herrebout, W.; Batista Jr., J. M.; Phys. Chem. Chem. Phys. 2023, 25, 13825. [Crossref]
» Crossref -
13 Rode, J. E.; Górecki, M.; Witkowski, S.; Frelek, J.; Phys. Chem. Chem. Phys. 2018, 20, 22525. [Crossref]
» Crossref -
14 Debie, E.; Jaspers, L.; Bultinck, P.; Herrebout, W.; Van Der Veken, B.; Chem. Phys. Lett. 2008, 450, 426. [Crossref]
» Crossref -
15 Holzbach, J. C.; Lopes, L. M. X.; Molecules 2010, 15, 9462. [Crossref]
» Crossref -
16 Nascimento, I. R.; Lopes, L. M. X.; Phytochemistry 1999, 52, 345. [Crossref]
» Crossref -
17 Lopes, L. M. X.; Bolzani, V. S.; Phytochemistry 1988, 27, 2265. [Crossref]
» Crossref - 18 HyperChem, version 8.0.10; Hypercube Inc; Gainsville, FL, USA, 2011.
- 19 Spartan, version 08; Wavefunction Inc; Irvine, CA, USA, 2008.
- 20 Frisch, M. J.; Trucks, G. W.; Schlegel, H. B.; Scuseria, G. E.; Robb, M. A.; Cheeseman, J. R.; Scalmani, G.; Barone, V.; Mennucci, B.; Petersson, G. A.; Nakatsuji, H.; Caricato, M.; Li, X.; Hratchian, H. P.; Izmaylov, A. F.; Bloino, J.; Zheng, G.; Sonnenberg, J. L.; Hada, M.; Ehara, M.; Toyota, K.; Fukuda, R.; Hasegawa, J.; Ishida, M.; Nakajima, T.; Honda, Y.; Kitao, O.; Nakai, H.; Vreven, T.; Montgomery Jr., J. A.; Peralta, J. E.; Ogliaro, F.; Bearpark, M.; Heyd, J. J.; Brothers, E.; Kudin, K. N.; Staroverov, V. N.; Kobayashi, R.; Normand, J.; Raghavachari, K.; Rendell, A.; Burant, J. C.; Iyengar, S. S.; Tomasi, J.; Cossi, M.; Rega, N.; Millam, J. M.; Klene, M.; Knox, J. E.; Cross, J. B.; Bakken, V.; Adamo, C.; Jaramillo, J.; Gomperts, R.; Stratmann, R. E.; Yazyev, O.; Austin, A. J.; Cammi, R.; Pomelli, C.; Ochterski, J. W.; Martin, R. L.; Morokuma, K.; Zakrzewski, V. G.; Voth, G. A.; Salvador, P.; Dannenberg, J. J.; Dapprich, S.; Daniels, A. D.; Farkas, Ö.; Foresman, J. B.; Ortiz, J. V.; Cioslowski, J.; Fox, D. J. Gaussian 09, Revision A. 02; Gaussian, Inc., Wallingford, CT, USA, 2009.
- 21 Origin, version 8; OriginLab Corporation; Northampton, MA, USA, 2007.
- 22 GaussView, version 6; Semichem Inc; Shawnee Mission, KS, USA, 2016.
-
23 Berendsen, H. J. C.; van der Spoel, D.; van Drunen, R.; Comput. Phys. Commun. 1995, 91, 43. [Crossref]; GROMACS. [Link] accessed in December 2025
» Crossref» Link -
24 Jorgensen, W. L.; Maxwell, D. S.; Tirado-Rives, J.; J. Am. Chem. Soc. 1996, 118, 11225. [Crossref]
» Crossref -
25 Essmann, U.; Perera, L.; Berkowitz, M. L.; Darden, T.; Lee, H.; Pedersen, L. G.; J. Chem. Phys. 1995, 103, 8577. [Crossref]
» Crossref
Edited by
-
Editor handled this article Paula Homem-de-Mello (Executive)