Excitation-Emission Matrix Fluorescence of Blood Plasma Combined with Multi Way Chemometric Analysis for HIV Detection in Pregnant Women
Abstract
The risk of vertical transmission of the human immunodeficiency virus (HIV), the major concern among pregnant women living with the virus, can be reduced through early diagnosis and initiation of antiretroviral therapy (ART). Although conventional tests used for HIV diagnosis are effective, they are labor-intensive and costly, highlighting the need for faster and more accessible methods. In this study, fluorescence spectroscopy in excitation-emission matrix (EEM) combined with multiway analysis techniques was employed as an alternative approach to diagnose HIV in blood plasma samples from 26 uninfected and 26 pregnant women living with HIV. The Tucker3 QDA (Tucker3-quadratic discriminant analysis) and n-PLS-DA (n-way partial least squares discriminant analysis) classification algorithms were applied, and their performances were assessed based on figures of merit: accuracy, sensitivity, specificity, F-score, and G-score The n-PLS-DA model achieved the best classification performance, with 81.25% accuracy, 87.50% sensitivity, 75.00% specificity, 80.77% F-score, and 81.07% G-score. These results demonstrate the potential of the proposed method as a rapid, simple, and low-cost alternative for HIV screening during pregnancy.
Keywords:
EEM; multi-way; Tucker3-QDA; n-PLS-DA; HIV
Introduction
The human immunodeficiency virus (HIV) constitutes a global public health concern.1 Since the onset of the epidemic in the 1980s, with the recognition of the first atypical cases of immunodeficiency,2 approximately 91.4 million people have been infected with HIV, and 44.1 million have died.3
HIV is a retrovirus transmitted through contaminated body fluids, including blood, genital secretions, semen, and breast milk, and promotes the destruction of CD4+ T cells during replication. In the absence of treatment, infection may progress to acquired immunodeficiency syndrome (AIDS), leading to severe impairment of the immune system and rendering the host susceptible to opportunistic infections and the development of certain cancers.1,4
Antiretroviral therapy (ART) acts by suppressing viral load, improving the quality of life of individuals living with HIV, and reducing the risk of transmission.1 With successful intervention, ART has contributed to a decline in HIV-related mortality since 1994.5
According to the Brazilian Ministry of Health Epidemiological Bulletin,6 between 2007 and 2024, a total of 541,759 HIV cases were reported in the national Notifiable Diseases Information System (SINAN). Between 2000 and June 2024, 116,292 HIV infections were reported among pregnant women, parturients, or postpartum women, of which 8,227 occurred in 2023.
Vertical transmission, also referred to as mother-to-child transmission, occurs when the virus is passed from mother to infant during intrauterine period, labor, or breastfeeding. This possibility represents a major concern for pregnant people living with HIV.7,8 Early diagnosis of HIV infection and timely initiation of ART during pregnancy are essential for preserving maternal health and preventing vertical transmission.1,6 Preventive measures are particularly critical because HIV infection in newborns progresses more rapidly, resulting in death in approximately one out of every two infants within the first 24 months of life.4 According to the Joint United Nations Programme on HIV/AIDS (UNAIDS),3 in 2024, 84% of pregnant people living with HIV received ART.
HIV testing in pregnant women should be performed during both the first and third trimesters of pregnancy, as well as at delivery, preferably through rapid or laboratory-based assays providing results within 14 days.9 These assays employ serum, plasma, whole blood, or oral fluid samples. Rapid tests are simple immunoassays that deliver results within 30 min; however, despite their practicality, they exhibit lower sensitivity and longer diagnostic windows, which may result in false-negative outcomes. Laboratory-based immunoassays, which can be completed within four hours, are classified into four generations. Currently, fourth-generation assays are most widely employed due to their high sensitivity and reduced diagnostic window, achieved through the simultaneous detection of the p24 antigen and anti-HIV antibodies, enabling early infection identification during the initial stages of the immune response. Molecular assays are typically used as complementary tests in cases of reactive or inconclusive immunoassay results, to confirm or exclude infection.10
Despite their high sensitivity and reduced diagnostic window, laboratory assays are labor-intensive and costly, as they rely on properly calibrated equipment and high-quality reagents; otherwise, diagnostic failures may occur.10,11
Methodologies combining biospectroscopy and chemometric techniques have demonstrated promising potential for HIV diagnosis. Near-infrared spectroscopy (NIRS) and attenuated total reflectance Fourier-transform infrared spectroscopy (ATR-FTIR), coupled with chemometric analysis, have been successfully applied for HIV diagnosis in serum and plasma samples, yielding satisfactory results.11-15 This method enables the generation of characteristic spectral profiles, facilitating the simultaneous analysis of multiple biomolecules and contributing to the construction of models capable of distinguishing healthy individuals from those infected with HIV.16
To date, no studies have reported the use of molecular fluorescence spectroscopy in excitation and emission matrix (EEM) combined with chemometrics for HIV diagnosis using plasma or serum samples. Available articles17-21 instead describe the use of techniques such as fluorescence resonance energy transfer (FRET), time-resolved fluorescence spectroscopy (TRFS), and nanoparticle-based fluorescence for structural or quantitative detection of viral molecules.
EEM fluorescence spectroscopy combined with multi-way analysis has already been successfully applied in biological samples for the diagnosis of diseases such as Alzheimer’s disease,16 dengue and chikungunya.22 Fluorescence methods offer high sensitivity and selectivity, enabling the study of cell and tissue interactions as well as the determination of various classes of biomolecules, including amino acids, proteins, vitamins, nucleic acids, and diverse metabolites.23-27 These attributes establish fluorescence spectroscopy as a valuable tool for clinical applications. The technique essentially consists of exciting a sample at a specific wavelength, followed by the detection of the emission at longer wavelengths.24
EEM data generated from independent excitation and emission profiles are considered second-order data. For a single sample, these profiles form a bilinear data matrix X (J × K), where J represents excitation wavelengths and K represents emission wavelengths. When matrix data from multiple samples are combined, a three-way array X (I × J × K) is obtained, where I corresponds to the sample mode.28,29
Complex samples, such as biological matrices, may contain several fluorophores whose signals exhibit extensive spectral overlap in EEM spectroscopy. This overlap may compromise the selectivity of the technique, necessitating the use of multi-way chemometric methods for proper signal resolution.16,29
In this study, we propose the application of EEM fluorescence spectroscopy to blood plasma samples, combined with multi-way classification algorithms (Tucker3-QDA (Tucker3-quadratic discriminant analysis) and n-PLS-DA (n-way partial least squares discriminant analysis)), as a minimally invasive, low-cost alternative methodology for diagnosing HIV infection in pregnant women. The goal is to enable early diagnosis and support the implementation of preventive measures against vertical transmission. To the best of our knowledge, no previous works have described the application of EEM fluorescence spectroscopy combined with multivariate analysis directly for HIV diagnosis in plasma samples, underscoring the innovative nature of the proposed method.
Experimental
Clinical samples
This study was conducted with 26 plasma samples from healthy individuals and 26 plasma samples from patients living with HIV. Blood samples were collected at Maternidade Escola Januário Cicco (MEJC, Natal, Brazil) and Centro Reprodutivo Dra Leide Morais (Natal, Brazil). The study was approved by the Ethics Committee of MEJC, Federal University of Rio Grande do Norte, under protocol number 1.808.891. Participants were recruited voluntarily during prenatal consultations, at which time they were invited to join the study. Inclusion criteria were pregnancy between 12 and 30 weeks of gestation, with or without HIV infection. Pregnant women diagnosed with HIV were monitored by an infectious disease specialist and an obstetrician throughout prenatal care. After agreeing to participate, all subjects signed a Free and Informed Consent Form, and anonymity was ensured at all stages, safeguarding the confidentiality of HIV status. All study steps were conducted in accordance with the principles outlined in the Declaration of Helsinki.
Sample preparation
Blood collection was performed in tubes containing ethylenediaminetetraacetic acid (EDTA). Samples were centrifuged at 1500 rpm for 10 min at room temperature to obtain plasma, which was then stored at -80 °C until analysis.
For molecular fluorescence analysis, plasma samples were diluted in ultrapure water from a MilliQ system. In 2 mL microtubes, 5 μL of plasma was mixed with 95 μL of ultrapure water. The mixture was homogenized in a portable vortex mixer (Gilson Inc., USA) for 5 s.
EEM fluorescence spectroscopy
EEM matrices were acquired using a Shimadzu RF 5301 spectrofluorometer operated with RFPC software and a demountable quartz cuvette with a chamber volume of 100 μL. The optical path length was 0.1 ± 0.005 nm, into which 100 μL of the plasma/ultrapure water mixture was added. Excitation-emission data were acquired in the ranges 260-310 nm (excitation) and 260-800 nm (emission), with 5 and 1 nm steps, respectively. Spectral bandwidth was set to 3 nm, and scan speed was set to super mode (3000 nm min 1). After each measurement, the cuvette was washed with 70% (v/v) ethanol and allowed to dry completely to avoid cross-contamination between HIV samples.
Chemometric procedure and software
Preprocessing and construction of multivariate classification models were carried out in MATLAB R2014b (The MathWorks, Natick, USA, 2014). Rayleigh and Raman scatterings were removed using the algorithm developed by Zepp et al.,30 followed by spectral truncation in the emission range 769-800 nm. The classification models were built from a data cube with dimensions 52 × 11 × 510, representing the number of samples, excitation wavelengths (260-310 nm, 5 nm steps), and emission wavelengths (260 769 nm, 1 nm steps), respectively.
The Kennard-Stone (KS) algorithm31 was applied to partition samples into training (n = 36) and test (n = 16) sets. Training (36 × 11 × 510) and test (16 × 11 × 510) arrays were generated, used for model construction and validation, respectively. KS selects training samples by maximizing Euclidean distance, initially choosing the most distant sample, and subsequently selecting samples that are as far apart as possible until the desired number is reached.32
The classification models applied in this study were Tucker3-QDA and n-PLS-DA. Tucker3 is a three-way decomposition model introduced by Tucker in the 1960s.33 It extends principal component analysis (PCA) to higher-order data.34 However, unlike conventional PCA, the Tucker3 model allows the three loading matrices to have distinct dimensions, enabling the number of significant components to vary across the different modes.35
The structural basis of the Tucker 3 model is given by the matrix equation 1:36
where is the three-way data array, decomposed into loading matrices A (I × L), B (J × M), and C (K × N), and a core matrix G (L × M × N). The core matrix contains elements representing the most important factors in the model.33,37 L, M and N correspond to the number of factors in the three modes of the data structure.36 The symbol ⊗ denotes the Kronecker product,38 and represents the residuals.36
The algebraic representation of the model is given through the sum notation:33,37
where xijk are elements of X; ail, bjm, ckn are elements of loading matrices A, B and C; and glmn, are elements of the core matrix G. Indices i, j and k refer to observational modes, while l, m, and n correspond to derivational factors.33
Since Tucker3 is not itself a classifier, the score matrix obtained after decomposition was subjected to a first-order classification algorithm.39,40 In this study, quadratic discriminant analysis (QDA) was applied. QDA is a classification method based on Mahalanobis distance, calculated from the variance-covariance matrix of each class.41 Classification scores (Qig) are estimated in a non-Bayesian approach (equation 3).42
where xi is the Tucker3 score vector for sample i; is the mean vector of class g; and is the inverse of the variance-covariance matrix of class g.42 The variance-covariance matrix is calculated as shown in equation 4:39
where n is the number of objects in the training set, g is the number of classes, and ng is the number of objects in class g.39
The multi-way partial least squares (n-PLS) algorithm is an extension of PLS to higher-order data, proposed by Bro in 1996.43 Initially developed for multivariate calibration, it was later adapted for classification tasks (n-PLS-DA).44
Ouertani et al.45 presented a compact formulation of n-PLS-DA, providing computational mechanisms for calculating parameters such as scores and loadings. n PLS DA decomposes the three-way data array into a score matrix and two loading matrices,46 as shown in equation 5.40,47
where pijk is the instrumental signal for sample i at emission wavelength j and excitation wavelength K, and are elements of loading matrices W, associated with emission and excitation modes, respectively; and eijk is the model residual.40,47 This stabilized decomposition enables more accurate predictions.22,40,47
The latent variables with highest covariance with the response variable are applied to equation 6 for the classification of unknown samples:22,40,47
where tu are the scores of test samples, obtained by projecting vectorized data into the latent variable space (equation 7):22,40,47
Figures of merit
For the validation of the classification models, the following figures of merit were used: correct classification rate (CC%), accuracy (AC), sensitivity (S), specificity (SP), F-score, and G-score. These metrics were calculated according to equations 8-13:22,23,48,49
Here, TP, TN, FP and FN represent true positives, true negatives, false positives, and false negatives, respectively. The CC% indicates the percentage of correctly classified samples in both training and test sets, based on true class membership, where ε1 and ε2 represent errors for classes 1 and 2.22,23
AC (also called prediction rate) indicates the overall fraction of correctly classified samples, considering both true and false negatives; S corresponds to the percentage of correctly classified positive samples; SP to the fraction of negative samples correctly rejected by the model; the F-score expresses a harmonic mean between sensitivity and precision, representing overall performance for unbalanced data sets; whereas the G-score reflects the performance balance between the positive and negative classes, independent of class size.16,23,48,49
Results and Discussion
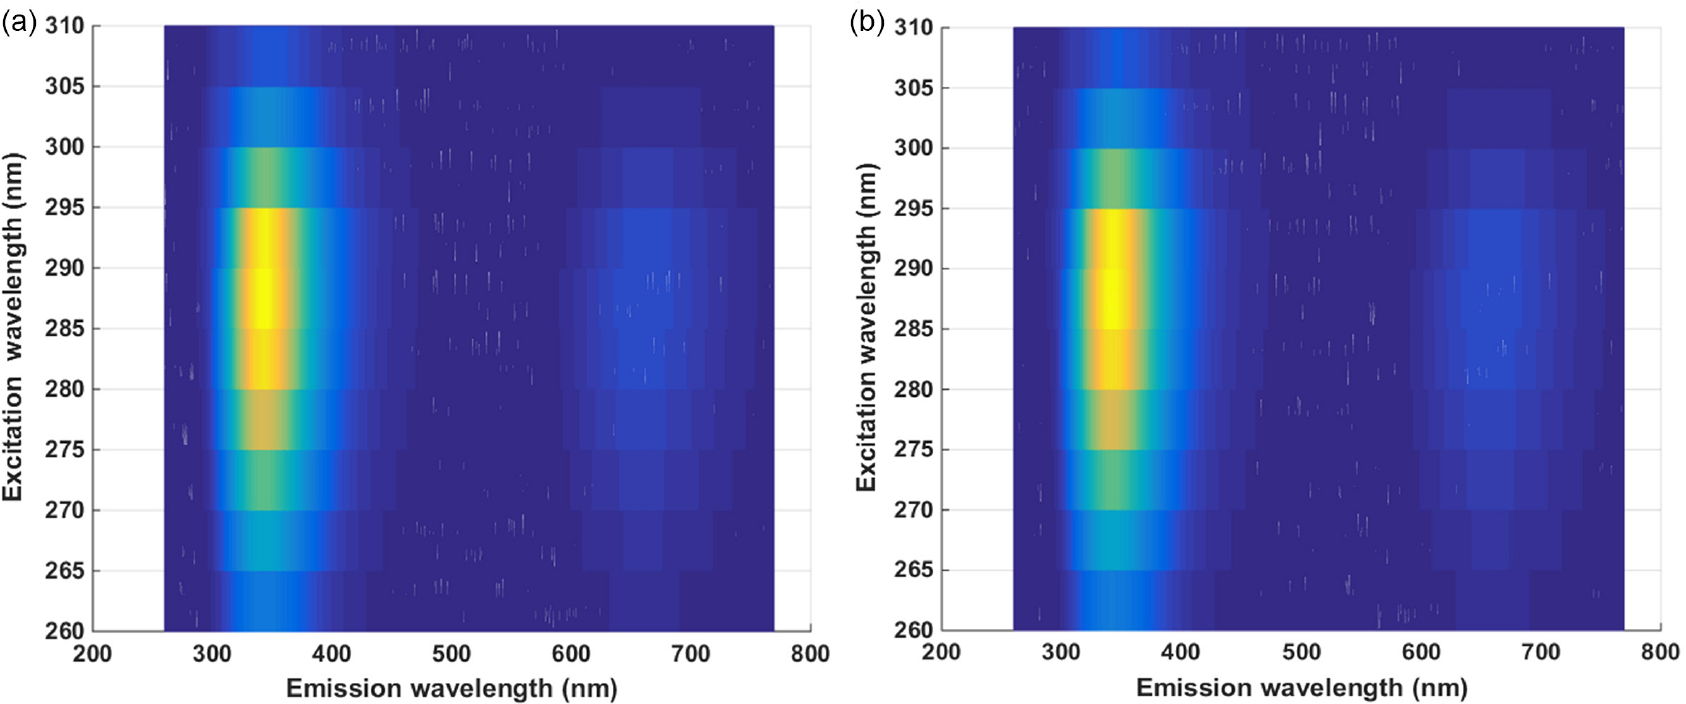
Figure 1 shows, in a top-down view, the average EEM spectra obtained from blood plasma samples of HIV-negative pregnant women (Figure 1a) and pregnant women living with HIV (Figure 1b). These spectra were pre-processed by removing Rayleigh and Raman scattering. In both groups, a region of higher intensity is observed between approximately 290 and 420 nm and another of lower intensity between 580 and 740 nm.
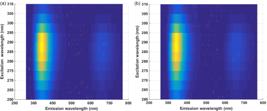
Top view representation of pre-processed excitation-emission matrix molecular fluorescence (EEM) spectra obtained from blood plasma samples: (a) healthy group and (b) pregnant women living with HIV.
Comparative analysis based on the three-dimensional representation of the spectra (Supplementary Information) reveals a slightly higher fluorescence signal intensity in the group living with HIV within the spectral range of approximately 290-420 nm. This increase may be associated with metabolic changes induced by viral infection, since this region can be attributed to endogenous molecules such as elastin, tryptophan, tyrosine, albumin, reduced nicotinamide adenine dinucleotide (NADH), reduced nicotinamide adenine dinucleotide phosphate (NAD(P)H), and collagen.50-52 The weaker band observed between 580 and 740 nm may correspond to the emission of compounds such as lipids and vitamins.16,22,50,51
However, the difference between the spectral profiles of the two classes should not be considered significant, as these spectra represent averages of individual spectra. When the spectra of both classes are plotted together, a large degree of overlap and similarity is evident, preventing direct discrimination between groups.
Therefore, multivariate analyses (Tucker3-QDA and n-PLS-DA) were performed to extract and visualize relevant features32 that highlight differences between classes. To evaluate model performance, the following figures of merit were calculated: accuracy, sensitivity, specificity, F-score, and G-score.
Tucker3-QDA
Correct classification rates (CC%) for the Tucker3-QDA and n-PLS-DA models used in this study are presented in Table 1. The Tucker3-QDA model was constructed using four factors, selected based on singular value decomposition (SVD), which explained 99.50% of the data variance. The model showed moderate fit, with most CC% values above 75%, despite limited classification performance for the control class during training, with only 50% correct. This suggests lower learning capacity for control class patterns compared with the individuals living with HIV class. Classification was more satisfactory for the case group, achieving an 88.88% correct rate. In the test set, the correct classification rate was 75% for both classes.
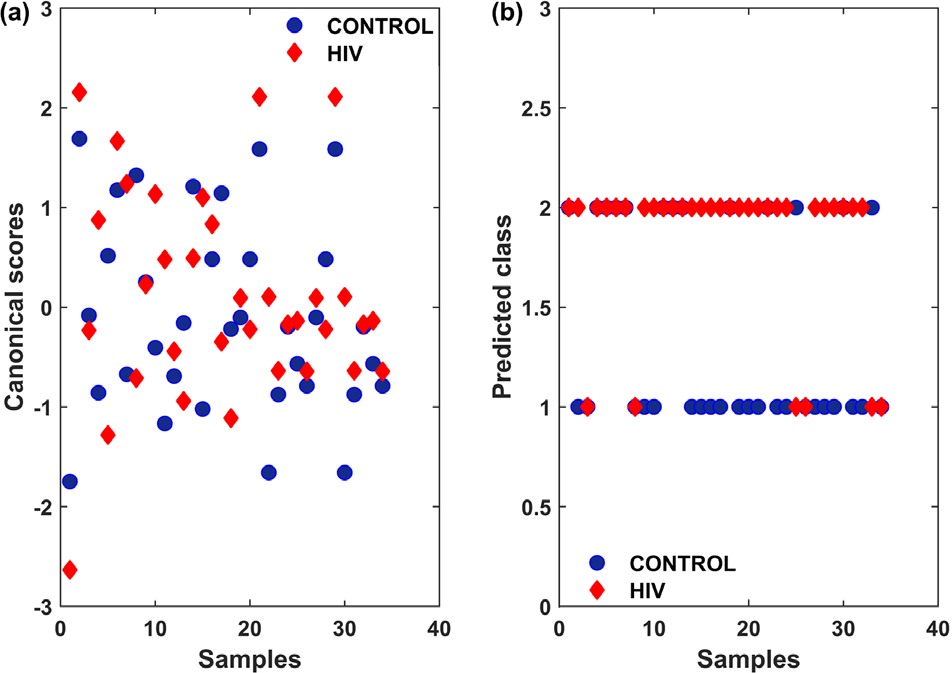
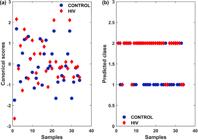
Canonical scores and predicted class values for the Tucker3-QDA model are shown in Figure 2. The canonical scores (Figure 2a) exhibit overlap between classes. After applying the QDA classification algorithm (Figure 2b), a clearer separation between classes was observed, resulting in higher classification accuracy. Nevertheless, some overlap remained, particularly due to the presence of several control samples within the case sample space. This distribution, together with CC% values, indicates that the model learned pregnant women living with HIV class patterns more effectively than patterns of the healthy control class.
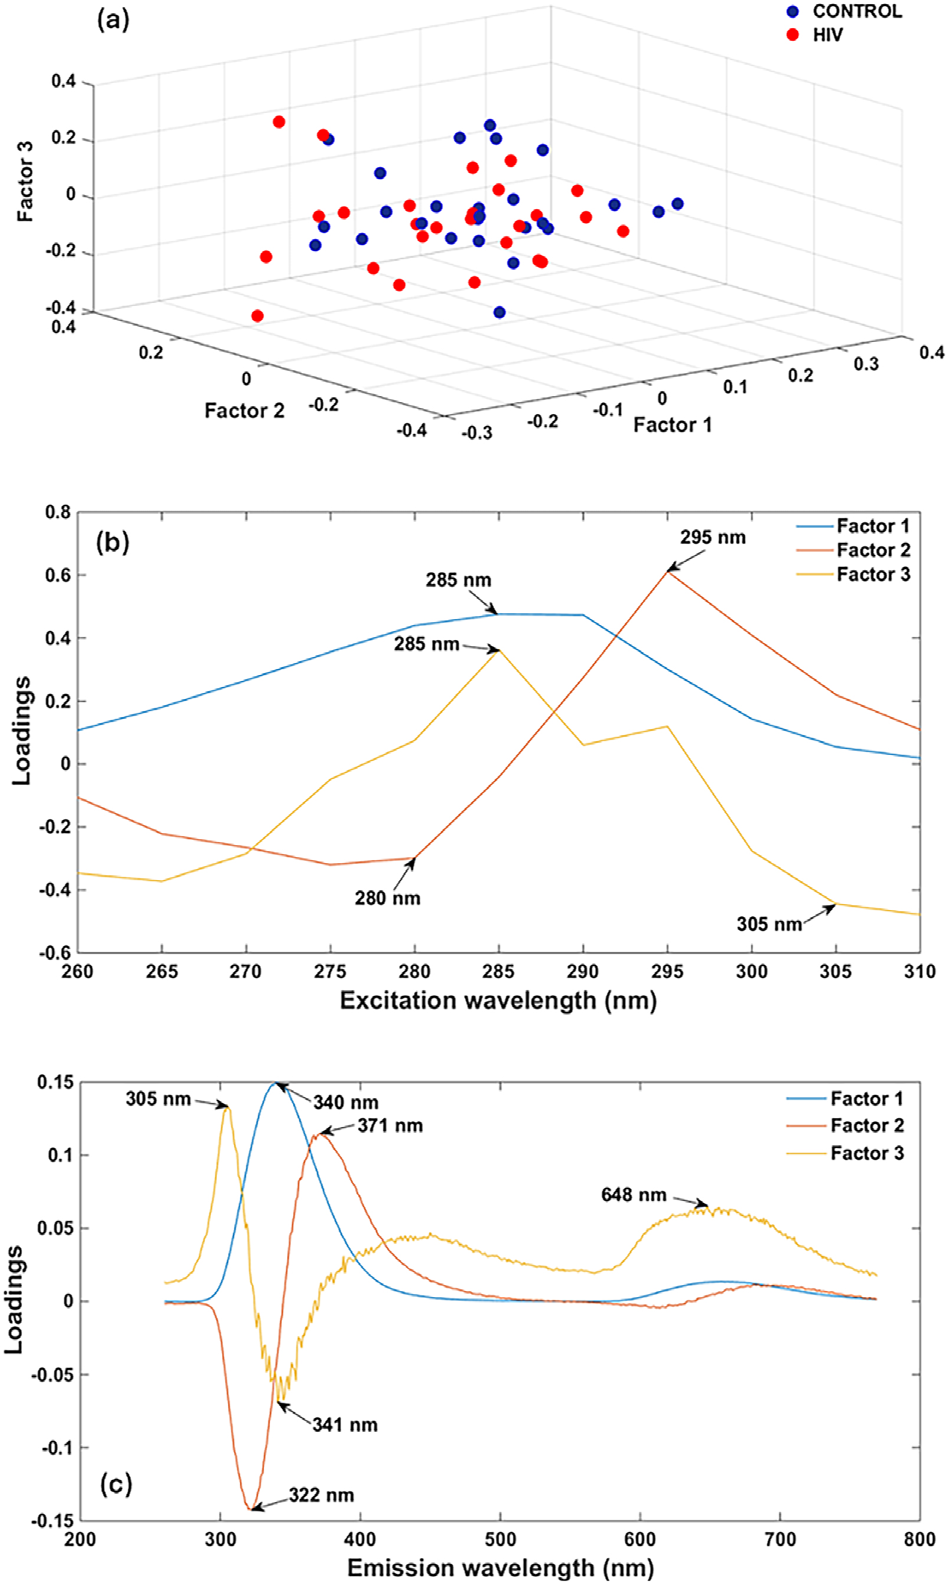
Although the Tucker3-QDA model explained the highest variance with four factors, chemical information is lost in loadings when models include too many factors.16 Therefore, excitation and emission loading plots in Figure 3 were constructed using the first three factors. Tucker3 scores (Figure 3a) did not reveal clear separation between healthy and individuals living with HIV groups, due to strong overlap. Excitation and emission loadings identified the most relevant wavelengths for class differentiation: for excitation 280, 285, 295 and 305 nm (Figure 3b); for emission, 305, 322, 340, 341, 371 and 648 nm (Figure 3c).
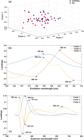
Scores and loadings for the first three factors selected for the Tucker3. (a) Scores; (b) loadings for excitation; and (c) loadings for emission.
n-PLS-DA
The n-PLS-DA model was constructed with seven latent variables, selected by cross-validation, considering the lowest classification error obtained in the training and validation sets, explaining 94.67% of the data variance. In terms of correct classification rates (Table 1), n-PLS-DA outperformed Tucker3-QDA, except in the test stage, where both models achieved 75% for the control group. In the training stage, the classification rate was 100% for both classes, indicating that all samples were correctly assigned. In the test stage, the model maintained satisfactory performance, with 75% correct for the control class and 87.5% for the case class, demonstrating good generalization capacity. These results indicate a well-fitted model capable of generating scores correlated with sample characteristics, thereby enabling class differentiation.16,22
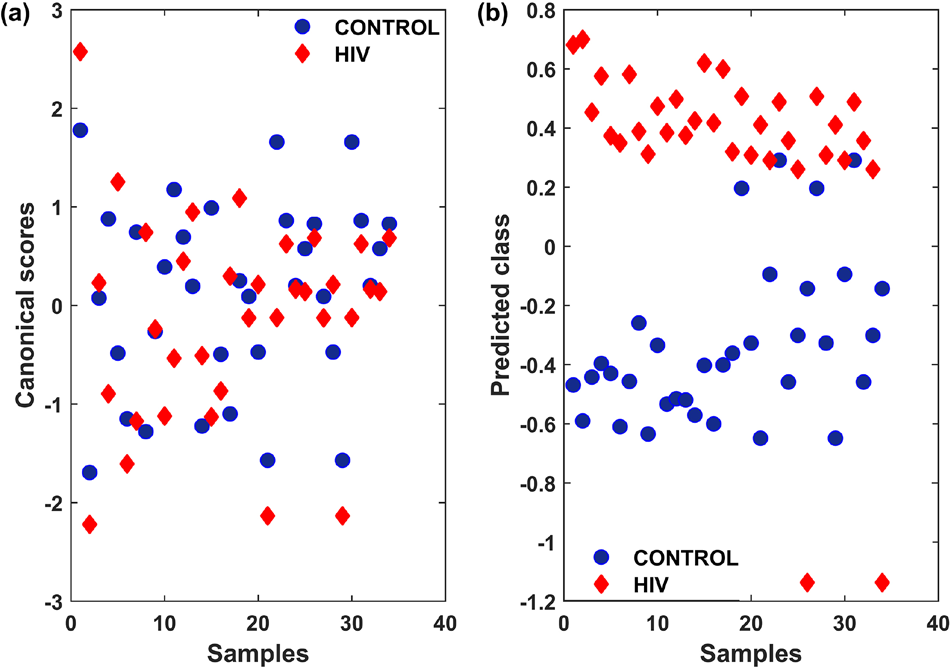
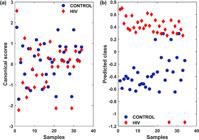
Figure 4 presents the canonical scores for the seven latent variables (Figure 4a), showing class overlap. Predicted class values (Figure 4b), however, reveal clear separation, confirming the effectiveness of the model.
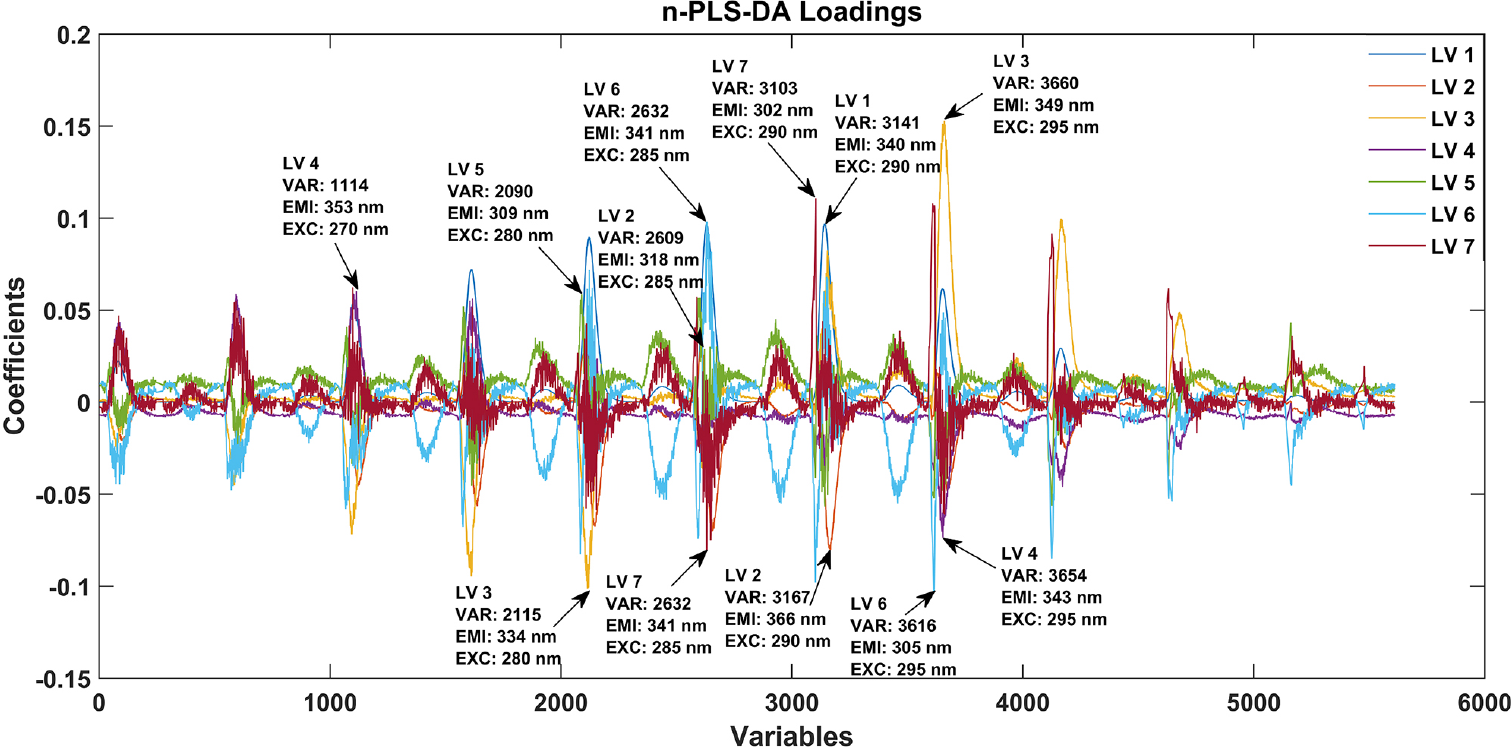
The loading plot of the unfolded data for the seven latent variables of n-PLS-DA (Figure 5) highlights the most relevant excitation and emission wavelengths for class discrimination: 270, 280, 285, 290, and 295 nm (excitation); and 302, 305, 309, 318, 334, 340, 341, 349, 353, and 366 nm (emission). These wavelengths can be interpreted as relevant information from biological markers,16,22 associated with HIV structural components or metabolic alterations induced by infection. As obligate intracellular parasites, viruses rely on host cell metabolism for replication and survival, leading to modifications in host metabolic pathways.53
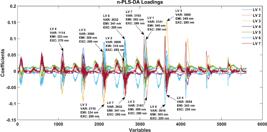
Loadings to the seven latent variables of the n-PLS-DA. VAR: variable; EMI: emission; EXC: excitation.
Excitation wavelengths at 280 and 295 nm and emission wavelengths at 309, 349, 353, and 366 nm identified in the n-PLS-DA model can be attributed to tryptophan, whereas excitation at 270 nm and emission at 340 nm may be associated with tyrosine.50,51,54,55 HIV infection alters the metabolism of amino acids such as tryptophan and tyrosine.56 In HIV-infected individuals, immune activation is associated with increased kynurenine/tryptophan (Kyn/Trp) and phenylalanine/tyrosine (Phe/Tyr) ratios in the blood.57 The infection induces higher expression of indoleamine 2,3-dioxygenase (IDO), the enzyme responsible for converting tryptophan into kynurenine, thereby accelerating this metabolic pathway. As a result, the Kyn/Trp ratio increases, reflecting decreased tryptophan and elevated kynurenine levels.58,59
Conversely, the increased Phe/Tyr ratio observed HIV infected individuals may be linked to oxidative stress arising from immune activation and inflammation, which impairs the activity of phenylalanine hydroxylase (PAH), the enzyme responsible for converting phenylalanine into tyrosine. This reduction in PAH activity leads to diminished phenylalanine metabolism, resulting in higher phenylalanine concentrations and depletion of tyrosine levels.58,60
Clinical studies58-61 have also shown that elevated Kyn/Trp and Phe/Tyr ratios correlate with increased viral load (HIV-RNA levels) and reduced CD4+ cell counts. Therefore, the spectral differences observed between the classes can be attributed to lower concentrations of tryptophan and tyrosine in samples from the case group compared with the control group.
Table 2 presents the figures of merit calculated to assess built models. The n-PLS-DA model demonstrated superior performance compared with Tucker3-QDA. Specifically, n-PLS-DA achieved higher accuracy (81.25 vs. 75.00%), reflecting higher overall correct classification, considering true and false negatives. The sensitivity of the n-PLS-DA model was 87.50%, allowing for the correct identification of a greater number of positive samples. Both models presented identical specificity (75.00%), indicating equivalent performance in identifying negative samples. Additionally, n-PLS-DA achieved higher F-score (80.77%) and G-score (81.07%) values, demonstrating better balance between sensitivity and precision and greater robustness in classification.
When comparing our results with previous multivariate classification studies using spectroscopic techniques on the same analytical matrix, fluorescence spectroscopy (EEM) demonstrated comparable accuracy and sensitivity, although specificity was lower.11,14 In a study by Sitole et al.15 using ATR-FTIR on serum samples, figures of merit exceeded those observed here. Although the methodology presented in this work achieved slightly lower performance metrics, likely due to the limited number of samples, it remains a viable alternative due to its experimental simplicity. Furthermore, EEM offers higher sensitivity and selectivity compared with Raman and IR spectroscopy.
The results in Table 2 are promising and highlight the potential of EEM fluorescence spectroscopy, combined with chemometrics, using blood plasma to diagnose pregnant women living with HIV. Although sensitivity and specificity values do not yet meet the World Health Organization standards (≥ 99% sensitivity and ≥ 98% specificity),62 the proposed methodology offers significant advantages over conventional diagnostic techniques. These include rapid analysis, with EEM acquisition in seconds and diagnostic results in minutes, and the absence of reagent requirements, reinforcing its practical and cost-effective nature.
In addition to technical feasibility, the immediacy of results provides a key clinical advantage, particularly in prenatal care, where early HIV detection enables timely initiation of antiretroviral therapy and consequent reduction of vertical transmission risk.
Although the spectral assignments presented here are preliminary, the identification of key excitation and emission wavelengths provides a consistent starting point for future studies correlating fluorescence signals with biomolecules associated with HIV infection.
After validating the technique with a larger number of samples and identifying the biochemical origin of the spectral signature associated with HIV, approaches based on synchronous fluorescence could be explored as complementary screening methods due to their greater speed and selectivity. In this technique, spectra are obtained by simultaneously scanning the excitation and emission wavelengths, keeping the difference between them constant (Stokes shift, ∆λ).63,64 Since selectivity depends on the prior choice of this parameter,65 its application requires prior knowledge of the spectral signature associated with HIV.
Conclusions
This study demonstrated the potential of excitation-emission matrix (EEM) molecular fluorescence spectroscopy, combined with multi-way classification algorithms, to discriminate blood plasma samples from HIV-negative and pregnant women living with HIV.
For higher-order data classification, Tucker3-QDA and n-PLS-DA models were applied, with the latter showing better classification performance in the investigated dataset. The most relevant excitation and emission wavelengths for class separation suggest tryptophan and tyrosine as possible biomarkers, consistent with clinical studies reporting reduced levels of these amino acids in HIV infected patients.
This work represents a promising, rapid, minimally invasive, simple, label-free and low-cost approach that may enable early HIV diagnosis in pregnant women, thereby contributing to the implementation of effective preventive measures against vertical transmission of the virus.
Supplementary Information
Supplementary material 1
Supplementary information is available free of charge at http://jbcs.sbq.org.br as PDF file.
Acknowledgments
The authors would like to thank the PPGQ, the Institute of Chemistry, and the Central Analytical at the UFRN. L. G. S. and G. L. F. acknowledge the CAPES (Finance Code 001). H. K. T. A. S. acknowledges the CNPq [grant numbers: 173825/2023-0 and 178008/2024-9 (PDJ)] and the INCT-CiMol (CNPq 406804/2022-2) for funding. R. F. D. S. thanks the IFRN. A. B. F. C. would like to thank the CAPES/PIPD-PPGQ (Brazil), code 88887.082609/2024-00 for the financial support.
This work was supported by the CAPES, Brazil, Finance Code 001.
Data Availability Statement
The excitation-emission matrix (EEM) fluorescence data obtained from plasma samples are publicly available at https://drive.google.com/drive/folders/1eZ-5vHg3U9m_5PJuumQ_J1dOz9V0NdU4?usp=drive_link. All files are openly accessible and comprise the complete dataset used in this study.
References
-
1 HIV and AIDS; World Health Organization, 2025. [Link] accessed in February 2026
» Link -
2 Pneumocystis Pneumonia - Los Angeles; Centers for Disease Control and Prevention (CDC), 1981. [Link] accessed in February 2026
» Link -
3 Global HIV & AIDS Statistics - Fact Sheet; UNAIDS. [Link] accessed in February 2026
» Link -
4 Bekker, L.-G.; Beyrer, C.; Mgodi, N.; Lewin, S. R.; Delany-Moretlwe, S.; Taiwo, B.; Masters, M. C.; Lazarus, J. V.; Nat. Rev. Dis. Primers 2023, 9, 42. [Crossref]
» Crossref -
5 World Health Organization (WHO); Global Health Sector Strategies on, Respectively, HIV, Viral Hepatitis and Sexually Transmitted Infections for the Period 2022-2030; WHO: Geneva, 2022. [Link] accessed in February 2026
» Link -
6 Ministério da Saúde; Boletim Epidemiológico HIV e Aids 2024; Secretaria de Vigilância em Saúde e Ambiente, Ministério da Saúde: Brasília, 2024. [Link] accessed in February 2026
» Link -
7 de Lima, S. S.; Silva, L. C. S.; dos Santos, M. V.; Martins, J. P.; de Oliveira, M. C.; Brasileiro, M. E.; Ciência & Saúde 2017, 10, 56. [Crossref]
» Crossref -
8 da Rosa, M. C.; da Silva, N. M. O.; da Hora, V. P.; Revista Brasileira de Análises Clínicas 2016, 48, 301. [Link] accessed in February 2026
» Link -
9 Ministério da Saúde; Protocolo Clínico e Diretrizes Terapêuticas para Prevenção da Transmissão Vertical do HIV, Sífilis e Hepatites Virais; Ministério da Saúde, Secretaria de Ciência, Tecnologia, Inovação e Insumos Estratégicos em Saúde, Secretaria de Vigilância em Saúde: Brasília, DF, 2022. [Link] accessed in February 2026
» Link -
10 Ministério da Saúde; Manual Técnico para o Diagnóstico da Infecção pelo HIV em Adultos e Crianças; Ministério da Saúde, Secretaria de Vigilância em Saúde, Departamento de Vigilância, Prevenção e Controle das Infecções Sexualmente Transmissíveis, do HIV/Aids e das Hepatites Virais: Brasília-DF, 2018. [Link] accessed in February 2026
» Link -
11 Silva, L. G.; Péres, A. F. S.; Freitas, D. L. D.; Morais, C. L. M.; Martin, F. L.; Crispim, J. C. O.; Lima, K. M. G.; Sci. Rep. 2020, 10, 20156. [Crossref]
» Crossref -
12 Sakudo, A.; Tsenkova, R.; Onozuka, T.; Morita, K.; Li, S.; Warachit, J.; Iwabu, Y.; Li, G.; Onodera, T.; Ikuta, K.; Microbiol. Immunol. 2005, 49, 695. [Crossref]
» Crossref -
13 Pizarro, C.; Esteban-Díez, I.; Arenzana-Rámila, I.; González Sáiz, J. M.; J. Biophotonics 2018, 11, e201700035. [Crossref]
» Crossref -
14 Freitas, D. L. D.; Peres, A. F. S.; Silva, L. G.; Mariz, J. V. M.; Santos, M. G.; Morais, R. S. P.; Morais, C. L. M.; Martin, F. L.; Pascoal, D. A. V.; Camargo, J. D. A. S.; Crispim, J. C. O.; Lima, K. M. G.; Sci. Rep. 2021, 11, 22609. [Crossref]
» Crossref -
15 Sitole, L.; Steffens, F.; Krüger, T. P. J.; Meyer, D.; OMICS 2014, 18, 513. [Crossref]
» Crossref -
16 dos Santos, R. F.; Paraskevaidi, M.; Mann, D. M. A.; Allsop, D.; Santos, M. C. D.; Morais, C. L. M.; Lima, K. M. G.; Sci. Rep. 2022, 12, 16199. [Crossref]
» Crossref -
17 Saffarian, S.; Viruses 2021, 13, 223. [Crossref]
» Crossref -
18 Carravilla, P.; Nieva, J. L.; Eggeling, C.; Viruses 2020, 12, 348. [Crossref]
» Crossref -
19 Inamdar, K.; Floderer, C.; Favard, C.; Muriaux, D.; Viruses 2019, 11, 72. [Crossref]
» Crossref -
20 Hanne, J.; Göttfert, F.; Schimer, J.; Anders-Össwein, M.; Konvalinka, J.; Engelhardt, J.; Müller, B.; Hell, S. W.; Kräusslich, H.-G.; ACS Nano 2016, 10, 8215. [Crossref]
» Crossref -
21 Kungl, A. J.; Seidel, C.; Schilk, A.; Daly, T. J.; Kauffmann, H. F.; Auer, M.; J. Fluoresc. 1994, 4, 299. [Crossref]
» Crossref -
22 Santos, M. C. D.; Monteiro, J. D.; Araújo, J. M. G.; Lima, K. M. G.; Sci. Rep. 2020, 10, 13758. [Crossref]
» Crossref -
23 dos Santos, R. F.; Paraskevaidi, M.; Lima, K. M. G.; Appl. Spectrosc. Rev. 2023, 58, 869. [Crossref]
» Crossref - 24 Skoog, D. A.; West, D. M.; Holler, F. J.; Crouch, S. R.; Fundamentals of Analytical Chemistry, 10th ed.; Cengage Learning: Boston, 2022.
-
25 Hung, J.; Lam, S.; Leriche, J. C.; Palcic, B.; Lasers Surg. Med. 1991, 11, 99. [Crossref]
» Crossref -
26 Mahadevan, A.; Mitchell, M. F.; Silva, E.; Thomsen, S.; Richards-Kortum, R. R.; Lasers Surg. Med. 1993, 13, 647. [Crossref]
» Crossref -
27 Kapadia, C. R.; Cutruzzola, F. W.; O’Brien, K. M.; Stetz, M. L.; Enriquez, R.; Deckelbaum, L. I.; Gastroenterology 1990, 99, 150. [Crossref]
» Crossref - 28 Smilde, A. K.; Bro, R.; Geladi, P.; Multi-Way Analysis with Applications in the Chemical Sciences; John Wiley & Sons: Chichester, England, 2004.
- 29 Olivieri, A. C.; Escandar, G. M.; Practical Three-Way Calibration; Elsevier: Waltham, MA, 2014.
-
30 Zepp, R. G.; Sheldon, W. M.; Moran, M. A.; Mar. Chem. 2004, 89, 15. [Crossref]
» Crossref -
31 Kennard, R. W.; Stone, L. A.; Technometrics 1969, 11, 137. [Crossref]
» Crossref -
32 Morais, C. L. M.; Lima, K. M. G.; Singh, M.; Martin, F. L.; Nat. Protoc. 2020, 15, 2143. [Crossref]
» Crossref -
33 Tucker, L. R.; Psychometrika 1966, 31, 279. [Crossref]
» Crossref -
34 Henrion, R.; Chemom. Intell. Lab. Syst. 1994, 25, 1. [Crossref]
» Crossref - 35 Brereton, R. G.; Chemometrics: Data Analysis for the Laboratory and Chemical Plant; John Wiley & Sons: Chichester, 2003.
-
36 Sena, M. M.; Trevisan, M. G.; Poppi, R. J.; Quim. Nova 2005, 28, 910. [Crossref]
» Crossref -
37 Pravdova, V.; Estienne, F.; Walczak, B.; Massart, D. L.; Chemom. Intell. Lab. Syst. 2001, 59, 75. [Crossref]
» Crossref - 38 Graham, A.; Kronecker Products and Matrix Calculus: With Applications; Horwood: Chichester, England, 1981.
-
39 Morais, C. L. M.; Lima, K. M. G.; Martin, F. L.; Chemom. Intell. Lab. Syst. 2019, 188, 46. [Crossref]
» Crossref -
40 Azcarate, S. M.; Gomes, A. A.; de la Peña, A. M.; Goicoechea, H. C.; TrAC, Trends Anal. Chem. 2018, 107, 151. [Crossref]
» Crossref -
41 Dixon, S. J.; Brereton, R. G.; Chemom. Intell. Lab. Syst. 2009, 95, 1. [Crossref]
» Crossref -
42 Silva, H. K. T. A.; Barbosa, T. M.; Santos, M. C. D.; Jales, J. T.; de Araújo, A. M. U.; Morais, C. L. M.; de Lima, L. A. S.; Bicudo, T. C.; Gama, R. A.; Marinho, P. A.; Lima, K. M. G.; Acta Trop. 2023, 238, 106779. [Crossref]
» Crossref -
43 Bro, R.; J. Chemom. 1996, 10, 47. [Crossref]
» Crossref -
44 Azcarate, S. M.; Gomes, A. A.; Alcaraz, M. R.; de Araújo, M. C. U.; Camiña, J. M.; Goicoechea, H. C.; Food Chem. 2015, 184, 214. [Crossref]
» Crossref -
45 Ouertani, S. S.; Mazerolles, G.; Boccard, J.; Rudaz, S.; Hanafi, M.; Chemom. Intell. Lab. Syst. 2014, 133, 25. [Crossref]
» Crossref -
46 Liu, Z.-Z.; Gu, H.-W.; Guo, X.-Z.; Geng, T.; Li, C.-L.; Liu, G.-X.; Wang, Z.-S.; Li, X.-C.; Chen, W.; Spectrochim. Acta, Part A 2022, 281, 121596. [Crossref]
» Crossref -
47 Arancibia, J. A.; Boschetti, C. E.; Olivieri, A. C.; Escandar, G. M.; Anal. Chem. 2008, 80, 2789. [Crossref]
» Crossref -
48 Morais, C. L. M.; Lima, K. M. G.; Chemom. Intell. Lab. Syst. 2017, 170, 1. [Crossref]
» Crossref -
49 Oliveri, P.; Downey, G.; TrAC, Trends Anal. Chem. 2012, 35, 74. [Crossref]
» Crossref -
50 Shrirao, A. B.; Schloss, R. S.; Fritz, Z.; Shrirao, M. V.; Rosen, R.; Yarmush, M. L.; Biotechnol. Bioeng. 2021, 118, 4550. [Crossref]
» Crossref -
51 Rossi, G.; Durek, J.; Ojha, S.; Schlüter, O. K.; Curr. Res. Food. Sci. 2021, 4, 862. [Crossref]
» Crossref -
52 Shi, L.; Lu, L.; Harvey, G.; Harvey, T.; Rodríguez-Contreras, A.; Alfano, R. R.; Sci. Rep. 2017, 7, 2599. [Crossref]
» Crossref -
53 Sáez-Cirión, A.; Sereti, I.; Nat. Rev. Immunol. 2021, 21, 5. [Crossref]
» Crossref -
54 Atif, M.; AlSalhi, M. S.; Devanesan, S.; Masilamani, V.; Farhat, K.; Rabah, D.; Photodiagn. Photodyn. Ther. 2018, 23, 40. [Crossref]
» Crossref - 55 Lakowicz, J. R.; Principles of Fluorescence Spectroscopy, 3rd ed.; Springer: New York, 2006.
-
56 Innocenti, G. P.; Santinelli, L.; Laghi, L.; Borrazzo, C.; Pinacchio, C.; Fratino, M.; Celani, L.; Cavallari, E. N.; Scagnolari, C.; Frasca, F.; Antonelli, G.; Mastroianni, C. M.; d’Ettorre, G.; Ceccarelli, G.; Metabolites 2020, 10, 274. [Crossref]
» Crossref -
57 Gostner, J. M.; Becker, K.; Kurz, K.; Fuchs, D.; Front. Psychiatry 2015, 6, 97. [Crossref]
» Crossref -
58 Yuan, Z.-W.; Gan, H.-L.; Jin, H.-L.; Feng, X.-Y.; Wang, M.; Zhou, H.-P.; Zhang, J.; J. Clin. Lab. Anal. 2023, 37, e24795. [Crossref]
» Crossref -
59 Zhou, Y.-H.; Sun, L.; Chen, J.; Sun, W.-W.; Ma, L.; Han, Y.; Jin, X.; Zhao, Q.-X.; Li, T.; Lu, H.; Qiu, X.; Wang, J.-H.; mBio 2019, 10, e02591-19. [Crossref]
» Crossref -
60 Zangerle, R.; Kurz, K.; Neurauter, G.; Kitchen, M.; Sarcletti, M.; Fuchs, D.; Brain, Behav., Immun. 2010, 24, 403. [Crossref]
» Crossref -
61 Byakwaga, H.; Boum, Y.; Huang, Y.; Muzoora, C.; Kembabazi, A.; Weiser, S. D.; Bennett, J.; Cao, H.; Haberer, J. E.; Deeks, S. G.; Bangsberg, D. R.; McCune, J. M.; Martin, J. N.; Hunt, P. W.; J. Infect. Dis. 2014, 210, 383. [Crossref]
» Crossref -
62 World Health Organization (WHO); Consolidated Guidelines on HIV Prevention, Testing, Treatment, Service Delivery and Monitoring: Recommendations for a Public Health Approach; WHO: Geneva, 2021. [Link] accessed in February 2026
» Link -
63 Zacharioudaki, D.-E.; Fitilis, I.; Kotti, M.; Molecules 2022, 27, 4801. [Crossref]
» Crossref -
64 Gu, H.; Hu, L.; Dong, Y.; Chen, Q.; Wei, Z. J.; Lv, R.; Zhou, Q.; J. Food Compos. Anal. 2024, 131, 106212. [Crossref]
» Crossref -
65 Rodrigues, J. M.; Salmazzo, G. R.; Capato, C. F.; Falcão, E. A.; Caires, A. R. L.; Botero, E. R.; Ciência e Natura 2014, 36, 782. [Crossref]
» Crossref
Edited by
-
Editor handled this article: Josué Carinhanha Caldas Santos (Associate)