
Abstract
The current investigation focuses on the results of an experimental investigation of Square-plan-shape and Remodel-triangle-shape building model’s varied interference conditions between duplicate building models of 1:300 scale (at 100% blockage) on wind-induced pressure and base moments at fixed 10% of the height of the instrumented model. Under current working conditions, the study concludes that -1 > Interference Factor > 1 as experienced by the Remodel-triangle-shape model results in reduced performance of the instrumented model as opposed to the Square-plan-shape model. Front-to-Front interference condition of Remodel-triangle-shape model has the best overall performance in along-wind and crosswind directions, whereas Front-to-Back interference condition of Remodel-triangle-shape model has the best torsional performance. Back-to-Back interference of a Remodel-triangle-shape model should be avoided because the orientation of duplicate models attracts the most overturning moments in both the along-wind and crosswind directions of all interference conditions investigated in this study.
Keywords:
Tall building; mean pressure coefficients; interference factor; base force; overturning moment
1 INTRODUCTION
Tall buildings, as per Xu et al. (2014Xu, A., Xie, Z. N., Fu, J. Y., Wu, J. R. and Tuan, A. (2014). Evaluation of wind loads on super-tall buildings from field-measured wind-induced acceleration response, Structural Design Tall Special Buildings 23:641-663. DOI: 10.1002/tal.1065.
https://doi.org/10.1002/tal.1065....
) are more prone to wind vibrations and receptive to dynamic loads. Further, Zheng et al. (2018Zheng, C., Xie, Y., Khan, M., Wu, Y., Liu, J. (2018). Wind-induced responses of tall buildings under combined aerodynamic control, Engineering Structures 175:86-100.) stated that from the improvement of cross-section, the buildings enhance their wind resistance. Wind-induced accelerations, as mentioned by Farouk (2016Farouk, M. I. (2016). Check the comfort of occupants in high rise building using CFD, Ain Shams Engineering Journal 7:953-958.) might cause discomfort to the occupants and so are taken into account as one of the most utility criteria whereas designing tall buildings. This variation of the wind-induced load is because of the event of high turbulence of wind at the instrumented building model. Although ample quantity data is accessible in numerous international standards (AS/ NZS: 1170.2:2011, ASCE: 7-02 (2002), BS 6399-2:1997, EN 1991-1-4:2005/AC: 2010(E), and IS: 875 (Part 3): 2015) under isolated wind incidence conditions for square, rectangular, cylindrical, and so forth plan shape buildings. However, due to the difficulty of the problem, which involves a large number of variables in interference situations, no data is available in any international code. The pressure on the instrumented building may raise or reduce due to interference of other buildings' interference, depending on numerous factors. Raj et al. (2020Raj, R., Jha, S., Singh, S., Choudhary, S. (2020). Response analysis of plus shaped tall building with different bracing systems under wind load, International Journal of Advanced Research in Engineering and Technology (IJARET) 11(3):371-380.) proposed that the consequences of design under specification would be drastic, requiring exhaustive analytical and experimental study to evaluate realistic wind-induced conditions. Furthermore, the findings of this study can guide structural designers in deciding from a variety of inventive solutions to meet a structure's collapse and serviceability requirements in extreme wind conditions.
Now a day, with the improvement of structural structures and building materials the opportunity of creation of unconventional plan tall buildings is very high. Because of the many flow situations originating from the interaction of the wind with the structures, wind analysis is a task of high unconventionality if the building's plan is unusual. A collection of experimental and numerical work has been carried out to investigate wind-induced effects on isolated objects with various indifferent external shaped tall buildings, like Chakraborty et al. (2014Chakraborty, S., Dalui, S.K., Ahuja, A.K. (2014). Wind load on irregular plan shaped tall building - A case study, Wind and Structures 19(1):59-73.) and Raj and Ahuja (2013Raj, R., and Ahuja, A.K. (2013). Wind Loads on Cross Shape Tall Buildings, Journal of Academia and Industrial Research (JAIR) 2(2).) have explored “+” shape buildings, Paul and Dalui (2016Paul, R., and Dalui, S.K. (2016). Wind effects on ‘Z’ plan-shaped tall building: A case study, International Journal of Advanced Structural Engineering 8:319-335.) investigated “Z” shape buildings, Gomes et al. (2005Gomes, M.G., Rodrigues, A. M., Mendes, P. (2005). Experimental and numerical study of wind pressures on irregular-plan shapes, Journal of Wind Engineering and Industrial Aerodynamics 93:741-756.) investigated “L” and “U” shape buildings, Mallick et al. (2019Mallick, M., Kumar, A., and Patra, K. C. (2019). Experimental Investigation on the Wind-Induced Pressures on C-Shaped Buildings, KSCE Journal of Civil Engineering 23(8):3535-3546.) have studied “C” shape buildings, Li et al. (2017Li, Y., Li, S. Q., Chen, F. (2017). Wind tunnel study of wind-induced torques on L-shaped tall buildings, Journal of Wind Engineering and Industrial Aerodynamics 167:41-50.) have examined “L” shaped buildings, Bhattacharyya et al. (2014Bhattacharyya, B., Dalui, S.K., and Ahuja, A.K. (2014). Wind Induced Pressure on ‘E’ Plan Shaped Tall Buildings, Jordan Journal of Civil Engineering 8(2). https://doi.org/10.1016/j.engstruct.2018.08.031.
https://doi.org/10.1016/j.engstruct.2018...
) have investigated “E” shape buildings, Nagar et al. (2020Nagar, S.K., Raj, R., Dev, N. (2020). Experimental study of wind-induced pressures on tall buildings of different shapes, Wind and Structures 31(5):441-453. DOI: https://doi.org/10.12989/was.2020.31.5.441.
https://doi.org/10.12989/was.2020.31.5.4...
) have analysed “H” shape buildings, Alminhana et al. (2018Alminhana, G.W., Braun, A.L., Loredo-Souza, A.M. (2018). A numerical study on the aerodynamic performance of building cross sections using corner modifications, Latin American Journal of Solids and Structures. 15(7):e88. http://dx.doi.org/10.1590/1679-78254871.
http://dx.doi.org/10.1590/1679-78254871....
) have considered “CAARC tall building model” with corner modifications, Bandi et al. (2013Bandi, E. K., Tamura, Y., Yoshidaa, A., Kim, Y. C., and Yang, Q. (2013). Experimental investigation on aerodynamic characteristics of various triangular-section high-rise buildings, Journal of Wind Engineering and Industrial Aerodynamics 122:60-68.) have investigated “Triangular” shape building with diverse configurations and Pal et al. (2021Pal, S., Raj, R., and Anbukumar, S. (2021). Comparative study of wind induced mutual interference effects on square and Fish-plan-shape tall buildings, Sådhanå, Indian Academy of Sciences 46:86. https://doi.org/10.1007/s12046-021-01592-6.
https://doi.org/10.1007/s12046-021-01592...
) have investigated “Fish-plan Shape” model. The majority of researchers' interference studies, according to the existing literature, are aimed to determine the most useful configuration settings and/or interspacing among the obstructing models of rectangular or square plan shape buildings, as mentioned in the studies by Lam et al. (2011Lam, K. M., Zhao, J. G., Leung, M. Y. H. (2011). Wind-induced loading and dynamic responses of a row of tall buildings under strong interference, Journal of Wind Engineering and Industrial Aerodynamics 99:573-583.), Hui et al. (2012Hui, Y., Tamura, Y., Yoshida, A. (2012). Mutual interference effects between two high-rise building models with different shapes on local peak pressure coefficients, Journal of Wind Engineering and Industrial Aerodynamics 104-106:98-108.), Zu and Lam (2018aZu, G.B., and Lam, K.M. (2018a). Across-wind excitation mechanism for interference of twin tall buildings in staggered arrangement, Journal of Wind Engineering & Industrial Aerodynamics 177:167-185.,b), Yu et al. (2015Yu, X. F., Xie, Z. N., Zhu, J. B., and Gu, M. (2015). Interference effects on wind pressure distribution between two high-rise buildings, Journal of Wind Engineering and Industrial Aerodynamics 142:188-197.), and Mara et al. (2014Mara, T. G., Terry, B. K., Ho, T. C. E., and Isyumov, N. (2014). Aerodynamic and peak response interference factors for an upstream square building of identical height, Journal of Wind Engineering and Industrial Aerodynamics 133:200-210.). There are only a few studies in the literature that deal with interference effects on unusually shaped tall buildings as investigated by Amin and Ahuja (2012Amin, J.A. and Ahuja, A.K. (2012). Wind-Induced Mean Interference Effects Between Two Closed Spaced Buildings, KSCE Journal of Civil Engineering 16(1):119-131.), and Kar and Dalui (2016Kar, R., and Dalui, S. K. (2016). Wind interference effect on an octagonal plan shaped tall building due to square plan shaped tall buildings, International Journal of Advanced Structural Engineering 8:73-86. DOI 10.1007/s40091-016-0115-z.
https://doi.org/10.1007/s40091-016-0115-...
). As a result, interference observations of unconventional plan shape buildings with the same or different plan shape obstructing buildings are accounted for.
The current study focuses on a comparative experimental investigation of tall building models of the same volume with Square-plan-shape Figure 1(a) and Remodel-triangle-shape Figure 1(b) using an “Aerodynamic shape optimization” approach in an urban environment. As mentioned by Daemei et al. (2019Daemei, A. B., Khotbehsara, E. M., Nobarani, E. M., and Bahrami, P. (2019). Study on wind aerodynamic and flow characteristics of triangular shaped tall buildings and CFD simulation in order to assess drag coefficient, Ain Shams Engineering Journal 10:541-548.) aerodynamic behavior in buildings in urban environments is critical because it reduces turbulent wind behavior in this type of area. Minor modifications to the cross-sectional shape of a building, according to Gaur and Raj (2020Raj, R., Jha, S., Singh, S., Choudhary, S. (2020). Response analysis of plus shaped tall building with different bracing systems under wind load, International Journal of Advanced Research in Engineering and Technology (IJARET) 11(3):371-380.), could result in force and moment decrease.
The purpose of this research is to show differences in pressure distribution produced by various interference full blockage circumstances, as well as to distinguish changes in base force and the overturning moment when an unsymmetrical model's orientation varies. The term "full blockage" refers to shielding in which the obstructing model completely blocks the direct path of incident wind to the principal or instrumented model. Because these findings have not been absorbed into applicable standards and there is no insightful method for analyzing wind effects on intricate plan-shaped tall structures, the goal is to identify interference factors of duplicate Square-plan-shape and Remodel-triangle-shape tall structure models.
Isolated Remodel-triangle-shape structures are transformed triangular-plan-shape structures that are constructed on triangular plots; the Flatiron Building in New York is the best example (see Figure 2). Remodel-triangle-shape buildings have more room availability than triangular plan shaped buildings. The current study's findings emphasize the importance of cladding surface design by finding the position of high pressure and suction areas, as these regions generate significantly high external tension and compression on the building facade respectively, which contribute to cladding failure. Furthermore, assessments of base force and overturning moment are used to estimate the building's overall performance.
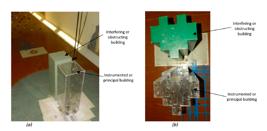
Downscale model in the wind tunnel of (a) Square-plan-shape model at Full Blockage and (b) Remodel-triangle-shape model at Front-to-Back interference conditions.

2. INVESTIGATION PROGRAM
2.1 Characteristics of Experimental setup
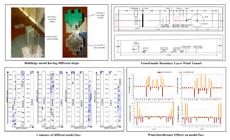
The tests were carried out in an open circuit boundary layer wind tunnel with a segment of 2m x 2m and a length of 15m. A square holed honeycomb is positioned at the wind tunnel's entrance to create a uniform flow of wind throughout the tunnel. Upstream, vortex generators are also being used to develop boundary layer flow conditions. Figure 3 depicts a graphic illustration of wind tunnel facilities. Because of the blower fan's suction, the air flowing constantly through the tunnel, maintaining a constant wind with mean velocity of 10 m/sec throughout the experiment. The manually rotating turntable accommodates the pressure model.

Pressure tapings made of steel tubes with a diameter of 1mm are set along the borders of each face to analyse the variations in pressure variation caused by flow separation. The pressure transducers, which are used to measure pressure with the help of Baron instrument, are coupled to these taping pressure points. The Baron Pressure Transducer used in this experiment can monitor pressure at each pressure tapping point at 10/100/1000 cycles per second. We collected data in the Boundary Layer Wind Tunnel at a frequency of 100 cycles per second for our research. The mean pressure is determined using fluctuating pressure data with each pressure tapping point having a time period of 170-180 seconds. The models' wind pressure is measured using a Baratron Pressure Transducer, which can monitor extremely low differential heads. The equipment "TESTO-480" is used to measure the wind velocity within the wind tunnel. This apparatus was coupled to a probe with a length of 1 m that was used to monitor wind velocity at various heights. The intensity of the turbulence is defined as the ratio of the standard deviation of fluctuating wind velocity to mean wind velocity.
The High-frequency force balance (HFFB) technique with a five-point load cell is used for base force and overturning moment measurements. For force and moment measurements, rigid models are fixed on the disc, placed at the center of the turntable. The disc is attached to the standard load cell that is mounted on a stable tripod on the floor of the laboratory. At the base of the model, there are five force components: two shear force components in the along-wind and crosswind directions, and three-moment components in the along-wind, crosswind, and torsional directions. A 5-component load cell by NISSO (LMC-5511-10) measures wind forces and moments (capacity: Fx=Fy=10 kg, Mx=My=4 kg-m, Mz=1kg-m). The load cell is located at the bottom of the models (below the tunnel floor). A sampling frequency of 250 Hz is used with a sampling time of 60 s, and a low-pass filter of 45 Hz is applied.
Figure 4 depicts the variation of wind's mean velocity and turbulence intensity. The power law equation (Equation 1) governs the boundary layer wind profile:
Where the mean velocity at height z above the ground is denoted by V.; Vo signifies the wind velocity at the reference height; z is the height of observation at the face of the model; zo is the reference height above the ground, and α is the Power law exponent. For the current wind tunnel experiment, the reference height above the ground is 900mm. The exponent of power law of the derived mean wind profile is 0.22. The mean wind velocity (V) observed at the top of the model is 10 m/s, while the turbulence intensity observed at the bottom is 12 percent.

2.2 Model Specifications
Models used for pressure measurement in scale 1:300 are made from transparent Perspex sheets with a thickness of 5mm, a height of 600mm, and a plan area of 40000mm2. Figure 5(a) and (b) show all of the measurements for plan and elevation viewpoints, respectively for the Square-plan-shape model (SPS) and the Remodel-triangle-shape model (RTS).
Figures 5(a) and 5(b) depict pressure tapings using black bullets. The pressure tapings are arranged at seven distinct observation levels to provide a comprehensive view of the pressure distribution on all of the models' faces and sides: 10mm, 60mm, 180mm, 300mm, 420mm, 540mm, and 590mm from the bottom. The coordinate system employed in this investigation is shown in Figure 5(c).
2.3 Obstructing conditions
At several side surfaces of the instrumented building, shear layer attachment and reattachment may be seen. The orientation of two obstructing buildings determines the reattachment position. Researchers have used model analysis to gain accurate information regarding wind structure interaction in the past. Blockage of induced wind in wind tunnels is a significant issue in interference research. Because of the surrounding building’s obstruction, the wind induced pressure on the instrumented building may increase or decrease, depending on a variety of parameters such as terrain category, the outer layout of the building, cross-sectional plan of the structure, aspect ratio, and many more. All the interference studies in the present experimental work deal with 100% blockage condition. The blockage in the present study is established by placing duplicate building models in various orientations. Because RTS building models are symmetrical along one axis, only four orientations with 100% blocking circumstances are included in this study, with a 10% gap between all duplicate plan models, i.e. 60mm, as indicated by Cook (1985Cook, N.J. (1985). The designers guide to wind loading of building structures, Part 2: Static structures, Building Research Establishment Report, Butterworths, London, UK.) and Houghton, and Carruthers (1976Houghton, E. L., and Carruthers, N.B. (1976). Wind forces on buildings and structures: An introduction, John Wiley & Sons, NJ, USA.). The present study's limitation is the lack of a detailed examination of tandem and staggered arrangements of duplicate SPS and RTS models at various angles of wind incidence. Such flaws will be investigated in future research programs. Figures 6 and 7 show the orientation of models used in the interference investigation for the SPS and RTS models, respectively.

Pressure taping arrangement at elevation and plan view for (a) SPS model; (b) RTS model (All units: mm); and (c) Wind force coordinates at RTS model

Interference condition at SPS for Full Blockage interference condition (FBl). (H is the total height of model= 600mm)
3. RESULTS AND DISCUSSIONS
3.1 Experimental data validation using international codes
An experimentation in the wind tunnel for an SPS building model in the isolated condition of 600mm height and 40000mm2 plan area in the current operating environment is carried out for validation. Various international codes were used to validate the experimental investigation (AS/ NZS: 1170.2:2011, ASCE: 7-02 (2002), BS 6399-2:1997, EN 1991-1-4:2005/AC: 2010(E), and IS: 875 (Part 3): 2015). It is discovered that the pressure coefficients of the isolating model's windward, leeward, and sidewalls as given in Table 1 have appreciable results when compared to the international coefficients.

Various Interference Conditions at RTS model for (a) Back-to-Back (BB); (b) Front-to-Back (FB); (c) Back-to-Front (BF) and (d) Front-to-Front (FF) interference conditions. (H is the total height of model= 600mm)
3.2 Mean wind pressure coefficients of models:
At any pressure measuring point, the mean pressure coefficient (Cp) is computed by normalizing the measured wind pressure at the corresponding measuring site with the following equation that is proposed in IS: 875 (Part 3): 2015:
Where Pa denotes the pressure at the respective tapping point.
Before constructing structures for collapse and serviceability situations, it is critical to understand the cross-section plan variation of the building and the corresponding wind pressure distribution. Maximum Cp, Average Cp (face value), and minimum Cp for each face for SPS and RTS models, respectively, are shown in Figure 8 and Figure 9. This critical stage establishes the locations and magnitudes of maximum pressure and suction. The location of high pressure and high suction for cladding surface design is critical because they create significantly high compression and high tension on the building facade, respectively, which contribute to cladding failure. Cladding materials may dislodge away due to suction during an incident with relatively severe winds. Flow separation at the faces causes suction pressure to be generated. Windows panes crack in suction regions, and the fragmented fragments scatter outside the building. While the point of view face values may sufficient in structural design, the minimum and maximum Cp magnitudes at a face make a considerable impact in actual conditions for cladding surface design.
When two buildings are so close together, wind pressures on the front surface become negative because of the instrumented building being immersed in the building wake, as shown in Figure 8. Consistency between the investigations led by Kim et al. (2013Kim, Y. C., and Kanda, J. (2013). Wind pressures on tapered and set-back tall buildings, Journal of Fluids and Structures 39:306-312.), and Zu and Lam (2018bZu, G.B., and Lam, K.M. (2018b). Across-wind excitation mechanism for interference of twin tall buildings in tandem arrangement, Wind and Structures 26(6):397-41.) at (x/D =15B, y=0) and the current study is seen with maximum suction, i.e. minimum Cp at the front face as -0.4. In full blockage conditions, the H-shaped model investigated by Nagar et al. (2020Nagar, S.K., Raj, R., Dev, N. (2020). Experimental study of wind-induced pressures on tall buildings of different shapes, Wind and Structures 31(5):441-453. DOI: https://doi.org/10.12989/was.2020.31.5.441.
https://doi.org/10.12989/was.2020.31.5.4...
) has a minimum Cp of approximately -0.64. The irregular exterior shape of the model causes stronger suction generation in H-shaped models unlike regular square and rectangular shape models. Maximum and minimum turbulence can be seen at Face-A and Face-C with 82% and 52% difference between the maximum and minimum Cp respectively. The face value of the windward face is -0.36 and the leeward face is -0.15 at the current obstructing condition.

Minimum, average, and maximum Cp distribution along SPS building model’s facade for FBl Interference Condition
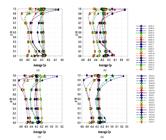
Figure 9 depicts the distribution of minimum and maximum Cpat a face surrounding a building facade for all obstructing Conditions for the RTS model. At BB (Figure 9(a)) largest variation between minimum Cp (-0.49) and maximum Cp (-0.04) is observed at Face-G and Face-O, which show 92% wind turbulence at the face. The 83% difference in maximum Cp (-0.09) and minimum Cp (-0.52) values at Face-K can be explained by the depressed posture of the face, which traps airflow between Face-J and Face-L. Due to the similar orientation of instrumented building model to incoming wind at BB and FB (Figure 9(b)) distribution of maximum and minimum Cp at a face along building facade show similarity. However, maximum Cp is found at Face-G and Face-O (0.06) and minimum Cp of -0.52 is seen at Face-I and Face-M. Kim et al. (2013Kim, Y. C., and Kanda, J. (2013). Wind pressures on tapered and set-back tall buildings, Journal of Fluids and Structures 39:306-312.) discovered that a tandem arrangement of duplicate square building models with a gap of 12.5 percent of the instrumented model's height results in maximum and minimum Cp of -0.1 and -0.4, respectively, at the front face. The large difference in results between the RTS model and other accessible research is due to cross-section differences between models.
Due to the change in the orientation of the instrumented model to incoming wind, the fluctuation of maximum and minimum Cp at a face along the building periphery in BF (Figure 9(c)) and FF (Figure 9(d)) interference circumstances display opposite behavior to that of BB and FB. Face-A to Face-G and Face-O to Face-T at both these interference conditions experience huge turbulence of wind due to the channeling effect at the interface of duplicate building models. The maximum fluctuation between maximum and minimum Cp is noticeable at Face-G and Face-Q. Face-A has a maximum suction of -0.62 at BF interference, and Face-B and Face-T have a maximum suction of -0.59 at FF interference.
The face values are the weighted average of Cp across a face, narrowing the pressure distribution to a single value, as demonstrated by IS 875 (part 3): 2015. As the direction of the incident wind varies, the magnitude and nature of face values at inner faces vary as well. The wind stream moving towards the leeward side encounters friction due to the surface roughness of the windward faces, reducing the speed of the stream. The magnitude of Cp and face average values at leeward faces decreases as the stream speed decreases. The face value of windward Face-A at FBl (-0.36) is approximately 18% lower than the face value of windward Face-K at BB (-0.44). For BB and FB, the least variation between face values and maximum and minimum Cp is observed between Face-A to Face-E and Face-Q to Face-T, whereas for BF and FF, the least variation is observed between Face-F to Face-P. The inconsistency in the test results of all the interference conditions of the RTS model is primarily due to a change in the orientation of the instrumented and obstructing models to each other as well as to incident wind. The face value of windward Face-A at Front-to-Front interference condition discovered by Pal et al. (2021Pal, S., Raj, R., and Anbukumar, S. (2021). Comparative study of wind induced mutual interference effects on square and Fish-plan-shape tall buildings, Sådhanå, Indian Academy of Sciences 46:86. https://doi.org/10.1007/s12046-021-01592-6.
https://doi.org/10.1007/s12046-021-01592...
) at the Fish-plan-shape model is -0.97, which is approximately 53% lower than the face value of windward Face-A at FF (-0.46). The difference in results between two models at similar operating conditions stands out due to the vast dimension of leeward Face-I at the model investigated by Pal et al. (2021), which generates a significant shielding effect on the instrumented building.

Minimum, average, and maximum Cp distribution along RTS building model’s facade for (a) BB; (b) FB; (c) BF; (d) FF Interference conditions
3.3 Distribution of average pressure coefficient along with the height of model for each face
Figure 10 and Figure 11 show variation of Average Cp (Avg Cp) along height for all faces at various obstructing conditions. All of the vertical line plots are simplified versions of sophisticated contour plots for faces, providing a more comprehensive depiction of Avg Cp fluctuation along with the height of each face. The comparative vertical line plots of all faces under various interference situations provide a fine image of the change in flow pattern along with faces.
The present investigation shows symmetrical flow pattern of Avg Cp distribution along with height at each observation level for all interference conditions for both models due to the symmetrical design of the models along the direction of wind occurrences. This phenomenon can also be seen in the study presented by Chakraborty et al. (2014Chakraborty, S., Dalui, S.K., Ahuja, A.K. (2014). Wind load on irregular plan shaped tall building - A case study, Wind and Structures 19(1):59-73.) for the '+' plan shape building model in a comparable working atmosphere.
The vertical centreline shows substantial variation along with height due to shielding of the instrumented model and vortex production at Face-A during the Full-blockage condition (Figure 10). Due to the symmetrical plan shape of the model to the wind direction, the distributions of Face-B and Face-D are identical. The instrumented model experiences no pressure throughout all surfaces due to the interference of the duplicate building model, and the maximum suction is lowered to around 56 percent of that in the isolated state.
Due to the symmetrical shape of the model to the incoming wind, opposite face pairs such as Face-B and Face-T, Face-C and Face-S, Face-D and Face-R, and so on, display comparable behavior throughout their height in Figure 11 for all interference situations. Turbulence at the face is represented by fluctuations in Avg Cp along with the height. Where a deviation to the negative side indicates the formation of a vortex, while a deviation to the positive side indicates the formation of a pressure area. The position and orientation of faces, as well as the instrumented building model to incident wind, have an impact on the position and production of turbulence and are hence viewed as having a high fluctuating Avg Cp distribution.

Distribution of Average Cp at each observation level along with height for SPS model for FBl interference condition
At RTS, the obstructing model functions as a shield for the downstream instrumented building model, putting all other faces of the instrumented model in the wake zone and causing suction. Due to the BB orientation of duplicate building models and the large size of the rear face between Face-G and Face-O of the instrumented model (Figure 11(a)), downstream faces are shielded (Face-A, Face-B to Face-H and Face-N to Face-T). Wind separation occurs at wide angles from the margins of Face-G and Face-O, resulting in a distribution of Avg Cp along with height for rear faces. Face-I, Face-J, Face-L, and Face-M depict facial turbulence. Due to the depressed position of Face-K, the Avg Cp distribution is entirely different from other faces.
The FB (Figure 11(b)) condition of the RTS duplicate building replicates the distribution of Avg Cp along with height for most faces in the same way that the BB condition does. However, change in the Avg Cp distribution is identified at Face-G, Face-H, Face-N, and Face-O due to the front orientation of obstructing building models. Again, the maximum distinction between experimental and regressed values is seen at Face-G and Face-O due to the fluid flow pattern around the building.
Due to the orientation of the instrumented model to the upstream obstructing model, the channeling effect is considerable at the interface of duplicate models at BF (Figure 11(c)) and FF (Figure 11(d). The distribution of nearby faces is essentially identical because of the channeling effect. The distribution at upstream faces is regulated by the transition point of the wind stream as well as the model's cross-sectional geometry, which, unlike ordinary SPS building models, is gradually increasing and then decreasing. In the analysis by Pal et al. (2021Pal, S., Raj, R., and Anbukumar, S. (2021). Comparative study of wind induced mutual interference effects on square and Fish-plan-shape tall buildings, Sådhanå, Indian Academy of Sciences 46:86. https://doi.org/10.1007/s12046-021-01592-6.
https://doi.org/10.1007/s12046-021-01592...
), in the Fish-plan shape model's Back-to-Back interference condition, the average Cp on windward Face-I fluctuates between -0.39 and -0.32, while it fluctuates between -1.1 and -0.92 on leeward Face-A. At the BB of RTS, however, the average Cp on the windward Face-K is between -0.52 and -0.09, while the average Cp on the leeward Face-A is between -0.29 and -0.25. Variations in the test results under the previously mentioned conditions clearly show that the distribution of Avg Cp along each measurement level is determined by the model's external shape, regardless of all other similar experimental settings.
3.4 Interference factor
The interference effect is a phenomenon created by one or more objects obstructing fluid flow from reaching the instrumented or test object. The impact of interference on the instrumented tall building is investigated using this factor. For specified positions, Equation 3 suggested by Zu and Lam (2018bZu, G.B., and Lam, K.M. (2018b). Across-wind excitation mechanism for interference of twin tall buildings in tandem arrangement, Wind and Structures 26(6):397-41.) gives the interference factor:
Wre Cpi is the mean pressure coefficient for a respective pressure tapping point.
Distribution of Average Cp at each observation level along with height for FSP model at (a) BB; (b) FB; (c) BF and (d) FF interference condition
Due to a gap of 10% of the height of the instrumented model between duplicate building models at FBl for SPS (Figure 12), IF lies between -1 and 1, indicating the improved performance of the instrumented model due to interference effect with both decreases in pressure and suction as represented by these magnitudes. The amplitude of pressure/or suction is lowered due to the shielding effect due to full blockage in the current experimental setting with a 10% clear space between the duplicate SPS models. Furthermore, IF>0 at Face-B, Face-C, and Face-D imply that the nature of pressure at the pressure point is identified in the presence and absence of an obstructing building model, however, IF<0 at Face-A implies that the nature of pressure differs due to the shielding effect.
Kim and Kanda (2013Kim, Y. C., and Kanda, J. (2013). Wind pressures on tapered and set-back tall buildings, Journal of Fluids and Structures 39:306-312.) discovered that the maximum suctions rise with the height of the obstructing building in their interference investigation. Moving forward Hui et al. (2013Hui, Y., Yoshida, A., and Tamura, Y. (2013). Interference effects between two rectangular-section high-rise buildings on local peak pressure coefficients, Journal of Fluids and Structures 37:120-133.) noted in their interference investigation that careful investigation at the edges and corners is necessary since these sections are concentrated and subject to large pressure changes.
Due to the unconventional cross-section plan shape of the model with gradual increase and then decrease of cross-section plan magnitude, which is unlike the SPS building model and also unlike any other interference studies, very high turbulence is seen at some faces of all interference conditions at the RTS instrumented building in Figure 13(a) to (d).
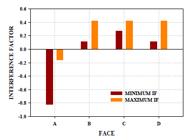
Minimum and maximum Interference Factors at a face for SPS model at FBl interference condition.

Minimum and maximum Interference Factors at a face for RTS model at (a) BB; (b) FB; (c) BF; and (d) FF interference conditions.
Figure 14 shows IF contour plots with -1<IF and IF>1 as these values show the increase in turbulence at the instrumented building model. Maximum and minimum IF at a face for BB(Figure 13(a)) lies at Face-G and Face-O of magnitude 5.44 and -7.1. Due to the shielding effect of the obstructing model, such a large variance in IF accounts for a lot of turbulence at these faces. Face-H to Face-N (Figure 14(a)) is found to have a maximum IF (7.65), with IF>1 is seen to be distributed from H/2 to H. Due to depressed positioning of Face-J and Face-L IF>1 is experienced at the face at top H/10.
Due to the position of faces at the interface of duplicate obstructing building models and therefore influenced by channeling effect at the position, the greatest influence of obstructing building with IF > 1 is consistently distributed from H/10 to 9H/10 at Face-H and Face-N under FB interference (Figure 14 (b)). At BF (Figure 14 (c)) and FF (Figure 14 (d)), the maximum influence of the obstructing building model is evident from the IF contour plot of Face-E (also Face-Q) with IF > 1 distributed along with the height of faces.

Contours of IF at instrumented building's facades for selective faces for RTS model at (a) BB; (b) FB; (c) BF; and (d) FF interference conditions.
3.5 Base Force Coefficients
The aerodynamic forces are found in two orthogonal directions considering geometry axes of the body (body axes). In the present work, forces are resolved in two orthogonal directions based on wind axes for all wind directions. The forces in the direction of the axis, parallel to the wind direction are considered as along-wind force and termed as ‘drag’, and forces in orthogonal direction are considered as crosswind force and termed as ‘lift’.
Lam et al. (2008Lam, K.M., Leung, M.Y.H., Zhao, J.G. (2008). Interference effects on wind loading of a row of closely spaced tall buildings, J. Wind Eng. Ind. Aerodyn. 96:562-583.) and Yu et al. (2018Yu, X., Xie, Z., Gu, M. (2018). Interference effects between two tall buildings with different section sizes on wind-induced acceleration, Journal of Wind Engineering & Industrial Aerodynamics 182:16-26.) in their studies proposed equations for Force coefficients are the representation of forces and calculated with the help of Equation 4:
Where CD and CL are the base force coefficients in along wind and crosswind directions respectively; FD & FL are the base wind forces in along wind and crosswind directions respectively. B is the breadth in the direction perpendicular to the wind; D is the model depth in the direction parallel to the wind; q H = 0.5ρV 2 stands for the reference wind dynamic pressure and ρ is the air mass density = 1.25 kg/m 3.
The external shapes of tall buildings are widely accepted to play a vital influence in the development of wind loads on high-rise structures, according to Cook (1985Cook, N.J. (1985). The designers guide to wind loading of building structures, Part 2: Static structures, Building Research Establishment Report, Butterworths, London, UK.), Ding and Kareem (2020Ding, F., and Kareem, A. (2020). Tall buildings with dynamic facade under winds, Engineering. https://doi.org/10.1016/j.eng.2020.07.020
https://doi.org/10.1016/j.eng.2020.07.02...
), and Elshaer and Bitsuamlak (2018Elshaer, A., Bitsuamlak, G. (2018). Multiobjective Aerodynamic Optimization of Tall Building Openings for Wind-Induced Load Reduction, Journal of Structural Engineering. 144(10):04018198. DOI: 10.1061/(ASCE)ST.1943-541X.0002199.
https://doi.org/10.1061/(ASCE)ST.1943-54...
). Furthermore, Sakamoto and Haniu (1988Sakamoto, H., Haniu, H. (1988). Aerodynamic forces acting on two square prisms placed vertically in a turbulent boundary layer, Wind Eng. Ind. Aerodyn. 31:41-66.) and Song J. et al. (2016Song, J., Tse, K.T., Tamura, Y., Kareem, A. (2016). Aerodynamics of closely spaced buildings: With application to linked buildings, J. Wind Eng. Ind. Aerodyn. 149:1-16.) reported that the gap distance between the obstructing models has no significant effect on the coefficient of drag force CD and coefficient of lift force CL of the instrumented model.
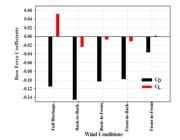
Due to the symmetrical cross-sectional shape of models along with the incident wind direction, an enormous decrease in CL as compared to CD is seen in Figure 15 for all interference conditions. The dominant wind direction in the current study is demonstrated by along-wind conditions. Due to the shielding effect, the Avg Cp distribution of all interference conditions reveals that the instrumented structure is under suction. According to IS: 875 (Part 3): 2015, the shielding effect describes a situation in which wind must transmit through any structure(s) positioned on the upstream wind side before approaching the instrumented structure. Under all interference conditions, faces at the interface between the duplicate models experience maximum suction. The magnitude of the coefficients, and the nature of force and pressure at the interfaces, influence the resulting force and pressure direction. As a result, the net pressure and net drag force coefficient's outcome are negative.
BB has the highest CD of -0.145, followed by FBl, which has a CD of -0.114 and a 21% decrease. The FF interference condition has the lowest CD (-0.036) and CL (0.002) values, indicating the best performance of the instrumented structure. FBl shows a maximum CL of 0.052, indicating high lift forces across all interference conditions. The coefficients of drag and lift force for obstructing cases are heavily influenced by the orientation of the instrumented and obstructing model, as demonstrated in the current study. In a similar working environment to Pal et al. (2021Pal, S., Raj, R., and Anbukumar, S. (2021). Comparative study of wind induced mutual interference effects on square and Fish-plan-shape tall buildings, Sådhanå, Indian Academy of Sciences 46:86. https://doi.org/10.1007/s12046-021-01592-6.
https://doi.org/10.1007/s12046-021-01592...
), the highest CD = -0.43 is manifested by the Front-to-Back interference condition at the Fish-plan shape model, whereas the highest CD = -0.145 is manifested by BB of RTS in the current study.
3.6 Overturning moment coefficients
Using Equation 5, Bandi et al. (2013Bandi, E. K., Tamura, Y., Yoshidaa, A., Kim, Y. C., and Yang, Q. (2013). Experimental investigation on aerodynamic characteristics of various triangular-section high-rise buildings, Journal of Wind Engineering and Industrial Aerodynamics 122:60-68.) provided an equation for computing the Overturning moment (OTM) coefficients:
Where, CMD, CML & CMT are the Base Overturning Moment coefficients in along wind, crosswind, and torsional mode directions respectively; and MD, ML & MT are the along-wind, crosswind, and torsional mode directions.
OTM provides a broad picture of the overall efficiency of the building model under different wind conditions. Figure 16 shows base OTM coefficients in along-wind (CMD), crosswind (CML) and torsional (CMT) directions. FF has the best overall performance in along-wind and crosswind direction with the least CMD and CML, of -0.00011 and 0.0029, respectively. FB, on the other hand, has the best torsion performance, with -0.00012 CMT. Overall maximum torsion (CMT) of -0.0053 is observed at FBl of SPS model. The maximum directionless dimension of CMD is shown by FBl of SPS, which is followed by BB of RTS with a 31% percent drop in CMD. BB of SPS has the highest directionless dimension of CML, followed by FBl of SPS, which has a 14% drop in CML. BB at RTS and FBl at SPS should be avoided among all interference conditions because this orientation of duplicate buildings attracts high CMD and CML.
Bandi et al. (2013Bandi, E. K., Tamura, Y., Yoshidaa, A., Kim, Y. C., and Yang, Q. (2013). Experimental investigation on aerodynamic characteristics of various triangular-section high-rise buildings, Journal of Wind Engineering and Industrial Aerodynamics 122:60-68.) in their study have calculated Along-wind moment and crosswind moment profiles for various configurations of the square-plan tall building and found that the properties of wind excited building depends upon the exterior shape of the building. As in the present study, the external shape of the building is constant for BB, BF, FB, and FF it can be said that the OTMs also depend upon the orientation of the instrumented and obstructing building model to the direction of wind incidence.

Overturning moment (OTM) coefficients for SPS and RTS model for all interference conditions
4 CONCLUSIONS
The purpose of this paper is to investigate the effects of interference of duplicate SPS and RTS building models at various 100% blockage conditions. The experiments were carried out in conditions with an exponent of power law of 0.22 and a steady wind of velocity 10 m/sec. Both models have a plan area of 40000mm2. The current study demonstrates that the model geometry and orientation of duplicate building models other have a significant impact on the pressure and force induced on the building model. The following are the key findings of the current study:
-
Because the Cp values of the RTS building model differ from those of the Square and Rectangular shape building models, the results of structural and cladding design from regular plan shape buildings at similar working conditions will not suffice.
-
Maximum suction of instrumented model at FBl condition (-0.40) is reduced to about 40% to that at the isolated condition of SPS model (-0.67) at same working conditions.
-
Among interference conditions at RTS model, maximum suction as experienced by FF interference condition (-0.56) which about 40% higher than that at SPS model at FBl interference condition (-0.40).
-
Due to the unconventional cross-section plan of the model with gradual increase and then decrease, which is unlike the SPS building model and unlike any other interference studies, there is very high turbulence at some faces of all interference conditions at the RTS instrumented building.
-
-1>IF>1, as observed at the RTS model, reduces the performance of the instrumented model in terms of the generation of high suction regions due to the obstructing building model, in contrast to the SPS model under the current working conditions.
-
The RTS model's FF interference condition has the best performance level in both the along-wind and crosswind directions, with CMD and CML of -0.00011 and 0.0029, respectively.
-
The FB interference condition of the RTS model has the best torsional performance, with CMT of -0.00012 whereas; SPS mode at FBl interference condition has the least torsional performance with CMT of -0.0053.
-
BB interference of a RTS model should be avoided because the orientation of duplicate models attracts the most overturning moments in both the along-wind and crosswind directions of all interference conditions investigated in this study.
-
In current study, the orientation of the instrumented and obstructing building models to the incident wind direction, as well as the external shape of irregularly shaped buildings, have a significant impact on base forces and overturning moments.
ACKNOWLEDGMENT
Prof. A. K. Ahuja, Visiting Faculty, Civil Engineering Department, IIT Jammu, (India) is gratefully acknowledged. This experiment would not have been possible without his help and invaluable suggestions.
REFERENCES
- Alminhana, G.W., Braun, A.L., Loredo-Souza, A.M. (2018). A numerical study on the aerodynamic performance of building cross sections using corner modifications, Latin American Journal of Solids and Structures. 15(7):e88. http://dx.doi.org/10.1590/1679-78254871.
» http://dx.doi.org/10.1590/1679-78254871. - Amin, J.A. and Ahuja, A.K. (2012). Wind-Induced Mean Interference Effects Between Two Closed Spaced Buildings, KSCE Journal of Civil Engineering 16(1):119-131.
- AS/ NZS: 1170.2:2011, Structural design actions, Part 2: Wind actions, Australian/ New Zealand Standard (2011).
- ASCE: 7-02 (2002), Minimum Design Loads for Buildings and Other Structures (2002).
- Bandi, E. K., Tamura, Y., Yoshidaa, A., Kim, Y. C., and Yang, Q. (2013). Experimental investigation on aerodynamic characteristics of various triangular-section high-rise buildings, Journal of Wind Engineering and Industrial Aerodynamics 122:60-68.
- Bhattacharyya, B., Dalui, S.K., and Ahuja, A.K. (2014). Wind Induced Pressure on ‘E’ Plan Shaped Tall Buildings, Jordan Journal of Civil Engineering 8(2). https://doi.org/10.1016/j.engstruct.2018.08.031.
» https://doi.org/10.1016/j.engstruct.2018.08.031. - BS 6399-2:1997 British standard: loading for buildings part 2. Code of practice for wind loads, British Standard Institution, London (1997).
- Chakraborty, S., Dalui, S.K., Ahuja, A.K. (2014). Wind load on irregular plan shaped tall building - A case study, Wind and Structures 19(1):59-73.
- Cook, N.J. (1985). The designers guide to wind loading of building structures, Part 2: Static structures, Building Research Establishment Report, Butterworths, London, UK.
- Daemei, A. B., Khotbehsara, E. M., Nobarani, E. M., and Bahrami, P. (2019). Study on wind aerodynamic and flow characteristics of triangular shaped tall buildings and CFD simulation in order to assess drag coefficient, Ain Shams Engineering Journal 10:541-548.
- Ding, F., and Kareem, A. (2020). Tall buildings with dynamic facade under winds, Engineering. https://doi.org/10.1016/j.eng.2020.07.020
» https://doi.org/10.1016/j.eng.2020.07.020 - Elshaer, A., Bitsuamlak, G. (2018). Multiobjective Aerodynamic Optimization of Tall Building Openings for Wind-Induced Load Reduction, Journal of Structural Engineering. 144(10):04018198. DOI: 10.1061/(ASCE)ST.1943-541X.0002199.
» https://doi.org/10.1061/(ASCE)ST.1943-541X.0002199. - EN 1991-1-4:2005/AC: 2010(E), European Standard Eurocode 1: actions on structures-part 1-4: General actions -wind actions, European Committee for Standardization (CEN), Europe (2010).
- Farouk, M. I. (2016). Check the comfort of occupants in high rise building using CFD, Ain Shams Engineering Journal 7:953-958.
- Gaur, N. and Raj, R. (2020). Wind load Optimisation by Aerodynamic Mitigation Techniques for Tall Buildings-A Review, Solid State Technology 63(2s):5968-5986.
- Gomes, M.G., Rodrigues, A. M., Mendes, P. (2005). Experimental and numerical study of wind pressures on irregular-plan shapes, Journal of Wind Engineering and Industrial Aerodynamics 93:741-756.
- Houghton, E. L., and Carruthers, N.B. (1976). Wind forces on buildings and structures: An introduction, John Wiley & Sons, NJ, USA.
- Hui, Y., Tamura, Y., Yoshida, A. (2012). Mutual interference effects between two high-rise building models with different shapes on local peak pressure coefficients, Journal of Wind Engineering and Industrial Aerodynamics 104-106:98-108.
- Hui, Y., Yoshida, A., and Tamura, Y. (2013). Interference effects between two rectangular-section high-rise buildings on local peak pressure coefficients, Journal of Fluids and Structures 37:120-133.
- IS: 875- Part-3 (2015), Code of Practice for Design Loads (other than earthquake loads) for Buildings and Structures- Wind Loads, India.
- Raj, R., and Ahuja, A.K. (2013). Wind Loads on Cross Shape Tall Buildings, Journal of Academia and Industrial Research (JAIR) 2(2).
- Raj, R., Jha, S., Singh, S., Choudhary, S. (2020). Response analysis of plus shaped tall building with different bracing systems under wind load, International Journal of Advanced Research in Engineering and Technology (IJARET) 11(3):371-380.
- Kar, R., and Dalui, S. K. (2016). Wind interference effect on an octagonal plan shaped tall building due to square plan shaped tall buildings, International Journal of Advanced Structural Engineering 8:73-86. DOI 10.1007/s40091-016-0115-z.
» https://doi.org/10.1007/s40091-016-0115-z - Kim, W., Tamura, Y., and Yoshida, A. (2013). Simultaneous Measurement of Wind Pressures and Flow Patterns for Buildings with Interference Effect, Advances in Structural Engineering 16(2).
- Kim, Y. C., and Kanda, J. (2013). Wind pressures on tapered and set-back tall buildings, Journal of Fluids and Structures 39:306-312.
- Lam, K.M., Leung, M.Y.H., Zhao, J.G. (2008). Interference effects on wind loading of a row of closely spaced tall buildings, J. Wind Eng. Ind. Aerodyn. 96:562-583.
- Lam, K. M., Zhao, J. G., Leung, M. Y. H. (2011). Wind-induced loading and dynamic responses of a row of tall buildings under strong interference, Journal of Wind Engineering and Industrial Aerodynamics 99:573-583.
- Li, Y., Li, S. Q., Chen, F. (2017). Wind tunnel study of wind-induced torques on L-shaped tall buildings, Journal of Wind Engineering and Industrial Aerodynamics 167:41-50.
- Mallick, M., Kumar, A., and Patra, K. C. (2019). Experimental Investigation on the Wind-Induced Pressures on C-Shaped Buildings, KSCE Journal of Civil Engineering 23(8):3535-3546.
- Mara, T. G., Terry, B. K., Ho, T. C. E., and Isyumov, N. (2014). Aerodynamic and peak response interference factors for an upstream square building of identical height, Journal of Wind Engineering and Industrial Aerodynamics 133:200-210.
- Nagar, S.K., Raj, R., Dev, N. (2020). Experimental study of wind-induced pressures on tall buildings of different shapes, Wind and Structures 31(5):441-453. DOI: https://doi.org/10.12989/was.2020.31.5.441.
» https://doi.org/10.12989/was.2020.31.5.441. - Pal, S., Raj, R., and Anbukumar, S. (2021). Comparative study of wind induced mutual interference effects on square and Fish-plan-shape tall buildings, Sådhanå, Indian Academy of Sciences 46:86. https://doi.org/10.1007/s12046-021-01592-6.
» https://doi.org/10.1007/s12046-021-01592-6. - Paul, R., and Dalui, S.K. (2016). Wind effects on ‘Z’ plan-shaped tall building: A case study, International Journal of Advanced Structural Engineering 8:319-335.
- Sakamoto, H., Haniu, H. (1988). Aerodynamic forces acting on two square prisms placed vertically in a turbulent boundary layer, Wind Eng. Ind. Aerodyn. 31:41-66.
- Song, J., Tse, K.T., Tamura, Y., Kareem, A. (2016). Aerodynamics of closely spaced buildings: With application to linked buildings, J. Wind Eng. Ind. Aerodyn. 149:1-16.
- Xu, A., Xie, Z. N., Fu, J. Y., Wu, J. R. and Tuan, A. (2014). Evaluation of wind loads on super-tall buildings from field-measured wind-induced acceleration response, Structural Design Tall Special Buildings 23:641-663. DOI: 10.1002/tal.1065.
» https://doi.org/10.1002/tal.1065. - Yu, X. F., Xie, Z. N., Zhu, J. B., and Gu, M. (2015). Interference effects on wind pressure distribution between two high-rise buildings, Journal of Wind Engineering and Industrial Aerodynamics 142:188-197.
- Yu, X., Xie, Z., Gu, M. (2018). Interference effects between two tall buildings with different section sizes on wind-induced acceleration, Journal of Wind Engineering & Industrial Aerodynamics 182:16-26.
- Zheng, C., Xie, Y., Khan, M., Wu, Y., Liu, J. (2018). Wind-induced responses of tall buildings under combined aerodynamic control, Engineering Structures 175:86-100.
- Zu, G.B., and Lam, K.M. (2018a). Across-wind excitation mechanism for interference of twin tall buildings in staggered arrangement, Journal of Wind Engineering & Industrial Aerodynamics 177:167-185.
- Zu, G.B., and Lam, K.M. (2018b). Across-wind excitation mechanism for interference of twin tall buildings in tandem arrangement, Wind and Structures 26(6):397-41.
Edited by
Editor:
Publication Dates
-
Publication in this collection
26 July 2021 -
Date of issue
2021
History
-
Received
09 June 2021 -
Reviewed
16 June 2021 -
Accepted
16 June 2021 -
Published
23 June 2021


