Abstract
This paper investigates the behavior of a new form of V-shaped shear connector. The assessment of the proposed connector’s performance is conducted through an experimental work of fourteen push-out tests. The results show that the developed V-shaped shear connector is able to transfer higher shear load than the conventional shear connectors. In addition, its behavior is considered as ductile. Geometrical parameters of the connector are studied to observe their influence on its behavior. The experimental outcomes show that changing the length, width, and thickness of the connector significantly affects its ultimate strength while the connector's ductile behavior is preserved. Furthermore, the work proves that neither creating holes nor adding transverse reinforcement to the connector has significant effect on shear resistance and that the uplift-displacement of the connector is improved. A comprehensive comparison between the proposed shear connector and commonly used shear connectors is executed. Based on the experimental results, an empirical equation is suggested to predict the load capacity of the connector.
Keywords:
Shear connector; V-shaped shear connector; Reinforced concrete; Steel-concrete composite structures
1 INTRODUCTION
Shear connectors are essential elements in composite structures. They transfer the shear forces between steel and reinforced concrete components. In addition, they prevent any premature separation between the structural parts. Shear headed studs are the most used ones. Nevertheless, the single stud’s low load capacity, need for high voltage operation to install, and low fatigue strength are deemed to be the motivation to introduce alternative shear connectors (Shim et al. (2004Shim, C. S., Lee, P. G., & Yoon, T. Y. (2004). Static behavior of large stud shear connectors. Engineering structures, 26(12):1853-1860.), Xu et al. (2012Xu C, Sugiura K, Wu C, Su Q (2012). Parametrical static analysis on group studs with typical push-out tests. Journal of constructional steel research. 72:84-96.), Pallarés L & Hajjar (2010Pallarés L, Hajjar JF (2010). Headed steel stud anchors in composite structures, Part I: Shear. Journal of Constructional Steel Research. 66(2):198-212.), and Shen et al. (2020Shen, M. H., Chung, K. F., Elghazouli, A. Y., & Tong, J. Z. (2020). Structural behaviour of stud shear connections in composite floors with various connector arrangements and profiled deck configurations. Engineering Structures, 210, 110370.)). Thus, research has been conducted to develop different shear connectors.
Slutter and Driscoll (1965Slutter RG, Driscoll Jr. GC (1965). Flexural strength of steel and concrete composite beams. Journal of the Structural Division. 91(2):71-99.) have conducted 41 push-out tests to investigate the behavior of the channel connector. The study was mostly based on a channel of 100 mm high and 150 mm length. Their results were used to present an empirical equation that can predict the channel connector's strength. However, that equation is limited to a 100 mm height. Pashan and Hosain (2009Pashan A, Hosain MU (2009). New design equations for channel shear connectors in composite beams. Canadian journal of civil engineering. 36(9):1435-43.) extended the work on the channel shear connector. The work presents the results of 36 push-out specimens and discusses the effect of length and web thickness of the channel connector. In addition, it compares the strength of the connector embedded in a solid concrete slab and metal deck slab. The work proposes a formula to calculate the load capacity of the connector. In light of previous studies by others, Baran and Topkaya (2012Baran E, Topkaya C (2012). An experimental study on channel type shear connectors. Journal of Constructional Steel Research. 74:108-17.) conducted an experimental study of 15 push-out tests on the European shape of the channel connector, figure (1a). They aimed to assess the connector's behavior based on wider parameters, to study the deformation of the connector, and to present an equation that predicts the connector's strength based on the principles of mechanics.
Tahmasbi et al. (2016Tahmasbi F, Maleki S, Shariati M, Ramli Sulong NH, Tahir MM (2016). Shear capacity of C-shaped and L-shaped angle shear connectors. PloS one. 11(8):e0156989.) conducted two experimental sets to investigate the behavior of L-angle shape and C-shape connectors, figure (1b). They compared the results of both experimental sets and deployed them to validate a finite element model. The FE models were used to study the behavior of the connectors and execute parametric studies. The parametric studies focus on the effects of the length, width, and thickness of the connector, as well as concrete compressive strength. It was concluded that increasing the connector's height increases the shear capacity of the L-shaped connector, whereas it decreases the strength of the C-shaped connector. Conversely, increasing the length of the connector of L-shaped and C-shaped connectors increases the load capacities of both of them. The same conclusion was presented by Shariati et al. (2020bShariati, M., Tahmasbi, F., Mehrabi, P., Bahadori, A., & Toghroli, A. (2020b). Monotonic behavior of C and L shaped angle shear connectors within steel-concrete composite beams: an experimental investigation. Steel Compos Struct, 35(2), 237-247.) where they performed an experimental work to study the L and C-shape connectors. The study concluded that increasing the height of the C-shape connector of the same thickness reduces the shear capcity, whereas it enhances the performance and load of the L-shape connector. Kamar et al. (2021Kamar A, Lasheen M, Shaat A, Zaher A, Khalil A (2021). Numerical Evaluation of Mono-symmetric Steel-concrete Composite section provided with Angle and Channel Shear Connectors. International Journal of Research in Engineering & Management. 4(3):113-130) developed a nonlinear finite element model to study the behavior of composite beam provided with channel or anlgle shear connectors. It was concluded that increasing the slenderness ratio of the steel beam reduces the effective width of the reinforced concrete slab. In addition, the existence of upper reinforcement mesh enhances the performance of both the channel and angle shear connectors and reduces slip displacement between the slab and the steel beam.
Nouri et al. (2021Nouri, K., Sulong, N. R., Ibrahim, Z., & Shariati, M. (2021). Behaviour of novel stiffened angle shear connectors at ambient and elevated temperatures. Advanced Steel Construction, 17(1), 28-38.) proposed a novel stiffened angle shear connector, where a stiffener was welded to the back of the C-shaped angle connector. The experimental work was divided into two sets based on the stiffener height, where a full and half height were adopted in the study, figure (1c). In addition, the study examined the performance of the connector at different temperature 25 °C, 550 °C, 700 °C, and 850 °C. The work show that adding the stiffener to the C-shaped shear connector increses the load capacity. In addition, it is concluded that the connector’s width is more influential than it height. Moreover, Increasing the temperature increases the flexibility of the connector and reduces its load capacity, which can be attributed to the steel’s properties. Khorramian et al. (2015Khorramian K, Maleki S, Shariati M, Ramli Sulong NH (2015). Behavior of tilted angle shear connectors. PLoS one. 10(12):e0144288.) flipped the L-angle shear connector to shape a new connector called tilted angle shear connector, figure (1d). His work focused on studying the effect of the connector's inclination on its strength. Two angles were studied, 112.5 and 135 degrees. Moreover, he investigated the impact of the connector's geometry on its performance. It was deduced that the connector with 135 degrees as inclination has a higher shear capacity than the one with 112.5 degrees. That can be referred to the confinement of concrete beneath the connector. Additionally, he found that the 135 degrees tilted angle shear connector shows higher shear strength than the C-shaped shear connector and presents more ductility. The tilted angle shear connector was also studied by Shariati et al. (2020aShariati, M., Mafipour, M. S., Mehrabi, P., Shariati, A., Toghroli, A., Trung, N. T., & Salih, M. N. (2020a). A novel approach to predict shear strength of tilted angle connectors using artificial intelligence techniques. Engineering with Computers, 1-21.) where they used artificial intelligence techniques to predict its shear strength. The results of eight push-out tests were used for the artificial intelligence models. An adaptive neureo-fuzzy interface system was developed to select the influential parameters on the shear load of the connector and then creat the models. It is concluded that the slip and inclination of the connector are the most important parameter. In addition, the results show the ability of the technique to predict the shear strength of the tilted angle shear connector properly.
Titoum et al. (2016Titoum M, Mazoz A, Benanane A, Ouinas D (2016). Experimental study and finite element modelling of push-out tests on a new shear connector of I-shape. Advanced Steel Construction. 12(4):487-506.) conducted a series of push-out experiments to assess the feasibility of I-steel section as a shear connector, figure (1e). His work aimed to evaluate the effect of the I-section's geometries, concrete strength, and transverse reinforcement on the I-shaped connector's performance. The results of the study indicate that the I-shaped connector has a ductile behavior and that its shear strength and vertical displacement increase as the height or the length of the connector increases. Even so, the transverse reinforcement has no significant effect on the strength of the connector. It was noticed, though, that increasing the number of transverse rebars will show higher ductility. The work concluded that, due to the similarity between the I-shaped and C-shaped connectors' behavior, the same formula could be used to predict the shear load capacity.
Shariati et al. (2016Shariati M, Sulong NR, Shariati A, Khanouki MA (2016). Behavior of V-shaped angle shear connectors: experimental and parametric study. Materials and Structures. 49(9):3909-26.) presented a new type of shear connector called a V-shaped angle shear connector, figure (1f). The connector was formed by a steel angle that was welded to a steel beam. The connector was fixed to the flange of the beam with an inclination of 45-60 degrees in order to prevent any lateral displacement. The push-out tests were executed with different heights and lengths of the connectors under monotonic and cyclic loading. A wide range of geometrical variables was examined using a finite element model, which was validated using the experimental results. It was deduced that the larger the inclination of the connector, the less the shear resistance and that increasing the length of the connector increases the load capacity. In general, the study shows that the V-shaped angle's performance is better than the channel and angle connectors. Yet, it was noticed that the vertical slip of the connector is close to 6 mm. It was therefore recommended for practicality to use the V-shaped connector with a slope of 45 degrees at 50 mm length and a long leg. Another shape of the V shear connector was proposed. Bezerra et al. (2018Bezerra LM, Cavalcante OO, Chater L, Bonilla J (2018). V-shaped shear connector for composite steel-concrete beam. Journal of Constructional Steel Research. 150:162-74.) created the new profile out of a U-steel section that was cut into small pieces and then bent together, figure (1g). The aim was to present a shear connector with a large resisting area to the shear force. The experimental study examined the connector's load capacity with 2.65 mm and 3.75 mm as thickness. It was concluded that the connector could distribute the shear force equally in the concrete slab, which prevents internal stress concentration, although the external cracking of concrete is the same as the specimens with shear studs.
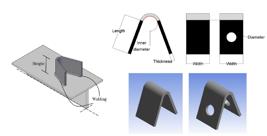
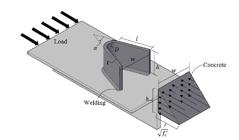
As a part of the ongoing effort to develop alternatives to the conventional shear connectors, this study is conducted to achieve the following objectives: a) propose an economical device, shear connector, to transfer high shear forces between steel-concrete elements, b) ensure the ductile behavior between the components of the composite structure, c) evaluate the behavior of the proposed connector and compare it with the conventional shear connectors, and d) present a formula to predict the load capacity of the connector. In order to accomplish the aforementioned goals, a developed V-shaped shear connector is produced. The shape of the new connector is readily formed by a cold steel plate bent into the V-shape. Figure (2) shows the shape of the connector and the geometrical parameters used to assess its performance. Variable parameters are tested by the push-out tests to investigate the behavior of the connector. Based on the experimental work outcomes, a comparison between the headed shear studs, channel connector, L-shaped shear connector, I-shaped shear connector, and the proposed shear connector is established. Further, the proposed V-shaped shear connector is compared with the other V-shaped shear connector. Finally, an empirical equation is recommended to calculate the connector's strength.
2 EXPERIMENTAL PROGRAM
2.1 Test specimens
Fourteen push-out specimens are fabricated to study the behavior of the V-shaped shear connector. The specimens are produced in accordance with the requirements of Eurocode EN-1994-1-2004, Design of Composite Steel and Concrete Structures. General Rules and Rules for Buildings (2004). The numbering of the samples is designated based on the geometry of the V-shaped connector. Table (1) shows the geometrical variables of the connector. It is shown that each set has two push-out specimens. The letter (V) indicates the connector's shape, where the other numbers point to the set's number and the specimen in the group. One parameter is changed at the time to assess the influence on the connector's load capacity and behavior. Based on the changing of some parameters, the width of the connector () is changed while the angle between the two legs of the connector is kept constant to 40°.
Each specimen consists of a steel beam of HEB 260 attached to two reinforced concrete slabs via shear connectors. Two shear connectors are welded to the flange of the HEB section, one at each side. The welding is designed based on the instructions of EN-EC3-1-8 (2005), where it is applied on both sides of the connector, figure (3). The reinforced concrete slabs are identical. The height, width, and thickness of the slabs are 600 mm, 600 mm, and 200 mm, respectively. Figure (3) shows the dimensions of the specimen and the formwork. A mesh of 10 mm bars reinforcement is used in each slab. Figure (4) shows the details of the reinforcement.
2.2 Materials
For each set of push-out specimens, three concrete cylinders are prepared during the casting. The cylinders are used to determine the compressive strength () and Young's modulus of elasticity (). Tensile tests for the structural and the reinforcement steel are carried out to determine the ultimate tensile strength (), yield strength (), and Young's modulus of elasticity (). Table (2) contains the mean values of steel and concrete properties.
2.3 Test set-up and procedure
The experiments are conducted by a compressive machine with an actuator of 2000 kN load capacity. Reinforced concrete blocks are placed under the specimens to make sure that both slabs are balanced equally. Blocks are used to raise the specimens to be close to the hydraulic cylinder. A 25 mm thickness plate is placed on the steel beam to distribute the load equally. Figure (5) shows the set-up of the push-out test.
Three cyclic loadings are carried out to check the experiment’s stability and prevent any eccentricity of the load. The load is applied gradually up to 150 kN, then returned to 30 kN three times. The rate of the loading is kept constant with 10 kN/min. Afterward, the specimens are subjected to an incremental loading up to failure. The loading rate is changed from 10 kN/min to 5 kN/min once the non-linear behavior of force-displacement relationship is observed. During the incremental loading, the vertical displacement of the steel beam and the ground is measured and the horizontal separation between the reinforced concrete slabs and the flanges are recorded, figure (5).
3 RESULTS AND DISCUSSION
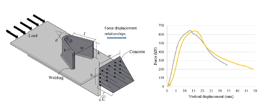
The assessment of the connector's performance is made based on the force-displacement relationships inclined towards EN-1994-1-2004. The maximum force () with corresponding vertical displacement () is obtained by dividing the force by 2 (the number of connectors in each push-out specimen). The characteristic load of the connector () is considered 90% of the least failure load, while () is the slip capacity which is corresponds to the characteristic load. The characteristic slip () is 90% of (). The force and vertical displacement at 80% of the least load capacity of the connector are calculated at and , respectively. Both values will be used to validate the load capacity of the connector against the uplift displacement () in accordance with the Eurocode EN-1994-1-2004, Design of Composite Steel and Concrete Structures. General Rules and Rules for Buildings (2004). Figure (6) depicts the variables needed to evaluate the behavior of the connector.
Based on the procedure mentioned above, the fourteen tests are carried out. Table (3) summarizes the outcomes of the experiments per connector. Specimens (V-1-1, V-1-2) are adopted to be the reference of the experiments. As shown in table (3), the connector's load capacity is 643.2 and 638.1 kN, while the average ultimate load is 640.7 kN. The corresponding displacements for both specimens are 13.3 and 15.9 mm. The difference between the load capacity is less than 0.5%, which supports the validity of the tests. Based on the Eurocode EN-1994-1-2004, Design of Composite Steel and Concrete Structures. General Rules and Rules for Buildings (2004) provisions, the connector is considered ductile, where the vertical slip of the connector exceeds 6mm.
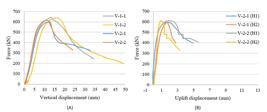
The characteristic load of the specimens V-1-1 and V-1-2 is 574.3 kN. On the other hand, the characteristic displacement is around 18.6 mm on average. Figure (7) shows the vertical and horizontal displacements' relationships with the forces in both tests, V-1-1 and V-1-2. The maximum corresponding horizontal displacement () to the maximum load is measured at LVDT V-1-2 (H1), which is 2.8 mm. In contrast, the horizontal displacement at 80% of the load () at the same LVDT is 0.9 mm. That points to the connector's validity in resisting the horizontal separation with the flanges, where does not exceed half of .
A) The force-vertical displacement relationships, B) the force - uplift displacement relationships of the specimens of V-1-1 and V-1-2.
In both specimens, crushing concrete failure is observed. Figure (8) shows the failure of the specimen V-1-2 (the cracks are marked to make it more visible. It is noticed that once the applied load exceeds 290 kN, the cracks are initiated at the bottom of the reinforced concrete slabs. Then, they propagate as the load is increased on the outer sides of the reinforced concrete slabs. The cracking of the inner sides of the slabs is developed as the load evolves, as well. The separation between the flanges and the slabs is clearly observed at the load of 360 kN. Based on the explained behavior of V-1-1 and V-1-2, the results of this experimental set will be used when comparing with the other test results.
3.1 Effects of the connector's thickness
Two push-out specimens with V-shaped shear connectors of 8 mm thickness are tested. The aim of these tests is to observe the differences in the connector's performance as its thickness is changed. Figure (9) shows the load capacity of the connector against the horizontal and vertical displacements. The average ultimate strength of the connector is 604.3 kN, with a corresponding displacement of around 11.7 mm. The average load capacity indicates a reduction of the load capacity of about 6%. Still, the same stiffness is acquired. Additionally, the failure mode in both tests is concrete crushing. The maximum uplift at 80% of the load is 0.86 mm at LVDT V-2-1 (H2), which is almost the same value obtained at LVDT V-1-1 (H2).
A) The force-vertical displacement relationships, B) the force - uplift displacement relationships of the specimens of V-2-1 and V-2-2.
3.2 Effects of the connector's curve
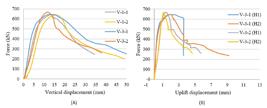
As explained, the connector is bent to shape a smooth curve. An inner half-circle is formed due to that bend, which helps to confine concrete inside the connector and avoid any stress concentrations. In this section, the connector's inner diameter is changed from 30 mm into 50 mm to investigate its influence on the connector's behavior. Figure (10) compares the force-slip relationships of the reference specimens and specimens V-3-1 and V-3-2. Furthermore, it shows the force-uplift displacement relationships. The ultimate loads of the connectors in the tests V-3-1 and V-3-2 are 644.7 kN and 667.3 kN, respectively. The average ultimate load is 656.0 kN, which is an increase of 2% compared to the experimental set of V-1. Similar results of the corresponding slip to the ultimate load and uplift displacement are obtained. It is therefore concluded that changing the connector's inner diameter has an insignificant effect on the connector's behavior.
A) The force-vertical displacement relationships, B) the force - uplift displacement relationships of the specimens of V-3-1 and V-3-2.
3.3 Effects of the connector's height
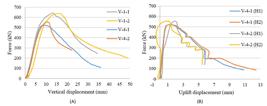
Changing the connector's height from 100 mm into 80 mm, specimens V-4-1 and V-4-2, has reduced the load capacity of the connector. The reduction of the load is about 16%, where the average load capacity of the connector of 80 mm width is 538 kN in comparison to 640.7 kN to the one of 100 mm width. Also, the reduction of the force leads to reducing the longitudinal displacement of the connector, where the corresponding slips of the maximum load in specimens V-4-1 and V-4-2 are 9.4 mm and 10.4 mm, respectively. In both experiments, the uplift at 80% of the load () does not exceed the 50% of the (). Moreover, the specimens exhibit a crushing concrete failure the same as in tests V-1-1 and V-1-2. Figure (11) shows the relationships of the force with the displacements in tests V-4-1 and V-4-2.
A) The force-vertical displacement relationships, B) the force - uplift displacement relationships of the specimens of V-4-1 and V-4-2.
3.4 Effects of changing the connector's length
Specimens V-5-1 and V-5-2 are cast with a V-shaped connector of 60 mm length. The connector's position is kept the same as the other connectors, with the distance between the connector and the ground at 420 mm, figure (3). The influence of reducing the length by 50% led to a decrease in the bent V-shaped connector's load capacity by about 38% on average, where the average maximum load is 394.1 kN. The corresponding slip to the maximum load in specimens V-5-1 and V-5-2 are 9 mm and 12.1 mm, which is a reduction of 27% on average in comparison with specimens V-1-1 and V-1-2.
A) The force-vertical displacement relationships, B) the force - uplift displacement relationships of the specimens of V-5-1 and V-5-2
The uplift () of the connector at 80% of the load is reduced from 0.9 mm at the LVDT V-1-2 (H1) into 0.35 mm at LVDT V-5-1 (H1). The maximum measured values in both experimental sets are used in the comparison. Figure (12) shows the relationships between the displacements of the connectors and the applied force. The failure of both specimens V-5-1 and V-5-2 can be described as a welding failure. The initiation of the cracks is noticed at the bottom of the reinforced concrete slabs. After that, the cracks start to appear around the connector at a load of 180 kN. Meanwhile, the separation between the flanges and the connector starts to be noticed as the load declines. The separation occurs at an even faster rate than the one in samples V-1-1 and V-1-2. That failure mode can be referred to the reduction of the contact area between the flanges and the connectors, where the load concentrates. Figure (13) shows the failure of the specimen V-5-2.
3.5 Effects of the holes and transvers bars on the connector's performance
Oguejiofor and Hosain (1994Oguejiofor EC, Hosain MU (1994). A parametric study of perfobond rib shear connectors. Canadian Journal of Civil Engineering. 21(4):614-25.) stated in their work that the shear capacity of perfobond shear connector can be enhanced with the number of dowels. That is, the shear strength of the connector increases by adding adequate transverse reinforcement to the connector. Conversely, J. Vianna et al. (2008Vianna JD, Costa-Neves LF, Vellasco PD, de Andrade SA (2008). Structural behaviour of T-Perfobond shear connectors in composite girders: An experimental approach. Engineering Structures. 30(9):2381-91.) concluded through their work on the perforated shear connector that adding the holes and transverse bars does not significantly increase the ultimate load of shear connectors. Thus, push-out specimens with V-shaped connectors of two holes of 32 mm diameter, one at each side, are cast. Specimens V-6-1 and V-6-2 are produced to study the effect of the holes on the connector's performance, whereas samples V-7-1 and V-7-2 are cast to assess the transversal rebars' existence on the connector's behavior. The same dimensions of the V-shaped connector and the push-out specimens are adopted, figure (3). Both sets of the specimens are tested in the same procedure explained above. Figure (14) shows the positions of the transversal reinforcement, where a 16 mm bar of 500 mm length is fixed to pass through the center of each connector. The transversal rebars are monitored and fixed by rebars tied to the reinforcement mesh.
Figure (15) shows the force-displacement relationships of the specimens V-6-1, V-6-2. It is shown that the ultimate loads of the specimens V-6-1 and V-6-2 are 664.6 kN and 654.7 kN, respectively. The average maximum load is 659.7 kN, which is about a 3% increase compared to the ultimate loads of specimens V-1-1 and V-1-2. The corresponding longitudinal displacement of the ultimate loads is 13.3 mm for V-6-1, while it is 17.8 mm for specimen V-6-2. The uplift displacements of the connectors in both specimens, V-6-1 and V-6-2, are less than 0.5 , where the maximum is measured at V-6-1 (H1) equals 0.28 mm.
A) The force-vertical displacement relationships, B) the force - uplift displacement relationships of the specimens of V-6-1 and V-6-2
The failure mode of both specimens can be described as the crushing of concrete. After dismantling the specimens and removing the concrete, though, it is noticed that the welding at one of the connectors has started to fail. Figure (16) shows the failure of the welding in specimen V-6-2. That failure explains the relationship of the force-uplift displacement at LVDT V-6-2 (H1), where the connector is fixed. The long plateau obtained there indicates the welding failure. But that failure is stopped by the crushing of the concrete under the V-shaped connector. The failure of the welding can be attributed to the combination of loads applied to the connectors. This issue should have been taken into consideration when the fillet weld was designed, although it does point out the holes' efficiency in the V-shaped connector, where the holes create a resistance to prevent the separation between the slab and the steel flange.
The results of the specimens V-7-1 and V-7-2 are shown in figure (17). The ultimate load capacity is almost the same as those without transverse reinforcement, which is 648.1 kN. In addition, the corresponding displacement to the ultimate load is similar to the specimens V-6-1 and V-6-2. Nevertheless, the uplift at 80% of the maximum load is about 0.7 mm, which is higher than the one obtained in the specimens V-6-1 and V-6-2. It can be concluded from the experimental results of both cases that creating the holes and adding the transverse reinforcement has no significant influence on the connector's performance.
A) The force-vertical displacement relationships, B) the force - uplift displacement relationships of the specimens of V-7-1 and V-7-2.
4 COMPARISONS BETWEEN THE CONNECTORS
As previously stated, this study aims to present an economical shear connector with a ductile behavior. Toward that end, a comparison with different shear connectors is executed. This comparison helps to distinguish the similarities and differences between the proposed connector and the commonly used connectors. Similarly, it points out the difference with other (V) shear connectors. Table (4) presents the experimental results of Headed studs, Channel, L-shaped, I-shaped, V-angle, and V-shaped shear connectors beside the results of the reference specimen of the proposed connector. The table summarizes the dimensions, ultimate load, corresponding slip of the connectors, and the strength of concrete of the selected push-out tests. The maximum load capacity is obtained by the proposed V-shaped connector with 120 mm length, 100 mm as a height, and 10 mm as thickness. As can be seen, the slip of the developed V-shaped connector is very high in comparison with other connectors.
The channel shear connector, which has a height of 140 mm, length of 75 mm, and web thickness of 7 mm, has obtained less load (401.3 kN). The same channel connector with 100 mm as a height and 6 mm as a web thickness has borne less force by 14%. Both channel connectors are tested with a higher compressive strength of concrete than the one used in this study, 36.7 MPa and 32.9 MPa. Despite the discrepancy in the ultimate load between the developed V-shaped connector and the channel connector, both of them exhibit a ductile behavior. More so, the channel shear connector shows stiffer behavior than the proposed connector. Figure (18) shows the force-displacement relationships of the compared shear connectors, where the relationships are extracted from the references mentioned above. The failure mode of the channel connector was described as fracture of the fillet between the flange and the connector. However, the failure of the concrete was observed before reaching the ultimate load, where the initiation of the cracks started on the side of the slabs up to the half of the ultimate load. Then, the cracking of the concrete developed to reach the upper side of the concrete slab. That propagation of cracks is similar to the one obtained with the proposed shear connector, which indicates that they have mostly the same behavior up to the ultimate load.
Yet, one can notice that the proposed V-shaped shear connector has higher load than the loads obtained from other V connectors. Both V-shaped shear connectors in the work of Bezerra et al. and Shariati et al. were designed to increase the confined area of concrete under the connectors to enhance the connector’s performance, but the V-shaped connector of Bezerra et. al shows less ductility (Bezerra et al. (2018), and Shariati et al. (2016)). Meantime, the V-angle shear connector reveals almost the same behavior of the proposed V-shaped shear connector, figure (18). Therefore, one can notice that the proposed connector has the best features to transfer the load between the structural components, and it can be easily produced. Based on the explained behavior and the outcomes of the experiments, it is recommended to use the developed V-shaped connector with a length more than 100 mm, larger than 10 mm as thickness and a width of more than 50% of the slab's thickness.
5 PREDICTION OF THE LOAD CAPACITY OF THE CONNECTOR
As explained, the proposed V-shaped shear connector has a similar behavior to that of the channel shear connector. Thus, different proposed formulas to predict the channel shear connector are studied using the V-shaped shear connector. The empirical expression for the V-shaped connector is also analyzed. The aim of that study is to evaluate the existing formulas in estimating the ultimate load of the developed V-shaped shear connector and, if needed, propose another equation to have a better correlation with the experimental outcomes. The most commonly used formula to calculate the ultimate load of the channel connector is the one recommended by the American institute of steel construction (ANSI/AISC 360-16. Specification for Structural Steel Buildings (2016)). That form, modified to use with connectors embedded in lightweight concrete as well, is as follows:
Where: is the ultimate load of the connector, () is the web thickness, () is the flange thickness, () is the length of the connector, () the compressive strength of concrete, and () the modulus of elasticity of concrete.
The Canadian standard CAN/CSA-S16-01 (CSA. Limit States Design of Steel Structures (2005)) has adopted the equation formulated based on an experimental work conducted by Slutter and Driscoll (1965Slutter RG, Driscoll Jr. GC (1965). Flexural strength of steel and concrete composite beams. Journal of the Structural Division. 91(2):71-99.). The 41 push-out tests were mostly executed at Lehigh University to present the following expression:
Pashan and Hosain (2009Pashan A, Hosain MU (2009). New design equations for channel shear connectors in composite beams. Canadian journal of civil engineering. 36(9):1435-43.) concluded that the channel shear connector equation in the Canadian standard is conservative, especially with small channel length. As a result, they proposed an empirical equation that has a higher agreement with tests' results:
Where: is the height of the connector.
Regarding the V-shaped connector, Bezerra et al. (2018Bezerra LM, Cavalcante OO, Chater L, Bonilla J (2018). V-shaped shear connector for composite steel-concrete beam. Journal of Constructional Steel Research. 150:162-74.) proposed an expression to calculate the connector's ultimate load. The formulation of the equation was based on the numerical simulation conducted on V-shaped shear connectors with 2.65 mm and 3.75 mm as thicknesses.
Where: represents the cross-sectional area of the V-shaped connector.
Based on the stated expressions, the ultimate load of the new V-shaped shear connector is calculated. Table (5) shows the results acquired from all equations. As can be observed, while the behavior of the channel connector and the proposed connector are alike, it is clear that the equations (1), (2), and (3) underestimate the load capacity of the V-shaped connector. In contrast, equation (4) overestimates its strength. These differences can be attributed to the equations' parameters, where formulas (1) and (2) do not consider the height of the connector. On the other hand, equation (3) has results that are closer to the experimental outcomes, where it consists of all the effective geometrical parameters. Based on the results of the proposed equations for the channel and V shear connectors, a new formula is needed. The proposed expression is formulated based on the results of the push-out tests and the failure mode, which is crushing of concrete. Figure (19) shows the forces on the bent V-shaped shear connector and the concrete in front of it, where the compressive cylinder strength of concrete () is taken into consideration. Based on the work of Slutter and Driscoll (1965Slutter RG, Driscoll Jr. GC (1965). Flexural strength of steel and concrete composite beams. Journal of the Structural Division. 91(2):71-99.), among others, the load capacity of the connector is proportional to (). The failure of concrete in front of the connector is assumed to be in a wedge shape, figure (18). Thereby, the following expression is obtained:
Where () is a constant, is the width of the connector which equals or it can be directly extracted from the drawing and () is the angle between the two sides of the connector. The final form of the expression is acquired by a regression analysis of the experimental results to find the value of the constant (), which leads to the proposal of the following formula:
The forces on the concrete in front of the connector and the parameters used in the formula.
The proposed expression (equation (6)) is adopted to estimate the load capacity of the developed V-shaped shear connector, table (5). One can notice that the outcomes of the equation are in good agreement with the experimental results with a small margin of error, but it can be safely adopted in the designing of the shear connection. Nevertheless, additional study is required to observe the behavior of the connector under fatigue load or even to investigate the connector under more diverse perspectives so that more accurate load capacity formula can be developed.
6 CONCLUSION
In this study, fourteen push-out tests are conducted on a new bent V-shaped shear connector. The connector is proposed to be deployed in steel-concrete structures offering high shear resistance and ductility. The new shear connector can be produced from a steel plate bent simply into the detailed shape to transfer a higher load than the shear studs and channel connector. Parametric study on the shear connector is conducted. The study considered various geometric variables of the connector to evaluate their effects on its behavior. Based on that, the conclusions of this work are as follows.
The proposed geometry of the V-shaped connector has higher load capacity than the conventional shear connectors and the existing shapes of the V shear connectors. In addition, its production is simpler than some other connectors. The connector's failure mode is mostly controlled by the strength of concrete, where the crushing of concrete occurs. Nonetheless, in the case of using a short V-shaped shear connector, the failure of the welding is observed. Besides that, the load capacity is significantly affected by its length, where the ultimate strength drops about 38% by reducing the length from 120 mm to 60 mm. That behavior can be referred to the reduced support area of concrete in front of the connector which results in higher stress. For this reason, it is recommended to use a V-shaped shear connector with a length of more than 120 mm.
Changing the thickness or the height of the connector plays a very important role in the connector's shear resistance. The reduction of the 20% in the connector's height reduces the load capacity by 16%. Furthermore, the vertical slip of the connector decreases from almost 14 mm to 10 mm. The results show that reducing the thickness of the connector by 20%, from 10 mm into 8 mm, decreases the ultimate strength by 6%. Of note is that the inner diameter of the connector does not affect the connector's behavior.
Likewise, it is proven, based on the selected parameters, that neither producing holes in the connector nor adding transverse rebars can considerably enhance the connector's shear strength. It is noticed, though, that the uplift displacement of the connector is reduced, and the ductility of the connector is improved. The aforementioned effects of the geometrical variables are deployed in a regression analysis to formulate an expression that can predict the connector's ultimate strength. The predicted results are consistent with the measured results. Finally, it can be concluded that the proposed V-shaped connector can be adopted to transfer high shear load between steel and concrete components with high ductility. However, further investigation is needed to study the behavior of the connector. The new research work can study the connector’s performance in beams and its behavior under dynamic load.
Acknowledgment
The authors would like to express their gratitude to the deanship of scientific research at the University of Jordan for sponsoring this research.
References
- ANSI/AISC 360-16. (2016), Specification for Structural Steel Buildings. American Institute of Steel Construction (AISC), Chicago, Illinois, USA.
- Baran E, Topkaya C (2012). An experimental study on channel type shear connectors. Journal of Constructional Steel Research. 74:108-17.
- Bezerra LM, Cavalcante OO, Chater L, Bonilla J (2018). V-shaped shear connector for composite steel-concrete beam. Journal of Constructional Steel Research. 150:162-74.
- CSA. Limit States Design of Steel Structures (2005). CSA standard CAN/CSA-S16-01. Toronto, Ont: Canadian Standards Association (CSA).
- EN 1993-1-8 (2005): Eurocode 3: Design of steel structures Part 1.8 Design of joints. Brussels: CEN-European Committee for Standardisation.
- EN 1994-1-1 (2004): Eurocode 4: Design of Composite Steel and Concrete Structures. General Rules and Rules for Buildings. Thomas Telford.
- Kamar A, Lasheen M, Shaat A, Zaher A, Khalil A (2021). Numerical Evaluation of Mono-symmetric Steel-concrete Composite section provided with Angle and Channel Shear Connectors. International Journal of Research in Engineering & Management. 4(3):113-130
- Khorramian K, Maleki S, Shariati M, Ramli Sulong NH (2015). Behavior of tilted angle shear connectors. PLoS one. 10(12):e0144288.
- Nouri, K., Sulong, N. R., Ibrahim, Z., & Shariati, M. (2021). Behaviour of novel stiffened angle shear connectors at ambient and elevated temperatures. Advanced Steel Construction, 17(1), 28-38.
- Oguejiofor EC, Hosain MU (1994). A parametric study of perfobond rib shear connectors. Canadian Journal of Civil Engineering. 21(4):614-25.
- Pallarés L, Hajjar JF (2010). Headed steel stud anchors in composite structures, Part I: Shear. Journal of Constructional Steel Research. 66(2):198-212.
- Pashan A, Hosain MU (2009). New design equations for channel shear connectors in composite beams. Canadian journal of civil engineering. 36(9):1435-43.
- Shariati, M., Mafipour, M. S., Mehrabi, P., Shariati, A., Toghroli, A., Trung, N. T., & Salih, M. N. (2020a). A novel approach to predict shear strength of tilted angle connectors using artificial intelligence techniques. Engineering with Computers, 1-21.
- Shariati, M., Tahmasbi, F., Mehrabi, P., Bahadori, A., & Toghroli, A. (2020b). Monotonic behavior of C and L shaped angle shear connectors within steel-concrete composite beams: an experimental investigation. Steel Compos Struct, 35(2), 237-247.
- Shariati M, Sulong NR, Shariati A, Khanouki MA (2016). Behavior of V-shaped angle shear connectors: experimental and parametric study. Materials and Structures. 49(9):3909-26.
- Shen, M. H., Chung, K. F., Elghazouli, A. Y., & Tong, J. Z. (2020). Structural behaviour of stud shear connections in composite floors with various connector arrangements and profiled deck configurations. Engineering Structures, 210, 110370.
- Shim, C. S., Lee, P. G., & Yoon, T. Y. (2004). Static behavior of large stud shear connectors. Engineering structures, 26(12):1853-1860.
- Slutter RG, Driscoll Jr. GC (1965). Flexural strength of steel and concrete composite beams. Journal of the Structural Division. 91(2):71-99.
- Tahmasbi F, Maleki S, Shariati M, Ramli Sulong NH, Tahir MM (2016). Shear capacity of C-shaped and L-shaped angle shear connectors. PloS one. 11(8):e0156989.
- Titoum M, Mazoz A, Benanane A, Ouinas D (2016). Experimental study and finite element modelling of push-out tests on a new shear connector of I-shape. Advanced Steel Construction. 12(4):487-506.
- Vianna JD, Costa-Neves LF, Vellasco PD, de Andrade SA (2008). Structural behaviour of T-Perfobond shear connectors in composite girders: An experimental approach. Engineering Structures. 30(9):2381-91.
- Xu C, Sugiura K, Wu C, Su Q (2012). Parametrical static analysis on group studs with typical push-out tests. Journal of constructional steel research. 72:84-96.
Edited by
Editor:
Publication Dates
-
Publication in this collection
18 June 2021 -
Date of issue
2021
History
-
Received
06 Feb 2021 -
Reviewed
29 Apr 2021 -
Accepted
30 Apr 2021 -
Published
03 May 2021

