Abstract
The present study investigates the stability conditions of reinforced concrete panels subjected to fire loading within the framework of limit analysis theory. The method relies in a first step upon the preliminary determination of the temperature dependent interaction diagrams of the structural element. Interaction diagrams derived from the static approach are shown to depend on the geometry of panel cross-section as well as on the strength properties of the constituents, which degrade continuously as fire proceeds. The second step of the method consists in determining the deformed configuration of panel from the analysis of thermo-elastic equilibrium of the structure. The stability analysis and design of the panel in its deformed geometry are then carried out by comparing the distribution of internal efforts to its reduced strength capacities expressed by means of the associated interaction diagrams evaluated in the first step. Several numerical examples are presented to assess the effect of relevant parameters on the overall fire safety of the structure, emphasizing the effectiveness of the approach for design purposes.
Keywords:
Reinforced concrete panel; fire loading; fire stability; limit analysis theory
1 INTRODUCTION
Reinforced concrete structures (RCS) can be considerably affected when exposed to high temperatures, especially in the context of fire conditions. The RCS behavior in fire is a very complex subject (Beitel and Iwankiw, 2002Beitel, J., Iwankiw, N., (2002). Analysis of needs and existing capabilities for full-scale fire resistance testing. Springfield NIST/NTIS. 96 p. (NIST GCR 02-843) (USA).; Dhir et al., 2008Dhir, R. K., Chana, P., Caliskan, S., Lavingia, R. (2008) Concrete for fire engineering. Warford. HIS BRE Press. 332 p. (United Kingdom); Wickstrom, 2016Wickstrom, U. (2016) Temperature calculation in fire safety engineering. Springer. 243p.(Switzerland)). Although many studies have been developed in recent years to better understand the influence of high temperatures on this kind of structure, many issues still need to be addressed. The problems that occur when RCS are exposed to high temperatures are mainly connected with progressive degradation of its constituents (concrete and steel) mechanical properties and damage induced by excessive deformation and spalling.
Most of the studies available in the literature deal with the fire problem analytically or numerically due to the difficulty of carrying out experiments in this area. They are mainly dedicated to assess the behavior under fire conditions of columns (Ali et al., 2010Ali, F., Nadjai, A., Choi, S., (2010) Numerical and experimental investigation of the behavior of high strength concrete columns in fire. Engineering Structures, 32: 1236-1243.; El-Fitiany and Youssef, 2014El-Fitiany, S.F., Youssef, M.A., (2014) Interaction diagrams for fire-exposed reinforced concrete sections. Engineering Structures, 70: 246-259.; Buch and Sharma, 2017Buch, S.H., Sharma, U.K., (2017) Fire Resistance of Reinforced Concrete Columns: A Systematic Review. In: Applications of Fire Engineering, Gillie & Wang (Eds), Manchester University, United Kingdom, Taylor & Francis Group.; Buch and Sharma, 2019; Gernay 2019Gernay, T., (2019) Fire resistance and burnout resistance of reinforced concrete columns. Fire Safety Journal, 104: 67-78.) or beams (Han et al., 2010Han, L.H., Wang, W.H., Yu, H.X., (2010) Experimental behaviour of reinforced concrete (RC) beam to concrete-filled steel tubular (CFST) column frames subjected to ISO-834 standard fire. Engineering Structures, 32: 3130-3144.; Han et al., 2013; Gao et al., 2013Gao, W.Y., Dai, J.G., Teng, J.G., Chen, G.M., (2013) Finite element modeling of reinforced concrete beams exposed to fire. Engineering Structures, 52: 488-501.; Sun et al. 2018Sun, R., Xie, B., Perera, R., Pan, Y., (2018) Modeling of Reinforced Concrete Beams Exposed to Fire by Using a Spectral Approach. Advances in Materials Science and Engineering, 2018: 1-12.). Ribeiro (2004Ribeiro, J. C. L. (2004) Simulação via método dos elementos finitos da distribuição tridimensional de temperatura em estruturas em situação de incêndio, Msc. Dissertation (in Portuguese), Federal University of Belo Horizonte.) evaluated for reinforced concrete slabs and columns, the accuracy of the procedures suggested by Brazilian standards. Results of temperature distributions from standards procedures and technical literature were compared with those obtained from a computational algorithm for transient and nonlinear thermal analysis of two and three-dimensional models based on finite element method. Albuquerque (2012Albuquerque, G. B. M. L. (2012). Dimensionamento de vigas de concreto armado em situação de incêndio, Msc. Dissertation (in Portuguese), Universidade de São Paulo, Brazil.) developed an alternative analytical method to the tabular method for the design of beams in fire. The thermo-mechanical behavior of beams with different widths, heights, covers, diameters and dispositions of reinforcing bars was analyzed through Super Tempcalc software. For the analyzed cases, the design results of the proposed method were more economic than those from tabular method. Costa (2008Costa, C. N. (2008). Dimensionamento de elementos de concreto armado em situação de incêndio, Ph.D. Thesis (in Portuguese), University of Sao Paulo, Brazil.) also proposed a design method for reinforced concrete elements in fire based on numerical results. The study focused on structures under simple bending or combined bending and axial load and considered the heat effects on the thermal and mechanical properties of the materials and associated impact on the structural behavior of reinforced concrete elements. Buchanan and Munukutla (1991Buchanan, A., Munukutla, V. R., (1991). Fire Resistance of Load-Bearing Reinforced Concrete Walls. Fire Safety Science 3:771-780.) described a numerical method for calculating the strength of reinforced concrete walls exposed to fire, considering different support conditions. The authors found that walls with pinned support at both ends exhibit better structural behavior under fire exposure.
Some surveys investigated the influence of fire on structure strength evaluating the interaction diagrams changes with the temperature increase. Caldas et al. (2010Caldas, R. B., Souza, J. J., Fakury, R. H., (2010). Interaction diagrams for reinforced concrete sections subjected to fire. Engineering Structures 32:2832-2838.) presented an algorithm for the construction of strength interaction diagrams for arbitrary-shaped reinforced concrete sections subjected to fire action. The diagrams were obtained by a stepwise variation of the deformed configuration, under assumptions of conventional ultimate strain values for concrete and steel. The obtained results are in good agreement with those of Meda et al. (2002Meda, A., Gambarova, P.G., Bonomi, M., (2002) High-performance concrete in fire-exposed reinforced concrete sections. ACI Structural Journal, 99:277-87.). Pham et al. (2015Pham, D. T. de Buhan, P., Florence C., Heck, J. V., Nguyen, H. H., (2015). Interaction diagrams of reinforced concrete sections in fire: a yield design approach. Engineering Structures 90:38-47.) presented a relatively simple computational procedure to obtain interaction diagrams for concrete walls in fire subjected to axial force and bending moment. Based on the limit analysis theory (LAT), they demonstrated how the lower and upper bound methods can be implemented leading to the exact determination of such interaction diagrams. The proposed theoretical predictions were compared with the Crozier and Sanjayan (2000Crozier, D. A., Sanjayan, J. G., (2000). Tests of Load-Bearing Slender Reinforced Concrete Walls in Fire. ACI Structural Journal, 97:243-251.) experimental results. A fairly good agreement between them could be observed.
Few studies have focused on the structural behavior of walls in fire (Hayhoe and Youssef, 2013Hayhoe, W.C., Youssef, M.A., (2013) Structural Behaviour of Concrete Walls during or after Exposure to Fire: A Review. CSCE 2013 General Conference Montréal, Québec.). Among the most significant experimental research available one may quote the study conducted by Crozier and Sanjayan (2000Crozier, D. A., Sanjayan, J. G., (2000). Tests of Load-Bearing Slender Reinforced Concrete Walls in Fire. ACI Structural Journal, 97:243-251.). They analyzed eighteen reinforced concrete walls under standard fire conditions, varying height and thickness ratios, covering thickness, loading and mixing proportions of the concrete, to investigate the strength capacity of structures, as well as the effect of spalling. Lee and Lee (2013Lee, S., Lee, C., (2013) Fire resistance of reinforced concrete bearing walls subjected to all-sided fire exposure. Materials and Structures, 46: 943-957.) investigated theoretically and experimentally the fire resistance of concentrically loaded reinforced concrete bearing walls exposed to fire on both sides. Nguyen et al. (2018Nguyen, K.T.Q., Ngo, T., Mendis, P., Heath, D., (2018) Performance of high-strength concrete walls exposed to fire. Advances in Structural Engineering, 21: 1173-1182.) evaluated the performance of high-strength concrete walls exposed to fire focusing their analysis on the spalling phenomenon. In the numerical framework, Kumar and Kodur (2017Kumar, P., Kodur, V.K.R., (2017) Modeling the behavior of load bearing concrete walls under fire exposure. Construction and Building Materials, 154: 993-1003.) presented a generic three-dimensional finite element numerical model for predicting the thermo-mechanical behavior of load bearing reinforced concrete walls exposed to fire. The model was validated by comparing predicted thermal and structural responses with the experimental data on full scale load bearing RC walls tested under fire exposure. The comparisons showed good correlation between model predictions and measured data, indicating that the proposed model can predict the thermo-mechanical behavior of RC walls from pre-loading to collapse stage.
The purpose of the present study is to evaluate the structural behavior at failure of reinforced concrete panels/walls subjected to fire loading. Such structural elements (Figure 1) have been widely used, especially in industrial and storage buildings. This work investigates high temperature influence on panels strength through the LAT (Salençon, 1983Salençon, J. (1983). Calcul à la rupture et analyse limite, Presses de l’Ecole Nationale des Ponts et Chaussées. (Paris); Salençon, 2013), which allows the structural design in the ultimate limit state in a straightforward way since it does not consider the loading path and the loading history before the collapse. In this case, the structure failure load/domain is obtained considering compatibility between the equilibrium of the considered system subjected to prescribed loads and the strength of its constitutive material. In this work, the overall fire safety of the structure shall rely upon three steps. Modeled as beam element, the local strength capacities of the panel in fire are described by means of interaction diagrams, which are evaluated in the first step by resorting to the static approach of LAT. It should be noted that evaluation of the overall strength capacities of reinforced concrete in fire requires accounting for the continuous reduction in strength of the constituents (concrete and steel) with temperature increase induced by fire process. In the second step, the deformed configuration of the panel, as well as the distribution of axial and bending moment efforts, are determined from equilibrium analysis of the structure under combined action of thermal gradient and self-weight loading. Yield design analysis of the panel in its deformed configuration is handled in the last step by comparing the distribution of internal efforts determined in the second step to its reduced strength capacities defined by interaction diagrams evaluated in the first step.
2 STATEMENT OF THE PROBLEM AND FRAMEWORK OF ANALYSIS
Panels are slender structures with thickness much smaller than their height (Figure 1). At ambient temperature (without temperature variation Δθ = 0), the panels are only subjected to their weight (Figure 2(a)) which generates only axial compression internal forces N along the panel. When one of its faces, however, is exposed to high temperatures (Δθ > 0), such as in fire situations (Figure 2(b)), wide temperature difference occurs between the two element faces, which causes geometry modification due to thermal deformations. The greater the element slenderness, the greater the effects related to the thermal deformations. As can be seen in Figure 2(b), the structure deformation outside its plane u(x) leads to load eccentricity which generates, in addition to the axial compressive forces N, bending moment M. Furthermore, when the temperature changes, the thermomechanical properties of the constitutive materials also change.
Considering structural elements where the normal force N and the bending moment M govern their failure, the interaction diagram represents all the concurrent pairs of requesting loads (N, M) supported by their section. Among the direct potential applications of such interaction diagrams is the stability analysis of high rise reinforced concrete panels subjected to fire exposure conditions. Indeed, these conditions will clearly affect the stability of such slender structures in two different ways: the degradation of the panel strength capacities expressed through the reduced interaction diagram on the one hand, the thermal-induced out-of-plane displacements of the panel, which will generate bending moments in addition to compressive loads on the other hand.
It is proposed, for the present work, the verification of these actions together, in order to analyze the stability and failure of reinforced concrete panels, through a simplified one-dimensional approach with a beam-type model (model invariance in relation to the coordinate in the lateral direction), implying, in particular, that the heat flow in the lateral direction is disregarded. This consideration is valid for regions of long panels far from their borders. It is important to emphasize that a two-dimensional slab model would be a more accurate analysis for the border regions of the panels and also for short panels. A slab model would provide the analysis of the heat flux and temperature variation in more directions, and consequently a limit stress profile that takes into account the boundary effects induced by the lateral panel supports. The adopted model considers the panel connected by hinged support at its base (x = 0) and by a roller at its top (at x = l) (Figure 2).
As stated previously, this study focuses on the analysis of the influence of high temperatures on the stability of panels through the LAT. According to the traditional LAT (Salençon, 2013Salençon, J. (2013). Yield design, ISTE Ltd and John Wiley and Sons, Inc. (Great Britain and the United States)), the so-called domain K of potentially safe loads (N, M), is the set of loads which can be equilibrated by a stress distribution in the panel (stress tensor fields in the concrete, axial force distributions along the reinforcements), verifying the respective strength conditions and at any point of the panel. Therefore, K is defined by the compatibility between the equilibrium and the strength of the constitutive material (Equation 1). The boundary of this domain, locus of the so-called extreme or failure loads, is called the interaction diagram of the reinforced concrete panel subjected to combined axial force and bending moment.
being the stress field in the solid and the convex strength domain of panel constituents. The stress field is statically admissible when satisfies equilibrium (), the continuity condition along discontinuity surfaces, the boundary conditions and equilibrates the resulting loads (N, M).
This paper is organized as follows. Section 3 seeks to determine the interaction diagrams for reinforced concrete panels exposed to fire. In Section 4 the panel deformed configuration is determined. Isotropic linear thermoelastic behavior is considered for the panel constitutive materials (concrete and steel bars). Due to the linear behavior hypothesis, the problem can be divided into two subproblems: thermal and mechanical. The thermal problem does not take into account the element weight, only the thermal deformations associated with the temperature elevation are considered. The mechanical problem, however, takes into account only panel self-weight and is associated with the elastic deformations caused by its eccentricity.
Finally, Section 5 addresses the stability of reinforced concrete panels in a fire situation based on limit analysis reasoning. The latter relies upon the knowledge of (a) the cross-section interaction diagrams determined in Section 3, and (b) the combined bending and axial load distributions of the panel obtained from the thermo-elastic panel deformed configuration analyzed in Section 4.
3 DETERMINATION OF TEMPERATURE-DEPENDENT INTERACTION DIAGRAMS
A panel element is considered for the interaction diagram estimate. Referring to an orthonormal trihedron frame Oxyz, the element (Figure 3) is modeled as a parallelepiped solid of thickness b (along the Oy-axis), width a (along Oz-axis) and length l (along Ox-axis). It consists of a supposed homogeneous concrete material, reinforced by n longitudinal steel bars placed along the Ox-direction (). The position of reinforcement layer k of cross sectional area A k is defined by its coordinate along the Oy-axis, with .
The reinforced concrete panel element is subjected to the following mechanical loading conditions: (a) body forces (self-weight) are neglected; (b) left hand section (x = 0) with stress vector related to the resultant axial force along Ox and bending moment about Oz; (c) right hand section (x= l) with stress vector corresponding to the resultant axial force along Ox and bending moment about Oz; (d) remaining horizontal and vertical sides are stress free (). The described loading conditions correspond to a panel element with its left hand section in smooth contact with a fixed vertical plate and its right hand section in smooth contact with a rigid plate in horizontal translation associated with a rotation about the Oz-axis.
Based upon the above boundary conditions, the loading mode of the element can be determined considering the expressions:
In this study, the thickness in the Oz-direction of the panel, formally described as a beam, is considered unitary. Thus, the loading parameters (N, M) can be interpreted as the normal force and the bending moment per unit length along Oz-direction.
The strength capabilities of the panel constitutive materials (second equation in (1)) are characterized as follows. Concrete is characterized by its uniaxial compressive strength and its uniaxial tensile strength :
where and are decreasing functions of the temperature that are equal to unity for (ambient temperature). Material parameters and are respectively the uniaxial tensile and compressive strengths at ambient temperature.
The reinforcing bars are modeled as linear (i.e. 1D) structural elements embedded in the concrete material described as a 3D continuum. Neglecting their shear and bending resistance, their strength properties will be characterized by the following condition expressed on the axial force n solely:
where represents the tensile-compressive strength of the reinforcing bar per unit of the transverse length along Oz, is the constitutive material (steel) uniaxial yield strength and reinforcement cross sectional area. represents the reinforcement rate per unit of transverse length along Oz-direction.
Likewise, the influence of high temperature on steel yield strength, and hence on the reinforcing bar tensile-compressive strength can be expressed by means of the following relationships:
where is a strength reducing parameter. Although the introduction of a specific strength condition for the reinforcement-concrete interface would not present major difficulties, perfect bonding between the reinforcing bars and the surrounding concrete will be provisionally assumed.
3.1 Interaction Diagram at Ambient Temperature
The interaction diagram is obtained from the solution to the described limit analysis problem (1). The lower bound static approach is implemented by exploring the class of stress distributions depending on parameter α
with
where parameter α characterizes the position of the neutral axis. Likewise, the corresponding values of the axial force n in any reinforcement bar located at coordinate read:
Equations (7) and (8) simply mean that both concrete and reinforcing bars reach their positive tensile (resp. negative compressive) strengths when located below (resp. above) the plane of equation (Figure 4).
Reinforced concrete panel geometry and its stress profile used in the lower bound static approach of LAT.
It can be immediately seen that those stress distributions comply with the respective strength conditions of the concrete material and steel reinforcing bars. Besides, they satisfy the equilibrium equations in the absence of body forces, while the discontinuity of stress when crossing the plane remains admissible. The corresponding values of the loading parameters in equilibrium with such stress distributions may be easily calculated from the general expressions of N and M given by the Equation (2):
which leads to
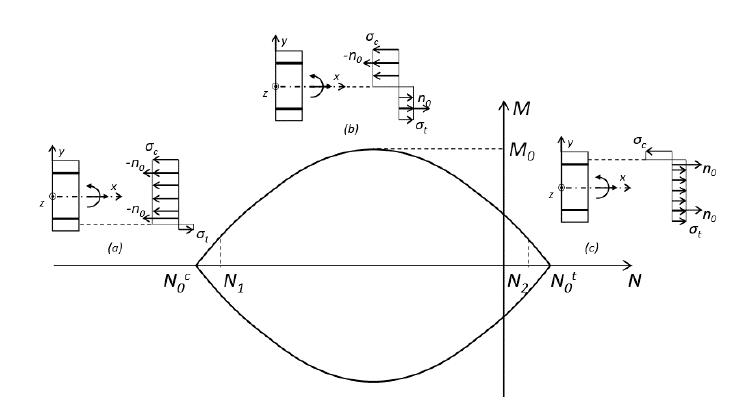
The set of parametric Equations (10) describes the exact failure surface in the (N, M) plane, that is, the interaction diagram of the reinforced concrete plate under combined axial force and bending moment. The maximum tensile and compressive axial force are obtained when α is equal to 1 and -1, respectively (Equation (11)). In these cases, the bending moment is null (Figure 5). On the other hand, the maximum value of bending moment is obtained when α = 0 (Equation (12)).
In addition to these limiting cases, three other situations can be identified:
(a) the neutral axis is below the lower reinforcement. In this case, , which corresponds to the concrete section and the upper and lower reinforcements rupture in compression (Figure 5(a)). The system of parametric Equation (10) simplifies (exclusion of variable α) to:
which is valid when:
Interaction diagram (N, M))) for reinforced concrete at ambient temperature. Cases (a) neutral axis below the lower reinforcement, (b) neutral axis between the upper and lower reinforcements and (c). neutral axis above the upper reinforcement
(b) the neutral axis lies between the upper and lower reinforcements. In this case, , which corresponds to the concrete section and the upper reinforcement rupture in compression and the lower reinforcements rupture in tensile (Figure 5(b)). The system of parametric Equation (10) simplifies to
valid when:
(c) the neutral axis is above the upper reinforcement. In this case, , which corresponds to the concrete section and the upper and lower reinforcements rupture in tensile (Figure 5(c)). The system of parametric Equation (10) simplifies to
which is valid for
The interaction diagram of reinforced (upper and lower reinforcement) concrete at ambient temperature is thus obtained from consideration of the above three cases as well as symmetry with respect to N-axis (Figure 5).
3.2 Interaction Diagram at High Temperature
This section extends the reasoning developed previously for reinforced concrete at ambient temperature to the situation of fire. In such conditions, the heat propagates along the element and, as detailed in Equations (3) and (5), the strength properties of the reinforced concrete constitutive materials degrade with the temperature increase. As a consequence, the interaction diagram of the reinforced concrete panel undergoes changes that depend on the temperature at which the material is subjected.
Therefore, considering the standard temperature versus time curves recommended by design codes (ISO 834, 1990) for modeling the action of a fire on a structure, a heat transfer analysis may be carried out on the reinforced concrete panel subjected to a fire applied on its bottom , as sketched in Figure 6(a).
Reinforced concrete panel geometry, temperature distribution across its section (a) and its limit stress profile function of temperature (b).
The temperature field along the panel cross-section is solution to the following thermal boundary value problem defined at time t > 0 by:
where k is the thermal conductivity, θ is the temperature field, r is the volumetric density of internal heat production, ρis the mass density, c is the specific heat. In the above equation, refers to the position vector, q corresponds to the heat flux vector and n is the outward unit normal to the considered boundary surface subjected to heat flow. Quantities and denote respectively the convection coefficients along the face exposed to fire (or temperature ) and along that exposed to ambient temperature . The initial temperature field refers to the prevailing temperature before the fire starts.
The first equation in (19) is the heat equation governing the internal thermal equilibrium equation. The thermal boundary conditions are written along the lateral faces of the panel viewed as a beam and are expressing that heat exchange only occurs in the Oy-direction. The thermal boundary conditions along faces and prescribe the heat flow caused by convection.
In the context of simplified setting considered herein, one-dimensional heat propagation across the panel thickness suggests that the field of temperature increase resulting from such a thermal loading will depend on the y-coordinate only (Figure 6(a)). Given any such profile of temperature increase, the strength of the materials (concrete and reinforcement) is modified accordingly (Figure 6 (b)):
thus, leading to a modified interaction diagram of the reinforced concrete panel.
The corresponding values of the loading parameters in equilibrium with the proposed stress distributions, Equations (6) and (20), may be easily calculated from the general expressions of N and M given in Equation (2):
The Equations (21) and (22) define the interaction diagram domain of reinforced concrete panel at different fire durations.
In order to illustrate the influence of high temperature on interaction diagrams of the reinforced concrete panel, a heat transfer analysis aimed at evaluating the temperature increase across the panel thickness was first conducted considering a rectangular cross section: 0.15 x 1 m2 of normal weight concrete with and, reinforced with two layers of 10 steel reinforcing bars (6.3 mm diameter) with 3 cm of concrete cover at top and bottom and. All analyses are performed considering a null value for r (no internal heat production). Moreover, the following coefficients were used = 25 W/m2°C and = 4 W/m2°C in accordance with the Brazilian ABNT NBR 15200 (2012) recommendation.
In the present study, the thermal problem was numerically modeled by the computational tool Mecway (Version 9.0) in order to obtain the temperature section profile. Mecway is a finite element analysis package that focus on mechanical and thermal simulation such as stress analysis, vibration and heat flow. It allows the application of convection and radiation flux boundary conditions, as well as the consideration of thermal and mechanical properties (specific mass and specific heat) changes according to the temperature at which the material is exposed. The temperature at which the lower face (in fire) is subjected can also vary over time, making possible the use of the standard temperature/time curve specified in ISO 834 (1990).
Figure 7(a) shows the temperature profiles across the thickness obtained by Mecway computer program calculations, corresponding to 0, 60, 90 and 120 min fire durations. Once such temperature increase distributions are known, the corresponding material strength distributions at high temperature can be determined through the application of the coefficients , , and (Equation (20)). These coefficients are estimated as indicated by the Brazilian ABNT NBR 15200 (2012) recommendation. The corresponding interaction diagrams, as shown in Figure 7(b), could then be determined through the Equations (21) and (22).
Temperature distributions across the panel thickness and interaction diagrams for different fire exposure periods.
As can be seen from this example, the fire exposure leads to an increase of temperature (Figure 7(a)), resulting in a decrease of material strength parameters and finally to a shrinkage of the interaction diagram (Figure 7(b)). As one might expect, the longer is the fire duration, the smaller is the size of the interaction diagram and thus the global resistance of the reinforced concrete panel.
4 PANEL DEFORMED CONFIGURATION AT THERMO-ELASTIC EQUILIBRIUM
As introduced in Section 2 and displayed in Figure 2(a), reinforced concrete panels at ambient temperature are only subjected to its self-weight and thus to axial compressive internal forces N. On the other hand, when one of the panel faces is exposed to high temperatures, thermal deformations appear and induce eccentricity of the self-weight load, generating, in addition to N, bending moment M (Figure 2(b)). The panel, which is modeled in this work as a vertical beam, is initially (at ambient temperature) aligned to its vertical plane on the x-axis. The estimate of the deformed configuration of the panel in fire is the focus of this section. The estimate of the panel deformed configuration is fundamental for determining the bending moment distribution along the panel in fire. As isotropic linear thermoelastic behavior is considered for panel constitutive materials, the problem could be divided into two subproblems: thermal (Section 4.1) and mechanical (Section 4.2) problem. The thermal problem does not take into account the element weight, it only considers the thermal deformations associated with temperature elevation. The mechanical problem, however, only takes into account the self-weight and is associated with the elastic deformations caused by its eccentricity.
4.1 Thermal Strains and Deflection
While panel strains at ambient temperature are purely mechanical, at fire conditions; thermal strains also occur. In addition, thermomechanical deformations/deflections happen due to the restraints of panel supports. The total strain is the sum of the thermal strain and mechanical (Equation (23)).
Assuming Navier-Bernoulli hypothesis and perfect adherence between concrete and steel bars, the total strain can be estimated by
where is the section geometric center strain and is the panel curvature.
Since linear thermoelastic behavior is assumed, the internal efforts prevailing in concrete and reinforcement steel bars are, respectively:
where is the concrete current stress, is the concrete initial stress, E c is the concrete Young modulus and is the concrete thermal strain. n is the steel stress in the current configuration, n 0 is the steel stress in the initial configuration, A s is the steel area, E s is the steel Young modulus and is the steel thermal strain. and are function of the temperature and can be estimated as recommended by ABNT NBR 15200 (2012) and ABNT NBR 14323 (2013), respectively.
In the purely thermal problem, where only the temperature variation is considered and self-weight is disregarded, the normal stress and the bending moment in the section are null:
The section stress distribution for different fire exposure periods can be obtained when and are determined, which can be done through the solution of the Equations (27) and (28), considering Equations (24), (25), and (26) as detailed in Appendix A Appendix A Considering Equations (24), (25) and (26), the Equations (27) and (28) can be conveniently rewritten as: ∫ − b / 2 b / 2 E c ( y ) [ ε 0 − χ y − ε t h , c ( y ) ] d y + ∑ i = 1 k E s ( y i ) A s ( y i ) [ ε 0 − χ y i − ε t h , s ( y i ) ] = 0 ∫ − b / 2 b / 2 E c ( y ) [ ε 0 − χ y − ε t h , c ( y ) ] y d y + ∑ i = 1 k E s ( y i ) A s ( y i ) [ ε 0 − χ y i − ε t h , s ( y i ) ] y i = 0 (A1) The solution of the equations system A1 provides the section geometric center strain ε0 and the element curvature χ, respectively: ε 0 = B E − C D A D − B 2 a n d χ = A E − B C B 2 − A D (A2) where A = ∫ − b / 2 b / 2 E c ( y ) d y + ∑ k E s ( y k ) A s , k B = − ∫ − b / 2 b / 2 E c ( y ) y d y − ∑ k E s ( y k ) A s , k y k C = − ∫ − b / 2 b / 2 E c ( y ) α ( y ) [ θ ( y ) − 20 ] d y − ∑ k E s ( y k ) A s , k α ( y k ) [ θ ( y k ) − 20 ] D = ∫ − b / 2 b / 2 E c ( y ) y 2 d y + ∑ k E s ( y k ) A s , k y k 2 E = ∫ − b / 2 b / 2 E c ( y ) α ( y ) [ θ ( y ) − 20 ] y d y − ∑ k E s ( y k ) A s , k α ( y k ) [ θ ( y k ) − 20 ] y k (A3) .
Figures 8(a) and 8(b) show, respectively, the section typical total and thermal strains and the section typical stress distribution for 120 min fire duration. The temperature elevation induces homogeneous expansion associated with zero-stress in a solid without constraints. Due to the panel support constraints (Figure 2), the temperature elevation induces tensile stresses in the central region of the cross section while the edge regions become compressed as can be observed in Figure 8(b).
Section total and thermal strains (a) and the section stress (b) distribution for 120 min fire duration.
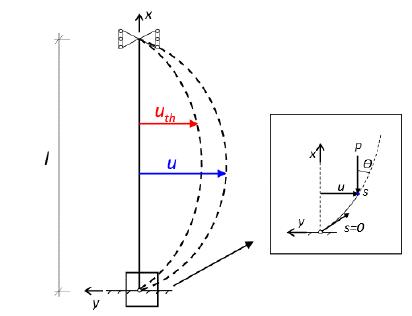
As the total strain (Equation (23)), the total deflection u(x) (Figures 2 and 10) is the sum of the thermal and the mechanical deflection (Section 4.2). Since the panel curvature , constant for a fire exposure, is related to the deflection second derivative, and considering the boundary conditions and , the thermal deflection is:
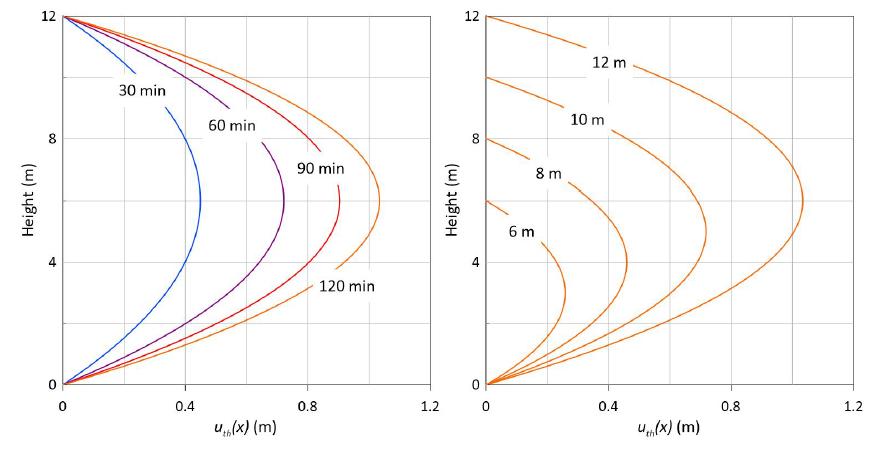
Figure 9(a) shows the thermal deflection for a panel of 12 m high, exposed to different fire durations (30, 60, 90, 120 min). Figure 9(b) shows the thermal deflection for panels of different heights (6, 8, 10, 12 m,) and 120 min fire duration.
Thermal deflection of (a) a panel of 12 m high and different fire duration, (b) panels of different heights and 120 min fire duration.
4.2 Deflection at Structure Equilibrium
The total deflection of the panel is evaluated taking into account the second order effects. It this analysis, the structure initial configuration is the panel with thermal deflection , which is determined as detailed in the previous section. Thus, the linear self-weight load p (Figure 10(b)) is uniformly redistributed along the thermal configuration (Equation (29)), causing bending moments.
In the present study, the axial strain, i.e. the displacements along Ox-axis, is neglected. Thus , where s and x are the abscissas of the section in the deformed and non-deformed configurations (Figure 10(b)), respectively, and the slope of deformed configuration is defined by . It is also assumed that the rotations of the cross sections remain infinitesimal, i.e. . Therefore, the axial compressive internal force in any panel section is independent of the deformed configuration:
The bending moment is evaluated through an isostatic analysis of the panel considering its thermal deformed configuration. The bending moment and the panel deflection are governed by the following coupled equations:
which represent, respectively, the panel equilibrium equation considering its deformed configuration and the panel behavior law. The combination of Equations (31) and (32) leads to the differential equation governing the total deflection equation u(x):
where corresponds to the average displacement along the panel height. The boundary conditions in this case (Figure 10) are:
The problem (Equations (33) and (34)) resolution was performed in the present study through the analytical method detained in Appendix B Appendix B The differential equation governing the total deflection u(x) (Equation (33)) and the evaluated problem boundary conditions (Equation 34) allows determining the deflection of reinforced concrete panels in fire. The proposed analytical method considers some variable changes: X = x − l α w i t h α = [ ( E I ) t h p ] 1 / 3 , u ( x ) = u ¯ ( X ) , F ( X ) = u ¯ ' ( X ) , (B1) and the solution of the resulting equation in the form: F ( X ) = ∑ k = 0 ∞ a k X k = a 0 + a 1 X + ... + a k X k + ... (B2) The problem solution is: u ¯ ( X ) = a 0 F 0 ( X ) + a 1 F 1 ( X ) + a 2 F 2 ( X ) (B3) where a 0 = − F 1 F 2 " + F 2 ( 1 − F 1 " ) F 0 F 2 " − F 0 " F 2 α 2 χ t h , a 1 = α 2 χ t h a n d a 2 = F 0 " F 1 + F 0 ( 1 − F 1 " ) F 0 F 2 " − F 0 " F 2 α 2 χ t h (B4) F 0 = X + ∑ j = 1 ∞ 1 ( 3 j + 1 ) ∏ k = 1 ∞ 3 k ( 3 k − 1 ) X 3 j + 1 F 1 = X 2 2 + ∑ j = 1 ∞ 1 ( 3 j + 1 ) ∏ k = 1 ∞ ( 3 k + 1 ) 3 k X 3 j + 2 F 2 = X 3 3 + ∑ j = 1 ∞ 1 ( 3 j + 3 ) ∏ k = 1 ∞ ( 3 k + 2 ) ( 3 k + 1 ) X 3 j + 3 (B5) , making use of a Maple software.
Figure 11 compares the obtained thermal and total deflections for a 12 m high panel.
Table 1 shows the thermal strain of the section geometric center , the thermal curvature radius , the maximum thermal deflection and maximum total deflection for a panel of 12 m high and different fire exposure periods. As previously noted in Figure 11, there is a large difference between the panel thermal and the total (second order effects considered) deflections, which increase with temperature.
As indicated in Table 1, the panel curvature remains in all cases relatively small. Finite element solutions obtained by Pham (2014Pham, D. T., (2014) Analyse par le calcul à la rupture de la stabilité au feu des panneaux em béton armé de grandes dimensions, Ph.D. Thesis (in Franch), Université Paris-Est, France.) in the context of thermo-mechanical analysis at large strains have shown that the assumption of infinitesimal strains adopted in the present analysis proves relevant for the prediction of panel deformed configuration.
5 STABILITY ANALYSIS OF REINFORCED CONCRETE PANELS IN FIRE
In order to evaluate the panel stability, the combined bending and axial load distribution of the panel should be determined. The axial internal force in any section along the panel height is estimated in the present study by the Equation (30). The bending moment estimate, on the other hand, needs the determination of the panel deflection u(x) as can be seen in Equation (31). Considering the analytical method detailed in Appendix B Appendix B The differential equation governing the total deflection u(x) (Equation (33)) and the evaluated problem boundary conditions (Equation 34) allows determining the deflection of reinforced concrete panels in fire. The proposed analytical method considers some variable changes: X = x − l α w i t h α = [ ( E I ) t h p ] 1 / 3 , u ( x ) = u ¯ ( X ) , F ( X ) = u ¯ ' ( X ) , (B1) and the solution of the resulting equation in the form: F ( X ) = ∑ k = 0 ∞ a k X k = a 0 + a 1 X + ... + a k X k + ... (B2) The problem solution is: u ¯ ( X ) = a 0 F 0 ( X ) + a 1 F 1 ( X ) + a 2 F 2 ( X ) (B3) where a 0 = − F 1 F 2 " + F 2 ( 1 − F 1 " ) F 0 F 2 " − F 0 " F 2 α 2 χ t h , a 1 = α 2 χ t h a n d a 2 = F 0 " F 1 + F 0 ( 1 − F 1 " ) F 0 F 2 " − F 0 " F 2 α 2 χ t h (B4) F 0 = X + ∑ j = 1 ∞ 1 ( 3 j + 1 ) ∏ k = 1 ∞ 3 k ( 3 k − 1 ) X 3 j + 1 F 1 = X 2 2 + ∑ j = 1 ∞ 1 ( 3 j + 1 ) ∏ k = 1 ∞ ( 3 k + 1 ) 3 k X 3 j + 2 F 2 = X 3 3 + ∑ j = 1 ∞ 1 ( 3 j + 3 ) ∏ k = 1 ∞ ( 3 k + 2 ) ( 3 k + 1 ) X 3 j + 3 (B5) , the bending moment distribution can then be rewritten as a function of polynomial series:
Equations (30) and (35) respectively define the axial force N(x) and bending moment M(x) that prevail at section x. Eliminating the latter variable provides a relationship that relates the values of N and M:
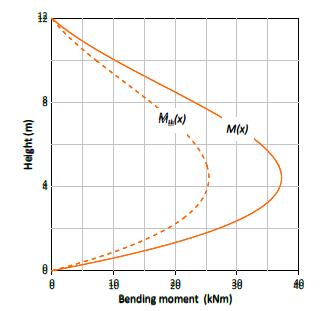
To illustrate, Figure 12 shows the combined bending and axial load distribution for a 12 m high panel exposed for 120 min to fire. Both the thermal and total deflections are considered. As can be seen, the temperature increase has great influence on the bending moment , as well as the second order effects . Both phenomena must be taken into account in the analysis of the panel stability in fire.
Combined bending and axial load distributions for a 12 m high panel exposed for 120 min to fire.
To evaluate the panel stability, the interaction diagram and the combined bending and axial load distribution (Figure 13(b)) are superimposed (Figure 13(a)). In this way, as long as (N, M) along the panel is within the interaction diagram or strength domain, the stability of the panel in fire is guaranteed. When the combined bending and axial load distribution become tangent or have any points outside the interaction diagram, the panel failures. It is important to emphasize, as displayed in Figure 13(a), that the panel rupture does not necessarily occur in the section with the maximum bending moment.
The point of the load distribution that is tangent to the interaction diagram corresponds to the section where the rupture occurs, leading to the general rupture of the structure, since an isostatic beam model is evaluated (Figure 2), and the diagrams are determined by general equilibrium. Therefore, the structure limit load corresponds to the rupture load, justifying the adopted thermoelastic analysis.
Before further developments, the following comments deserve to be made. While statically indeterminate structures subjected to firing conditions during periods of few hours are expected to experience large irreversible (plastic) strains prior to failure, the isostatic structure analyzed herein would not. Indeed, failure of the first cross-section, which reflects that the prevailing combination of axial load and moment has reached the elastic limit, implies the failure of the whole structure. This means that plastic strains are not involved in the collapse of such statically determined structure.
5.1 Illustrative Numerical Example
In order to evaluate the influence of high temperature on the stability of reinforced concrete panels, the same section data and constitutive materials of Section 3.2 are considered here, i.e., rectangular cross section: 0.15 x 1 m2 of normal weight concrete with and , reinforced with two layers of 10 steel bars (6.3 mm diameter) with 3 cm of concrete cover at top and bottom and . This geometric configuration will be mentioned as the reference section.
Figures 14(a) and 14(b) show the strength domain or interaction diagram of the reference section and the combined bending and axial load distributions for a panel of 12 m and 6 m high, respectively, and 240 min fire duration.
Interaction diagram Kθ of the reference section and the combined bending and axial load distributions for a panel of 12 m (a) and 6 m (b) high and 240 min fire duration.
As can be observed in Figure 14(a), the combined bending and axial load distribution is not entirely within the section interaction diagram. All points outside already failed, which indicates that the panel rupture will happen before 240 min fire duration. The 6 m panel (same section, same interaction diagram), on the other hand, has all points lying within the section interaction diagram. In this case, all panel sections support the bending moment and axial load caused by the temperature increase and the self-weight eccentricity during 240 min of fire exposure.
In the next Sections, different parameters that act on the reinforced concrete panel stability are evaluated. Section 5.2 considers the reference section, different panel heights, and distinct fire durations. Sections 5.3, 5.4 and 5.5, evaluate the influence of the concrete strength properties, the reinforcement rate, and the section geometry, respectively, on the panel stability.
5.2 Effect of Panel Height
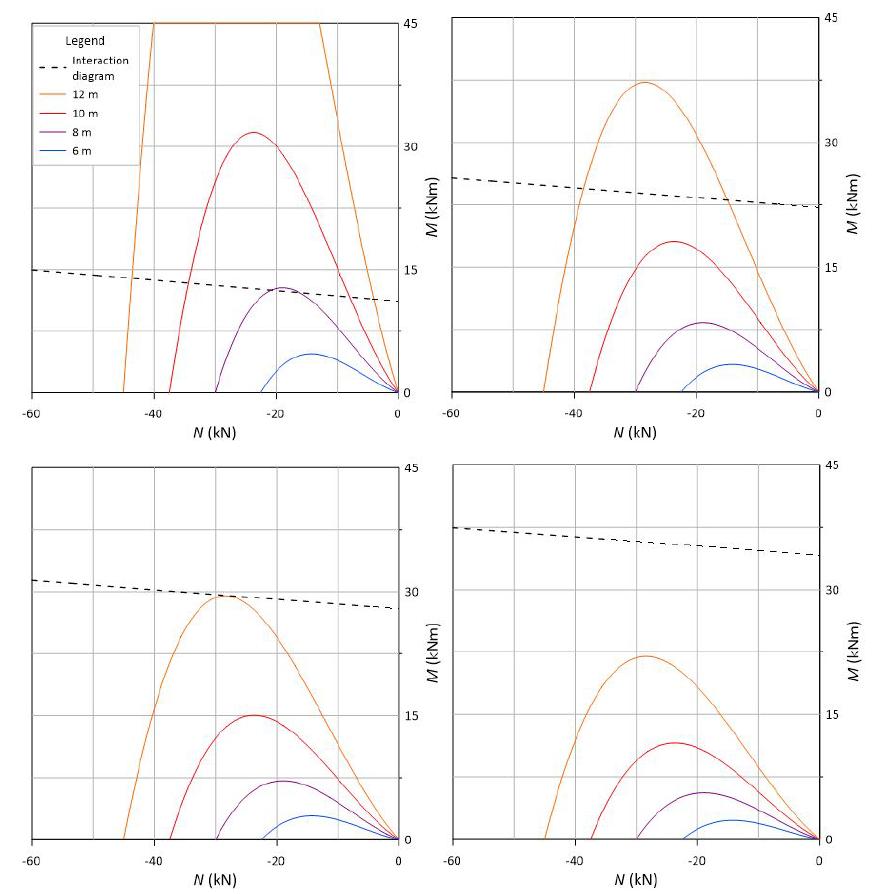
First, the influence of the panel height and fire durations on the panel stability is evaluated. Figure 15 shows the interaction diagrams of the reference section and the combined bending and axial load distributions for a panel of different heights and 240 (a), 120 (b), 90 (c), 60 (d) min fire duration.
As can be seen, for 240 min fire duration, only the 6 m panel height will not fail; for 120 and 90 min fire duration, only the 12 m panel height will fail. For 60 min fire duration, all analyzed panel heights have the combined bending and axial load distribution entirely within the interaction diagram, which indicates the element safety.
Interaction diagrams of the reference section and the combined axial load-bending moment distributions for panels of different heights and 240 (a), 120 (b), 90 (c), 60 (d) min fire duration.
5.3 Effect of Concrete Compressive Strength
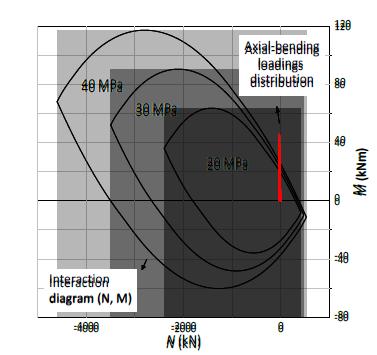
The influence of the concrete strength on the interaction diagram and the combined bending and axial load distribution of the panel is evaluated in this section. For this purpose, the reference section and three different concrete compressive strengths, 20, 30 and 40 MPa, are considered in the panel analysis.
Figure 16 shows the “expansion” of reference section interaction diagrams with the increase of the concrete compressive strength. However, the combined bending and axial load distribution of the panel does not undergo major changes.
Interaction diagrams and axial load-bending moment distributions for 12 m high panel and different concrete compressive strengths and 120 min fire duration.
To better illustrate, Figures 17(a) and 17(b) show graph zooms of the interaction diagrams and combined bending and axial load distributions for different panel heights (6, 8, 10, 12 m) and different concrete compressive strength (20, 30, 40 MPa), for, respectively, 120 and 90 min fire durations.
As can be seen, the greater the panel height, the more significant is the influence of the concrete compressive strength on the combined bending and axial load distribution. Since the concrete Young modulus is a function of the compressive strength, it is expected the combined bending and axial load decrease with the strength increase, which could be confirmed. Regarding the interaction diagram, at the combined bending and axial load level, the compressive strength has slight influence.
Interaction diagrams and axial load-bending moment distributions for different panel heights and different concrete compressive strength: (a) 120 and (b) 90 min fire durations.
5.4 Effect of the Reinforcement Rate
In this section, the influence of the reinforcement rate on interaction diagrams and the combined bending and axial load distributions is analyzed. Three different reinforcement rates are considered, A s1 , A s2 = 2A s1 and A s3 = 3A s1 , being A s1 the reference section reinforcement area. Figures 18(a) and 18(b) show the interaction diagrams and combined bending and axial load distributions for different panel heights (6, 8, 10, 12 m) and different reinforcement rates, for, respectively, 240 and 120 min fire durations.
Interaction diagrams and combined bending and axial load distributions for different panel heights and different reinforcement rates: (a) 240 and (b) 120 min fire durations.
Figure 18 shows that in some cases, the increase of the reinforcement area could avoid panel failure. This is the case of the 6 m panel high exposed to fire for 240 min and the 12 m panel high exposed to fire for 120 min, where more than twice the area initially considered is required to the panel stability.
The results showed that, in most cases, the reinforcement area does not have a great influence on combined bending and axial load distribution. The reinforcement bars have no great influence on the temperature distribution along the section, which is basically determined by the concrete area, and thus has insignificant influence on the deflection and the bending moment of the panel. The reinforcement has in fact great influence on the section strength criterion, the increase of the reinforcement area rises the section interaction diagram, as it can be observed in Figure 18.
5.5 Effect of Panel Thickness
In this section, the influence of different panel thicknesses on the interaction diagrams and combined bending and axial load distributions is analyzed. For this purpose, a 12 m panel high exposed to fire for 120 minutes is evaluated. Figure 19 shows the influence of panel thickness on the interaction diagram. Figures 20(a) and 20(b) show the total deflections and combined bending and axial load distributions of panels with six different thickness (15, 16, 17, 18, 19, 20 cm).
Interaction diagrams of 12 m high panels with six different thickness exposed to fire for 120 min.
The thickness increase leads to strength growth as shown in Figure 19, the interaction diagram (or section strength) expands with the panel thickness increase. Moreover, the results presented in Figure 20(a) indicate that the thickness has great influence in the panel deformed configuration. This occurs because when the section thickness increases the panel section bending stiffness also increases, and consequently the deflection and the bending moment decrease (Figure 20(b)). Finally, when the section thickness increases, the axial internal force also increases (Figure 20(b)) due to the self-weight increase.
Total deflections (a) and combined bending and axial load distributions (b) of 12 m high panels with six different thickness exposed to fire for 120 min.
Figure 21 shows the interaction diagrams and combined bending and axial load distributions for 12 m high panels with six different thicknesses for 120 min fire duration.
Interaction diagrams and combined bending and axial load distributions for panels with six different thickness exposed to fire for 120 min.
The results in Figure 21 indicate that for 120 min of fire exposure a panel 12 meters high and with 15 cm or 16 cm thicknesses will fail. In these cases, some combined bending and axial loads exceed the limit strength (interaction diagram), indicating the structure rupture. For other evaluated thicknesses (17, 18, 19 and 20 cm), the combined bending and axial load distributions are completely within the respective interaction diagrams. As already mentioned, the thickness increase improves the panel strength and also significantly reduces the panel bending moments. The results also indicate that small thickness changes could lead a panel to a safe condition, as can be seen in Figure 21 when the thickness changes from 16 to 17 cm.
This section presents results for panel exposed to fire only for 120 min. All the other configurations could be however evaluated and for each specific case, the panel stability can be verified.
6 CONCLUSIONS
This work proposed a method for assessing the stability of reinforced concrete panels in fire based on limit analysis theory. The method relies upon the determination of the interaction diagrams which depend mainly on the fire exposure time as well as on the panel cross-section geometry and on thermo-mechanical properties of the constitutive materials (concrete, steel bars) that evolve continuously with the temperature increase. The reasoning also requires assessment of panel deformed configuration and associated bending and axial load distribution. The latter distributions have been obtained from thermo-elastic equilibrium analysis of the panel. Analytical solution for the panel deformed configuration has been determined taking into account the effects of the self-weight eccentricity induced by the temperature increase. The proposed analysis allows for direct and easy evaluation of the stability conditions of reinforced concrete panels, thus providing an effective method for intensive parametric studies and design of structural fire safety.
From a theoretical viewpoint, the analysis based on the limit analysis tools emphasized its aptitude to properly capture the essential features of strength reduction connected with temperature increase and reflected at the overall interaction diagrams. In addition, the numerical applications have shown the relevancy to incorporate in the analysis the second order effects, notably for the determination of bending moment distribution along the panel.
The analysis also pointed out how small changes in the panel geometry (height and thickness) can have a strong influence on the stability conditions of the panel in fire. It is important to emphasize that although the panel height does not affect the interaction diagrams, it however strongly affects the bending moment distribution. Considering, for instance, 240 min of fire duration, the maximum bending moment of a panel of 12 m high is thrice and 18 times greater than that of a panel of 10 and 6 m high, respectively. Regarding the panel thickness, besides having significant influence on the interaction diagram, it also meaningfully affects the distribution of the combined bending and axial load. As the thickness increases, the structure weight increases so the axial force does. On the other hand, the bending moment decreases, which happens because the thickness increase causes the stiffness increase that influences the deflection and consequently the bending moment distribution.
It is also possible to conclude from the developed study that, although the reinforcement rate increase does not significantly affect the combined bending and axial load distribution, it considerably improves the interaction diagram. The benefits of this panel strength enhancement with the reinforcement increase is not so advantageous because the solicitation distributions of the evaluated structures are in a region of the interaction diagram (neutral axis is above the upper reinforcement, and the section is predominantly in tensile stress) where this enhancement is not as pronounced.
Regarding the evaluation of the concrete compressive strength influence, it is possible to observe that once the concrete strength increases, its Young modulus also increases and consequently the deformation and the bending moment distribution decrease. Besides that, the concrete compressive strength increase also allows the strength capacities improvement or the interaction diagram “expansion”.
It is underlined that the modeling has been developed in the context of Navier-Bernoulli assumption, which is relevant for flexural behavior of slender beams. It is expected that such assumption would lead in the case of thick beams to underestimating the deflection and bending moment distributions. From the structural design viewpoint, the analysis will therefore overestimate the ultimate load-carrying capacity of the beam.
In spite of the limitations of this work: (a) analysis simplification through a beam model, (b) validation with experimental results were not performed here and (c) exact determination of the fire duration that leads to panel failure being not possible with proposed methodology, it allows designers to predict in a relatively simple and direct way the safety condition of reinforced concrete panels in fire. It is observed that most of available data from either experimental or theoretical-numerical works are actually referring to structures with thermo-mechanical boundary conditions, end support restrictions and fire exposure that are distinct from the particular situation addressed in the paper, making it therefore difficult to compare with the model predictions. In that respect, the approach developed in this paper should be extended to account for more general end-support conditions than the specific situation of pinned support at both ends.
References
- ABNT NBR 14323 (2013). Dimensionamento de estruturas de aço de edifícios em situação de incêndio: procedimento.
- ABNT NBR 15200 (2012). Projeto de estruturas de concreto em situação de incêndio: procedimento.
- Albuquerque, G. B. M. L. (2012). Dimensionamento de vigas de concreto armado em situação de incêndio, Msc. Dissertation (in Portuguese), Universidade de São Paulo, Brazil.
- Ali, F., Nadjai, A., Choi, S., (2010) Numerical and experimental investigation of the behavior of high strength concrete columns in fire. Engineering Structures, 32: 1236-1243.
- Beitel, J., Iwankiw, N., (2002). Analysis of needs and existing capabilities for full-scale fire resistance testing. Springfield NIST/NTIS. 96 p. (NIST GCR 02-843) (USA).
- Buch, S.H., Sharma, U.K., (2017) Fire Resistance of Reinforced Concrete Columns: A Systematic Review. In: Applications of Fire Engineering, Gillie & Wang (Eds), Manchester University, United Kingdom, Taylor & Francis Group.
- Buch, S.H., Sharma, U.K., (2019) Empirical model for determining fire resistance of Reinforced Concrete columns. Construction and Building Materials, 225: 838-852.
- Buchanan, A., Munukutla, V. R., (1991). Fire Resistance of Load-Bearing Reinforced Concrete Walls. Fire Safety Science 3:771-780.
- Caldas, R. B., Souza, J. J., Fakury, R. H., (2010). Interaction diagrams for reinforced concrete sections subjected to fire. Engineering Structures 32:2832-2838.
- Costa, C. N. (2008). Dimensionamento de elementos de concreto armado em situação de incêndio, Ph.D. Thesis (in Portuguese), University of Sao Paulo, Brazil.
- Crozier, D. A., Sanjayan, J. G., (2000). Tests of Load-Bearing Slender Reinforced Concrete Walls in Fire. ACI Structural Journal, 97:243-251.
- Dhir, R. K., Chana, P., Caliskan, S., Lavingia, R. (2008) Concrete for fire engineering. Warford. HIS BRE Press. 332 p. (United Kingdom)
- El-Fitiany, S.F., Youssef, M.A., (2014) Interaction diagrams for fire-exposed reinforced concrete sections. Engineering Structures, 70: 246-259.
- Gao, W.Y., Dai, J.G., Teng, J.G., Chen, G.M., (2013) Finite element modeling of reinforced concrete beams exposed to fire. Engineering Structures, 52: 488-501.
- Gernay, T., (2019) Fire resistance and burnout resistance of reinforced concrete columns. Fire Safety Journal, 104: 67-78.
- Han, L.H., Wang, W.H., Yu, H.X., (2010) Experimental behaviour of reinforced concrete (RC) beam to concrete-filled steel tubular (CFST) column frames subjected to ISO-834 standard fire. Engineering Structures, 32: 3130-3144.
- Han, L., Tan, Q., Song, T., (2013) Fire Performance of Steel Reinforced Concrete (SRC) Structures. Procedia Engineering, 62: 46-55.
- Hayhoe, W.C., Youssef, M.A., (2013) Structural Behaviour of Concrete Walls during or after Exposure to Fire: A Review. CSCE 2013 General Conference Montréal, Québec.
- ISO 834 (1990). Fire-resistance tests - Elements of building construction - Part 1.1: General requirements for fire resistance testing.
- Kumar, P., Kodur, V.K.R., (2017) Modeling the behavior of load bearing concrete walls under fire exposure. Construction and Building Materials, 154: 993-1003.
- Lee, S., Lee, C., (2013) Fire resistance of reinforced concrete bearing walls subjected to all-sided fire exposure. Materials and Structures, 46: 943-957.
- Meda, A., Gambarova, P.G., Bonomi, M., (2002) High-performance concrete in fire-exposed reinforced concrete sections. ACI Structural Journal, 99:277-87.
- Nguyen, K.T.Q., Ngo, T., Mendis, P., Heath, D., (2018) Performance of high-strength concrete walls exposed to fire. Advances in Structural Engineering, 21: 1173-1182.
- NPCA (2018) National Precast Concrete Association, Precast Products. Wall Panels and Veneer. Available in: https://precast.org/precast-product/wall-panels/ Accessed on July 2, 2018.
» https://precast.org/precast-product/wall-panels - Pham, D. T., (2014) Analyse par le calcul à la rupture de la stabilité au feu des panneaux em béton armé de grandes dimensions, Ph.D. Thesis (in Franch), Université Paris-Est, France.
- Pham, D. T. de Buhan, P., Florence C., Heck, J. V., Nguyen, H. H., (2015). Interaction diagrams of reinforced concrete sections in fire: a yield design approach. Engineering Structures 90:38-47.
- Ribeiro, J. C. L. (2004) Simulação via método dos elementos finitos da distribuição tridimensional de temperatura em estruturas em situação de incêndio, Msc. Dissertation (in Portuguese), Federal University of Belo Horizonte.
- Salençon, J. (1983). Calcul à la rupture et analyse limite, Presses de l’Ecole Nationale des Ponts et Chaussées. (Paris)
- Salençon, J. (2013). Yield design, ISTE Ltd and John Wiley and Sons, Inc. (Great Britain and the United States)
- Sun, R., Xie, B., Perera, R., Pan, Y., (2018) Modeling of Reinforced Concrete Beams Exposed to Fire by Using a Spectral Approach. Advances in Materials Science and Engineering, 2018: 1-12.
- Wickstrom, U. (2016) Temperature calculation in fire safety engineering. Springer. 243p.(Switzerland)
Appendix A
Considering Equations (24), (25) and (26), the Equations (27) and (28) can be conveniently rewritten as:
The solution of the equations system A1 provides the section geometric center strain and the element curvature , respectively:
where
Appendix B
The differential equation governing the total deflection u(x) (Equation (33)) and the evaluated problem boundary conditions (Equation 34) allows determining the deflection of reinforced concrete panels in fire. The proposed analytical method considers some variable changes:
and the solution of the resulting equation in the form:
The problem solution is:
where
Edited by
Editor:
Publication Dates
-
Publication in this collection
03 Feb 2020 -
Date of issue
2020
History
-
Received
05 June 2019 -
Reviewed
09 Dec 2019 -
Accepted
18 Dec 2019 -
Published
08 Jan 2020