 Analysis of the immunological biomarker profile during acute Zika virus infection reveals the overexpression of CXCL10, a chemokine linked to neuronal damage
Abstract
BACKGROUND Infection with Zika virus (ZIKV) manifests in a broad spectrum of disease ranging from mild illness to severe neurological complications and little is known about Zika immunopathogenesis.
OBJECTIVES To define the immunologic biomarkers that correlate with acute ZIKV infection.
METHODS We characterized the levels of circulating cytokines, chemokines, and growth factors in 54 infected patients of both genders at five different time points after symptom onset using microbeads multiplex immunoassay; comparison to 100 age-matched controls was performed for statistical analysis and data mining.
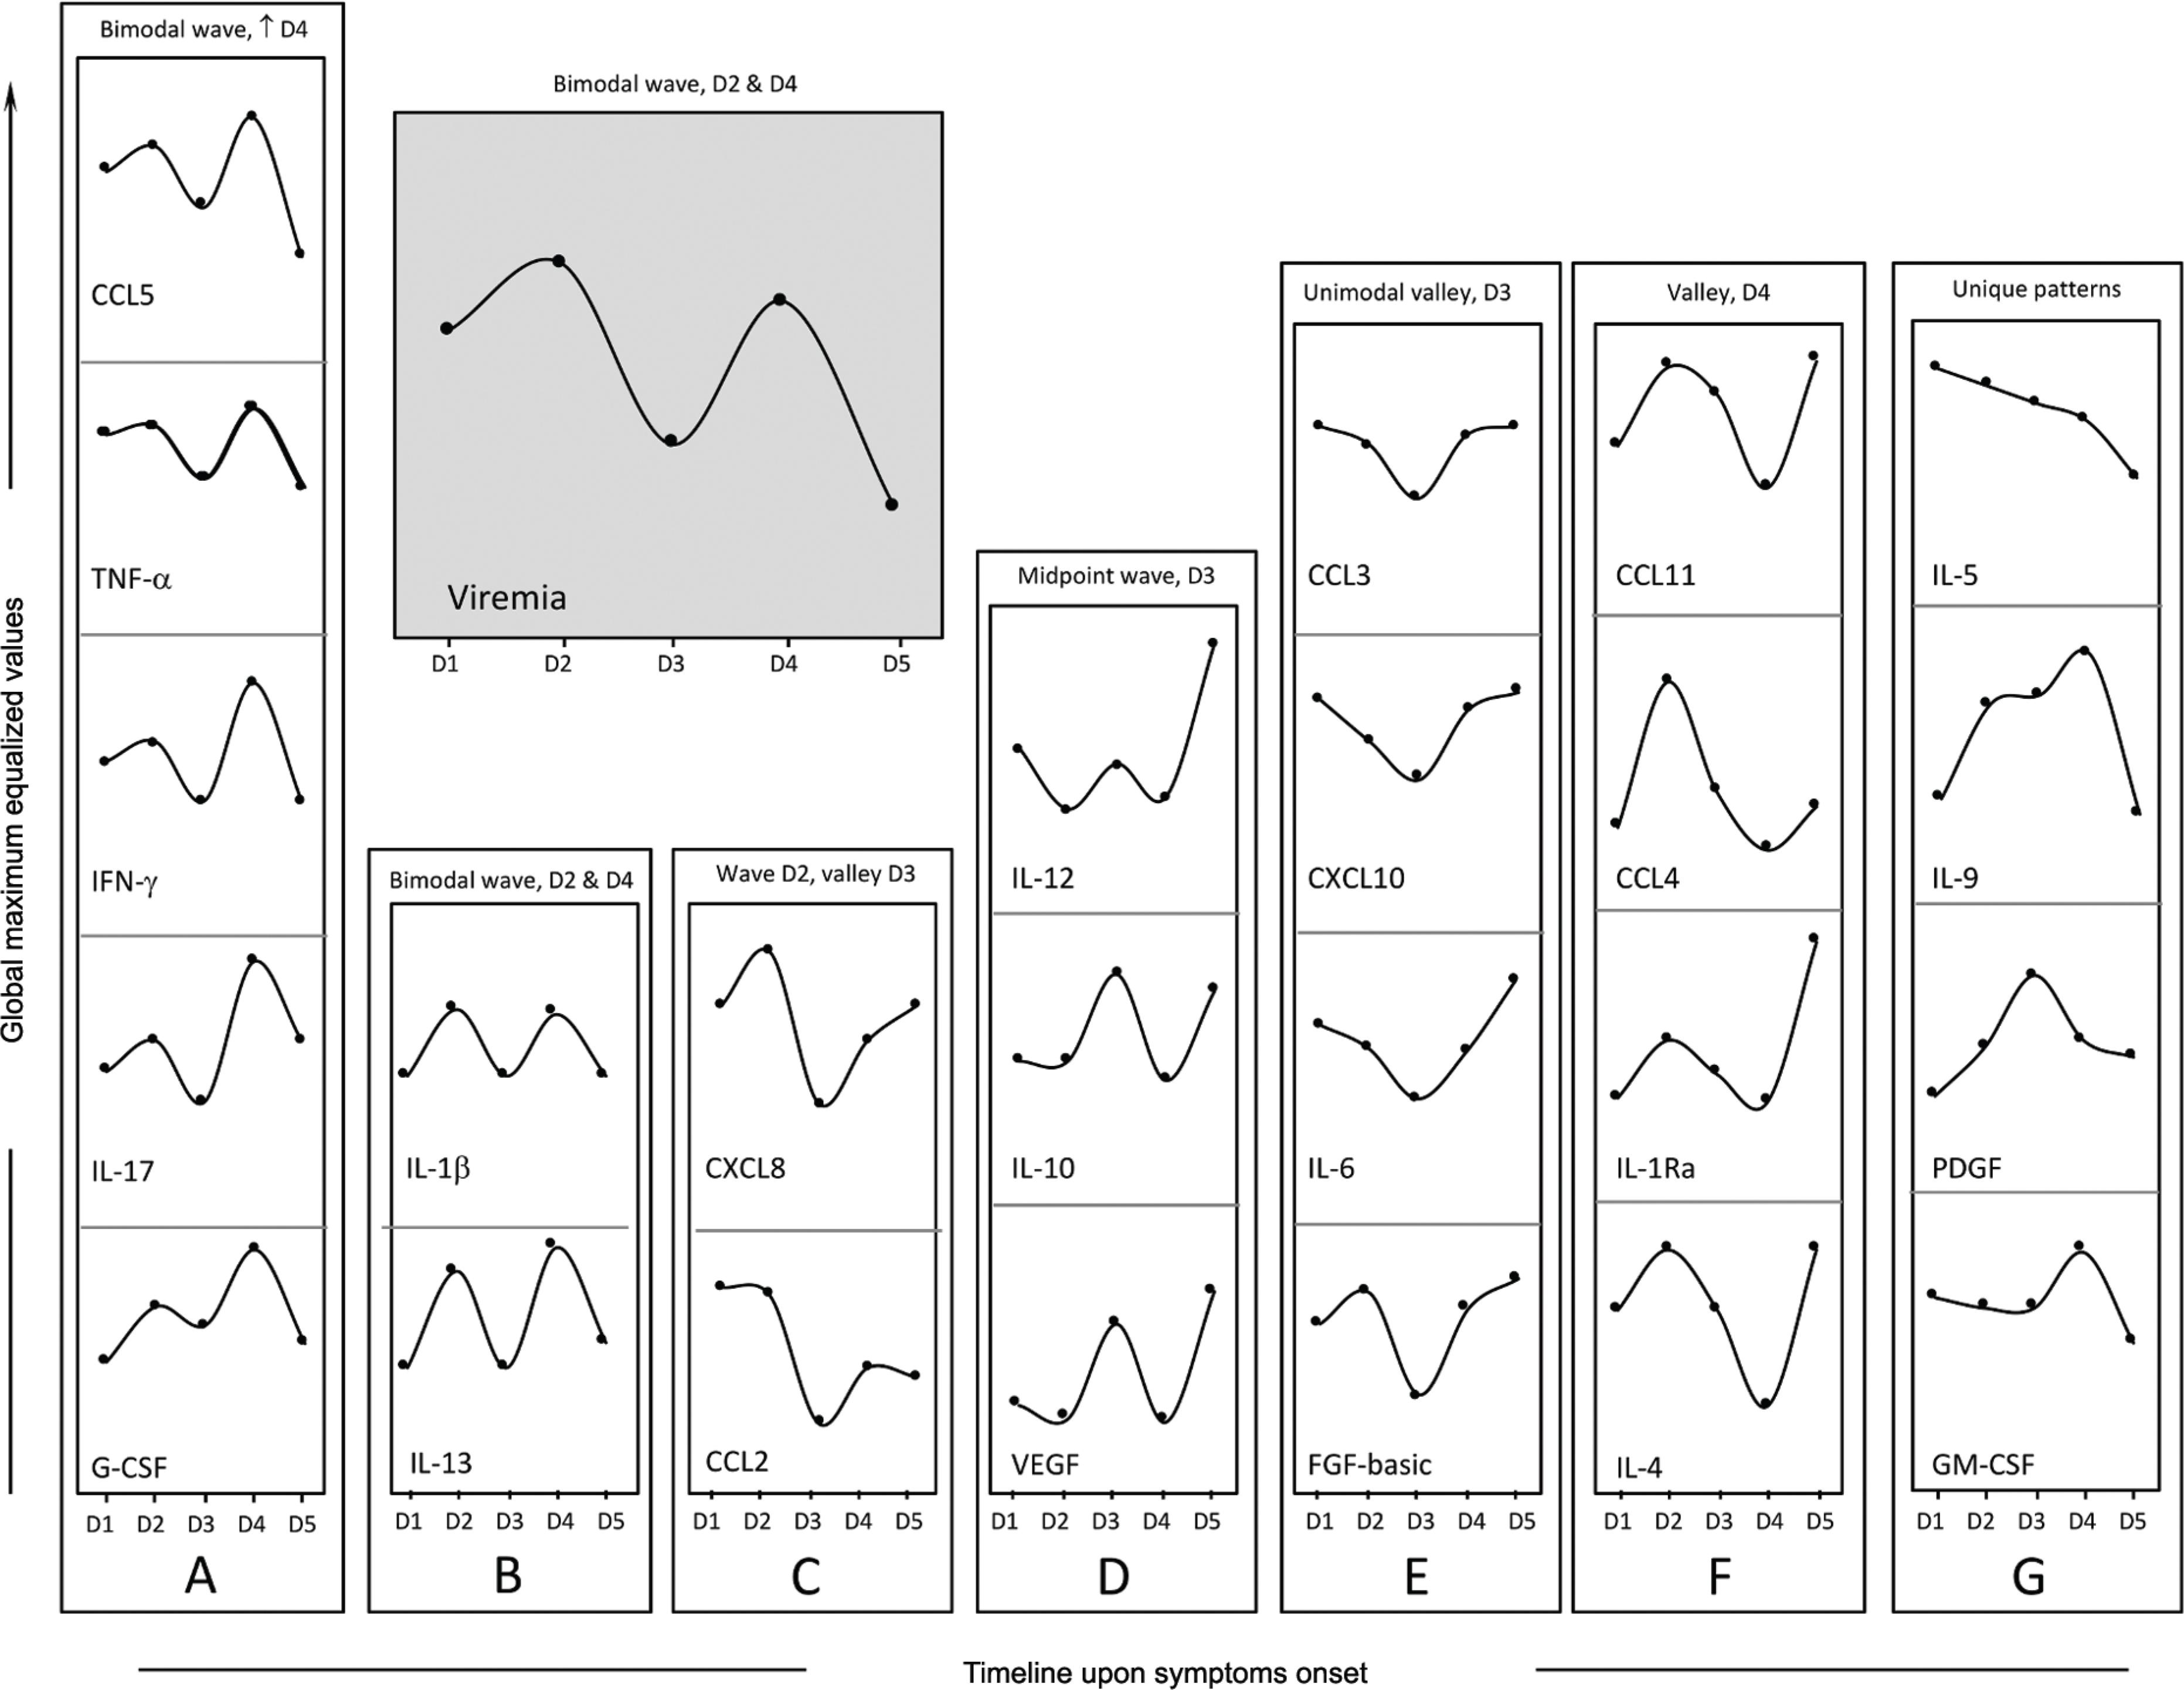
FINDINGS ZIKV-infected patients present a striking systemic inflammatory response with high levels of pro-inflammatory mediators. Despite the strong inflammatory pattern, IL-1Ra and IL-4 are also induced during the acute infection. Interestingly, the inflammatory cytokines IL-1β, IL-13, IL-17, TNF-α, and IFN-γ; chemokines CXCL8, CCL2, CCL5; and the growth factor G-CSF, displayed a bimodal distribution accompanying viremia. While this is the first manuscript to document bimodal distributions of viremia in ZIKV infection, this has been documented in other viral infections, with a primary viremia peak during mild systemic disease and a secondary peak associated with distribution of the virus to organs and tissues.
MAIN CONCLUSIONS Biomarker network analysis demonstrated distinct dynamics in concurrence with the bimodal viremia profiles at different time points during ZIKV infection. Such a robust cytokine and chemokine response has been associated with blood-brain barrier permeability and neuroinvasiveness in other flaviviral infections. High-dimensional data analysis further identified CXCL10, a chemokine involved in foetal neuron apoptosis and Guillain-Barré syndrome, as the most promising biomarker of acute ZIKV infection for potential clinical application.
Key words
Zika virus; CXCL10; biomarkers; chemokines; cytokines
 , n = 54) and non-infected subjects [non-infected (NI) =
 , n = 100] by high performance Luminex 27-plex assay as described in Methods. Data are expressed as pg/mL and are displayed in box and whisker (10-90 percentile) plots. Comparative analysis between NI vs. ZIKV was performed by Mann-Whitney test and significant differences at p < .05 are underscored by connecting lines. Coloured backgrounds highlight increased (pink), decreased (blue), and unaltered (grey) levels of serum biomarkers in ZIKV as compared to NI.