
 Evolution of Alpha-Particle Tracks in Zircon Grains and Their Relationship with Microstructure Using CR-39 Nuclear Track Detectors
Abstract
Alpha particles emitted by the radioactive decay of uranium and thorium within zircon (ZrSiO4) grains produce latent damage trails in adjacent solid-state nuclear track detectors that can be made visible by controlled chemical etching. This work investigates the evolution of these alpha-particle tracks in CR-39 (allyl diglycol carbonate) detectors coupled to zircon grains from the Kawamoto Granodiorite (OD3) geochronological standard. Detectors were subjected to chemical etching in NaOH solution at 70 °C for durations of 90, 200, 300, and 400 minutes, enabling systematic characterization of track density and morphology as a function of etching time. Track density was quantified by optical microscopy and expressed as tracks per unit area (tr/cm2). Complementary microstructural characterization was performed by scanning electron microscopy (SEM) and cathodoluminescence (CL) imaging, enabling correlation between internal crystal heterogeneities and spatial track distributions. Raman spectroscopy using a Renishaw inVia confocal micro-Raman spectrometer provided additional quantitative characterization of radiation damage at the micrometer scale. The results demonstrate that track development follows a well-defined kinetic regime, with density increasing continuously from 90 to 300 minutes and stabilizing thereafter; the interval between 200 and 300 minutes is identified as the optimal etching window. The heterogeneous spatial distribution of tracks reflects the microstructural state of the host grain, particularly compositional zoning, radiation-induced structural damage (metamictization), and microfractures, all of which modulate alpha-particle emission and detection efficiency. Raman mapping further suggests that regions of elevated track density coincide with domains of broader Raman bands and lower peak positions. These findings have direct implications for the accuracy of (U–Th)/He thermochronology and for the broader use of CR-39-based alpha spectrometry in geochronological and materials science applications.
Keywords:
CR-39 nuclear track detector; alpha-particle tracks; zircon; radiation damage
1. Introduction
Zircon (ZrSiO4) occupies a singular position among accessory minerals in Earth sciences and materials research. Its exceptional chemical and physical durability, combined with its capacity to incorporate tetravalent uranium and thorium into its crystal lattice while almost entirely excluding lead at the time of crystallization, make it an ideal geochronological system1,2. The natural radioactive decay chains of 238U, 235U, and 232Th proceed through a succession of alpha and beta emissions, ultimately producing stable lead isotopes. Each alpha-decay event releases a helium nucleus (4He, i.e., the alpha particle) with kinetic energies typically ranging from 4 to 9 MeV, depending on the specific decay step, and simultaneously generates a recoiling heavy daughter nucleus. Both projectiles deposit their energy over microscopic distances within the surrounding material, creating zones of intense atomic displacement and lattice disorder3,4.
In zircon, the cumulative effect of millions of alpha-decay events over geological timescales leads to progressive structural amorphization of the crystal, a process known as metamictization. The extent of metamictization is quantified by the alpha-dose (in α/g) and is known to dramatically alter key physical properties of the mineral, including hardness, density, thermal conductivity, and the diffusivity of radiogenic helium5-7. Metamict zircon also develops characteristic fracture patterns and compositional heterogeneities during geological processes such as recrystallization and hydrothermal alteration, which further complicate the microstructural landscape of individual grains3,4,8.
Raman spectroscopy has emerged as a particularly powerful tool for quantifying radiation damage in zircon at the grain scale. The principal Raman-active modes of crystalline zircon, notably the ν3 antisymmetric stretching mode near 1008 cm-1, the ν2 bending mode near 439 cm-1, and the external rotation (ER) mode near 357 cm-1, broaden progressively and shift to lower wavenumbers as the crystalline lattice accumulates self-irradiation damage9-11. The full width at half maximum (FWHM) of these bands provides a quantitative measure of the degree of structural disorder, and calibrations relating Raman FWHM to alpha-dose have been established for a wide range of natural zircon compositions9,12,13. These calibrations form the basis of the emerging field of Raman thermochronology, in which the radiation damage state of a grain is used to extract thermal history information analogous to that derived from (U–Th)/He or fission-track methods12,14,15.
Solid-state nuclear track detectors (SSNTDs) provide a complementary and cost-effective means of detecting and spatially mapping alpha-particle emission from radioactive minerals. CR-39, a polycarbonate polymer (C12H18O7, allyl diglycol carbonate), is the most widely used SSNTD material owing to its high sensitivity to heavy charged particles, its uniform response, and its chemical stability16,17. When an alpha particle traverses the CR-39 sheet, it creates a cylindrical trail of radiation damage along its trajectory, a latent track, arising from intense ionization and radical formation induced by the passage of the energetic nucleus. These latent tracks are submicroscopic immediately after formation, but can be preferentially enlarged by alkaline chemical etchants, rendering them visible under optical microscopy as conical pits whose size and shape encode information about the particle energy and angle of incidence16,18,19.
Recently, studies have focused on determining the shapes and parameters of alpha-particle tracks as a function of several variables, including etching solution concentration, temperature, angle of incidence, particle type, and particle energy20-28.
Despite the widespread use of CR-39 in geochronological contexts, systematic studies of the chemical etching kinetics for alpha tracks under varying conditions remain limited, and the direct spatial relationship between track density patterns and grain- scale Raman damage mapping has not been thoroughly explored. This work addresses these questions through a systematic investigation of CR-39 track evolution as a function of chemical etching time, using grains of the Kawamoto Granodiorite (OD3) zircon standard, which is characterized by notable microstructural variability and heterogeneous U–Th distributions5,6,29. The study combines optical track counting with SEM/CL microstructural analysis and confocal Raman mapping to establish a direct link between track density, compositional zoning, and accumulated radiation damage, thereby contributing to a more complete understanding of the factors controlling alpha-particle detection in CR-39-based geochronological applications.
2. Materials and Methods
2.1. Zircon sample and grain selection
The Kawamoto Granodiorite (OD3) is a Cretaceous intrusive rock from Japan, widely used as a secondary reference material in fission-track and (U–Th)/He thermochronology. In contrast to more homogeneous standards such as the Fish Canyon Tuff, OD3 zircon grains are characterized by pronounced grain-to-grain and intra-grain variability in U and Th concentrations, strong oscillatory compositional zoning, and frequent microfracturing5,6,29. These properties make OD3 an ideal test case for investigating the relationship between internal microstructure and alpha-particle detection efficiency, and justify its selection as the exclusive sample for this study.
Zircon grains were separated by conventional heavy liquid (sodium polytungstate, ρ ≈ 2.89 g/cm3, and diiodomethane, ρ ≈ 3.32 g/cm3) and Frantz isodynamic magnetic separation techniques, yielding a population of euhedral to subhedral crystals of tetragonal prismatic habit with lengths ranging from approximately 80 to 300 μm. Grains were hand-picked under a binocular microscope at 50× magnification to exclude individuals with visible inclusions, cracks, opaque zones, or anomalous morphology, thereby minimizing sources of non-radioactive track formation and ensuring high crystalline integrity in the selected population. Selected grains were mounted in Teflon supports with the largest polished face in direct contact with the detector surface, maximizing the effective alpha-emission detection area.
2.2. CR-39 detector irradiation assembly
Mounted zircon grains were placed in direct physical contact with CR-39 plastic detector sheets (TASTRAK® grade, Track Analysis Systems Ltd., Bristol, UK) and stored in sealed, light-tight containers at room temperature for irradiation periods of 1, 3, 4, and 7 months. During storage, alpha particles emitted by the 238U, 235U, and 232Th decay chains within the grains penetrate the CR-39 surface and create latent tracks at positions corresponding to the projected alpha-emitter distribution. Because the range of alpha particles with energies between 4 and 9 MeV in CR-39 is on the order of 20–40 μm16,19, only emitters within a thin surface layer of the zircon grain contribute to the track record, ensuring that the observed track pattern reflects the near-surface spatial distribution of radioactive parents. The experimental assembly is illustrated schematically in Figure 1, adapted from Stuani Pereira and Tello Sáenz19.

Schematic of the CR-39 detector irradiation assembly. Zircon grains embedded in a Teflon support are placed face-down in direct contact with the CR-39 sheet. Alpha particles emitted by radioactive decay within the grain penetrate the polymer and create latent damage tracks. The mirror-image pattern observed on the detector surface after etching directly maps the alpha-emitter distribution at the grain surface. Modified from Stuani Pereira and Tello Sáenz19.
Furthermore, an irradiation period of one month already represents a relatively short and experimentally practical laboratory duration, while still being sufficient to obtain a statistically meaningful density of alpha particle tracks in the CR-39 detectors. This is due to the constant alpha decay activity, as the mineral has already reached secular equilibrium (on the order of ~1 Ma).
2.3. Chemical etching protocol
After the irradiation period, detectors were carefully separated from the zircon grains and processed individually by chemical etching. The etching solution was 6.25 N sodium hydroxide (NaOH), prepared by dissolving analytical-grade NaOH pellets in deionized water and calibrating the normality by standard acid–base titration. The solution was placed in a thermostated water bath and allowed to equilibrate at 70.0 ± 0.5°C before introducing the detectors. Temperature stability is critical because both the track etch rate (Vt) and the bulk etch rate of the undamaged polymer (VB) are thermally activated quantities; deviations of even 1°C can alter the ratio Vt/VB and thus the track opening angle and the detection efficiency, particularly for low-energy or obliquely incident particles16,18,19.
A fresh 6.25 N NaOH solution was prepared for each etching session and was not reused across sessions. This precaution is warranted by the chemistry of PADC etching: alkaline hydrolysis of the carbonate ester groups releases dissolved organic and carbonate degradation products into the bath27, which accumulate progressively and can reduce the effective hydroxide concentration and alter the etching kinetics over extended or repeated-use sessions. For the small detector surface areas (≈1 cm2 per piece) and single-session etching intervals used here (90–400 min), the mass of PADC dissolved per session is negligible, and the change in solution normality is estimated to be less than 1%, well within the tolerance of the ±0.5 °C temperature control. As a general guideline, the etchant normality should be verified by titration or the solution replaced when cumulative etching time in a single bath exceeds approximately 6 h at 70 °C, or when a drift in VB is detected27.
The chemical etching process operates by preferential attack of the alkaline solution along the latent damage trail, where radiation-induced chain scissions and radical formation in the polycarbonate matrix have locally weakened the polymer network. The etchant penetrates the track at a rate Vt that far exceeds the surface dissolution rate VB of the undamaged bulk material. The result is a progressively enlarging conical pit, open toward the detector surface, whose half-angle θ satisfies sinθ = VB/Vt. As etching proceeds, the cone deepens along the track axis while simultaneously widening at the surface. The opening diameter at the detector surface is therefore a monotonically increasing function of etching time for a given track, as long as the conical tip has not yet been obliterated by convergence of the two VB surfaces from opposite sides of the track, a condition that defines the maximum useful etching time2,16,18.
Under the etching conditions employed here (6.25 N NaOH, 70.0 ± 0.5 °C), the bulk etch rate VB of TASTRAK® CR-39 is well established in the literature, with reported values ranging from 1.28 to 1.55 µm/h and a consensus near 1.37 µm/h [20, 22, 25, 26, 28]. The track etch rate VT for alpha particles in the energy range relevant to the U–Th decay chains in zircon (4.0–8.9 MeV) reaches peak values of approximately 5–10 µm/h near the Bragg region, yielding reduced etch rate ratios V = VT/VB of approximately 4–720,26,28. Temperature exerts a strong influence on VB22; a deviation of even 1 °C from the target temperature introduces a systematic shift in VB of approximately 0.1 µm/h, justifying the ±0.5 °C stability maintained throughout the etching series. These literature-calibrated values confirm that our protocol operates within the well-characterized kinetic regime for this detector–etchant combination and that the track morphologies and detection efficiencies observed in our etching curves are consistent with expectations from the parametrization studies cited above20-28.
Four etching durations were systematically investigated: 90, 200, 300, and 400 minutes. These time points were chosen to span the full kinetic range from initial track revelation through optimal counting conditions to the onset of over-etching saturation, following parametrization studies for CR-39 in the alpha-particle energy range relevant to U–Th decay chains16,18,19. After each etching interval, individual detectors were removed from the bath, immediately rinsed in deionized water for five minutes to halt the etching reaction, and finally air-dried at room temperature for at least 30 minutes before optical examination. All handling was performed with plastic tweezers to avoid mechanical damage to the etched surface.
2.4. Track density measurement
After chemical etching, alpha-particle tracks revealed in the CR-39 detectors were counted under transmitted-light optical microscopy. For each detector, the projected area A corresponding to the coupled zircon grain was manually delineated and used as the counting region. The total number of tracks NT observed within this area was recorded, and the track density ρ was calculated as:
where is the total number of counted tracks and is the projected counting area.
The uncertainty on ρ was estimated assuming Poisson counting statistics, appropriate for discrete counting events in which each registered alpha-particle track is an independent detection event:
This expression gives the counting uncertainty directly in units of tr cm−2 and was used to compute the error bars displayed.
The resulting uncertainty values were used as error bars in the track-density plots. This approach accounts for the statistical uncertainty associated with the finite number of counted alpha-particle tracks within each analyzed grain area.
Track-counting software such as TRACK_TEST and ImageJ-based image analysis tools are widely used in the SSNTD community for automated track detection, track morphometry, and quantitative counting procedures in relatively homogeneous irradiation fields and well-defined detector surfaces20,26,30,31. However, their application to the present dataset is complicated by characteristics inherent to natural zircon grains. The OD3 grains exhibit pronounced spatial heterogeneity in alpha-particle track density, with adjacent domains showing markedly different levels of radiation damage and U–Th enrichment, as revealed by CL imaging and Raman spectroscopy16,19,21. Furthermore, alpha particles emitted throughout the U–Th decay chains span a broad energy range (approximately 4.0–8.9 MeV), generating a continuous distribution of etched-track sizes and morphologies at a given etching time rather than a single characteristic geometry20,26. Surface microstructural features of zircon grains, including dissolution pits, microfractures, polishing defects, and other topographic irregularities, may also produce image artifacts that interfere with automated segmentation and track recognition16,19,21. For these reasons, track densities were determined by manual counting within the projected area of each zircon grain using optical microscopy at 400× magnification and explicit morphological selection criteria. This procedure provided the most reliable discrimination between true alpha-particle tracks and non-track surface features in the present study. Future work will explore adaptive image-analysis approaches and machine-learning-assisted track recognition methods for the automated analysis of heterogeneous natural zircon datasets.
2.5. SEM and cathodoluminescence characterization
After track counting, selected zircon grains were kept in their original Teflon mounts and prepared directly for microstructural characterization. The mounted samples were sputter-coated with a thin carbon film (approximately 10 nm) using a Quorum Sputter Coater Q150T to ensure adequate electrical conductivity and prevent charging artifacts during electron beam irradiation. Microstructural characterization was performed using a Zeiss EVO LS15 scanning electron microscope operated at an accelerating voltage of 30 kV and a working distance of approximately 7.5 mm. Secondary electron (SE) images were acquired to document the external crystal morphology, surface texture, and physical defects such as microfractures, dissolution pits, and abrasion features.
Cathodoluminescence (CL) images were acquired using the CL detector coupled to the Zeiss EVO LS15. In zircon, CL contrast is sensitive to both chemical and structural variations, including trace-element activators and quenchers, radiation damage, and local crystalline disorder. Therefore, CL-dark and CL-bright domains should be interpreted as relative indicators of internal heterogeneity rather than as direct quantitative maps of U–Th concentration, as U- and Th-rich zones also tend to quench the CL signal and appear dark, whereas relatively pure, undamaged zircon domains emit brighter luminescence3,8,32. The CL images were used to identify zoning patterns and to provide a microstructural reference for comparison with the spatial distribution of alpha-particle tracks in the associated CR-39 detectors.
For the ROI-based comparison, the SEM-CL raster images were exported as grayscale images and analyzed using a Python routine. The image coordinate system was calibrated from the axis scale of the exported map, allowing selected points to be converted from sample coordinates in micrometers to pixel coordinates. Circular ROIs with a radius of 10 µm were then centered on the selected points for CL intensity extraction. This radius was chosen to match the spatial scale of the CL zoning features visible in the SEM-CL images while remaining small enough to avoid averaging across distinct microstructural domains. For each ROI, the raw grayscale pixel values were normalized to the 0–1 interval according to , and the mean, standard deviation, median, minimum, and maximum normalized CL intensities were calculated. These normalized CL values are therefore treated as relative grayscale intensities extracted from SEM-CL raster images, not as calibrated absolute CL emission intensities.
2.6. Raman spectroscopy
Raman spectra were acquired using a confocal micro-Raman spectrometer (Renishaw inVia) equipped with a 633 nm He–Ne laser and a high-magnification objective in confocal configuration (500 x total optical magnification). Measurements were performed on polished zircon mounts. Raman maps were acquired with an x–y step size of 2.5 µm and a single accumulation of 0.1 s per spectrum, using a spectral sampling interval of approximately 1.2 cm−1. The short exposure time per pixel limits cumulative laser energy deposition and reduces the risk of laser-induced thermal annealing in radiation-damaged zircon domains9. This short exposure time per pixel was chosen to minimise the risk of laser-induced thermal annealing of radiation-damaged domains, which has been reported in metamict zircon at sustained powers exceeding a few milliwatts9. This configuration provided micrometric spatial sampling within individual grains and allowed Raman parameters to be extracted on a pixel-by-pixel basis.
The Raman-shift axis was calibrated using crystalline silicon reference spectra acquired under the same instrumental configuration. The calibration was based on the first-order Si Raman band at approximately 520.7 cm-1. To estimate the instrumental contribution to linewidth broadening, the Si reference spectra were fitted with full Voigt convolution profiles in which the Lorentzian component, representing the intrinsic phonon lifetime broadening of crystalline Si, was fixed at approximately 3 cm-1. The fitted Gaussian contribution was then used as an empirical spectral-resolution parameter . In the subsequent zircon analysis, this parameter was approximately ~2.4 cm-1.
The principal zircon Raman modes monitored were the antisymmetric Si–O stretching mode near 1008 cm-1, the O–Si–O bending mode near 439 cm-1, and the external rotation (ER) mode near 357 cm-1. For each mode, the peak position, FWHM and integrated intensity were extracted from each spectrum after local background subtraction. Because the zircon spectra showed flat to weakly inclined backgrounds over the selected fitting intervals, the background was modeled as a local linear baseline. The baseline was estimated from the edge portions of each band-specific spectral window and subtracted prior to fitting. Each Raman band was fitted independently with a single pseudo-Voigt profile,
where the Gaussian component is given by
and the Lorentzian component by
Here is the peak height above the local baseline, is the peak position, is the raw fitted FWHM, and is the Lorentzian mixing fraction. The full fitted intensity was therefore , where is the local linear baseline. The mixing parameter was bounded to . Peak centers were constrained to 345–357 cm-1 for ER, 430–440 cm-1 for , and 995–1008 cm-1 for . Accepted raw FWHM ranges were 2–25 cm-1 for ER, 2–15 cm-1 for , and 2–20 cm-1 for . Fits were rejected if the peak height was below the band-specific threshold, if , if the integrated area was non-positive, or if the fitted center or FWHM fell outside the accepted limits.
The extracted Raman parameters were used as quantitative proxies for radiation-induced structural disorder. Increasing radiation damage in zircon is commonly associated with Raman band broadening, shifting toward lower wavenumbers, and reduced spectral definition, reflecting the progressive loss of long-range crystalline order. Raman intensity was considered more cautiously, since it can also be affected by crystallographic orientation, focusing conditions, and local optical coupling; therefore, the FWHM and peak-position parameters were used as the primary indicators of radiation damage9,10,12,13.
The raw fitted FWHM values were corrected for instrumental broadening using the simplified equation derived by Irmer for a triangular apparatus function9,33:
where s = 2.4 cm-1 is the silicon-derived instrumental spectral-resolution parameter. Raw fitted FWHM values were retained separately, while corrected FWHM values were used for the Raman maps and for the comparison with CR-39 track-density distributions.
The integrated intensity was calculated by trapezoidal integration of the baseline-subtracted experimental signal over the fitted peak window, rather than from the analytical pseudo-Voigt area:
For ROI-based analyses, the reported Raman parameters correspond to the arithmetic mean of all accepted pixels within each selected region of interest. The associated uncertainty was expressed as the standard error of the accepted pixel values within the same ROI, thereby representing the local spatial variability of the Raman response. Spectral maps were then overlaid with the corresponding CR-39 track-density distributions to enable direct spatial comparison between the Raman damage record and the alpha-particle emission pattern.
3. Results and Discussion
3.1. Track morphology and evolution with etching time
The evolution of alpha-particle tracks in the CR-39 detectors shows a clear and systematic dependence on chemical etching duration, reflecting the progressive enlargement of latent damage trails by the alkaline etchant. This kinetic behavior is consistent with the theoretical framework for SSNTD etching, in which track radius grows monotonically with time as long as bulk etching of the undamaged surface has not yet obliterated the track opening16,18.
At the shortest etching duration of 90 minutes, a substantial number of visible tracks is already present in the detectors associated with OD3 grains (Figure 2). The tracks appear as small, roughly circular dark spots against the translucent CR-39 background under transmitted light, with diameters on the order of 3–5 μm. Their distribution across the detector surface is notably non-uniform: a concentrated cluster of tracks occupies the projected footprint of the zircon grain, while the periphery is largely free of tracks. Within the grain-projected area, the density is internally heterogeneous, with certain sub-regions showing considerably higher track concentrations than others. This heterogeneity, as demonstrated in sections 3.3 and 3.4, directly reflects variations in the local concentration of alpha-emitting isotopes and the structural state of the crystal. At 90 minutes, high-density regions carry a risk of undercounting due to unresolved overlapping tracks, while low-density regions may suffer from incomplete revelation of weakly damaged or obliquely incident tracks that have not yet reached the detectable size threshold.

Optical micrograph of a CR-39 detector coupled to the OD3 sample after 90 minutes of chemical etching in 6.25 N NaOH at 70 °C. Individual alpha-particle tracks are visible as dark, roughly circular spots against the translucent polymer background. The track distribution is spatially heterogeneous, reflecting the underlying compositional zoning of the zircon grain. Peripheral regions of the grain projection show reduced track density, indicative of structural heterogeneity and the finite range of alpha particles in the detector material. Scale bar: 50 μm.
As etching time increases to 200 and 300 minutes, tracks grow progressively larger and acquire a more well-defined, higher-contrast morphology (Figure 3). At 200 minutes, average track diameters have approximately doubled relative to the 90-minute stage, reaching approximately 8–12 μm. The contrast between tracks and the surrounding undamaged polymer background improves markedly, facilitating unambiguous identification and counting even in moderately dense regions. At 300 minutes, tracks are at their optimal size for quantitative analysis: large enough to be reliably detected and individually counted at standard magnifications (400×), yet small enough that even the densest sub-regions of the OD3 grain projection remain resolvable without systematic track-overlap bias. The spatial heterogeneity observed at 90 minutes is preserved and more clearly resolved at these intermediate etching times, as the contrast between high- and low-density sub-regions is amplified by the increased track area. Tracks from different steps of the U–Th decay chains are not individually distinguishable in terms of track size under these etching conditions, since all alpha energies in the relevant range (4.0–8.9 MeV) produce tracks of similar length in CR-3916,19.

Optical micrographs of CR-39 detectors coupled to OD3 grains at three chemical etching durations: 200 minutes (upper left), 300 minutes (upper right), and 400 minutes (lower center). Track definition and contrast improve progressively from 200 to 300 minutes. At 400 minutes, track overlap in high-density zones and increased surface roughness compromise individual track resolution. The 300-minute condition represents the optimal etching window for this sample. Scale bar: 200 μm.
Beyond 300 minutes, the 400-minute etching stage reveals a clear saturation tendency. Track diameters have grown to the point where adjacent tracks in high-density regions begin to merge into irregularly shaped composite features that are no longer individually countable. Simultaneously, continued bulk dissolution of the undamaged polymer surface introduces higher background roughness and random etch pits from pre-existing surface defects, complicating discrimination between genuine alpha tracks and artifacts. As a consequence, track density values measured at 400 minutes systematically underestimate the true value in dense regions, confirming that etching beyond 300 minutes offers no analytical benefit and actively degrades data quality.
3.2. Etching curves and quantitative track density analysis
The quantitative track density measurements obtained at each etching time were assembled into etching curves for the two independent OD3 detector assemblies (OD3-1 and OD3-2), displayed in Figure 4. Track density (in units of 104 tr/cm2) was calculated from the total number of alpha-particle tracks counted within the projected area of each zircon grain and plotted as a function of etching time. Error bars represent ±1σ uncertainties derived from Poisson counting statistics, calculated from the total number of counted tracks for each measurement. Four irradiation series (1, 3, 4, and 7 months of exposure) are shown to assess the effect of accumulated alpha-particle flux on the etching-curve shape and absolute track densities.

Evolution of alpha-particle track density as a function of chemical etching time for the OD3-1 and OD3-2 zircon grains. Track density was calculated from the total number of tracks counted within the projected area of each zircon grain. Error bars represent ±1σ uncertainties derived from Poisson counting statistics, calculated from the total number of counted tracks for each measurement.
All OD3 series exhibit the same general kinetic behavior: track density increases continuously from 90 to approximately 300 minutes, after which the curves flatten into a plateau that persists to 400 minutes. This pattern is physically expected within the track revelation model: at short etching times, only the largest and most damage-intense tracks have grown to a size detectable by optical microscopy, and the counted density is therefore a significant underestimate of the true latent track density. As etching progresses, progressively smaller and more obliquely incident tracks are revealed, and the counted density rises toward the asymptotic value corresponding to complete revelation of all latent tracks within the detection-sensitive near-surface layer. The plateau beyond 300 minutes confirms that essentially all latent tracks have been developed at this point; subsequent enlargement modifies track size but does not reveal new tracks.
The OD3 curves exhibit larger counting uncertainties at shorter etching times, when fewer tracks are revealed and the total number of counted events is lower. As etching progresses and more latent tracks become detectable, the relative Poisson uncertainty decreases because the number of counted tracks increases. Although the error bars represent counting statistics rather than spatial variability, the differences observed between irradiation series remain significantly larger than the associated uncertainties. Longer irradiation periods yield proportionally higher plateau densities, consistent with progressive alpha-particle accumulation. The overall agreement between the OD3-1 and OD3-2 independent mounts further supports the reproducibility of the experimental procedure and confirms that the observed differences are not an artifact of counting statistics.
3.3. Microstructural controls on track distribution
The SEM and CL analyses of individual OD3 zircon grains reveal the morphological and structural complexity that underlies the heterogeneous track distributions observed in the CR-39 detectors. Figure 5 shows representative SE and CL images of the same OD3-1 grain, acquired simultaneously on the Zeiss EVO LS15 at 30 kV.

Scanning electron microscopy images of a zircon grain from the OD3-1 sample acquired on a Zeiss EVO LS15 SEM (30 kV, WD = 7.5 mm, 500×). Left: secondary electron (SE) image showing the external crystal morphology, with well-developed prismatic faces, a pyramidal termination, surface microfractures, and shallow dissolution pits. Right: cathodoluminescence (CL) image of the same grain, revealing internal oscillatory compositional zoning as alternating bright and dark concentric bands. CL-dark zones are interpreted as regions of reduced luminescence efficiency, commonly associated with enhanced U and Th content and/or accumulated structural disorder, while CL-bright zones represent relatively U–Th-poor, structurally intact regions.
The SE image documents the well-developed prismatic habit of the grain, with planar {100} and {110} prism faces intersecting at sharp edges and terminating in a bipyramidal tip. Superimposed on this primary crystal morphology are secondary features including hairline microfractures cutting across prismatic faces, shallow dissolution pits clustered along structural defects, and subtle surface roughness in radiation-damaged zones. These physical heterogeneities have direct consequences for alpha-particle detection: microfractures parallel to the detector surface may locally deplete the near-surface zone of alpha emitters or create void spaces that attenuate particle flux, while pronounced surface roughness may affect the contact geometry between the grain and the CR-39, locally increasing the detector-grain distance and reducing the solid angle of particle reception.
The CL image reveals well-developed internal zoning within the OD3 zircon grain. The alternating bright and dark bands are consistent with oscillatory zoning, a common feature of magmatic zircon that reflects changes in crystallization conditions and trace-element incorporation during growth3,8,32. Previous studies3,9,10,34,35 have shown that CL contrast in zircon is sensitive to both chemical composition and structural state, including the effects of trace-element activators and quenchers, radiation damage, and lattice disorder. In this context, CL-dark domains are interpreted as zones where luminescence is suppressed by some combination of compositional enrichment and accumulated structural damage, whereas CL-bright domains likely correspond to regions with comparatively lower quenching and better-preserved crystallinity. The CL image therefore provides an important qualitative guide to internal heterogeneity, which can be compared spatially with CR-39 track density and Raman damage parameters.
Figure 6 presents the integrated view of the grain surface, internal structure, and the corresponding alpha-track distribution in the CR-39 detector, enabling a qualitative visual spatial comparison of all three data layers.

Multimodal microstructural characterization of the OD3-1 zircon grain shown in Figure 5. Left: reflected-light optical image of the grain surface showing external morphology and surface features. Center: transmitted-light optical image of the grain interior, revealing internal fractures, inclusions, and zones of differential transparency possibly associated with varying degrees of metamictization. Right: optical micrograph of the associated CR-39 detector surface after optimal etching, showing the spatial distribution of alpha-particle tracks. The preferential concentration of tracks in specific sub-regions corresponds spatially to the U–Th-rich CL-dark zones in Figure 5. Track-depleted regions coincide with metamict or fractured domains where alpha-particle escape probability is reduced. Scale bars: 30–50 μm.
To test whether the visual correspondence between CL zoning and alpha-track distribution could be quantified, we performed an ROI-based comparison between normalized CL intensity and alpha-particle track density. Eleven regions of interest were selected across the grain-detector pair, covering domains with different CL responses and track-density levels. For each ROI, the alpha-particle track density was calculated from the number of tracks counted within the selected area, while the corresponding mean normalized CL intensity was extracted from the SEM-CL raster image after pixel-intensity normalization.
The resulting comparison is shown in Figure 7. Although the number of ROIs is limited and the analysis is restricted to a single mapped grain, the data show a clear relationship between CL contrast and alpha-track density. Regions with lower normalized CL intensity, corresponding to CL-darker domains, tend to show higher track densities, whereas brighter CL regions generally show lower track densities. This exponential decay trend supports the interpretation that the CR-39 detector records spatial variations in the near-surface alpha-emitter distribution of the coupled zircon grain. However, because CL intensity is affected by both compositional and structural factors, the correlation is interpreted as a qualitative-to-semiquantitative indicator of internal heterogeneity rather than as a direct calibration between CL intensity and U–Th concentration.
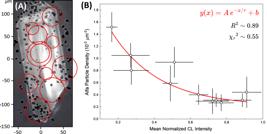
ROI-based comparison between cathodoluminescence intensity and alpha-particle track density. (A) Overlay between the optical micrograph of the etched CR-39 detector, showing alpha-particle tracks, and the cathodoluminescence (CL) image of the corresponding zircon grain. Red circles indicate the regions of interest (ROIs) used for track counting and CL-intensity extraction. (B) Scatter plot of mean normalized CL intensity versus alpha-particle track density for the ROIs shown in (A). The red line represents the fitted trend, with the corresponding equation, , and reduced values indicated in the plot. Error bars represent the standard error of the mean for CL intensity and the Poisson counting uncertainty for track density.
The correspondence between CL intensity and track density is not expected to be perfectly uniform. Some ROIs slightly deviate from the fitted trend, indicating that CL contrast alone does not fully determine the local number of registered alpha-particle tracks. These deviations may reflect the combined influence of several factors, including local variations in U–Th distribution, surface relief, grain-detector contact geometry, microfractures, and the heterogeneous structural state of the zircon. Fractured or strongly damaged domains may locally modify the effective alpha-particle escape geometry or reduce the quality of contact between the grain and the CR-39 detector2,3,9,36.
3.4. Multiband Raman mapping and comparison with alpha-track density
Spatially resolved Raman maps were combined with CR-39 track-density distributions to compare zircon microstructure, accumulated radiation damage, and near-surface alpha-particle emission. Raman band broadening and shifts record lattice disorder produced by self-irradiation, whereas CR-39 registers alpha particles emitted from the near-surface region of the coupled grain during the irradiation interval. The two datasets are therefore expected to be spatially related through the local U–Th distribution, but they do not represent the same physical quantity: Raman parameters reflect the integrated structural damage state of the crystal, while CR-39 track density reflects the alpha-particle flux registered during the experimental exposure9,33,35,37,38.
Because OD3 is a relatively young zircon reference material, its Raman response is expected to remain within a predominantly crystalline to moderately damaged range, rather than approaching the highly metamict regime typical of older or more radiation-damaged zircons9,39. The observed Raman variations are therefore subtle compared with those of highly damaged zircon, but they are spatially coherent and measurable.
The multiband Raman maps shown in Figure 8 indicate that the external rotation (ER) mode near 356 cm-1 provides the most coherent spatial pattern in both FWHM and peak position. The O–Si–O bending mode near 439 cm-1 also shows a consistent distribution, although over a narrower dynamic range. The SiO4 antisymmetric stretching mode near 1008 cm-1 remains important because it is widely used in zircon Raman-damage calibrations; however, in this dataset, its FWHM and peak-position maps show stronger pixel-scale scatter, probably due to the weaker ν3 signal under the present acquisition conditions and its greater sensitivity to signal-to-noise limitations, local orientation effects, and fitting uncertainty.
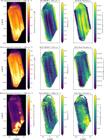
Multiband Raman maps of the OD3 zircon grain. Rows correspond to ER, , and modes; columns correspond to integrated intensity, corrected FWHM, and peak position. The ER mode shows the clearest spatial coherence in both linewidth and peak position, whereas the maps show stronger pixel-scale scatter. Intensity maps are included to evaluate signal distribution and fitting reliability but not used as primary damage proxies.
The intensity maps show clear spatial variations among the three Raman modes, with the band substantially weaker than the ER and bands. However, Raman intensity was not used as a direct radiation-damage proxy because it is sensitive to crystallographic orientation, focusing conditions, surface relief, optical coupling, and local signal-to-noise variations. The comparison with alpha-track density therefore emphasizes FWHM and peak position, while integrated intensity is used mainly to assess spectral quality and fitting reliability9,10,12-14.
Representative spectra were extracted from three ROIs across the mapped OD3 grain to verify whether the spatial variations in the Raman maps correspond to measurable spectral changes. The selected ROIs represent domains with comparatively low, intermediate, and high Raman linewidths, rather than crystalline-to-metamict endmembers. Their positions are shown on both the Raman map and the CL image in Figure 9.

Representative Raman spectra extracted from 3 selected ROIs in the OD3 zircon grain: (A) Raman FWHM map and corresponding CL image (B) with the selected ROIs indicated. The points were chosen to represent comparatively lower, intermediate, and higher Raman linewidth domains within the mapped grain. (C) Full raw Raman spectra from the selected ROIs, showing the main zircon Raman bands and a visible signal-to-noise difference. Right: expanded spectral windows for the ER (D), ν2 (E), and ν3 modes (F), showing the local peak-shape differences used to support the FWHM and peak-position maps. Expanded spectra are shown after baseline subtraction and vertical offset for clarity, with the individual pseudo-Voigt fits overlaid as solid lines and the corrected FWHM of each band annotated directly on the plot.
The full spectra confirm that all selected regions preserve the characteristic zircon Raman bands, including the ER mode near 356 cm-1, the mode near 439 cm-1, and the mode near 1008 cm-1. Nevertheless, the selected ROIs differ in peak shape. In the expanded windows, the higher-FWHM domain shows broader and slightly shifted peaks relative to the lower-FWHM domain, particularly for the ER mode, which displays the clearest coupled variation between FWHM and peak position. The band shows similar but weaker broadening, although the expected inverse FWHM–position relationship is not clearly resolved in the Figure 8 maps9,12. The band remains relevant as a standard zircon damage-sensitive mode and shows some broadening and shifting, but in this dataset it has lower signal quality and stronger scatter than the ER mode.
These representative spectra show that the mapped FWHM and peak-position variations are not artifacts of image processing alone, but reflect measurable differences in Raman peak shape within the grain. Because these differences are moderate, as expected for a relatively young OD3 zircon, they are interpreted as relative variations in structural disorder within a predominantly crystalline grain, not as a transition from crystalline to highly metamict zircon9.
Following the analysis shown in Figure 7, a ROI-based comparison was performed between alpha-particle track density, Raman-derived damage parameters, and normalized CL intensity. The eleven ROIs selected on the CR-39 image were transferred to the corresponding Raman and CL coordinate systems. For each ROI, alpha-track density was calculated from the number of tracks counted within the selected circular area; mean Raman FWHM and peak position were calculated from accepted spectra within the corresponding Raman-map region; and mean normalized CL intensity was extracted from the SEM-CL raster image using the same ROI centers.
Table 1 summarizes the ROI-based dataset used for the correlation analysis, including counting area, number of tracks, track density, mean normalized CL intensity, and Raman FWHM and peak-position values for the ER, , and modes. Integrated Raman intensity is not tabulated because it is not used as a radiation-damage proxy in the present study, as discussed in Section 2.6; the intensity maps in Figure 8 are provided only for the assessment of spatial signal quality and fitting reliability. These data provide an initial quantitative basis for comparing local alpha-track density with Raman-derived disorder parameters and CL contrast.
ROI-based alpha-track density, Raman parameters, and normalized CL intensity for selected regions of the OD3 zircon grain shown in Figure 7.
The ROI-based trends are shown in Figure 10. Because the ER mode near 356 cm-1 yielded the most spatially coherent FWHM and peak-position maps, it was selected as the principal Raman parameter for the correlation plots. ROIs with higher alpha-track densities generally show broader ER bands and lower ER peak positions, consistent with the expected broadening and downshift of zircon Raman bands with increasing self-irradiation damage9,10. The FWHM shows a similar tendency but with greater scatter, consistent with the weaker signal and lower spatial coherence observed in the Raman maps. The interpretation is therefore based on the multiband Raman response, with emphasis on the ER mode rather than on a single spectral parameter alone11,14.

ROI-based quantitative comparison between alpha-particle track density, Raman parameters, and normalized CL intensity. (A) Alpha-particle track density versus ER FWHM. (B) Alpha-particle track density versus ER peak position. (C) Alpha-particle track density versus FWHM. (D) Mean normalized CL intensity versus ER peak position. Each point corresponds to one ROI selected on the CR-39 image from Figure 7A and transferred to the Raman and CL maps. The linear fits are shown for each plot with Pearson’s r and p-values.
Normalized CL intensity provides an additional comparison with the Raman-derived disorder indicators. ROIs with lower normalized CL intensity generally correspond to lower ER peak positions, whereas brighter CL regions tend to show higher ER peak positions. This behavior is compatible with stronger luminescence quenching in CL-dark domains due to some combination of compositional variation, radiation damage, and local structural disorder. However, normalized CL intensity is treated here as a relative grayscale parameter extracted from SEM-CL images, not as a calibrated measure of U–Th concentration. The CL–Raman relationship is therefore interpreted as a semiquantitative indicator of internal heterogeneity rather than as a direct geochemical calibration, consistent with qualitative CL–Raman comparisons reported in the literature9,35.
The correlations in Figure 10 should be interpreted as exploratory rather than as calibration relationships. The dataset comprises eleven ROIs from a single mapped grain, and the ROIs sample local heterogeneity rather than an independent population of zircon domains. The Pearson coefficients and p-values are therefore used as descriptive measures of the ROI trends within this mapped grain, rather than as population-level statistical tests. In addition, CR-39 track density and Raman parameters represent different physical records: CR-39 registers near-surface alpha-particle emission during the irradiation interval, whereas Raman FWHM and peak position reflect the accumulated structural damage state of the zircon12,33,35. Thus, the association between higher track density, broader ER bands, and lower ER peak positions supports a spatial link between alpha-emitter distribution and radiation-damage heterogeneity, but it does not yet establish a quantitative conversion between CR-39 track density and accumulated alpha dose.
Integrated Raman intensity was evaluated only as a diagnostic of spectral quality and fitting reliability, because it is strongly affected by crystallographic orientation, focusing conditions, local optical coupling, surface relief, and signal-to-noise ratio. FWHM and peak position were emphasized because they are more directly related to radiation-induced changes in lattice order and are the parameters most commonly used in zircon Raman-damage studies9,10,12-14.
Overall, the analysis supports the interpretation that CR-39 track density, CL contrast, and Raman damage parameters respond to the internal heterogeneity of the OD3 zircon grain. These results should be regarded as proof-of-concept rather than a final calibration. A robust calibration would require application of the same approach to a larger number of grains, longer irradiation intervals, and independently measured U–Th concentrations. Nevertheless, the present results show that combined CR-39, CL, and multiband Raman mapping can be used to investigate spatial relationships between alpha-particle emission and radiation-damage heterogeneity in zircon12,15.
4. Conclusions
This study has systematically characterized the evolution of alpha-particle tracks in CR-39 solid-state nuclear track detectors coupled to Kawamoto Granodiorite (OD3) zircon grains, as a function of chemical etching time and in direct relation to the microstructural and radiation-damage characteristics of the emitting grains as revealed by SEM/CL and confocal Raman spectroscopy. The principal conclusions are as follows.
Track density increases continuously and steeply in the etching interval from 90 to 300 minutes in 6.25 N NaOH at 70 °C, reaching a well-defined plateau beyond 300 minutes. The etching window of 200–300 minutes is identified as optimal for quantitative analysis, offering complete track revelation, good track-background contrast, and avoidance of track-overlap saturation. The OD3 etching curves exhibit notable inter-series variability in absolute track density, consistent with the pronounced compositional and microstructural heterogeneity known to characterise this zircon standard; this variability is reproducible across independent mounts and is therefore a genuine physical property of the OD3 population rather than a counting artefact.
SEM and cathodoluminescence imaging demonstrate that the spatial distribution of alpha-particle tracks in CR-39 broadly reflects the internal compositional zoning of the OD3 zircon grains. CL-dark oscillatory zones are associated with locally elevated track densities, whereas relatively CL-bright zones generally yield reduced track counts. Anomalously suppressed track densities in moderately enriched but strongly metamict or fractured domains demonstrate that radiation damage and structural defects modulate alpha-particle emission efficiency independently of isotopic concentration and must be accounted for in quantitative alpha mapping.
Confocal Raman mapping reveals that regions of elevated track density in CR-39 coincide spatially with domains of larger Raman FWHM, supporting a spatial association between accumulated self-irradiation damage and near-surface alpha-particle flux. However, this correspondence should still be regarded as preliminary and should be addressed in the future with a larger sample set, different thermal and damage histories, and multiple degrees of metamictization. Multiband Raman analysis further reveals spatial heterogeneity in some grain domains.
Taken together, these findings demonstrate that a multi-technique approach combining CR-39 track detection, SEM/CL microstructural imaging, and confocal Raman spectroscopy provides the most complete characterization of alpha-particle emission heterogeneity in zircon. Independent U–Th measurements will be required for future quantitative calibration. The systematic application of this approach is recommended for geochronological studies in which grain-scale isotopic and structural heterogeneity are suspected to affect (U–Th)/He age accuracy, and for the validation of Raman thermochronological calibrations in zircon standards with complex radiation-damage histories.
5. Acknowledgements
The authors gratefully acknowledge the financial support of the São Paulo Research Foundation (FAPESP, grant no. 2020/02464-8) and the National Council for Scientific and Technological Development (CNPq), Brazil. The authors thank the Graduate Program in Materials Science and Engineering (POSMAT) at the Universidade Estadual Paulista (UNESP) for institutional support. SEM and CL analyses were performed using the Zeiss EVO LS15 scanning electron microscope with sample preparation by Quorum Sputter Coater Q150T; the authors thank the technicians responsible for instrument operation and maintenance. Raman measurements were carried out on the Renishaw inVia confocal micro-Raman spectrometer.
6. Data Availability
The raw and processed data supporting the findings of study are available from the corresponding author upon reasonable request
7. References
-
1 Ahrens L, Cherry R, Erlank A. Observations on the Th–U relationship in zircons from granitic rocks and from kimberlites. Geochim Cosmochim Acta. 1967;31(12):2379-87. https://doi.org/10.1016/0016-7037(67)90009-9
» https://doi.org/10.1016/0016-7037(67)90009-9 - 2 Azevedo MC. Caracterização cristalográfica e isotópica do mineral zircão através do método de traços de fissão, U-Pb e U-Th/He [dissertação]. Natal: UFRN; 2021.
-
3 Chakoumakos BC, Murakami T, Lumpkin GR, Ewing RC. Alpha-decay–induced fracturing in zircon: the transition from the crystalline to the metamict state. Science. 1987;236(4808):1556-9. https://doi.org/10.1126/science.236.4808.1556 PMid:17835739.
» https://doi.org/10.1126/science.236.4808.1556 -
4 Özkan H. Effect of nuclear radiation on the elastic moduli of zircon. J Appl Phys. 1976;47(11):4772-9. https://doi.org/10.1063/1.322514
» https://doi.org/10.1063/1.322514 -
5 Anderson AJ, Hodges KV, van Soest MC. Empirical constraints on the effects of radiation damage on helium diffusion in zircon. Geochim Cosmochim Acta. 2017;218:308-22. https://doi.org/10.1016/j.gca.2017.09.006
» https://doi.org/10.1016/j.gca.2017.09.006 -
6 Anderson AJ, van Soest MC, Hodges KV, Hanchar JM. Helium diffusion in zircon: effects of anisotropy and radiation damage revealed by laser depth profiling. Geochim Cosmochim Acta. 2020;274:45-62. https://doi.org/10.1016/j.gca.2020.01.049
» https://doi.org/10.1016/j.gca.2020.01.049 -
7 Cherniak DJ, Watson EB, Thomas JB. Diffusion of helium in zircon and apatite. Chem Geol. 2009;268(1-2):155-66. https://doi.org/10.1016/j.chemgeo.2009.08.011
» https://doi.org/10.1016/j.chemgeo.2009.08.011 -
8 Ketcham RA, Guenthner WR, Reiners PW. Geometric analysis of radiation damage connectivity in zircon, and its implications for helium diffusion. Am Mineral. 2013;98(2-3):350-60. https://doi.org/10.2138/am.2013.4249
» https://doi.org/10.2138/am.2013.4249 -
9 Nasdala L, Wenzel M, Vavra G, Irmer G, Wenzel T, Kober B. Metamictisation of natural zircon: accumulation versus thermal annealing of radioactivity-induced damage. Contrib Mineral Petrol. 2001;141(2):125-44. https://doi.org/10.1007/s004100000235
» https://doi.org/10.1007/s004100000235 -
10 Palenik CS, Nasdala L, Ewing RC. Radiation damage in zircon. Am Mineral. 2003;88(5-6):770-81. https://doi.org/10.2138/am-2003-5-606
» https://doi.org/10.2138/am-2003-5-606 -
11 Pidgeon RT. Zircon radiation damage ages. Chem Geol. 2014;367:13-22. https://doi.org/10.1016/j.chemgeo.2013.12.010
» https://doi.org/10.1016/j.chemgeo.2013.12.010 -
12 Härtel B, Jonckheere R, Wauschkuhn B, Hofmann M, Frölich S, Ratschbacher L. Zircon Raman dating: age equation and calibration. Chem Geol. 2021;579:120351. https://doi.org/10.1016/j.chemgeo.2021.120351
» https://doi.org/10.1016/j.chemgeo.2021.120351 -
13 Su K, Zhang S-B, Hanchar JM, Li Z-X, Sun F-Y, Liang T, et al. Quantification of radiation damage in natural and synthetic zircon by Raman spectroscopy: application to low-temperature thermochronology. Acta Geochimica. 2023;42(4):398-416. https://doi.org/10.1007/s11631-023-00606-w
» https://doi.org/10.1007/s11631-023-00606-w -
14 Härtel B, Jonckheere R, Ratschbacher L. Multi-band Raman analysis of radiation damage in zircon for thermochronology: partial annealing and mixed signals. Geochem Geophysics Geosyst. 2022;23(1):e2021GC010182. https://doi.org/10.1029/2021GC010182
» https://doi.org/10.1029/2021GC010182 -
15 Härtel B, Enkelmann E, Jonckheere R, Ludwig T, Krause J, Ratschbacher L. In search of lost time: raman thermochronology of FC-1 zircon. Contrib Mineral Petrol. 2024;179(1):6. https://doi.org/10.1007/s00410-023-02083-z
» https://doi.org/10.1007/s00410-023-02083-z -
16 Azooz A, Al-Nia’emi SH, Al-Jubbori MA. A parameterization of nuclear track profiles in CR-39 detector. Comput Phys Commun. 2012;183(11):2470-9. https://doi.org/10.1016/j.cpc.2012.06.011
» https://doi.org/10.1016/j.cpc.2012.06.011 -
17 Pereira LAS, Sáenz CAT, Constantino CJL, Curvo EAC, Dias ANC, Soares CJ, et al. Micro-Raman spectroscopic characterization of a CR-39 detector. Appl Spectrosc. 2013;67(4):404-8. https://doi.org/10.1366/12-06741 PMid:23601540.
» https://doi.org/10.1366/12-06741 -
18 Sáenz CAT, Curvo EAC, Dias ANC, Soares CJ, Constantino CJL, Alencar I, et al. Effects of etching on zircon grains and its implications for the fission track method. Appl Spectrosc. 2012;66(5):545-51. https://doi.org/10.1366/11-06260 PMid:22524960.
» https://doi.org/ -
19 Stuani Pereira LA, Tello Sáenz CA. Quadratic parametrization of alpha track lengths and detection efficiencies in CR-39 as a function of etching time. Appl Radiat Isot. 2025;225:111972. https://doi.org/10.1016/j.apradiso.2025.111972 PMid:40561617.
» https://doi.org/10.1016/j.apradiso.2025.111972 -
20 Azooz AA, Al-Nia’emi SH, Al-Jubbori MA. Empirical parameterization of CR-39 longitudinal track depth. Radiat Meas. 2012;47(1):67-72. https://doi.org/10.1016/j.radmeas.2011.10.015
» https://doi.org/10.1016/j.radmeas.2011.10.015 -
21 Azooz AA, Hermsdorf D, Al-Jubbori MA. New approach of modeling charged particles track development in CR-39 detectors. Radiat Meas. 2013;58:94-100. https://doi.org/10.1016/j.radmeas.2013.08.012
» https://doi.org/10.1016/j.radmeas.2013.08.012 -
22 Azooz AA, Al-Jubbori MA. Interrelated temperature dependence of bulk etch rate and track length saturation time in CR-39 detector. Nucl Instrum Methods Phys Res B. 2013;316:171-5. https://doi.org/10.1016/j.nimb.2013.09.001
» https://doi.org/10.1016/j.nimb.2013.09.001 -
23 Al-Jubbori MA. Extension of alpha particles in CR-39-etched track depth model to heavier ions. Radiat Eff Defects Solids. 2013;168(11-12):1004-10. https://doi.org/10.1080/10420150.2013.811503
» https://doi.org/10.1080/10420150.2013.811503 -
24 Azooz AA, Al-Jubbori MA. Alpha particles energy estimation from track diameter development in a CR-39 detector. Appl Radiat Isot. 2016;115:74-80. https://doi.org/10.1016/j.apradiso.2016.06.008 PMid:27341133.
» https://doi.org/10.1016/j.apradiso.2016.06.008 -
25 Al-Jubbori MA. A parameterization of the chemistry-normality dependence of bulk etch rate in a CR-39 detector. Appl Radiat Isot. 2016;118:228-31. https://doi.org/10.1016/j.apradiso.2016.09.022 PMid:27684454.
» https://doi.org/10.1016/j.apradiso.2016.09.022 -
26 Al-Jubbori MA. Empirical model of alpha particle track length in CR-39 detector. Nucl Instrum Methods Phys Res A. 2017;871:54-8. https://doi.org/10.1016/j.nima.2017.07.049
» https://doi.org/10.1016/j.nima.2017.07.049 -
27 Al-Jubbori MA, Fromm M, Awad EM. Strong etching formulation (time and rate) for PADC with deep depth bulk etch rate study. Nucl Instrum Methods Phys Res A. 2021;1005:165402. https://doi.org/10.1016/j.nima.2021.165402
» https://doi.org/10.1016/j.nima.2021.165402 -
28 Al-Khalil YT, Fromm M, Awad EM, Alkhayat RB, Zakar AT, Al-Jubbori MA. On the question of track etch rate amplitude variation in the Bragg-peak vicinity: experimental verification for low-energy α-particle tracks in CR-39. Nucl Instrum Methods Phys Res A. 2022;1031:166516. https://doi.org/10.1016/j.nima.2022.166516
» https://doi.org/10.1016/j.nima.2022.166516 -
29 Guenthner WR, Reiners PW, Ketcham RA, Nasdala L, Giester G. Helium diffusion in natural zircon: radiation damage, anisotropy, and the interpretation of zircon (U-Th)/He thermochronology. Am J Sci. 2013;313(3):145-98. https://doi.org/10.2475/03.2013.01
» https://doi.org/10.2475/03.2013.01 -
30 Lüley J, Filova V, Blahušiak P, Vrban B, Čerba Š, Bonková I, et al. CR-39 detector-based Radon dosimetry system calibration in the self-decay mode. Eur Phys J Spec Top. 2023;232(10):1493-500. https://doi.org/10.1140/epjs/s11734-023-00876-8
» https://doi.org/10.1140/epjs/s11734-023-00876-8 -
31 Nikezic D, Yu KN. Computer program TRACK_TEST for calculating parameters and plotting profiles for etch pits in nuclear track materials. Comput Phys Commun. 2006;174(3):160-5. https://doi.org/10.1016/j.cpc.2005.09.011
» https://doi.org/10.1016/j.cpc.2005.09.011 -
32 Chakoumakos BC, Oliver WC, Lumpkin GR, Ewing RC. Hardness and elastic modulus of zircon as a function of heavy-particle irradiation dose. Radiat Eff Defects Solids. 1991;118(4):393-403. https://doi.org/10.1080/10420159108220764
» https://doi.org/10.1080/10420159108220764 - 33 Irmer G. Zum Einfluß der Apparatefunktion auf die Bestimmung von Streuquerschnitten und Lebensdauern aus optischen Phononenspektren. Experimentelle Technik der Physik. 1985;33(6):501-6.
-
34 Hanchar JM, Miller CF. Zircon zonation patterns as revealed by cathodoluminescence and backscattered electron images: implications for interpretation of complex crustal histories. Chem Geol. 1993;110(1-3):1-13. https://doi.org/10.1016/0009-2541(93)90244-D
» https://doi.org/10.1016/0009-2541(93)90244-D -
35 Anderson AJ, Hanchar JM, Hodges KV, van Soest MC. Mapping radiation damage zoning in zircon using Raman spectroscopy: implications for zircon chronology. Chem Geol. 2020;538:119494. https://doi.org/10.1016/j.chemgeo.2020.119494
» https://doi.org/10.1016/j.chemgeo.2020.119494 -
36 Vermeesch P, Seward D, Latkoczy C, Wipf M, Günther D, Baur H. α-Emitting mineral inclusions in apatite, their effect on (U–Th)/He ages, and how to reduce it. Geochim Cosmochim Acta. 2007;71(7):1737-46. https://doi.org/10.1016/j.gca.2006.09.020
» https://doi.org/10.1016/j.gca.2006.09.020 -
37 Marsellos AE, Garver JI. Radiation damage and uranium concentration in zircon as assessed by Raman spectroscopy and neutron irradiation. Am Mineral. 2010;95(8-9):1192-201. https://doi.org/10.2138/am.2010.3264
» https://doi.org/10.2138/am.2010.3264 -
38 Ketcham RA, Gautheron C, Tassan-Got L. Accounting for long alpha-particle stopping distances in (U–Th–Sm)/He geochronology: refinement of the baseline case. Geochim Cosmochim Acta. 2011;75(24):7779-91. https://doi.org/10.1016/j.gca.2011.10.011
» https://doi.org/10.1016/j.gca.2011.10.011 -
39 Iwano H, Orihashi Y, Hirata T, Ogasawara M, Danhara T, Horie K, et al. An inter-laboratory evaluation of OD-3 zircon for use as a secondary U–Pb dating standard. Isl Arc. 2013;22(3):382-94. https://doi.org/10.1111/iar.12038
» https://doi.org/10.1111/iar.12038
Edited by
-
Associate Editor:
Celso Santilli.
-
Editor-in-Chief:
Luiz Antonio Pessan.


