Abstract
Thin a-C:H:Si:F:N films were studied as a function of the partial pressure of SF6 in plasma feed, RSF, together with tetramethylsilane and N2. Deposition rates varied from ~4 to ~19 nm.min-1. Surface roughnesses were typically less than 35 nm. Surface contact angles with water droplets, measured using goniometry, were all around 90°. Scanning electron micrography revealed surface particles, probably formed in the gas phase, of typical diameters ~8 μm. As revealed by Fourier transform infrared spectroscopy and energy dispersive x-ray spectroscopy, the films are plasma polymers with a carbon and silicon network. Most of the films contain ~ 60 at.% C, ~ 10 at.% Si, 20 at.% O and ~5 to 14 at.% N. Film doping with F rises to ~2 at.% as RSF is increased. The Tauc gap, calculated from ultraviolet-visible near infrared spectroscopic data, is controllable in the range of ~3.5 to 4.1 eV by a suitable choice of RSF. Fluorination causes the films to be softer and less stiff. Total deformation and stored energies are reduced compared to those of the film deposited at RSF = 0%. The modulus of dissipation increases from ~8% to a maximum of ~65% for the fluorinated films.
Keywords:
PECVD; a-C:H:Si:F:N; thin films; optical properties
1. Introduction
Diverse amorphous films containing some of the elements – C, H, Si, N and F – have been studied in recent decades. For example, amorphous hydrogenated carbon films also containing nitrogen and fluorine, designated a-C:H:N:F, were produced in a parallel-plate, capacitively coupled reactor by Liu et al.11 Liu S, Gangopadhyay S, Sreenivas G, Ang SS, Naseem HA. Infrared studies of hydrogenated amorphous carbon (a-C:H) and its alloys (a-C:H,N,F). Phys Rev B Condens Matter. 1997;55(19):13020-4. from CH4-N2-NF3 mixtures. As the concentration of nitrogen and fluorine increases in the films the sp2/sp3 ratio increases at the expense of the hydrogen content. The resulting films showed improved thermal stability of their electrical conductivity. Additional studies by the same research group indicate that the Tauc gap decreases and the Urbach energy increases as film [N] and [F] increase, producing defect states within the gap22 Liu S, Gangopadhyay S, Sreenivas G, Ang SS, Naseem HA. Photoluminescence studies of hydrogenated amorphous carbon and its alloys. J Appl Phys. 1997;82(9):4508-14..
Owing to their low dielectric constants, SiOF films find possible application as interlayer dielectrics33 Kim B-G, Kang S-Y, Kim J-J. FTIR study of fluorinated silicon oxide film. J Phys D Appl Phys. 1997;30:1720-4.. Plasma enhanced chemical vapor deposition (PECVD) has been used to produce a-Si:N:F films from SiH4, N2, Ar and NF3 mixtures44 Jun B-H, Lee JS, Kim D-W, Sung TH, Bae BS, No K. Composition, oxidation, and optical properties of fluorinated silicon nitride film by inductively coupled plasma enhanced chemical vapor deposition. J Mater Res. 1999;14(3):995-1001.. The refractive index of the films fell from about 2.2 to 1.6, while the gap increased from roughly 2.2 to 5.7 eV as the NF3 flow rate was increased from 0 to 2 sccm. Despite its absence from the reactor feed, oxygen was incorporated into the deposited material. Film density fell as the NF3 flow rate increased from 0.5 to 2 sccm.
Nanometric fluorinated silicon nitride films were produced at 350 °C in the down flow of an electron cyclotron resonance PECVD reactor fed NH3-SiF4 mixtures55 Ohta H, Hori M, Goto T. Ultrathin fluorinated silicon nitride gate dielectric films formed by remote plasma enhanced chemical vapor deposition employing NH3 and SiF4. J Appl Phys. 2001;90(4):1955-61.. Such films, which exhibit extremely low leakage currents, may serve as gate dielectrics. Plasma immersion ion implantation and deposition (PIIID) has been used to deposit a-C:H:Si:O:F films from hexamethyldisiloxane (HMDSO)-SF6-Ar mixtures66 Rangel EC, da Cruz NC, Rangel RCC, Landers R, Durrant SF. Effect of ion irradiation on the structural properties and hardness of a-C:H:Si:O:F films. J Phys Conf Ser. 2015;591:012044.. The films showed hardnesses of ~1.5 GPa.
Despite such studies, there is little extant literature on a-C:H:Si:F:N films. In this study we characterize films deposited from cold plasmas fed tetramethylsilane (TMS)-SF6-N2 mixtures.
2. Materials and Methods
The deposition system is shown in Figure 1. Films were deposited in a cylindrical glass chamber, containing two circular, horizontal, parallel-plate electrodes. Radiofrequency (13.56 MHz) power was fed from a supply (TOKYO HY-POWER, MB-300) at 70 W to the lower electrode via a matching network, used to minimize the reflected power. The upper electrode was earthed. Pressure was monitored using a Pirani gauge (AGILENT, PCG-750). Nitrogen and sulfur hexafluoride gases (99.95% pure, WHITE MARTINS, Brazil) were admitted to the chamber from cylinders via precision leak valves (EDWARDS, LV10-K). For tetramethylsilane (TMS), vapor was introduced from a vial of the liquid reagent. For depositions, the chamber was evacuated continuously using a rotary vane pump (EDWARDS, E2M18). A TMS partial pressure of 96 mTorr was maintained for all depositions. The total pressure of nitrogen and sulfur hexafluoride was 24 mTorr. For all depositions, a time of 30 min was used. The stoichiometry of the films was altered by increasing the partial pressure of SF6 in the feed, RSF, and decreasing that of nitrogen by the same amount.

Substrates, placed on the lower electrode, were of glass, polished stainless steel, and quartz. The glass substrates were used for films examined by Profilometry and Goniometry. Polished stainless-steel substrates were used for films examined by Infrared Reflection Absorption Spectroscopy (IRRAS), Scanning Electron Microscopy (SEM) and Energy-dispersive X-ray Spectrometry (EDS). Quartz substrates were employed for films examined by Ultraviolet-visible Near Infrared Spectroscopy (UVS) and nanoindentation.
Film deposition rates were calculated using Equation 1, where R is the deposition rate, h is the film thickness and t the deposition time.
Film thickness was measured from a film deposited onto a glass slide partially covered by an adhesive tape. Subsequent removal of the tape produced a well-defined film edge, which was measured using Profilometry (VEECO DekTak 150). Film surface roughness was calculated using the arithmetic method from film surface profiles. Surface morphology was examined using SEM (JEOL JSM-6010LA) and elemental analysis carried out using an EDS accessory (DRY SD Hyper (EX 94410T1L11)).
For Infrared Reflection Absorption Spectroscopy (IRRAS) a JASCO FTIR-410 spectrometer operating over the wavenumber range from 400 to 4000 cm-1 was used. A resolution of 4 cm-1 was achieved. Each spectrum was obtained using 128 scans.
From film thickness measurements and transmission UVS spectra obtained with a PERKIN ELMER LAMBDA 750, refractive indices and optical gaps were calculated using procedures described in detail elsewhere77 Cisneros JI, Rego GB, Tomiyama M, Bilac S, Gonçalves JM, Rodriguez AE, et al. A method for the determination of the complex refractive index of no- metallic thin films using photometric measurements at normal incidence. Thin Solid Films. 1983;100:155-67.,88 Tauc J. Optical properties and electronic structure of amorphous semiconductors. In: Abeles F, editor. Optical Properties of Solids. New York: American Elsevier; 1972.. Surface contact angles were measured on drops of distilled deionized water and diiodomethane using a KRÜSS DSA25E Goniometer. For each of three drops placed at different positions on the film, ten measurements were taken.
The hardness, elastic modulus, and stiffness of the deposited material were calculated from force-depth plots obtained using a HYSITRON Triboindenter99 Rangel EC, Durrant SF, Rangel RCC, Kayama ME, Landers R, Da Cruz NC. Amorphous carbon nitrogenated films prepared by plasma immersion ion implantation and deposition. Thin Solid Films. 2006;515(4):1561-7. http://dx.doi.org/10.1016/j.tsf.2006.05.016.
http://dx.doi.org/10.1016/j.tsf.2006.05....
. A normal force was applied to a pyramidal Berkovich diamond tip in the range 150 to 3000 µN. Twenty indentations at each of at least 10 points were made. The three mechanical properties were calculated using the method developed by Oliver and Pharr1010 Oliver WC, Pharr GM. An improved technique for determining hardness and elastic modulus using load and displacement sensing indentation experiments. J Mater Res. 1992;7(6):1564-83. http://dx.doi.org/10.1557/JMR.1992.1564.
http://dx.doi.org/10.1557/JMR.1992.1564...
. Mean values and standard deviations of the hardnesses obtained at 15% of the film thickness are presented.
3. Results and Discussion
Figure 2 shows the deposition rate as a function of the partial pressure of sulfur hexafluoride in the feed, RSF. Film thicknesses are given in the figure caption. The rise and subsequent fall in R as a function of RSF is typical of systems in which the fluorine or fluorine-containing component of the chamber feed is increased. Initially, the fluorine released in the plasma causes extensive fragmentation of the monomer producing film precursors such as CHx and CFx as well as volatile HF, but at greater RSF etching begins to dominate and the deposition rate falls. Hydrocarbon polymers are readily etched in oxygen-containing plasmas via reactions such as that shown in Equation 2:

Deposition rate as a function of RSF. Film thicknesses (nm) for films at increasing values of RSF: 245, 358, 564, 265, 163, 141.
Polymers containing Si, however, are more readily etched in fluorine/oxygen plasmas, such as CF4/O2 or SF6/O21111 Szmigiel D, Domanski K, Prokaryn P, Grabiec P, Sobczak JW. The effect of fluorine-based plasma treatment on the morphology and chemical surface composition of biocompatible silicone elastomer. Appl Surf Sci. 2006;253:1506-11. http://dx.doi.org/10.1016/j.apsusc.2006.02.027.
http://dx.doi.org/10.1016/j.apsusc.2006....
. Etching of polymers containing C and Si is likely via reactions (3) to (5), with the overall reaction being summarized by Equation 6.
These reactions are given by Yih et al.1212 Yih PH, Saxena V, Steckl AJ. A review of SiC reactive ion etching. Phys Status Solidi (b). 1997;202: 605-42. for etching of SiC. In the present case the plasmas are depositing and causing etching. Although not deliberately introduced into the reactor feed, some residual oxygen is present. Silicon, hydrogen, and nitrogen are present in the chamber feed. Fluorine is present in the plasmas for which RSF is not zero.
Post-deposition reactions between free radicals trapped in the film and ambient oxygen and water vapor are known to occur in plasma polymers1313 Morosoff N, Crist B, Bumgarner M, Hsu T, Yasuda H. Free radicals resulting from plasma polymerization and plasma treatment. J Macromol Sci. 1976;10(3):451-71. https://doi.org/10.1080/00222337608061192.
https://doi.org/10.1080/0022233760806119...
,1414 Yasuda H, Bumgarner MO, Marsh HC, Morosoff N. Plasma polymerization of some organic compounds and properties of the polymers. J Polym Sci: Polym Chem Ed. 1976;14(1):195-224. https://doi.org/10.1002/pol.1976.170140118.
https://doi.org/10.1002/pol.1976.1701401...
, thus attaching O and OH to the film surface. The initial base pressure also represents a possible source of oxygen for the plasma. In addition, despite extensive cleaning of the reactor before each deposition, degasification from the chamber walls is another possible source of oxygen.
Sulfur was not detected in the films by EDS. As SFn (n = 1 to 6) species are present in the plasma, sulfur may be removed as volatile products, such as SOF and SO2, formed by reactions that occur in SF6 plasmas1515 Shih M, Lee WJ, Tsai C-H, Tsai P-J, Chen C-Y. Decomposition of SF6 in an RF plasma environment. J Air Waste Manage Assoc. 2002;52:1274-80. http://dx.doi.org/10.1080/10473289.2002.10470864.
https://doi.org/. http://dx.doi.org/10.1...
, and described in Equations 7 and 8.
An additional factor influencing the plasma conditions is that the electron energy distribution function and density depend on the components of the plasma feed. As revealed by optical emission spectroscopy, the species H, CH and CN are present in cold plasmas fed TMS-N2-He-Ar 1616 Da Cruz NC, Durrant SF, Bica de Moraes MA. Thin film deposition from plasmas of tetramethylsilane-helium-argon mixtures with oxygen and with nitrogen. J Polym Sci, B, Polym Phys. 1998;36:1873-9. http://dx.doi.org/10.1002/(SICI)1099-0488(199808)36:11<1873:AID-POLB8>3.0.CO;2-R.
http://dx.doi.org/10.1002/(SICI)1099-048...
. It is well known that the presence of dangling bonds on the film surface probably enhances the sticking probability of carbon-containing radicals. Plasma F radicals in plasmas containing fluorine remove hydrogen, leaving dangling bonds, while CFx radicals contribute to film growth.
Figure 3 shows the surface roughness as a function of RSF. There is no systematic variation, but all the roughnesses have small absolute values, being less than 40 nm. Roughnesses of about 5 to 80 nm were observed for PECVD films produced from HMDSO-SF6-Ar mixtures66 Rangel EC, da Cruz NC, Rangel RCC, Landers R, Durrant SF. Effect of ion irradiation on the structural properties and hardness of a-C:H:Si:O:F films. J Phys Conf Ser. 2015;591:012044..

The surface contact angle, θ, of all the films, shown as a function of RSF in Figure 4, is fairly uniform, remaining close to 90°, i.e. close to the region defining hydrophobic surfaces. Although θ is not a strong function of RSF it shows increases and decreases that match the behavior of the roughness (Figure 3). Therefore, despite the expected structural and compositional changes in the films as RSF increases, together with modification of the surface roughness, all of which can influence θ, little net change in θ is produced. The water surface contact angle of all the films is greater (~100°) than that of glass (~60°). For hydrophobic material, greater fluorine content is expected to produce greater values of θ. As shown below, however, the films are only doped with fluorine to a maximum of about 2 at.%; therefore [F] does not greatly influence θ.

Total surface energy calculated from the contact angles of drops of distilled deionized water and diiodomethane are shown, together with the dispersive and polar components, as a function of RSF in Figure 5. The surface energy of glass is greater than that of the films. Non-zero values of RSF lead to lower polar but greater dispersive components.

Figure 6 shows scanning electron micrographs of films deposited at different RSF. Each pair of micrographs (a, b) etc. shows a micrograph at 2500X and at a suitable greater magnification to reveal details of a particle on the surface. The particles are roughly spherical, with diameters of about 8 μm, others exhibit more complex geometries. Such particles are probably formed in the gas phase as discussed later, together with the results of the EDS analyses.

Scanning electron micrographs in pairs, at 2500X and at a suitable greater magnification to show details of surface particles. The micrographs were obtained for depositions at different RSF: (a, b) RSF = 0 mTorr; (c, d) RSF = 1.2mTorr; (e, f) RSF = 2.4 mTorr; (g, h) RSF = 3.6 mTorr; (i, j) RSF = 4.8 mTorr; (k, l) RSF = 6.0 mTorr. In the second micrograph of each pair, the position at which the EDS analysis was undertaken is marked.
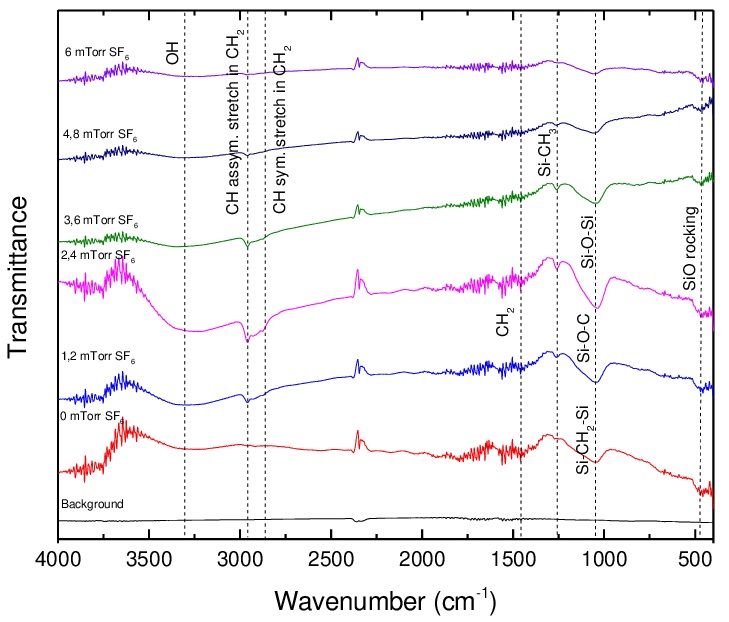
Figure 7 shows transmission IRRAS of films grown at different RSH in the 400 to 4000 cm-1 range. There is evidence of the presence of hydroxyl groups as indicated by the absorption at ~3310 cm-1 in all the spectra, these being especially prominent for the film grown at 2.4 mTorr of SF6. Each film contains CH3 groups as revealed by the absorptions at ~2960 and 2870 cm-1 attributed to sp3 CH3 asymmetric vibrations and sp3 symmetric vibrations, respectively. These groups exist in the original TMS molecules, each of which contains four methyl groups. An absorption caused by Si-CH3 at around 1260 cm-1, visible in all the spectra, may also be readily formed by fragmentation of TMS molecules. The prominent absorption at around 1040 cm-1 may be attributed to Si-O-Si, Si-O-C and Si-CH2-Si structures. As the absorptions of these three groups fall closely in the same region, it is difficult to distinguish between them. The presence of Si-O-Si and Si-O-C, however, is supported by the small absorption around 460 cm-1 observed in the spectra of all the films. As mentioned above, oxygen is usually present in plasma polymers even when no oxygen is deliberately introduced into the plasma feed. No absorptions caused by fluorinated or nitrogenated functionalities are evident in any of the spectra.

Figures 8 (a, b) show the elemental concentrations, [C], [O] and [Si], and [N] and [F], respectively, in the films as a function of RSF as determined using EDS. Inspection of Fig. 8a reveals that the carbon content increases about 50% and the silicon content more than doubles as RSF increases; thus the silicon content increases more relative to the carbon content. In the absence of SF6 from the feed, there is negligible incorporation of oxygen. For non-zero RSF, however, ~20 at. % oxygen is found in all the films. Thus the presence of fluorine in the plasma possibly promotes the incorporation of oxygen radicals into the growing film.

(a). Film [C], [O] and [Si], measured using EDS, as a function of RSF. (b) Film [N] and [F], measured using EDS, as a function of RSF. (c) Surface particle [C], [O] and [Si], measured using EDS for different RSF. (d) Surface particle [N] and [F], measured using EDS for different RSF.
Figure 8b reveals that the nitrogen content varies between about 5 and 13 at.% as RSF is varied. As RSF increases, the partial pressure of nitrogen decreases, but only by a maximum of 6 mTorr. Thus [N] is reduced compared to that observed at RSF of zero, but the decline is not monotonic. Indeed, after an initial fall, [N] increases beyond an RSF of 2.4 mTorr. The minimum in [N] corresponds to the maximum deposition rate (Figure 2) at an RSF of 2.4 mTorr.
Figure 8c shows [C], [O] and [Si] in the surface particles observed by SEM at different RSF. Figure 8d shows [N] and [F] for the same particles. From Fig. 8c, the composition of the particles at RSF = 0% is distinct, consisting almost entirely of C and O (and H). Thus in TMS-N2 plasmas, there is strong oxygen incorporation, probably in the gas phase, since the particles have distinct compositions from the bulk of the film, together with deposition via CHx precursors. The particles deposited at non-zero RSF, contain more C, Si, N and F, but less than half the [O] of the unfluorinated film.
The presence of SF6 in the chamber feed leads to a doping of the film with F of up to about 2 at.%. Over the interval studied, [F] rises roughly linearly with increasing RSF, i.e. with increasing supply of SF6 to the chamber.
Figure 9 shows (where calculable) the refractive index as a function of RSF. The fluorinated films exhibit lower values of n. This behavior is consistent with that observed for the refractive index of a-Si:N:F films deposited from SiH4-N2-Ar mixtures44 Jun B-H, Lee JS, Kim D-W, Sung TH, Bae BS, No K. Composition, oxidation, and optical properties of fluorinated silicon nitride film by inductively coupled plasma enhanced chemical vapor deposition. J Mater Res. 1999;14(3):995-1001..

The Tauc gap and that defined as the energy corresponding to an absorption of 104 cm-1, which has also been used to characterize the gap of amorphous materials1717 Freeman EC, Paul W. Optical constants of rf sputtered hydrogenated amorphous Si. Phys Rev B Condens Matter. 1979;20:716. http://dx.doi.org/10.1103/PhysRevB.20.716.
http://dx.doi.org/10.1103/PhysRevB.20.71...
, are shown in Figure 10 as a function of RSF. For semiconductors the bandgap is the difference in energy between the valence and conduction bands, and indicates the range of forbidden energy values for electrons. The band gap calculated, in this case, according to the Tauc model by extrapolating the linear portion of (αE)1/2 versus E plots (where α is the absorption coefficient and E the photon energy) to its intersection with the x-axis (i.e. the axis showing E), is designated the Tauc gap.

Although the absolute values of the gap differ slightly, the trends observed as a function of RSF are very similar. The unfluorinated film has a gap of ~3.9 eV. Both greater and smaller gap values can be obtained by the choice of RSF. Comparison of the behavior of film [N] (Figure 8b) and the optical gap (Figure 10) suggests that nitrogen introduces states into the gap, with greater film [N] tending to yield lower gaps. Together with the effect of nitrogen, doping with F increases steadily with RSF, tending to reduce the gap. Thus at high RSF both effects combine, leading to the lowest gaps.
A typical plot of ln(α(E)) as a function of photon energy, E, used to calculate the Urbach energy, UE (in this case of the film deposited at RSF = 0) is shown in Figure 11. The parameter UE reflects the degree of absorption edge spreading caused by structural disorder, which forms localized states within the band tails of electronic states. Figure 12 shows UE as a function of the Tauc gap. The dependence of UE on the gap has roughly the shape expected for a semiconductor, with UE for a gap energy of 3.5 eV being lower than expected.

Example (of the unfluorinated film) of the graph allowing the calculation of the Urbach energy.

The hardness, elastic modulus and stiffness of the film material calculated from nanoindentation measurements are shown as a function of RSF in Figures 13 -15, respectively. All three properties are significantly lower for the fluorinated films. The hardnesses of the fluorinated films are very close to those observed in a-C:H:Si:O:F produced by Plasma Immersion Ion Implantation and Deposition of HMDSO-SF6-Ar mixtures, namely 1.5 +/- 0.1 GPa 66 Rangel EC, da Cruz NC, Rangel RCC, Landers R, Durrant SF. Effect of ion irradiation on the structural properties and hardness of a-C:H:Si:O:F films. J Phys Conf Ser. 2015;591:012044.. A hardness similar to that of quartz is observed for the unfluorinated film. A strong fall in hardness upon the incorporation of fluorine has been observed in a-C:H:F films produced from CH4-CF4 plasmas1818 Freire FL. Amorphous hydrogenated carbon films: effects of nitrogen and fluorine incorporation on the film microstructure and mechanical properties: a review. J. Non-crystalline Solids. 2002;304(1-3):251-8..


The parameters H/E and H3/E22 Liu S, Gangopadhyay S, Sreenivas G, Ang SS, Naseem HA. Photoluminescence studies of hydrogenated amorphous carbon and its alloys. J Appl Phys. 1997;82(9):4508-14. are displayed as a function of RSF in Figure 16. Both parameters are greatly reduced in the fluorinated films since H falls by a factor of about eight when SF6 is introduced into the chamber feed. The H/E values are indicative of ease of plastic deformation and therefore the observed fall in this parameter suggests low wear resistance for the fluorinated films. H3/E2 is proportional to the load at which the material deforms plastically1919 Tsui TY, Pharr GM, Oliver WC, Bhatia CS, White RL, Anders S, et al. Nanoindentation and nanoscratching of hard carbon coatings for magnetic disks. Proc MRS. 1995;383:447-52. http://dx.doi.org/10.1557/PROC-383-447.
http://dx.doi.org/10.1557/PROC-383-447...
. Materials with high plastic deformation may be useful in certain applications, such as those used in nanoindentation lithography2020 Sirghi L, Ruiz A, Colpo P, Rossi F. Atomic force microscopy indentation of fluorocarbon thin films fabricated by Plasma Enhanced Chemical Deposition at low radio frequency power. Thin Solid Films. 2009;517(11):3310-4. http://dx.doi.org/10.1016/j.tsf.2009.01.055.
http://dx.doi.org/10.1016/j.tsf.2009.01....
.

H/E and H3/E22 Liu S, Gangopadhyay S, Sreenivas G, Ang SS, Naseem HA. Photoluminescence studies of hydrogenated amorphous carbon and its alloys. J Appl Phys. 1997;82(9):4508-14. as a function of RSF.
Figure 17 shows the elastic recovery and plastic deformation energy as a function of RSF. Relatively high elastic recoveries (> 90%) are observed for all the films. The plastic deformation energy tends to fall with increasing RSF. Total deformation energy, stored and dissipated energy as a function of RSF are shown in Figure 18. Total deformation and stored energies are reduced at RSF > 0%. The dissipated energy is greater at non-zero RSF and greatest at RSF = 2.4 mTorr, which also gives an almost unchanged total deformation energy compared to that of the film deposited at RSF = 0%. The dependence of the modulus of dissipation on RSF is depicted in Figure 19. All the fluorinated films (RSF > 0) show moduli of dissipation of about 45 to 65%, compared to < 10% for the unfluorinated film.


4. Conclusions
Amorphous hydrogenated carbon films also containing silicon and nitrogen, and doped with fluorine were obtained by the PECVD of TMS-N2-SF6 mixtures. As revealed by IRRAS, EDS and SEM, the films were complex plasma polymers, with surface particles of distinct elemental composition.
A maximum deposition rate of ~18 nm.min-1 was obtained as the partial pressure of SF6, RSF, was varied. Film roughness was less than 40 nm for all the films. Independently of RSF, surface contact angles were all about 90°. Tauc gaps could be selected between 3.4 and 4.4 eV by a suitable choice of RSF. As demonstrated by nanoindentation, the fluorinated films are softer, less rigid and show greater plastic deformation than the unfluorinated film.
5. Acknowledgments
The authors thank FAPESP (2017/15853-0) and CNPq for financial support. This study was financed in part by the Coordenação de Aperfeiçoamento de Pessoal de Nível Superior - Brasil (CAPES) - Finance Code 001. We thank Prof. José H. Dias da Silva for helpful discussion of the optical data.
-
Errata
In the article “Characterization of Plasma-deposited a-C:H:Si:F:N Films”, with DOI: https://doi.org/10.1590/1980-5373-MR-2021-0016, published in Materials Research, 24(suppl. 1):e20210016, on page 6, Figs. 11 and 12, should be as shown below:


6. References
-
1Liu S, Gangopadhyay S, Sreenivas G, Ang SS, Naseem HA. Infrared studies of hydrogenated amorphous carbon (a-C:H) and its alloys (a-C:H,N,F). Phys Rev B Condens Matter. 1997;55(19):13020-4.
-
2Liu S, Gangopadhyay S, Sreenivas G, Ang SS, Naseem HA. Photoluminescence studies of hydrogenated amorphous carbon and its alloys. J Appl Phys. 1997;82(9):4508-14.
-
3Kim B-G, Kang S-Y, Kim J-J. FTIR study of fluorinated silicon oxide film. J Phys D Appl Phys. 1997;30:1720-4.
-
4Jun B-H, Lee JS, Kim D-W, Sung TH, Bae BS, No K. Composition, oxidation, and optical properties of fluorinated silicon nitride film by inductively coupled plasma enhanced chemical vapor deposition. J Mater Res. 1999;14(3):995-1001.
-
5Ohta H, Hori M, Goto T. Ultrathin fluorinated silicon nitride gate dielectric films formed by remote plasma enhanced chemical vapor deposition employing NH3 and SiF4 J Appl Phys. 2001;90(4):1955-61.
-
6Rangel EC, da Cruz NC, Rangel RCC, Landers R, Durrant SF. Effect of ion irradiation on the structural properties and hardness of a-C:H:Si:O:F films. J Phys Conf Ser. 2015;591:012044.
-
7Cisneros JI, Rego GB, Tomiyama M, Bilac S, Gonçalves JM, Rodriguez AE, et al. A method for the determination of the complex refractive index of no- metallic thin films using photometric measurements at normal incidence. Thin Solid Films. 1983;100:155-67.
-
8Tauc J. Optical properties and electronic structure of amorphous semiconductors. In: Abeles F, editor. Optical Properties of Solids. New York: American Elsevier; 1972.
-
9Rangel EC, Durrant SF, Rangel RCC, Kayama ME, Landers R, Da Cruz NC. Amorphous carbon nitrogenated films prepared by plasma immersion ion implantation and deposition. Thin Solid Films. 2006;515(4):1561-7. http://dx.doi.org/10.1016/j.tsf.2006.05.016
» http://dx.doi.org/10.1016/j.tsf.2006.05.016 -
10Oliver WC, Pharr GM. An improved technique for determining hardness and elastic modulus using load and displacement sensing indentation experiments. J Mater Res. 1992;7(6):1564-83. http://dx.doi.org/10.1557/JMR.1992.1564
» http://dx.doi.org/10.1557/JMR.1992.1564 -
11Szmigiel D, Domanski K, Prokaryn P, Grabiec P, Sobczak JW. The effect of fluorine-based plasma treatment on the morphology and chemical surface composition of biocompatible silicone elastomer. Appl Surf Sci. 2006;253:1506-11. http://dx.doi.org/10.1016/j.apsusc.2006.02.027
» http://dx.doi.org/10.1016/j.apsusc.2006.02.027 -
12Yih PH, Saxena V, Steckl AJ. A review of SiC reactive ion etching. Phys Status Solidi (b). 1997;202: 605-42.
-
13Morosoff N, Crist B, Bumgarner M, Hsu T, Yasuda H. Free radicals resulting from plasma polymerization and plasma treatment. J Macromol Sci. 1976;10(3):451-71. https://doi.org/10.1080/00222337608061192
» https://doi.org/10.1080/00222337608061192 -
14Yasuda H, Bumgarner MO, Marsh HC, Morosoff N. Plasma polymerization of some organic compounds and properties of the polymers. J Polym Sci: Polym Chem Ed. 1976;14(1):195-224. https://doi.org/10.1002/pol.1976.170140118
» https://doi.org/10.1002/pol.1976.170140118 -
15Shih M, Lee WJ, Tsai C-H, Tsai P-J, Chen C-Y. Decomposition of SF6 in an RF plasma environment. J Air Waste Manage Assoc. 2002;52:1274-80. http://dx.doi.org/10.1080/10473289.2002.10470864.
» https://doi.org/. http://dx.doi.org/10.1080/10473289.2002.10470864 -
16Da Cruz NC, Durrant SF, Bica de Moraes MA. Thin film deposition from plasmas of tetramethylsilane-helium-argon mixtures with oxygen and with nitrogen. J Polym Sci, B, Polym Phys. 1998;36:1873-9. http://dx.doi.org/10.1002/(SICI)1099-0488(199808)36:11<1873:AID-POLB8>3.0.CO;2-R
» http://dx.doi.org/10.1002/(SICI)1099-0488(199808)36:11<1873:AID-POLB8>3.0.CO;2-R -
17Freeman EC, Paul W. Optical constants of rf sputtered hydrogenated amorphous Si. Phys Rev B Condens Matter. 1979;20:716. http://dx.doi.org/10.1103/PhysRevB.20.716
» http://dx.doi.org/10.1103/PhysRevB.20.716 -
18Freire FL. Amorphous hydrogenated carbon films: effects of nitrogen and fluorine incorporation on the film microstructure and mechanical properties: a review. J. Non-crystalline Solids. 2002;304(1-3):251-8.
-
19Tsui TY, Pharr GM, Oliver WC, Bhatia CS, White RL, Anders S, et al. Nanoindentation and nanoscratching of hard carbon coatings for magnetic disks. Proc MRS. 1995;383:447-52. http://dx.doi.org/10.1557/PROC-383-447
» http://dx.doi.org/10.1557/PROC-383-447 -
20Sirghi L, Ruiz A, Colpo P, Rossi F. Atomic force microscopy indentation of fluorocarbon thin films fabricated by Plasma Enhanced Chemical Deposition at low radio frequency power. Thin Solid Films. 2009;517(11):3310-4. http://dx.doi.org/10.1016/j.tsf.2009.01.055
» http://dx.doi.org/10.1016/j.tsf.2009.01.055
Publication Dates
-
Publication in this collection
19 July 2021 -
Date of issue
2021
History
-
Received
10 Jan 2021 -
Reviewed
15 Apr 2021 -
Accepted
16 June 2021