Abstract
This paper aims at analyzing the effects of the roller pre-straightening of wire-rods on residual stress distributions in SAE 1045 steel bars. The combined drawing process is used in industrial production of bars in order to obtain a good surface quality and improved mechanical properties complying with specifications of the final products. In this process, prior to the drawing step, a roller straightening of the steel wire-rod is essential, because it provides the minimum straightness necessary for drawing. Metallographic analysis and hardness test were done for selected samples after different processing steps. Also, residual stress analysis of pre-straightened wire-rods by X-ray diffraction and neutron diffraction were carried out. The hardness tests show higher values near the surface and lower in the center of the wire-rod. Besides, the residual stresses results show a big inhomogeneity from one peripheral position to another and also in the evaluated cross section.
Keywords:
Pre-straightening; Wire drawing; Residual Stresses; Distortion
1. Introduction
The combined wire drawing process is widely used in the production of wire rods employed in the manufacturing of several products as automotive shafts, gear racks, shock absorbers, among many others. The combined wire drawing is composed by several processes as described by Rocha et al.11 Rocha AS, Nunes RM, Hirsch T. Changes in the axial residual stresses in AISI 1045 steel bars resulting from a combined drawing process chain. Proceedings of the Institution of Mechanical Engineers, Part B: Journal of Engineering Manufacture. 2011;226(3):459-465.. According to Nakagiri & Inakazu22 Nakagiri A, Inakazu N. Relationship between resildual stress and texture by multiple pass reduction drawing of titanium wire. Wire Journal International. 2004;37(12):58-63., in the drawing process, the wire rod should have a minimum degree of straightness, because a high degree of bend in the wire rod raises considerably the drawing force and may cause a premature breakdown of the drawing tools and reduction of the fatigue life of the end products.
The pre-straightening is the first step in the combined wire drawing process chain and consists of forcing the wire rod to pass between and arrangement of several forming rollers which impose several bending moments to the wire. This process aims at eliminating the wire rod curvature since after hot rolling it is stored as coils. By the applied moments in the pre-straightening, the large curvature radius of the wire-rod is replaced by a sequence of curvatures in opposing directions with smaller radii. Steps of vertical and horizontal roller straightening are used in this straightening process. That way a minimum straightness required for drawing should be achieved. Results published concerning roller straightening are scarce and there is no clear knowledge about the influence of the roller positioning on the resulting residual stresses33 Fahlkrans J, Melander A, Haglund JGS. Straightening of induction hardened shafts - influence on fatigue strength and residual stress. HTM Journal of Heat Treatment and Materials. 2012;67(3):179-187.
4 Mutrux A, Berisha B, Hora P. FE simulation of Cross Roll Straightening: A Strain Tensor Field Approach. AIP Conference Proceedings. 2010;1252(1):941-948.-55 Yoshida K, Suglyama T. Analysis of the straightening of drawn wires using rollers by the Finite-Element Method (FEM). Wire Journal International. 2009;42(5):52-56..
The pre-straightening step has a large influence on the quality of the final product66 Nastran M, Kuzman K. Stabilisation of mechanical properties of the wire by roller straightening. Journal of Materials Processing Technology. 2002;125-126:711-719.. Due to the strain inhomogeneities involved in the process, large distortions can occur in the final parts after heat treating and machining. In the worst case, the parts have to be discarded leading to increasing production costs.
This work aims at analysing the roller straightening process and its influence on residual stresses in the wire rod. Samples of the raw material (wire rod as hot rolled) and after different process steps as horizontal and vertical pre-straightening were analyzed by X-ray diffraction (XRD) and neutron diffraction regarding the residual stress distributions. Hardness and metallographic analysis were also carried out. The understanding of residual stresses after pre-straightening should help to determinate or minimize the distortion. Therefore the characterization of the process before and after each step, and the correlation of the obtained information with the rolls positioning is essential to achieve this aim.
2. Experimental Procedure
2.1 Production of the bars
The process chain known as combined drawing consists of the uncoiling of the wire rod and its passage through the steps of horizontal and vertical pre-straightening, shot blasting, drawing, cutting and final polishing and straightening by crossed rolls of the produced bars. The raw material for this process chain is a hot rolled wire rod stored as a coil. The wire rod material was from SAE 1045 steel with a mean nominal diameter of 21.46 mm and the initial coil diameter was 1200 mm. The chemical composition of the material is shown in Table 1. The flow curve of the material, true stress versus true strain obtained by compression tests described by Dias et al.77 Dias VW, Zottis J, Soares CAT, Souza TF, Rocha AS. Study of the Influence of Anisotropy on the Residual Stresses Generated in the Wire Drawing Process of an AISI 1045 Steel. Revista Colombiana de Materiales. 2012;5:130-137., is given in Figure 1.
Flow curve of the SAE 104577 Dias VW, Zottis J, Soares CAT, Souza TF, Rocha AS. Study of the Influence of Anisotropy on the Residual Stresses Generated in the Wire Drawing Process of an AISI 1045 Steel. Revista Colombiana de Materiales. 2012;5:130-137..
After the first uncoiling, the wire rod (Figure 2(a)) is curved and presents an irregular shape, so that it has to be first pre-straightened to avoid failures during drawing. In order to follow the pre-straightening process, the wire rod is guided by a set of two rolls with diameters of 250 mm. The pre-straightening equipment has several forming rollers arranged in two groups responsible for two processes. The first process is named horizontal pre-straightening (Figure 2(b)) and is composed by a set of six rollers with diameters of Ø230 mm. The following step named vertical pre-straightening is a set of five rollers with diameters of Ø192 mm (Figure 2(c)). The top position of the horizontal pre-straightening was marked as 0º. The other angular positions of the bar were marked according to the right-hand rule explained by Dong et al.88 Dong J, Epp J, Rocha AS, Nunes RM, Zoch HW. Investigation of the Influence Factors on Distortion in Induction-Hardened Steel Shafts Manufactured from Cold-Drawn Rod. Metallurgical and Materials Transactions A. 2016;47(2):877-888..
Pieces of 1.2 m in length were cut before and after horizontal pre-straightening as well as after vertical pre-straightening to perform the experimental characterization of those steps. The raw material and both horizontal and vertical pre-straightened bars were then cut to 400 mm length samples in order to examine a large part of the bar surface. From these, small samples were prepared for hardness testing and metallographic analysis at the peripheral positions.
2.2 Experimental methods
Raw material (RM), horizontal pre-straightening (HPS) and vertical pre-straightening (VPS) samples were analyzed by metallography and Vickers microhardness testing. For the Vickers microhardness testing, a load of 500 gf (HV0.5) was used. Those samples were cut in the transverse direction from 0° to 180° and 90° to 270° as indicated in Figure 3, observing the angular positions defined in Figs 2(c) and 4(b). For each cross section, 21 indentations were applied with 1 mm in between. Microstructure metallographic examinations were performed for the center of each sample. For the metallographic analysis, the samples were sand paper ground, polished and etched with Nital (3vol.-% HNO3 in Alcohol) for 20 seconds.
Figure 4 shows the residual stress measuring points. Axial residual stresses were measured for 6 positions along the bar from 150 mm to 250 mm as indicated in Figure 4(a). For each position, the measuring points were distributed in 8 angular peripheral positions (as indicated in Figure 4(b)), forming measuring circles. That way, 48 axial residual stress values were recorded for each sample. The angular measuring points in the circles were defined from the 0º reference position indicated in Figure 4(b) applying the right-hand rule. All positions around the wire-rod were marked as reference for measurements99 Hirsch TK, Rocha AS, Nunes RM. Characterization of local residual stress inhomogeneities in combined wire drawing processes of AISI 1045 steel bars. International Journal of Advanced Manufacturing Technology. 2014;70(1-4):661-668.. Before residual stress measurements, the surface of the sample was electro-polished. The electrolytic solution was composed of 80vol.-% H3PO4 (phosphoric acid) and 20vol.-% H2SO4 (Sulfuric acid) and samples electro-polished for about 30 minutes for a 50 µm layer removal.
Position of residual stresses measurement (a) along the bar and (b) on the peripheral positions.
The residual stresses in the surface of the samples were measured by X-ray diffraction (XRD) using a GE Inspection Technologies diffractometer, model MZ VI E. The evaluation of residual stresses was performed using the conventional sin2ψ-method. In the X-ray diffractometer, the adjustment of the measuring position in the sample was carried out using a laser positioning system for X and Y axis and a dial gauge for Z axis. The residual stress diffraction analysis was done according to the parameters shown in Table 2:
Besides macro residual stresses, the values of the diffraction peaks full width at half maximum (FWHM) were also evaluated. The FWHM depends on the distribution of the randomly oriented lattice plane distances due to the 3rd kind residual stresses as well as on the size of coherently diffracting domains1010 Hauk V. Structural and Residual Stress Analysis by Nondestructive Methods. 1st ed. Amsterdam: Elsevier; 1997. 640 p. and could be used to characterize the work hardening in the material and to make correlations to hardness measurements1111 Nalla RK, Altenberger I, Noster U, Liu GY, Scholtes B, Ritchie RO. On the influence of mechanical surface treatments-deep rolling and laser shock peening-on the fatigue behavior of Ti-6Al-4V at ambient and elevated temperatures. Materials Science and Engineering: A. 2003;355(1-2):216-230..
In addition to XRD analysis, neutron diffraction was used to evaluate the residual stress profiles in the whole cross section of the samples. The neutron measurements were performed on beamline E3 of the research reactor BER II at the Helmholtz Center Berlin (HZB). The diffraction line for the lattice plane {211} of iron was recorded for axial, tangential and radial directions. An approximated gauge volume of 2 x 2 x 2 mm has been used in order to obtain good signal intensity. A cube of size 3 x 3 x 3 mm was prepared by electro-discharge machining and measured in different angular directions in order to determine the stress-free lattice spacing d0. The wavelength for the measurements was 0.1486 nm and the distance between the detector and the sample was 1132 mm. Two residual stresses profiles were measured with a total of 21 points in two different cross sections (0º-180° and 90º-270º) of the vertical pre-straightened wire rod (Ø21.46mm), starting at a distance of 1.3 mm from the surface.
In a stressed sample, a shift in the Bragg peak position occurs and the elastic strain, εhkl, can be calculated by equation 1.
In order to obtain the normal stress components, the Neutron measurements were performed in axial, radial and hoop directions along the cross section of the horizontal roller straightened bars. Therewith, the residual stress in a specific direction, σi, is calculated by the equation 2. Where σi is the stress in a given direction (i = x, y, or z) and ε is the strain in x, y and z directions. More details about the neutron diffraction measurements can be found in Reference 8.
3. Results
The hardness profiles were measured in the cross section of the raw material samples in two different sections, as demonstrated in Figure 3. An average hardness of 205 ± 3 HV0.5 for 0º and 212 ± 4 HV0.5 for 180º was determined in the surface near the region of the 0º-180º section while in the center 205 ± 6 HV0.5 was measured. The 90°-270° section exhibits hardness values of 220 ± 5 HV0.5 for 90º and 219 ± 14 HV0.5 for 270º close to the surface and 233 ± 25 HV0.5 in the center. These values show that the hardness is almost constant over the cross section with a slight increase towards the surface, in particular in direction of the coiling curvature (90-270°). The hardness measurements were also carried out after horizontal (HPS) and the results are given in Figures 5 for the sections 0°-180° and 90º-270°. In addition, microstructure analysis was carried out in the samples sections. Each image in Figure 6 was numbered according to Figure 5 that gives the positions in the cross section.
Hardness profiles (HV0.5) over the bar cross section in the section 0°-180° and 90°-270° for horizontal pre-straightened samples.
Micrographs over the bar cross section in the center and surface for horizontal pre-straightened samples. In the center (a) of the section 0-180 in the region 1 indicated in Figure 5, (b) of the section 90-270 in the region 2 of the Figure 5 and in surface (c) in 0º side in the region 3 shown in Figure 5 and (d) in 90º side in the region 4 of Figure 5.
Comparing results of raw material and HPS (Figure 5), one can see that the hardness after the straightening step reaches values 17% higher than the hardness of the raw material in the 90º side and 12% higher in the 270º side. On the other hand, the 0º and 180º sides revealed lower hardness differences. The hardness in the 0º side for the raw material is 8% lower than the values of the horizontal step and the measured values in the 180º side for the raw material are 4% lower than the values of the horizontal pre-straightening step. Figure 6a and Figure 6b show micrographs taken for the same regions were hardness increases were seen in Figure 5 at positions marked as 1 and 2. The hardness of the surface is significantly higher than in the center for the 90°-270° section, while the 0°-180° section does not present a higher hardness than in the raw material. For the first straightening step (horizontal) in the 90º (266 HV0.5) side the average hardness is 16% larger than the hardness on 0º side (223 HV0.5). On the other hand, the difference between 270º (248 HV0.5) and 180º (220 HV0.5) is 11%. Figure 6 shows the microstructure of the samples in the 0º side (c) and 90º side (d) of the sample. The images belong to the regions 3 and 4 shown in Figure 5. Variations of the pearlite amount can be observed on both sides, which is a characteristic of the steel making process (Continuous Casting and Hot rolling). In both sections demonstrated in Figure 5, there is a localized increase in the hardness values close to the sample's center, which is due to the central segregation as proved by Dias et al.1212 Dias VW, Zottis J, Rocha S, Dong J, Epp J. Analysis of the Bending Distortion of Automotive Shafts Manufactured from Cold Drawn Bars. In: Proceedings of 5th International Conference on Distortion Engineering IDE 2015. 2015 Sep 23-25; Bremen, Germany; 2015. p. 3-13., where increased carbon content is present. Dong et al.88 Dong J, Epp J, Rocha AS, Nunes RM, Zoch HW. Investigation of the Influence Factors on Distortion in Induction-Hardened Steel Shafts Manufactured from Cold-Drawn Rod. Metallurgical and Materials Transactions A. 2016;47(2):877-888. has also evaluated the segregation in drawn bars in the same process and showed the amount of carbon content in the cross section. This segregation band also appears in the micrographs from the sample's center for both evaluated sections as demonstrated in Figure 6 (a) and (b).
The VPS step was also evaluated by hardness measurements (Figure 7 (a)). The hardness in the 90° position (278 HV0.5) reaches a value 10% larger than at the 0° side (250 HV0.5), while the 180º side has the hardness value (243 HV0.5) just 4% smaller than the 270º side (253 HV0.5). The 0º and 180º positions of the VPS show larger differences if the results are compared with the horizontal step. The hardness at the 0º side of the vertical step reaches values 11% higher than in the horizontal step. The 180º side shows hardness values 9% larger in the vertical step than in the horizontal one. The increase in the values in the 0° and 180° positions can be explained by the contact between the rolls and the bar in the horizontal pre-straightening step, leading to a plastic deformation. On the other hand, the 90º and 270º sides of the vertical steps also show a slight increase of 4% in the hardness values compared to the state before VPS. However, variations of the local plastic deformation along the bar positions might occur due to varying curvature and shape, what can explain these slight differences.
(a) Experimental Hardness (HV0.5) and (b) the axial strain and the d value in the bar cross section in the section 0°-180° and 90°-270° for vertical pre-straightening samples.
The values of strains and the lattice plane distances d are showed in Figure 7 (b), where it is possible to observe a higher deformation in the 90º sample side. In addition, there is a nonhomogeneous distribution of the values in both cases strain and d value near the center.
Additionally, the hardness measurements shown in Figures 5 and 7 demonstrate an increase in hardness from one step to the next with the horizontal pre-straightening step leading to the highest hardness increase. Also, major differences are seen in the hardness values for the 90° and 270° sides. This difference is due to the sum of two effects, the surface pressure developed by the contact of rolls and bar during the horizontal pre-straightening process and due to the high bending of the raw material before entering the set of rolls. The residual stresses are an important distortion potential at the end of the process. Differences in residual stress values between opposite sides of the samples have the higher potential to cause distortion after wire drawing1010 Hauk V. Structural and Residual Stress Analysis by Nondestructive Methods. 1st ed. Amsterdam: Elsevier; 1997. 640 p.. The local strain reaches up to 6% and this leads to different levels of cold working and residual stresses in those regions. Furthermore, as showed in Figure 7 (b), the values of strain and lattice plane distances "d" have a nonhomogeneous distribution near the center due to segregation, the same as noticed in the hardness values of Figure 7 (a).
The strains generated in the horizontal pre-straightening step are larger than those generated in the vertical step due to the original curvature of the coil which is curved in the horizontal direction. This leads to higher residual stresses in the contact lines with the rolls. Such influence remains after the vertical step and may be analyzed in Figure 8 where the hardness in 150µm depth and FWHM distributions in 50 µm depth around the periphery are compared for the different process steps. The FWHM and the hardness first increase in 90º and 270º positions after horizontal pre-straightening and remain almost constant after vertical pre-straightening. The values in the 0° and 180° positions are stable after the first pre-straightening step and then show an increase, but less pronounced after the vertical pre-straightening, due to the smaller entering curvature and required bending deformation compared to the horizontal direction.
Hardness distribution (HV0.5) provided by an average of three points in each position measured as close as possible from the surface and FWHM in the peripheral positions of the bar both measured from 50 µm from the surface.
As shown in Figure 4a and in Figure 4b, the surface residual stresses were measured in six circles from 150 mm to 250 mm of the bar in eight peripheral positions. The axial surface residual stresses by XRD in the raw material with the removal of 50µm layer are given in the Figure 9a, as well as the Full Width at Half Maximum - FWHM distribution (Figure 9b). The Figure 9a shows compressive residual stresses around -150 MPa in angles from 0° to 180° and tensile stresses between 0 and 150 MPa relative to angles from 225° to 315°. The FWHM values are in a low range due to the prior hot rolling process and varying between 1.46° and 1.64°. It is important to observe that the FWHM values are in good correlation with the hardness and strains values. Thus, in the case of raw material, the increase at 90º and 270º in the values of FWHM are due to the deformation of the wire rod during coiling. The bar is concave at 90º and convex at 270º, fact that leads to compressive strains and tensile strains, respectively. The increase in FWHM is clearly due to the strain hardening of the material at that measured positions.
Observed differences in the peripheral positions around the bar in experimental measurements, were already reported by Hirsch et al.99 Hirsch TK, Rocha AS, Nunes RM. Characterization of local residual stress inhomogeneities in combined wire drawing processes of AISI 1045 steel bars. International Journal of Advanced Manufacturing Technology. 2014;70(1-4):661-668.. Evaluating the raw material, the 90º bar side that touches the coil has compressive residual stresses (Figure 9a) while the 270° side is under tension. The residual stresses are generated due to an inhomogeneous remaining strain distribution and depend additionally on the workpiece geometry itself1313 Frerichs F, Lübben T, Zoch H. Interrelationship of strains and distortion of rectangular formed prisms. In: Proceedings of 5th International Conference on Distortion Engineering IDE 2015. 2015 Sep 23-25; Bremen, Germany; 2015. p. 129-140.. Those strains are the source of residual stresses. The raw material has the coil geometry where the bar is concave on one side and convex on the other side. Thereby, the initial residual stresses measured in the wire rod surface are due to a superimposition of hot rolling and of the coiling process undergone by the material in the final stages of the manufacturing process before storage and of the following pre-straightening steps.
After horizontal pre-straightening (Figure 10a), a strong change in residual stress distributions is seen if compared with the raw material. The minimum value reaches -250 MPa at 315° and the maximum tensile value reaches 180 MPa at a position of about 135°. The FWHM (Figure 10b) shows a large increase at 90° and 270° positions, which is along the bending direction, but strong variations of the FWHM increase can be observed according to the longitudinal position on the bar. This demonstrates that the bars are not homogeneously bended with the same severity when passing the pre-straightening device.
After the horizontal pre-straightening, the compressive residual stress values generated by the coiling tend to be reversed, as observed if the Figures 9a and 10a are compared. In other words and according to Wang & Gong1414 Wang Z, Gong B. Residual Stress in the Forming. In: Totten G, Howes M, Inoue T, eds. Handbook of Residual Stress and Deformation of Steel. Materials Park: ASM International; 2002. p. 141-149., when a steel product is plastically deformed in compression, the yield stress in the reversed loading is normally lower than the original compression yield stress. The same happens with the stresses in the vertical step of the pre-straightening (Figure 11a) wherein all angles the residual stresses have the opposite sign or are lower than in the horizontal step. This behavior is explained by the Bauschinger effect described by Hemmerich et al.1515 Hemmerich E, Rolfe B, Hodgson PD, Weiss M. The effect of pre-strain on the material behaviour and the Bauschinger effect in the bending of hot rolled and aged steel. Materials Science and Engineering: A. 2011;528(9):3302-3309..
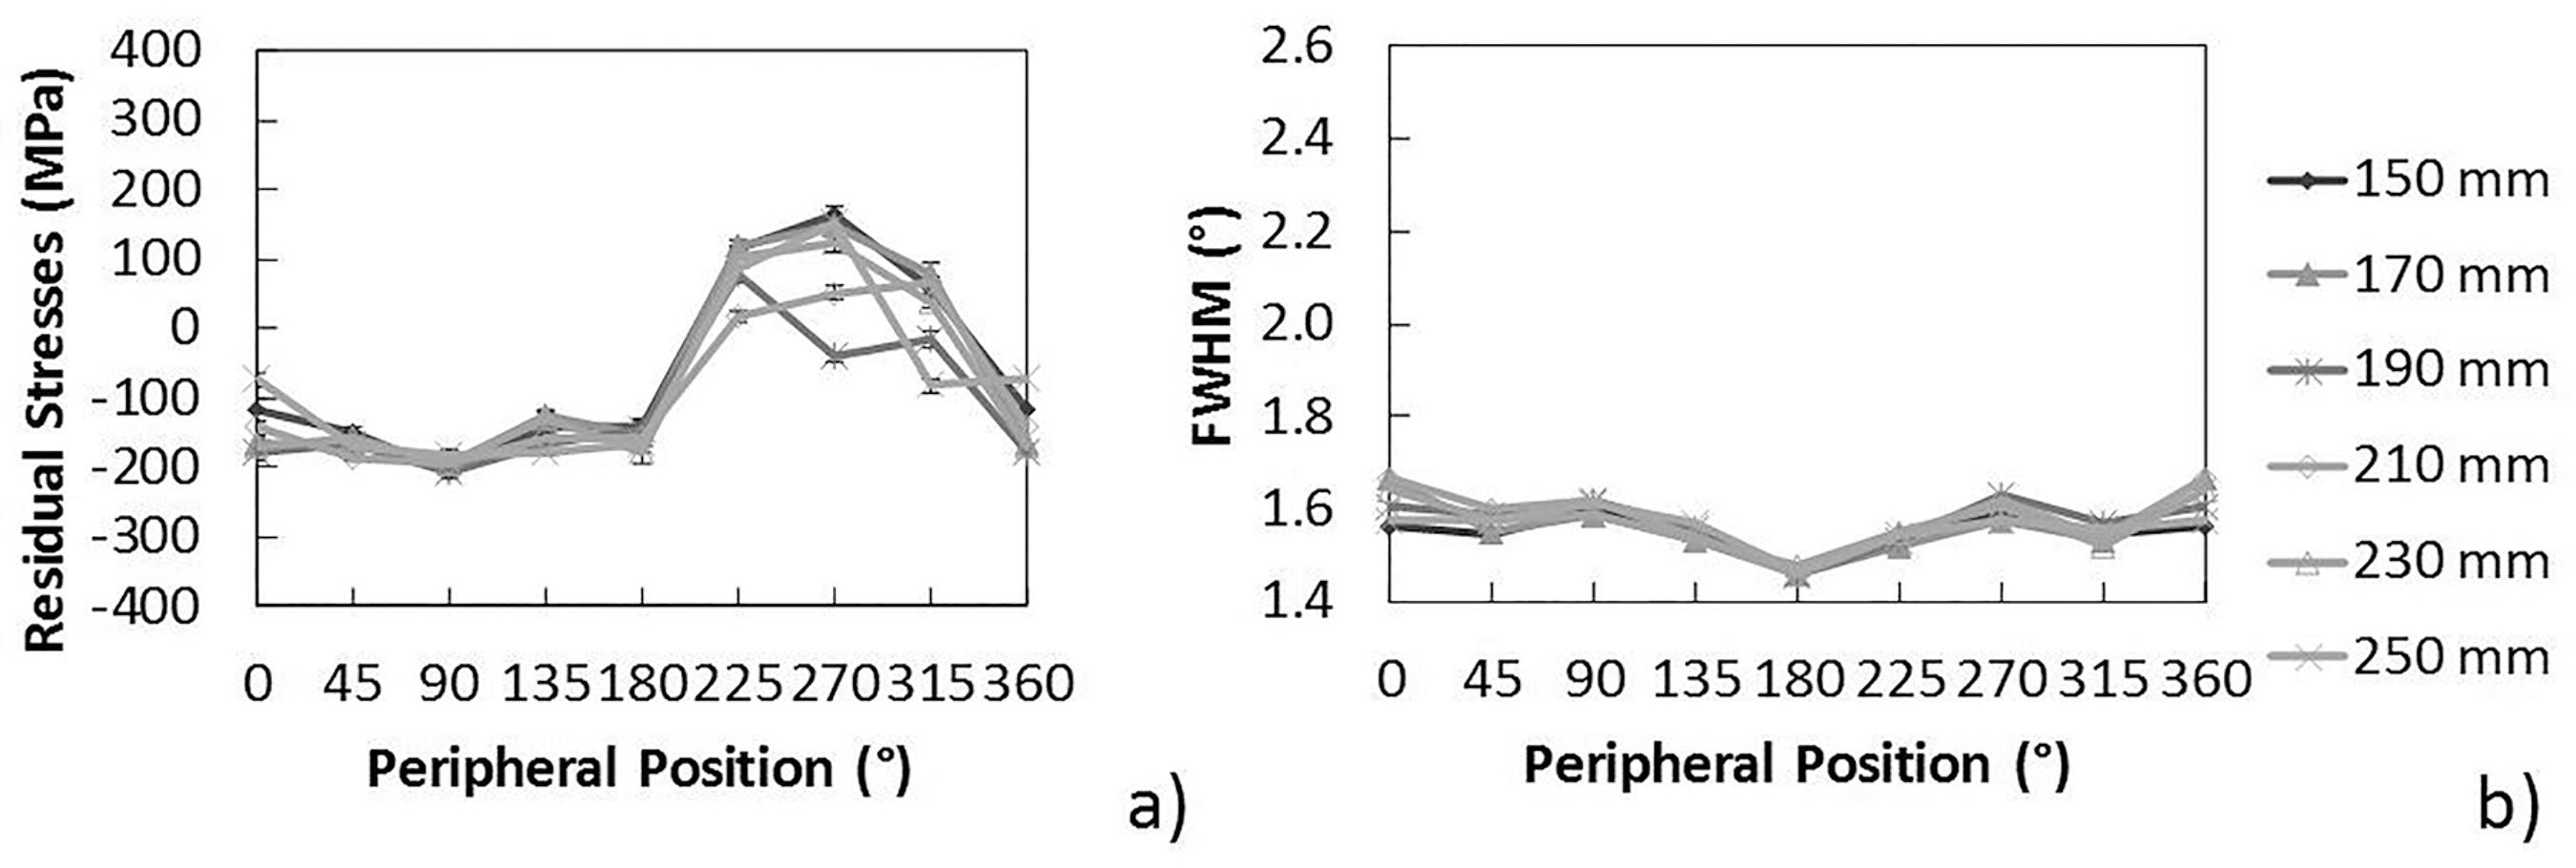
The residual stresses after vertical pre-straightening (Figure 11a) show large inhomogeneity in the 0° position with values varying between -60 MPa to -180 MPa. This could be explained by the contact between the bar and the vertical rolls set which is supposed to be continuously varying. The FWHM values (Figure 11b) present four peaks, in 0°, 90°, 180° and 270°, reaching maximum values around 1.97°.
The distribution of residual stresses in the peripheral angular positions of the bars in three analyzed steps is demonstrated in Figure 12. The wire rod (Figure 12a) has compressive residual stresses in most part of the surface from 0º to 180º positions, and from 225º to 315º positions the stresses are tensile. The horizontal pre-straightening (Figure 12b) shows a different distribution with tensile residual stresses from 90º to 225º positions and compressive stresses in the remaining positions. Finally, after vertical pre-straightening (Figure 12c) mostly compressive stresses are present in the entire surface, with some points with values close to 0º.
Distribution of residual stress in the peripheral radial positions of the raw material (a) horizontal (b) and vertical (c) pre-straightened bars.
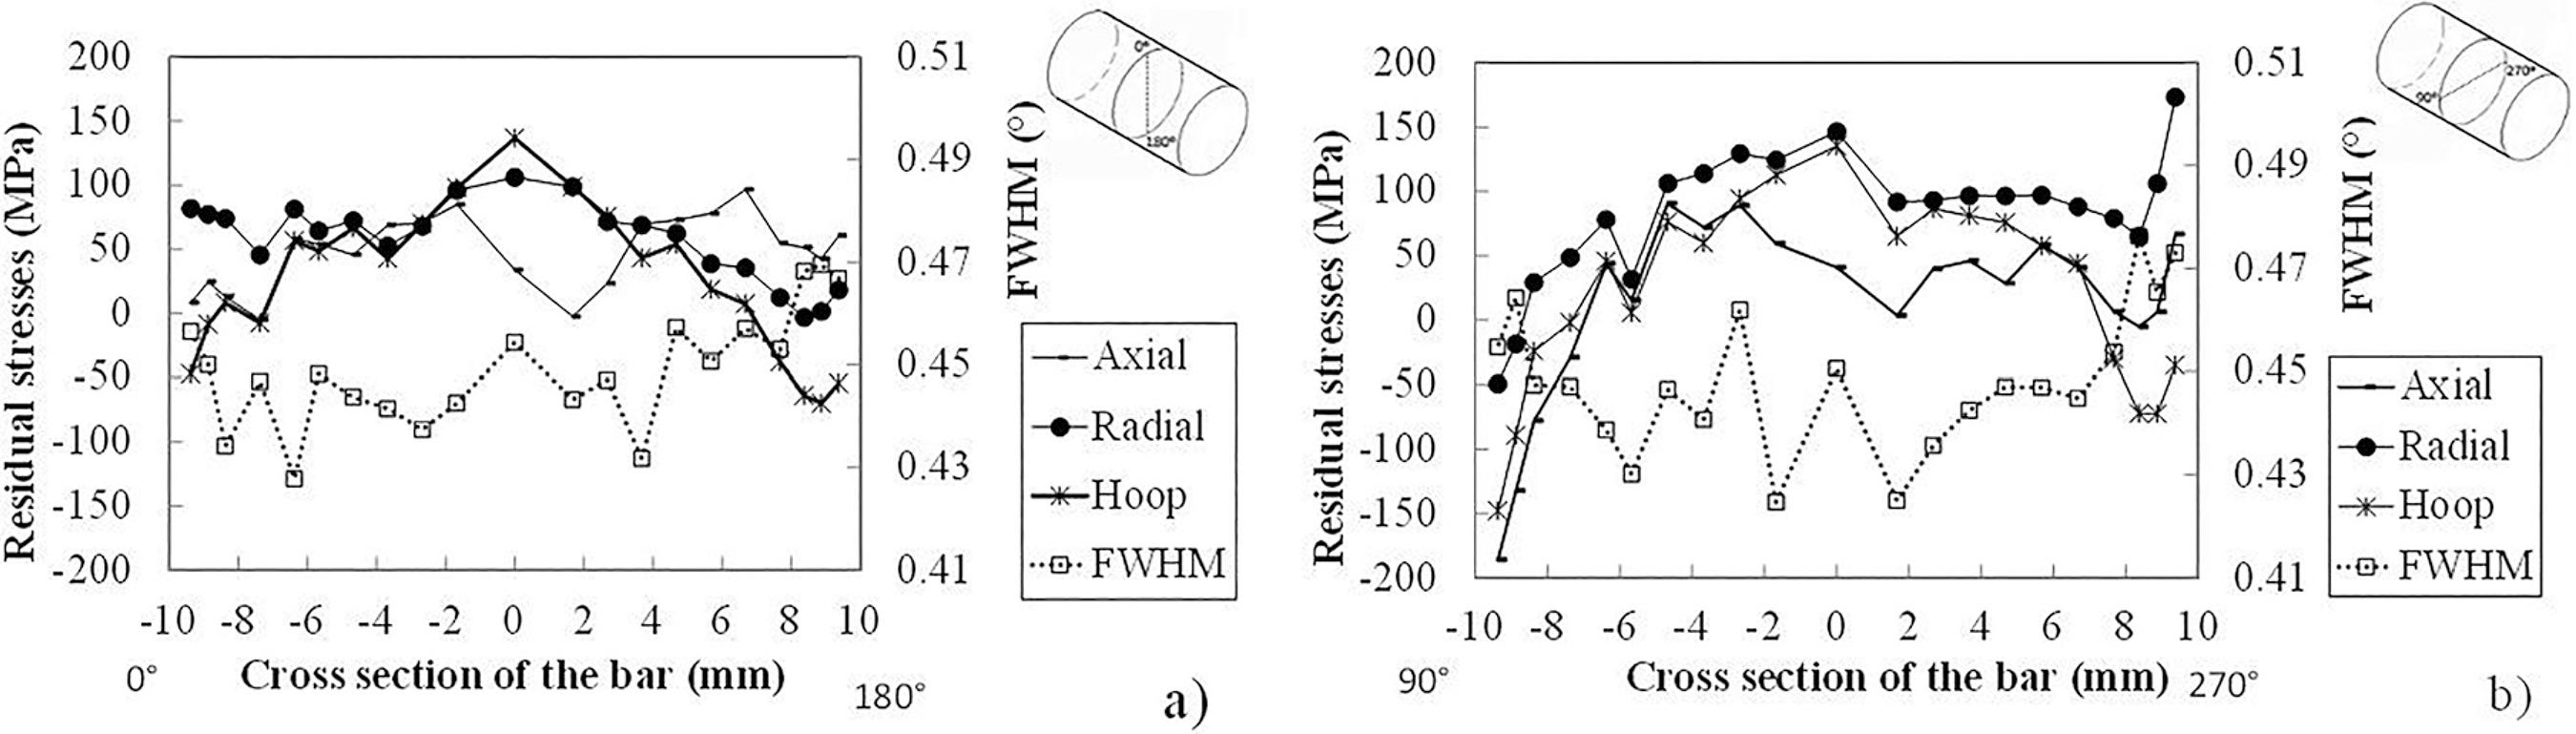
Residual stresses after vertical pre-straightening were also measured by neutron diffraction for sections from 0° to 180° and from 90° to 270°. One of the advantages of diffraction is the large penetration depth that allowed thus to perform the measurements in the complete cross section of the samples without the need of additional cutting which would cause redistribution of residual stresses. The residual stresses and FWHM values obtained by the neutron diffraction are shown in Figure 13.
Residual stresses and FWHM in the sections (a) 0°-180° and (b) 90°-270° by neutron diffraction after the vertical pre-straightening process in the bar cross sections.
The profile of residual stresses obtained by neutron diffraction in the cross section of the bar in the section 0º-180º (Figure 13a) has a range of about -50 to +150 MPa. As demonstrated in Figure 13b, the residual stresses in section 90°-270° present a complex distribution with much larger variations than in the 0°-180°section (Figure 13a). This was already noticed in the near-surface residual stress values after vertical pre-straightening (Figure 11). In the 90º position, the axial residual stresses reach -186 MPa while in the 270º side they reach tensile values of 66 MPa. Average FWHM values for both 0º-180º and 90º-270º sections are shown in Figure 13. The 0º-180º section shows a minimum FWHM value of 0.43º and a maximum value of 0.47º with small variations in the cross section but with an increase near the surface in the 180º side to 0.46º. The minimum value for FWHM in the section 90º-270º was 0.42º and the maximum was 0.48º in the 270º side. Such increase can be seen also in the hardness values in the 270º side (Figure 8).
The pre-straightening process is continuous with varying loads and consequently inhomogeneous residual stress states along the axis of the bar, as demonstrated in Figure 13 and confirmed by Rocha et al.1616 Rocha AS, Nunes RM, Hirsch T. Analysis by design of experiments of distortion potentials in drawn and induction hardened wire. Materials Research. 2012;15(2):266-276.. The differences on residual stresses obtained by neutron diffraction in the two sections of the vertical pre-straightening show the influence of the horizontal process in the residual stresses after the vertical step and those inhomogeneities in the gradient of residual stresses from one side of the bar to another. Near the surface of the samples, there is a large gradient of residual stress in section 90°-270°, but the stresses in the center of the bar remain close to zero. The difference between the 90º and 270º sides in the near surface leads to distortions after heat treating as observed by Reference 8. The observed gradients of residual stresses can be attributed to the contact between the horizontal rolls and the bar in those angles (90º and 270º), which reaches almost 4 mm in the depth, as seen in Figure 13b and also due to the remaining bending from the wire rod. Because of the plastic deformation, cold working leading to an increase in hardness and in FWHM measured values in those surface peripheral angular positions, as shown in Figure 8. These facts demonstrate the higher influence of the horizontal than vertical pre-straightening in the process chain, as expected due to the original curvature of the coil which is in the horizontal plane.
4. Conclusions
In this article, the effects of the pre-straightening in the hardness and residual stresses of wire-rods were investigated prior to drawing. Pre-straightening leads to strong hardness increase in the surface region of the wire-rod if compared with the center. The increase is particularly pronounced along the 90-270° section line as it is in the same plane of the curvature of the coiled material. As a consequence, large plastic deformation takes place along this direction during the horizontal pre-straightening process due to bending, leading to a strong cold working of near surface regions.
Residual stress measurements by X-ray diffraction in the pre-straightening process have shown great inhomogeneity as a function of the peripheral positions around the wire rods. Neutron diffraction has shown larger near surface residual stresses gradients in the 90°-270° than in the 0º-180º section, showing the higher significance of the horizontal pre-straightening applied.
5. Acknowledgments
This work was started in the frame of the "BRAGECRIM" program (Brazilian German Cooperation Research Initiative in Manufacturing). We acknowledge the financial support by the Brazilian agencies CAPES, CNPq (process number 141205/2013-0) and the German Agency DAAD. We also thankfully acknowledge the financial support by Helmholtz Center Berlin - HZB and Dr. Robert Wimpory for assistance in the neutrons diffraction measurements.
6. References
-
1Rocha AS, Nunes RM, Hirsch T. Changes in the axial residual stresses in AISI 1045 steel bars resulting from a combined drawing process chain. Proceedings of the Institution of Mechanical Engineers, Part B: Journal of Engineering Manufacture 2011;226(3):459-465.
-
2Nakagiri A, Inakazu N. Relationship between resildual stress and texture by multiple pass reduction drawing of titanium wire. Wire Journal International 2004;37(12):58-63.
-
3Fahlkrans J, Melander A, Haglund JGS. Straightening of induction hardened shafts - influence on fatigue strength and residual stress. HTM Journal of Heat Treatment and Materials 2012;67(3):179-187.
-
4Mutrux A, Berisha B, Hora P. FE simulation of Cross Roll Straightening: A Strain Tensor Field Approach. AIP Conference Proceedings 2010;1252(1):941-948.
-
5Yoshida K, Suglyama T. Analysis of the straightening of drawn wires using rollers by the Finite-Element Method (FEM). Wire Journal International 2009;42(5):52-56.
-
6Nastran M, Kuzman K. Stabilisation of mechanical properties of the wire by roller straightening. Journal of Materials Processing Technology 2002;125-126:711-719.
-
7Dias VW, Zottis J, Soares CAT, Souza TF, Rocha AS. Study of the Influence of Anisotropy on the Residual Stresses Generated in the Wire Drawing Process of an AISI 1045 Steel. Revista Colombiana de Materiales 2012;5:130-137.
-
8Dong J, Epp J, Rocha AS, Nunes RM, Zoch HW. Investigation of the Influence Factors on Distortion in Induction-Hardened Steel Shafts Manufactured from Cold-Drawn Rod. Metallurgical and Materials Transactions A 2016;47(2):877-888.
-
9Hirsch TK, Rocha AS, Nunes RM. Characterization of local residual stress inhomogeneities in combined wire drawing processes of AISI 1045 steel bars. International Journal of Advanced Manufacturing Technology 2014;70(1-4):661-668.
-
10Hauk V. Structural and Residual Stress Analysis by Nondestructive Methods 1st ed. Amsterdam: Elsevier; 1997. 640 p.
-
11Nalla RK, Altenberger I, Noster U, Liu GY, Scholtes B, Ritchie RO. On the influence of mechanical surface treatments-deep rolling and laser shock peening-on the fatigue behavior of Ti-6Al-4V at ambient and elevated temperatures. Materials Science and Engineering: A 2003;355(1-2):216-230.
-
12Dias VW, Zottis J, Rocha S, Dong J, Epp J. Analysis of the Bending Distortion of Automotive Shafts Manufactured from Cold Drawn Bars. In: Proceedings of 5th International Conference on Distortion Engineering IDE 2015 2015 Sep 23-25; Bremen, Germany; 2015. p. 3-13.
-
13Frerichs F, Lübben T, Zoch H. Interrelationship of strains and distortion of rectangular formed prisms. In: Proceedings of 5th International Conference on Distortion Engineering IDE 2015 2015 Sep 23-25; Bremen, Germany; 2015. p. 129-140.
-
14Wang Z, Gong B. Residual Stress in the Forming. In: Totten G, Howes M, Inoue T, eds. Handbook of Residual Stress and Deformation of Steel Materials Park: ASM International; 2002. p. 141-149.
-
15Hemmerich E, Rolfe B, Hodgson PD, Weiss M. The effect of pre-strain on the material behaviour and the Bauschinger effect in the bending of hot rolled and aged steel. Materials Science and Engineering: A 2011;528(9):3302-3309.
-
16Rocha AS, Nunes RM, Hirsch T. Analysis by design of experiments of distortion potentials in drawn and induction hardened wire. Materials Research 2012;15(2):266-276.
Publication Dates
-
Publication in this collection
24 Aug 2017 -
Date of issue
Nov-Dec 2017
History
-
Received
03 Apr 2017 -
Reviewed
21 July 2017 -
Accepted
28 July 2017