Abstracts
Turbine dewatering and stop/startup may lead to the death of tons of fish at Brazilian power dams. The Três Marias Dam (TMD) on the São Francisco River has adopted two techniques to reduce the quantity of fish, mostly mandi (Pimelodus maculatus, Pimelodidae), affected by these maneuvers. They are: (i) spill before turbine dewatering to attract fish out of the tailrace, and (ii) fish screens in the stop log slots during turbine stop/startup to prevent fish from entering the draft tube. Here, we investigated whether spill and fish screens reduced the quantity of fish affected by turbine dewatering and stop/startup at TMD. We also determined whether the biomass of mandi trapped during turbine dewatering may be predicted by turbine discharge (Q) and/or catch per unit effort (CPUE) of mandis in the tailrace. Due to insufficient statistical power, our data were inconclusive as to whether spill attracted mandi out of the tailrace. We verified that the presence of fish screens significantly reduced the biomass of dead/moribund fish during turbine stop/startup. The biomass of mandis trapped in the draft tube during turbine dewatering was mainly influenced by Q (r² = 0.67), followed by CPUE (r² = 0.49). Since the trapped fish biomass correlated negatively with Q, we recommend that Q be maximized before turbine dewatering to reduce quantity of mandi trapped in the draft tube. The information presented here may be useful for reducing the quantity of fish affected by turbine maneuvers at TMD, as well as other dams.
Fish kill; Fish screen; Pimelodus maculatus; Turbine dewatering; Turbine stop
Drenagem e parada/partida de turbina podem provocar a morte de toneladas de peixes em usinas hidrelétricas brasileiras. A usina de Três Marias (UTM), rio São Francisco, adotou duas técnicas para reduzir a quantidade de peixes, principalmente do mandi (Pimelodus maculatus, Pimelodidae), afetada durante essas manobras. Essas são: (i) vertimento antes da drenagem de turbina para atrair peixes para fora do canal de fuga, e (ii) grades nas guias das comportas ensecadeiras durante paradas/partidas para prevenir a entrada de peixes no tubo de sucção. Neste estudo, investigamos se o vertimento e as grades reduziram a quantidade de peixes afetados durante drenagem e parada/partida de turbina na UTM. Nós também determinamos se a biomassa de mandis aprisionados em drenagem de turbina pode ser predita pela vazão da turbina (Q) e/ou pela captura por unidade de esforço (CPUE) de mandis no canal de fuga. Devido ao poder estatístico insuficiente, nossos dados foram inconclusivos se o vertimento atraiu mandis para fora do canal de fuga. Verificamos que a presença das grades reduziu significativamente a biomassa de peixes mortos/moribundos em paradas/partidas de turbinas. A biomassa de mandis aprisionada no tubo de sucção nas drenagens foi influenciada principalmente pelo Q (r² = 0.67), seguida da CPUE (r² = 0.49). Como essa biomassa foi negativamente correlacionada com Q, recomendamos que Q seja máxima antes da drenagem para reduzir a biomassa de mandis aprisionada no tubo de sucção. Acreditamos que as informações apresentadas aqui poderão ser úteis para reduzir a quantidade de peixes afetada em manobras de turbinas na UTM e outras usinas hidrelétricas.
Evaluation of techniques used to protect tailrace fishes during turbine maneuvers at Três Marias Dam, Brazil
Francisco de AndradeI; Ivo Gavião PradoI; Raquel Coelho LouresII; Alexandre Lima GodinhoI
IUniversidade Federal de Minas Gerais, Centro de Transposição de Peixes, 31270-901 Belo Horizonte, MG, Brazil. surubim@gmail.com (FA); ivogaviaoprado@gmail.com (IGP); agodinho@ufmg.br (ALG)
IICemig Geração e Transmissão, Gerência de Estudos e Manejo da Ictiofauna e Programas Especiais, Programa Peixe Vivo. Av. Barbacena 1200, 30190-131 Belo Horizonte, MG, Brazil. raquel.fontes@cemig.com.br
ABSTRACT
Turbine dewatering and stop/startup may lead to the death of tons of fish at Brazilian power dams. The Três Marias Dam (TMD) on the São Francisco River has adopted two techniques to reduce the quantity of fish, mostly mandi (Pimelodus maculatus, Pimelodidae), affected by these maneuvers. They are: (i) spill before turbine dewatering to attract fish out of the tailrace, and (ii) fish screens in the stop log slots during turbine stop/startup to prevent fish from entering the draft tube. Here, we investigated whether spill and fish screens reduced the quantity of fish affected by turbine dewatering and stop/startup at TMD. We also determined whether the biomass of mandi trapped during turbine dewatering may be predicted by turbine discharge (Q) and/or catch per unit effort (CPUE) of mandis in the tailrace. Due to insufficient statistical power, our data were inconclusive as to whether spill attracted mandi out of the tailrace. We verified that the presence of fish screens significantly reduced the biomass of dead/moribund fish during turbine stop/startup. The biomass of mandis trapped in the draft tube during turbine dewatering was mainly influenced by Q (r2 = 0.67), followed by CPUE (r2 = 0.49). Since the trapped fish biomass correlated negatively with Q, we recommend that Q be maximized before turbine dewatering to reduce quantity of mandi trapped in the draft tube. The information presented here may be useful for reducing the quantity of fish affected by turbine maneuvers at TMD, as well as other dams.
Key words: Fish kill, Fish screen, Pimelodus maculatus, Turbine dewatering, Turbine stop/startup.
RESUMO
Drenagem e parada/partida de turbina podem provocar a morte de toneladas de peixes em usinas hidrelétricas brasileiras. A usina de Três Marias (UTM), rio São Francisco, adotou duas técnicas para reduzir a quantidade de peixes, principalmente do mandi (Pimelodus maculatus, Pimelodidae), afetada durante essas manobras. Essas são: (i) vertimento antes da drenagem de turbina para atrair peixes para fora do canal de fuga, e (ii) grades nas guias das comportas ensecadeiras durante paradas/partidas para prevenir a entrada de peixes no tubo de sucção. Neste estudo, investigamos se o vertimento e as grades reduziram a quantidade de peixes afetados durante drenagem e parada/partida de turbina na UTM. Nós também determinamos se a biomassa de mandis aprisionados em drenagem de turbina pode ser predita pela vazão da turbina (Q) e/ou pela captura por unidade de esforço (CPUE) de mandis no canal de fuga. Devido ao poder estatístico insuficiente, nossos dados foram inconclusivos se o vertimento atraiu mandis para fora do canal de fuga. Verificamos que a presença das grades reduziu significativamente a biomassa de peixes mortos/moribundos em paradas/partidas de turbinas. A biomassa de mandis aprisionada no tubo de sucção nas drenagens foi influenciada principalmente pelo Q (r2 = 0.67), seguida da CPUE (r2 = 0.49). Como essa biomassa foi negativamente correlacionada com Q, recomendamos que Q seja máxima antes da drenagem para reduzir a biomassa de mandis aprisionada no tubo de sucção. Acreditamos que as informações apresentadas aqui poderão ser úteis para reduzir a quantidade de peixes afetada em manobras de turbinas na UTM e outras usinas hidrelétricas.
Introduction
During hydropower dam turbine stop/startup, fish in the tailrace have free access to the draft tube when the turbine is stopped. Turbine stop/startup kills fish at startup. After the turbine has been started up, fish with lesions caused by decompression and/or mechanical impact are commonly observed in the tailrace. In turbine dewatering, fish that enter the draft tube can become trapped after stop logs are deployed, which isolate the draft tube from the tailrace. At Três Marias Dam (TMD), up to 2.5 t of fishes have been removed from the draft tube in a single dewatering. Fish trapped in the draft tube during dewatering are at risk of death due to reduced dissolved oxygen, stress from confinement, and physical injuries caused by contact with other fish (Agostinho et al., 2007). Whenever possible, turbine dewatering and stop/startup (TDSS) should be programmed to occur during periods when there are few fish in the tailrace. However, temporal variation of fish abundance in the TMD tailrace is not yet fully understood.
Mandi, Pimelodus maculatus Lacepède 1803, is the fish species most affected by TDSS at TMD. It is widely distributed in the Paraná and São Francisco river basins (Lundberg & Littman, 2003). Mandi is a migratory species abundant in rivers and reservoirs, and reaches 45 cm in total length (Agostinho et al., 2003). Mandis account for more than 95% of all of the fish that are salvaged during turbine dewatering at TMD (personal observation). Mandi is commonly recognized as an important species in turbine maneuvers at other dams in Brazil. For example, it is the dominant fish species observed in turbine dewatering in 9 of the 16 most powerful dams built in their natural range by Cemig, the third largest Brazilian hydropower company. The wide distribution of mandi in two major river basins used in the production of hydroelectric power makes it one of the most important fish species to be impacted by the operation and maintenance of turbines in Brazilian dams.
Curimbas, Prochilodus argenteus Spix & Agassiz, 1829 and P. costatus Valenciennes, 1850, are the two most common fish species after mandi that are impacted by TDSS at TMD. Curimbas are mostly affected during turbine stop/startup. These two fish species are endemic to the São Francisco River, and are important for sport and commercial fisheries. Prochilodus argenteus is the larger of the two species, and reaches more than 15 kg, while P. costatus grows to about 6 kg (Sato & Godinho, 2003). Species of the Prochilodus genus are detritivorous and play an important role in the energy flux of their habitats (Castro & Vari, 2003). Curimbas are migratory (Godinho & Kynard, 2009; Godinho et al., 2010; Alves, 2012) and are one of the major components of "arribação", a term used to describe the upstream migration of juvenile fish from nursery grounds (Godinho & Kynard, 2009). "Arribação" fish migrate up to TMD, and aggregate in the tailrace where they remain for days because there is no upstream passage (Godinho & Kynard, 2009). As a result, the quantity of fish that are affected by TDSS at TMD increases during the "arribação" period.
Two management techniques intended to protect fish during TDSS are in use at TMD: spill and fish screens. Both techniques are meant to reduce the amount of fish that enter the draft tube. Since the early 1990s, dam operators have been opening the spillway gates for several hours, or up to a day, before deploying stop logs for turbine dewatering to attract fish from the tailrace into the spillway plunge pool area. Since 2007, fish screens have been used during turbine stop/startup. Fish screens are placed on the draft tube stop log slots to prevent fishes from entering the draft tube. To date, there are no published articles about the effectiveness of these two fish management techniques for TMD or any other dam in Brazil.
Procedures that prevent fish from becoming trapped in the draft tube during turbine dewatering are preferable to the salvage of fish. In many Brazilian dams, the labor intense salvage of trapped fish is a routine operational procedure. At TMD, the salvage of up to 500 kg of fish from the draft tube may occur with few or no deaths. However, higher fish biomass results in slower salvage, and greater risk of death. For most Brazilian dams, including TMD, the need to salvage fish trapped in the draft tube during turbine dewatering was not taken into consideration during dam design. At some newer dams, such needs have been incorporated into the projects. Hence, newer dams have systems for injecting air into the draft tube to maintain adequate dissolved oxygen levels, as well as corridors designed to facilitate the removal of fish from the power house. Despite these improvements, salvage is still the major procedure for fish trapped in the draft tube.
In this work, we evaluate whether spill and fish screens reduce the quantity of fishes affected by TDSS at TMD. For spill, we compared data on the capture of mandi in the tailrace and the spillway plunge pool area between days with and without spill. For fish screens, we analyzed the data routinely collected by TMD on dead/moribund fishes following turbine startup before and after the use of fish screens. An additional objective was to determine whether mandi biomass trapped in the draft tube during turbine dewatering could be predicted by turbine discharge (Q) and/or the abundance of mandi in the tailrace. To accomplish this objective, we collected data from nine turbine dewatering events and analyzed which independent variables influenced the mandi biomass quantity trapped in the draft tube. The information presented here may be useful for reducing the quantity of fish affected by TDSS at TMD, as well as other dams.
Material and Methods
Study area
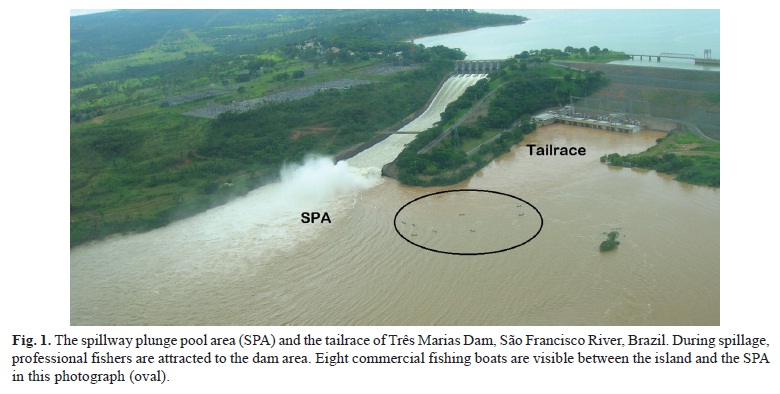
The TMD is located at the upper reaches of the São Francisco River, in the municipality of Três Marias, Minas Gerais (18°12'49"S 45°15'42"W). The dam has been operational since 1962. It has six 65-MW Kaplan turbines and a nominal head of 46.1 m. The maximum discharge per turbine is 150 m3/s. The mean water volume for the production of 1 MW is 2.3 m3/s. The dam has a controlled surface spillway for the discharge of up to 8,700 m3/s (Cemig, 2006). The spillway plunge pool area is approximately 500 m downstream from the power house (Fig. 1). Each draft tube has two 6 x 4 m exits, located as deep as 15 m. The average water velocity in the tailrace is 1.8 m/s when all turbines are discharging at maximum capacity.
Spill
We ran a paired-sample experiment with four replicates at TMD to determine whether spills attracted mandi out of the tailrace and into the spillway plunge pool area. We conducted the four replicates during March and June of 2008, and January and October of 2009. During each replicate, we sampled for mandi in the tailrace and the spillway plunge pool area one day prior to the spill. The next day, following a minimum spillage period of 10 h, we sampled for mandi once again at both sites. We defined the tailrace and the spillway plunge pool area as the first 200-m stretch downstream, respectively, from the power house and spillway. Spillway flows ranged from 90 to 470 m3/s per replicate.
We collected mandi by boat with the assistance of a professional fisherman. He used a 3.5-m radius cast net with 5.5-cm stretched mesh to capture mandi. He cast the net 30 to 50 times per day at each site. We counted the number of mandi captured per cast, and then released them back to the river. We calculated the catch per unit effort (CPUE) as the number of mandi captured divided by the number of casts. We calculated CPUE daily for each study site. Voucher specimens are located in the Ichthyological Collection of the Universidade Federal de Lavras (CIUFLA 0518).
We used paired t-test to evaluate differences in CPUE between days with and without spill for both the tailrace and the spillway plunge pool area. Before using the t-test, we verified that CPUE data distribution was normal using the Shapiro-Wilk test. We used SAS for t-tests and normality tests (SAS Institute, 1999). We determined power by using G*Power3. We set the significance level (α) at 0.05 and power at 0.80.
Fish screens
To test whether fish screens reduced the biomass of dead/moribund fishes, we compared the dead/moribund fish biomass per turbine stop/startup (FBT) before and after the use of fish screens. Turbine stops/startups before the use of fish screens took place between January of 2004 and June of 2007. Turbine stops/startups after the use of fish screens took place from July of 2007 to February of 2012. Two fish screens (6 × 4 m with a 1 × 1 cm mesh) were used, one for each draft tube exit (Fig. 2). The fish screens were placed on the stop log slots of the draft tube immediately after the turbine was stopped. The time interval from turbine stoppage to deployment of the fish screens was normally 40-90 s. The fish screens were removed few minutes before the turbines were restarted. Immediately after turbine startup, visual inspection for dead/moribund fishes was conducted on a boat by a TMD team comprising of two to three staff. The inspections, all carried out during the daytime, were conducted within 500 m downstream of the power house. All dead/moribund fish that were observed floating at the water surface during inspections were collected and weighed, but the species of floating fish were not recorded.
We were unable to normalize the distribution of FBT data for turbine stop/startup before the use of fish screens, even after using the series of transformations suggested by Sokal & Rohlf (1995). Thus, we used the non-parametric Wilcoxon two-sample test to assess differences in FBT between turbine stops/startups before and after the use of fish screens at α = 0.05. We used SAS to run these tests (SAS Institute, 1999).
Mandi biomass in turbine dewatering, Q, and CPUE
We gathered data from nine turbine dewatering events at TMD between 2007 and 2010. During each turbine dewatering event, we obtained data on the following variables: mandi biomass trapped in the draft tube (MBD), Q of the turbine to be dewatered, and mandi CPUE in the tailrace. We used the Q value that was recorded just prior to the deployment of the stop logs. Two hours before the deployment of the stop logs, we captured mandi in TMD tailrace to calculate CPUE. We used the same methods for capturing mandi and calculating CPUE as described in the previous section, except that the net was cast 20 to 50 times per turbine dewatering event. After deploying the stop logs, the water in the turbine was drained. Before all the water had been drained, the mandi trapped in the draft tube were removed, weighed, and released into the tailrace.
We used simple linear regression to analyze the relationship of MBD with Q and CPUE. We first checked data for normality (Zar, 1999) using the Shapiro-Wilk statistic (SAS Institute, 1999). The Q and CPUE data did not have a normal distribution. We used quadratic transformation and natural log transformation to normalize the Q and CPUE data, respectively. Hence, we regressed MBD on Q2 and ln(CPUE + 1). For each regression, we tested for the assumption of homoscedasticity of the errors (Zar, 1999). We used SAS for all analyses, and set α= 0.05. We did not use multiple regression to analyze the relationship among MBD, Q, and CPUE due to the small sample size (Green, 1991).
Results
Spill
At the tailrace, the CPUE during spill compared to the CPUE during no spill was greater in two replicates, equal in one, and smaller in one. At the spillway plunge pool area, the CPUE with spill was greater in three replicates and equal in one compared to the CPUE without spill. The mean CPUE ranged from 1.0 to 3.1 mandi/cast, with the standard deviations being similar to the means (Fig. 3). As a result, the coefficients of variation were between 68 and 113%. Although the mean CPUE per site was greater with spill than without spill, the difference was not significant in the tailrace (t = 0.73, P = 0.52) or in the spillway plunge pool area (t = 1.71, P = 0.19). For both tests, the power was < 0.40.
Fish screens
We evaluated data from 385 turbine stop/startup events (159 before and 226 after the use of fish screens). During turbine stops/startups before the use of fish screens, a total of 828 kg of FBT were gathered, with FBT ranging from 0 to 120 kg. During turbine stops/startups after the use of fish screens, a total of 23 kg of FBT were collected, with FBT ranging from 0 to 8 kg. FBT = 0 kg occurred in 68% of the turbine stops/startups before the use of fish screens and in 95% of the turbine stops/startups after the use of fish screens (Fig. 4). FBT was ≥ 50 kg in 2% of the turbine stops/startups before the use of fish screens. During the period before the use of fish screens, annual mean FBT was ≥ 3.7 kg for all years, except for 2005 (Fig. 5). In comparison, annual mean FBT was ≤0.2 kg for all years after the use of fish screens. There was a significant reduction in FBT with the use of fish screens (P < 0.0001).
Mandi biomass in turbine dewatering, Q, and CPUE
Over the nine turbine dewatering events studied, MBD ranged from 3 to 170 kg, Q ranged from 0 (turbine not running before dewatering) to 150 m3/s (maximum discharge), and CPUE ranged from 0.0 to 4.1 mandi/cast. There was no correlation between Q2 and ln(CPUE + 1) (r = -0.25, P = 0.52). MBD was negatively influenced by Q2, and positively correlated with the ln(CPUE + 1) of mandis in the tailrace (Fig. 6). Linear regression of MBD in relation to Q2 and ln(CPUE + 1) presented slopes that were different from zero (P ≤0.04) and showed homoscedasticity of the errors (P ≥ 0.26). The Q2 explained 67% of MBD variation while ln(CPUE + 1) explained 49% of MBD variation (Eq. 1 and 2). For Q ≤80 m3/s, MBD ranged from 68 to 170 kg (Fig. 6a). In comparison, MBD did not exceed 10 kg when Q was held at or below 129 m3/s. In Fig. 6b, Q was ≤80 m3/s for all observations above the regression line, but it was ≥ 129 m3/s for all observations below the regression line. Observations below the regression line were all associated with MBD ≤10 kg.
MBD = 124.8 - 0.006 Q2 r2 = 0.67 (Eq. 1)
MBD = 17.1 + 65.4 ln(CPUE + 1) r2 = 0.49 (Eq. 2)
Discussion
Spill
The present results were inconclusive regarding the question of whether spill reduced the abundance of mandi in the tailrace. The technique of using spill to reduce the quantity of fish trapped in the draft tube during dewatering assumes that the spillage stimulates fish in the tailrace to swim towards the spillway plunge pool area. Thus, we expected to obtain greater CPUE in the spillway plunge pool area and lower CPUE in the tailrace on the days with spill compared to the days without spill. We did not find such differences. This may have been due to the low statistical power of our experiment caused by the small number of replicates, large standard deviation, and small size effect.
Spills likely attract fish to the spillway plunge pool area and may increase (rather than decrease) the abundance of mandi in the tailrace as well. Professional fishers were frequently observed near the spillway plunge pool area during spills (Fig. 1), suggesting that the spill procedure attracts fish.
Direct evidence of increased abundance of mandi in the tailrace due to spill was obtained during a turbine dewatering attempt. On the day prior to turbine dewatering, before a spill, we obtained a CPUE of 0.5 mandi/cast in the tailrace. Spill started at night. On the following day, while the spill was ongoing, a subsequent sample of mandi in the tailrace resulted in CPUE of 4.5 mandi/cast. One hour after the spillage was closed, divers performing an underwater inspection reported the presence of a large school of mandi near the entrance to the turbine that was to be dewatered. There was also a mandi school at the surface of the tailrace, which is uncharacteristic for mandi because it is a benthic fish. We believe that when the spillway was being closed, the mandi that were in the spillway plunge pool area moved to the tailrace as a result of being attracted by the turbine flow, which further increased the density of mandi in the tailrace. Hence, conducting TDSS in the presence of such abundance of mandi is potentially hazardous to the fish. Therefore, we recommend that spill not be used during turbine dewatering at TMD until the influence of spill on mandi abundance in the tailrace has been determined.
Fish screens
We concluded that fish screens are an efficient technique for reducing fish death at TMD during turbine stop/startup. This conclusion is supported by our results showing that when fish screens were used in turbine stop/startup there was a significant reduction in FBT, greater proportion of turbine stop/startup with zero FBT, and FBT did not exceed 10 kg.
The reduction of FBT during turbine stop/startup can be attributed to the use of fish screens, not to a lesser fish abundance in the tailrace. To minimize the influence of fish abundance in the tailrace on FBT, a systematic sampling design (i.e., a turbine stop/startup with fish screens followed by one without fish screens succeeded by one with fish screens, and so forth) should be used because it would have, according to Hurlbert (1984), lower bias than the simple temporal segregation method (i.e., before fish screens versus after fish screens) that was used by TMD staff. However, the dam owner's environmental policy of minimum fish death would not allow the use of a systematic sampling method. Another way to test the influence of fish abundance in the tailrace on FBT would be to compare CPUE values before versus after using fish screens. Routine samples for CPUE in the tailrace only started in early 2007; hence, data were not available for such comparison. Therefore, we had to rely on circumstantial evidence to conclude that fish abundance in the tailrace was not responsible for lower FBT during turbine stop/startup after the use of fish screens.
Three circumstantial lines of evidence support the latter conclusion. First, the strongest circumstantial evidence was provided by differential values of FBT when fish abundance peaked in TMD tailrace. During the study period, there were two periods of noticeable high fish abundance in TMD tailrace, which were both due to arribação fish. The first period occurred during early 2007 (Rodrigues, 2009), while the second period was during late 2011early 2012 (personal observation). Fish abundance in TMD tailrace was much higher during the first period, when fish screens were not used. As a result, the mean annual FBT was the highest for the whole study period. During the second period of high fish abundance in TMD tailrace, when fish screens were used, all FBT were zero, except one that was 0.5 kg.
Second, during the second period of high fish abundance in TMD tailrace, one turbine stop/startup event resulted in FBT = 42 kg (data not used in our analysis). This high FBT occurred because the fish screens were damaged during the turbine maneuver, and fishes were able to enter the draft tube. Third, the large frequency of zero FBT during late 2011early 2012, despite high fish abundance, contrasts with frequent FBT > 10 kg, which occurred during 2004 and 2006, when no noticeable aggregation of fishes occurred in TMD tailrace.
We recommend that fish screens not be deployed for long periods of time to allow fish that eventually manage to enter the draft tube during fish screen deployment to return to the tailrace. Fish trapped in the draft tube for extended periods of time are at risk of dying. In May of 2012 in TMD, 1,780 kg of fish were found dead in the draft tube; this high mortality can be attributed to fish screens being deployed for 90 days. All turbine stop/startup events analyzed in this study lasted less than 12 days and no fish deaths were recorded owing to this confinement time. Therefore, we recommend that fish screen deployment not exceed 12 days. We also recommend that periodic inspections of the fish screen structure be conducted to prevent fish from accessing the draft tube via a fish screen rupture.
To the TMD owner, the absence of turbine stop/startup with FBT > 10 kg was one of the major benefits of using fish screens. High values of FBT may negatively affect the power company through fines from governmental agencies, degradation of public image in the local community and among investors, dam retrofitting, and changes in operational and maintenance procedures. Such negative effects may cost millions of dollars to the power company. Thus, we recommend that the operational and maintenance sections of dams with high FBT should work closely with fisheries biologists, because fisheries research may help minimize the loss of revenue.
In many parts of the world, various types of fish barriers have been utilized at dams to protect migratory fish. The goal of these barriers is to prevent reservoir forebay fish from entering the turbines through the water intake (Odeh & Orvis, 1998). Passage through turbines by reservoir forebay fish in Brazilian dams has been poorly documented (Godinho & Kynard, 2009). While this phenomenon occurs, its extent remains unknown. In Brazil, acute fish kills during TDSS are more evident. Nonetheless, the use of fish screens to minimize fish kills during turbine stop/startup remains poorly implemented in Brazilian dams. As far as we know, this technique is in use at Funil Dam along Grande River and Retiro Baixo Dam along Paraopeba River, as well as at TMD. We hope that the results of using fish screens at TMD will lead to greater use at other dams.
At TMD, fish screens were first installed for manual operation. The fish screens were not used at night or during weekends due to operational limitations. Automatic operation of the fish screens will start in 2012. They will be deployed at any time, independent of an operator. We recommended that their deployment time should be less than that used with the manual fish screens. Fish screens may thereby more effectively prevent fish from entering the draft tube.
We have no data on the effectiveness of our FBT sampling method. It is likely that not all dead/moribund fish were collected as only those that floated at the water surface along a 500-m river stretch were collected. Any dead/moribund fish that did not float in that stretch were not collected.
Mandi biomass in turbine dewatering, Q, and CPUE
Predicting the quantity of fish that may become trapped in the draft tube during turbine dewatering provides information for fish salvage preparation and for reducing the risk of fish death. This risk increases as the quantity of trapped fish increases. Fish die in such conditions due to physical injury, decreased dissolved oxygen, and cumulative sublethal stressors, such as CO2, ammonia, total suspended solids, and total dissolved solids (Portz et al., 2006). However, the direct determination of the quantity of fish trapped in the draft tube is only possible when the draft tube access door is opened, after most water has already been drained. An indirect estimation of that quantity of fish may be obtained by monitoring the level of dissolved oxygen in the draft tube water.
To reduce MBD at TMD, the turbine should be at maximum Q prior to stopping and stop log deployment, whenever possible. This recommendation may also be valid for other Brazilian dams as well. The simple linear regression analysis developed in this study shows that MBD was mainly influenced by Q, followed by the CPUE. The CPUE provides an estimate of mandi abundance in the tailrace with the potential to enter the draft tube. The strong influence of Q on MBD indicates that the turbine may be operated to reduce the entrance of mandi into the draft tube prior to deploying stop logs for turbine dewatering. Greater Q is associated with greater water velocity and turbulence in the draft tube. It is likely these two variables, rather than Q itself, that are the factors that directly impede mandis from entering the draft tube.
An alternative hypothesis, other than simple linear regression, also explains the relationship between MBD and Q. We called it the Q threshold hypothesis. This hypothesis indicates that large MBD during turbine dewatering only occurs when Q is below a threshold. If the Q threshold exists, it is in the 81 to 128 m3/s range. These Q values correspond to a turbine load (a more practical dam operational variable than Q) that ranges from 39 to 54 MW/h. The Q threshold hypothesis may explain the reason for high MBD (≥ 68 kg) only occurring for low Q (≤80 m3/s), and why all MBD was low (≤10 kg) for high Q (≥ 129 m3/s). We need data on MBD for Q ranges of 81 to 128 m3/s to determine which hypothesis (simple linear regression or Q threshold) better explains the relationship between MBD and Q.
Regardless of which hypothesis is used to explain the relationship between MBD and Q, both predict that, even for high CPUE, MBD will be low for high Q. All of the data that we gathered on MBD for high Q had low CPUE. Therefore, additional carefully gathered data are needed to confirm this prediction. If the prediction of low MDB, even for high CPUE, does not take place, large MBD will require the cancelation of turbine dewatering to avoid undesirable amount of dead mandi.
The Q threshold hypothesis may also be used to explain the relationship between MBD and CPUE. CPUE influenced MBD for low Q, but did not affect MBD for high Q. This result is expected if large MBD only occurs when Q is below the threshold. Therefore, if the Q threshold hypothesis is the most appropriate for explaining the relationship between MBD and Q, then using CPUE to predict MBD is only valid for Q below the threshold. In this situation, a regression of MBD on CPUE may be the most appropriate tool for predicting MBD when Q is below threshold.
Acknowledgments
We would like to thank the fisher Waldir Alves dos Santos, the environmental analyst Renato Junio Constâncio, the biologist Rafael Tolomelli, and the engineer Ricardo Junho. We also thank the Três Marias Dam operational and maintenance team for their assistance in data collection. We would also like to thank the Peixe Vivo Program of CEMIG for providing financial support.
Literature Cited
Submitted March 12, 2012
Accepted September 10, 2012
- Agostinho, A. A., L. C. Gomes & F. M. Pelicice. 2007. Ecologia e Manejo de Recursos Pesqueiros em Reservatórios do Brasil. Maringá, Eduem, 501p.
- Agostinho, A. A., L. C. Gomes, H. I. Suzuki, H. F. Júlio JR. 2003. Migratory fish of the upper Paraná River Basin, Brazil. Pp. 19-98. In: Carolsfeld, J., B. Harvey, A. Baer., C. Ross. (Eds.). Migratory Fishes of South America: biology, social importance and conservation status. Victoria, World Fisheries Trust, 372p.
- Alves, C. B. M. 2012. A ictiofauna e a escada experimental para peixes do rio Paraopeba - UTE Igarapé, bacia do rio São Francisco (Minas Gerais). Pp. 59-81. In: Lopes, J. M, F.E. Silva (Orgs.). Transposição de Peixes. Belo Horizonte, Cemig, 173p.
- Castro, R. M. C. & R. P. Vari. 2003. Prochilodontidae (Flannel mouth characiforms). Pp. 65-70. In: Reis, R. E., S. O. Kullander & C. J. Ferraris (Eds.). Check List of the Freshwater Fishes of South and Central America. Porto Alegre, Edipucrs, 729p.
- Cemig. 2006. Usinas da Cemig: 1952-2005, a história da eletricidade em Minas e no Brasil. Centro da Memória da Eletricidade no Brasil, Rio de Janeiro, 304p.
- Godinho, A. L. & B. Kynard. 2009. Migratory fishes of Brazil: life history and fish passage needs. River Research and Applications, 25: 702-712.
- Godinho, A.L., B. Kynard & H.P. Godinho 2010. Life in a Brazilian Floodplain River: migration, spawning, and management of São Francisco River fishes. Saarbrücken, LAP Lambert Academic Publishing, 106p.
- Green, S. B. 1991. How many subjects does it take to do a regression analysis? Multivariate Behavioral Research, 26: 499-510.
- Hurlbert, S. H. 1984. Pseudoreplication and the design of ecological field experiments. Ecological Monographs, 54: 187-211.
- Loures, R. C. F. 2009. A compatibilização da operação de usinas com a ictiofauna. Ação Ambiental, 41: 24-28.
- Lundberg, J. G. & M. W. Littmann. 2003. Family Pimelodidae (long-whiskered catfishes). Pp. 432-446. In: Reis, R. E., S. O. Kullander & C. J. Ferraris (Eds.). Check List of the Freshwater Fishes of South and Central America. Porto Alegre, Edipucrs, 729p.
- Odeh, M. & C. Orvis. 1998. Downstream fish passage design considerations and developments at hydroelectric projects in the North-east USA. Pp. 267-280. In: M. Jungwirth, S. Schmutz. & S. Weiss. (Eds.) Fish Migration and Fish Bypasses. Fishing News Books, Oxford, 438p.
- Portz, D. E., C. M. Woodley, J. J. Cech Jr. 2006. Stress-associated impacts of short-term holding on fishes. Reviews in Fish Biology and Fisheries, 16: 125-170.
- Rodrigues, R. R. 2009. Sucesso reprodutivo de peixes migradores em rios barrados em Minas Gerais: influência da bacia de drenagem e das cheias. Unpublished MSc. Thesis, Universidade Federal de Minas Gerais, Belo Horizonte, 56p.
- SAS Institute. 1999. SAS OnlineDoc, version eight. Cary, SAS Institute Inc.
- Sato Y. & H. P. Godinho. 2003. Migratory fish of the São Francisco River Basin. Pp. 195-232. In: Carolsfeld, J., B. Harvey, A. Baer., C. Ross. (Eds.). Migratory Fishes of South America: biology, social importance and conservation status. Victoria, World Fisheries Trust, 372p.
- Sokal, R. R. & F. J. Rohlf. 1995. Biometry. 3rd edition. New York, W. H. Freeman and Company, 887p.
- Zar, J. H. 1999. Biostatistical Analysis. 4th ed. Upper Saddle River, Prentice Hall, 663p.
Publication Dates
-
Publication in this collection
31 Oct 2012 -
Date of issue
Oct 2012
History
-
Received
12 Mar 2012 -
Accepted
10 Sept 2012