 Construction of SNP-based KASP fingerprints and population genetic analysis of 40 core mung bean germplasm resources
Abstract
The objective of this work was to construct a DNA fingerprinting database of 40 core mung bean (Vigna radiata) germplasm using the single nucleotide polymorphism (SNP)-based kompetitive allele specific PCR (KASP) markers identified by genotyping-by-sequencing. After a rigorous filtering, 2,987,425 high-quality SNPs with a high ratio of transitions to transversions (1.97) were obtained, which were mainly synonymous or nonsynonymous single-nucleotide variants, located in intergenic regions and 1.0-kb regions upstream of the transcriptional start sites. The principal component analysis, population structural analysis, and genetic evolutionary tree analysis indicated that the 40 evaluated germplasms were best classified into three groups, which, however, were inconsistent with their geographical origins, indicating that the genetic backgrounds of these germplasms are complex and diverse. Through stringent selection criteria, 25,611 of these high-quality SNPs were successfully converted into KASP markers. The mean values of polymorphism information content, minor allele frequency, and heterozygosity of these KASP markers were 0.366, 0.421, and 0.04, respectively. Finally, 50 core KASP markers were filtered out, and eight of these were verified as able to effectively construct the genetic fingerprints of the 40 core mung bean germplasms.
Index terms:
Vigna radiata
; DNA fingerprinting; genetic diversity; genotyping-by-sequencing; germplasm identification
Resumo
O objetivo deste trabalho foi construir um banco de dados de impressões digitais de DNA de 40 germoplasmas nucleares de feijão-mungo (Vigna radiata), tendo-se utilizado os marcadores de PCR competitiva alelo-específica (KASP), baseada em polimorfismos de nucleotídeo único (SNPs), identificados por genotipagem por sequenciamento. Após filtragem rigorosa, foram obtidos 2.987.425 SNPs de alta qualidade, com uma alta proporção de transições para transversões (1,97), principalmente variantes de nucleotídeo único (SNVs) sinônimas ou não sinônimas, localizadas em regiões intergênicas e em regiões de 1,0 kb acima do sítio de início da transcrição. A análise de componentes principais, a análise estrutural da população e a análise da árvore evolutiva genética indicaram que os 40 germoplasmas avaliados foram mais bem classificados em três grupos, que, no entanto, foram inconsistentes com suas origens geográficas, o que indica que os antecedentes genéticos desses germoplasmas são complexos e diversos. Por meio de critérios de seleção rigorosos, 25.611 desses SNPs de alta qualidade foram convertidos com sucesso em marcadores KASP. Os valores médios do conteúdo de informação de polimorfismo, da frequência do alelo menor e da heterozigosidade desses marcadores KASP foram 0,366, 0,421 e 0,04, respectivamente. Por fim, 50 marcadores KASP nucleares foram filtrados, e oito destes foram verificados como capazes de construir efetivamente impressões genéticas digitais dos 40 germoplasmas nucleares de feijão-mungo.
Termos para indexação:
Vigna radiata
; impressão genética digital; diversidade genética; genotipagem por sequenciamento; identificação de germoplasma
Introduction
Mung bean (Vigna radiata L.) has become a widely cultivated legume crop species mainly in Asia because of its short growth period, long sowing period, strong stress resistance, symbiotic nitrogen fixation, and soil improvement ability (Chen et al., 2020; Mwangi et al., 2021).
Molecular markers have been widely used in genetic diversity, kinship, and fingerprinting studies of crop varieties or lines, at different growth and development stages, providing a great convenience for genetic breeding (Li et al., 2023; Huang et al., 2024; Wang et al., 2024). Single nucleotide polymorphisms are recognized as the most mainstream third-generation molecular markers, which are widely used for crop variety identification and map construction because of their wide quantitative distribution, high polymorphisms, and good stability (Kumar et al., 2020; Hsu et al., 2022; Dube et al., 2023). Until present, some high-throughput and low-cost SNP genotyping platforms have been developed, such as the GoldenGate and Infinium platforms, TaqMan by Life Technologies, and Kompetitive Allele Specific PCR (KASP) system (Xing et al., 2024). As a new type of high-throughput SNP genotyping technology, KASP displayed various advantages of high accuracy and site adaptability, relatively low cost, and suitable for high-throughput detection of a large number of samples. KASP genotyping has a variety of applications in genetic diversity and germplasm genotyping analysis for crops (Xing et al., 2024; Liu et al., 2025; Shen et al., 2025).
The construction of DNA fingerprints based on SNP marker technology is important for ensuring varietal specificity and utility for varieties or species authenticity issues. Over the past two decades, breeders have analyzed the genetic diversity of mung bean separately, using RAPDs, SSRs, and SNPs, which have constructed core germplasm resources to lay the foundation for the genetic breeding of mung bean (Zhao et al., 2020). Recently, the SNP markers discovered by genotyping-by-sequencing (GBS) have been successfully used to identify genetic relationships, construct fingerprint databases and genetic maps, isolate and clone diverse genes of Triticum aestivum, Cymbidium ensifolium, Populus deltoides, Glycine max, and other species (Jia et al., 2024; Liu et al., 2025; Sharma & Singh, 2025; Shen et al., 2025). However, thus far, no SNP-based KASP fingerprint database for larger mung bean germplasms, mainly from China, has been reported.
The objective of this work was to construct a DNA fingerprinting database of 40 core mung bean germplasms, using the SNP-based KASP markers produced by genotyping-by-sequencing.
Materials and Methods
Forty core mung bean gemplasms with diversified phenotypic traits were provided by Nanyang Normal University, Nanyang City, Henan Province (Table 1). For each germplasm, three vigorous seedlings were randomly selected, and a total of 5.0 g young leaf samples were immediately frozen, using liquid nitrogen, and stored at -80°C for DNA extraction.
Geographical origins and morphological characteristics of 40 core mung bean (Vigna radiata) germplasms.
The genomic DNA extraction was performed using the FlaPure Plant DNA Extraction Kit (RE711-50, Genesand Biotech Co., Beijing, China), and the quality and concentration of DNA were determined using a NanoDrop2000 UVspectrophotometer (Thermo Fisher, Massachusetts, USA). The ultrasonic DNA fragments were purified and end-repaired, a single “A” nucleotide was added to the 3’ ends of the blunt fragments, then the sequencing adapters were ligated to the A-tailed fragments. Libraries were pooled, size-selected (200 ~ 500 bp) in a 1% agarose gel electrophoresis, column-purified using a PCR purification kit, and amplified for 12 cycles using Phusion DNA polymerase (NEB, Ipswich, MA, USA). The average fragment size was estimated in a Bioanalyzer 2100 (Agilent, Santa Clara, CA, USA), using a DNA1000 chip followed by a second column purification, and library quantification was performed using PicoGreen (Invitrogen, Carlsbad, CA, USA).
Sample sequencing was performed using the Illumina NovaSeq 6000 PE150 platform (Illumina, San Diego, CA, USA), and the quality control of original sequencing reads was performed using fastqc (Li et al., 2024). Clean reads were obtained by using fastp (-q5 -n5) to remove reads with an unknown base number N < 5, a length of bases < 50%, quality value < 5, connector sequences, and other low-quality sequences. BWA-MEM software (-M -R) (Li & Durbin, 2009) compared clean reads to Vrad_JL7 genome (Liu et al., 2022). Insert size, coverage depth, and variation of each sample were counted and detected by comparing these clean read positions to Vrad_JL7 genome (Liu et al., 2022). The generated same files were converted to bam format using Samtools v1.9 (Li et al., 2009). The duplicate tags were detected using MarkDuplicates from Picard (2025), the high-quality reads were retained for subsequent analysis.
The GATK HaplotypeCaller (2025) was used to call original SNPs and InDels; SNPs were further separated using SelectVariants (2025). SNPs without other variant loci at 50 bp before and after were filtered by python scripts, then the bi-allelic SNPs were filtered using the VariantFiltration (2025) with the average sequencing depth ≥5×, Q≥ 30, minor information integrity ≥ 0.90, MAF≥ 0.05, QD< 2.0, MQ< 40.0, FS> 60.0, SOR> 6.0, MQRankSum < -12.5, and ReadPosRankSum < -8.0. The genome and structure annotation files were used to annotate the variable loci using SnpEff software (eff mode) (Pariasca-Tanaka et al., 2015).
PCA was assessed using SMARTPCA program (– make grm – autosome) implemented in EIGENSOFT software (Gong et al., 2016). The maximum likelihood (ML) tree of 40 mung bean germplasms was constructed using FastTree software (Price et al., 2010). Admixture software was used to analyze the population genetic structure (Jaganathan et al., 2015).
For KASP marker design, upstream and downstream 100 bp sequences of candidate SNPs were aligned to Vrad_JL7 genome for removing non-specific sequences; these unique sequences were selected with the polymorphism information content (PIC) value > 0.35. For each KASP target site, one universal primer and two allele-specific primers were designed as follows: GC content < 60%, 55°C ≤ Tm ≤ 62°C, and PCR product size ≤ 120 bp. Based on the PIC value and distribution frequency, core markers with a high-detection rate and significant polymorphism amounts which could distinguish all germplasms were screened out. For fingerprinting, the optimal combination of markers was calculated using SNPT software (2025). The genotypes of the optimal combination of markers were heatmapped using RStudio (2025). Each row of the heatmap represents one SNP locus, and each column represents one sample where pure genotypes are A/A = green, C/C = yellow, G/G = purple, T/T = blue; heterozygous genotypes are grey; and the no call genotypes are NA = white.
Results and Discussion
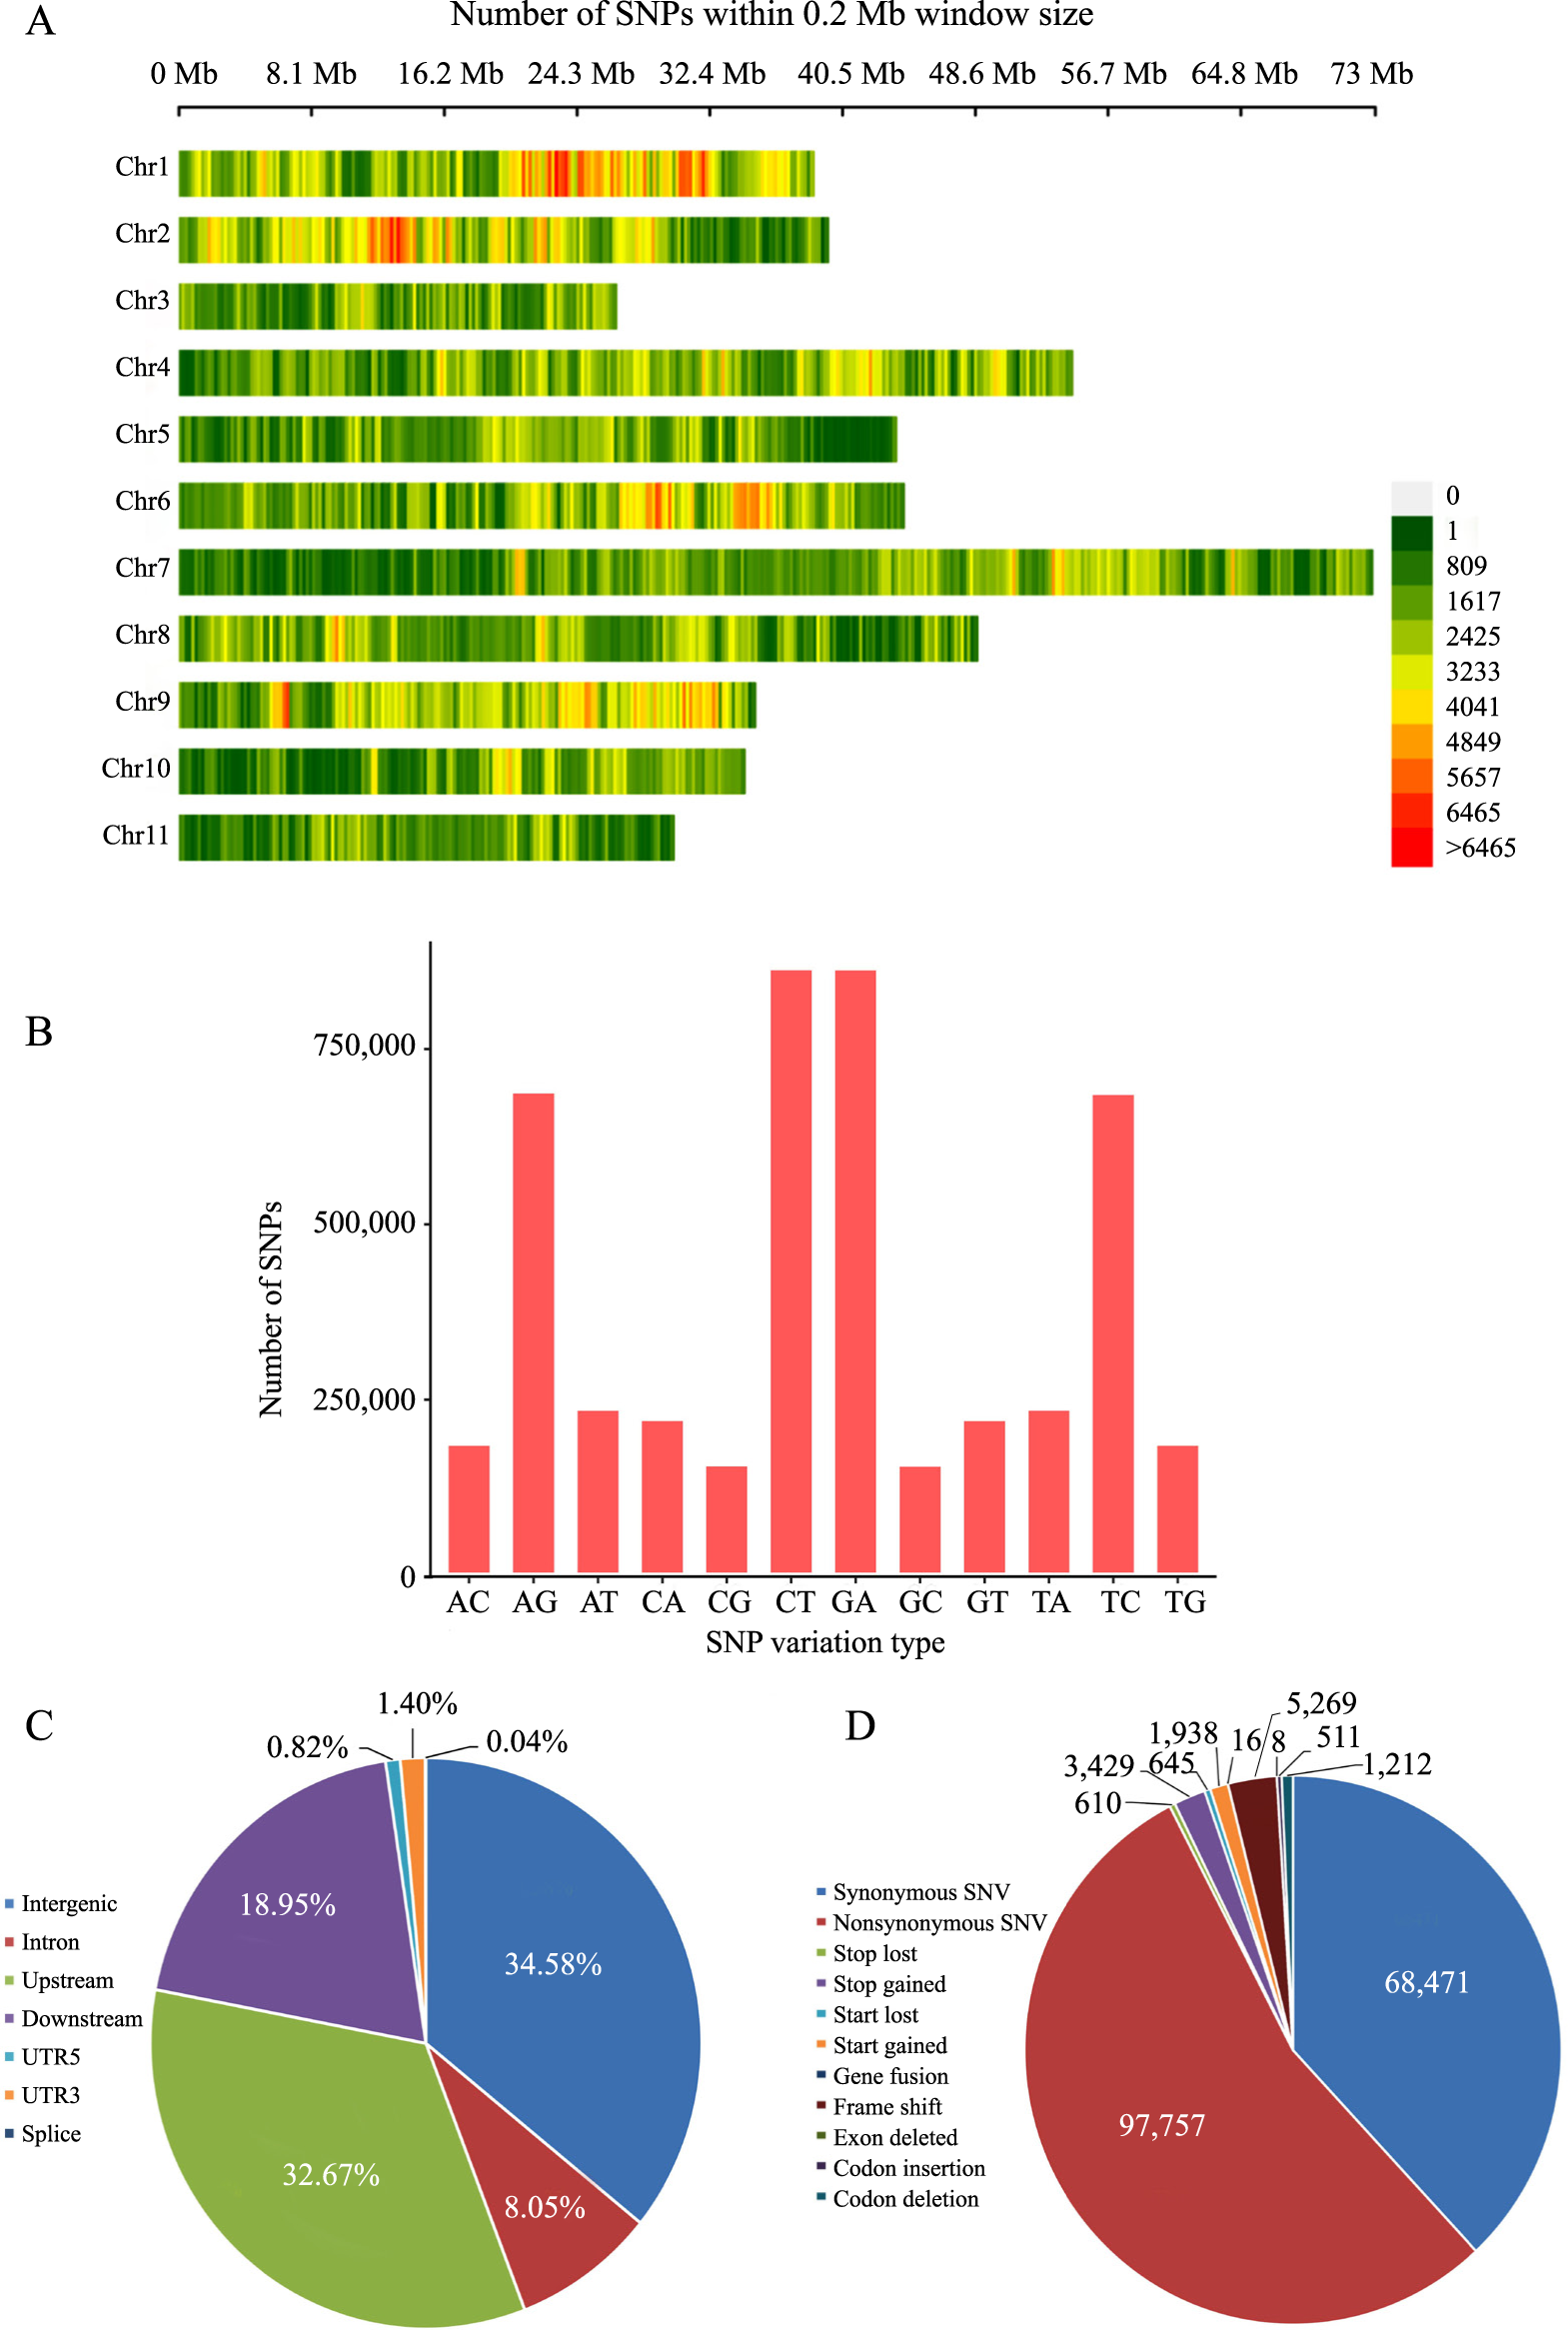
Genome sequencing of 40 core mung bean germplasms (Table 1) yielded 298.94 Gb of clean data, with an average sequencing depth of 16 ×, and Q30 reached more than 95.09% per sample (Table 2). The obtained clean reads were mapped to Vrad_JL7 genome, and the average mapping efficiency reached 99.50% (Table 3). Among 40 core germplasms, a total of 2,987,425 SNP variants were detected and asymmetrically distributed on 11 chromosomes (Figure 1 A). In particular, C/T (18.465%), G/A (18.462%), A/G (14.697%), and T/C (14.653%) transitions were the dominant types, followed by the transversions of T/A (4.993%), A/T (4.990%), C/A (4.672%), G/T (4.670%), T/G (3.919%), A/C (3.917%), C/G (3.287%), and G/C (3.276%) (Figure 1 B). The resulting transition/transversion ratio of 1.97 was higher than those obtained in previous studies on cigar tobacco, cauliflower, and radish, indicating a higher genomic stability of mung bean (Wang et al., 2021; Yang et al., 2022; Xing et al., 2024).

Analysis of SNPs in 40 mung bean (Vigna radiata) genomes. A, SNP density distribution on each chromosome, for which the horizontal axis represents the chromosome length, and the vertical axis represents the chromosome number; and different colors represent the number of SNPs in different regions. B, Statistics of the variant SNP types, in which the horizontal axis represents the different types of SNP mutations, and the vertical axis represents the number of mutations. C, The positions of the SNPs in the gene structures. D, Annotations of the SNPs in the exons.
For the distribution of SNPs, 34.58% were located in intergenic regions, from which 3.36% were located in exons, 8.05% were located in introns, 32.67% were located in 1-kb region upstream of transcriptional start site, 18.95% were located in 1-kb region downstream of transcription termination site, 0.82% and 1.40% were located in 5′ and 3′ UTRs, and 0.04% were located in splice junctions (Figure 1 C). Functional annotation of SNPs in the exonic regions showed that 97,757 nonsynonymous SNVs were predicted to cause changes in encoded amino acid, and 68,471 synonymous SNVs were predicted to not change amino acid sequences (Figure 1 D). The ratio of nonsynonymous SNVs to synonymous SNVs was 1.43. In addition, 3,429 SNPs were predicted to leading the early gain of a stop codon (stop gain), and 610 SNPs leading to the loss of the stop codon (stop loss), which was significantly higher than these same SNPs contained in sugarcane and cigar tobacco (Wang et al., 2021; Zhang et al., 2022).
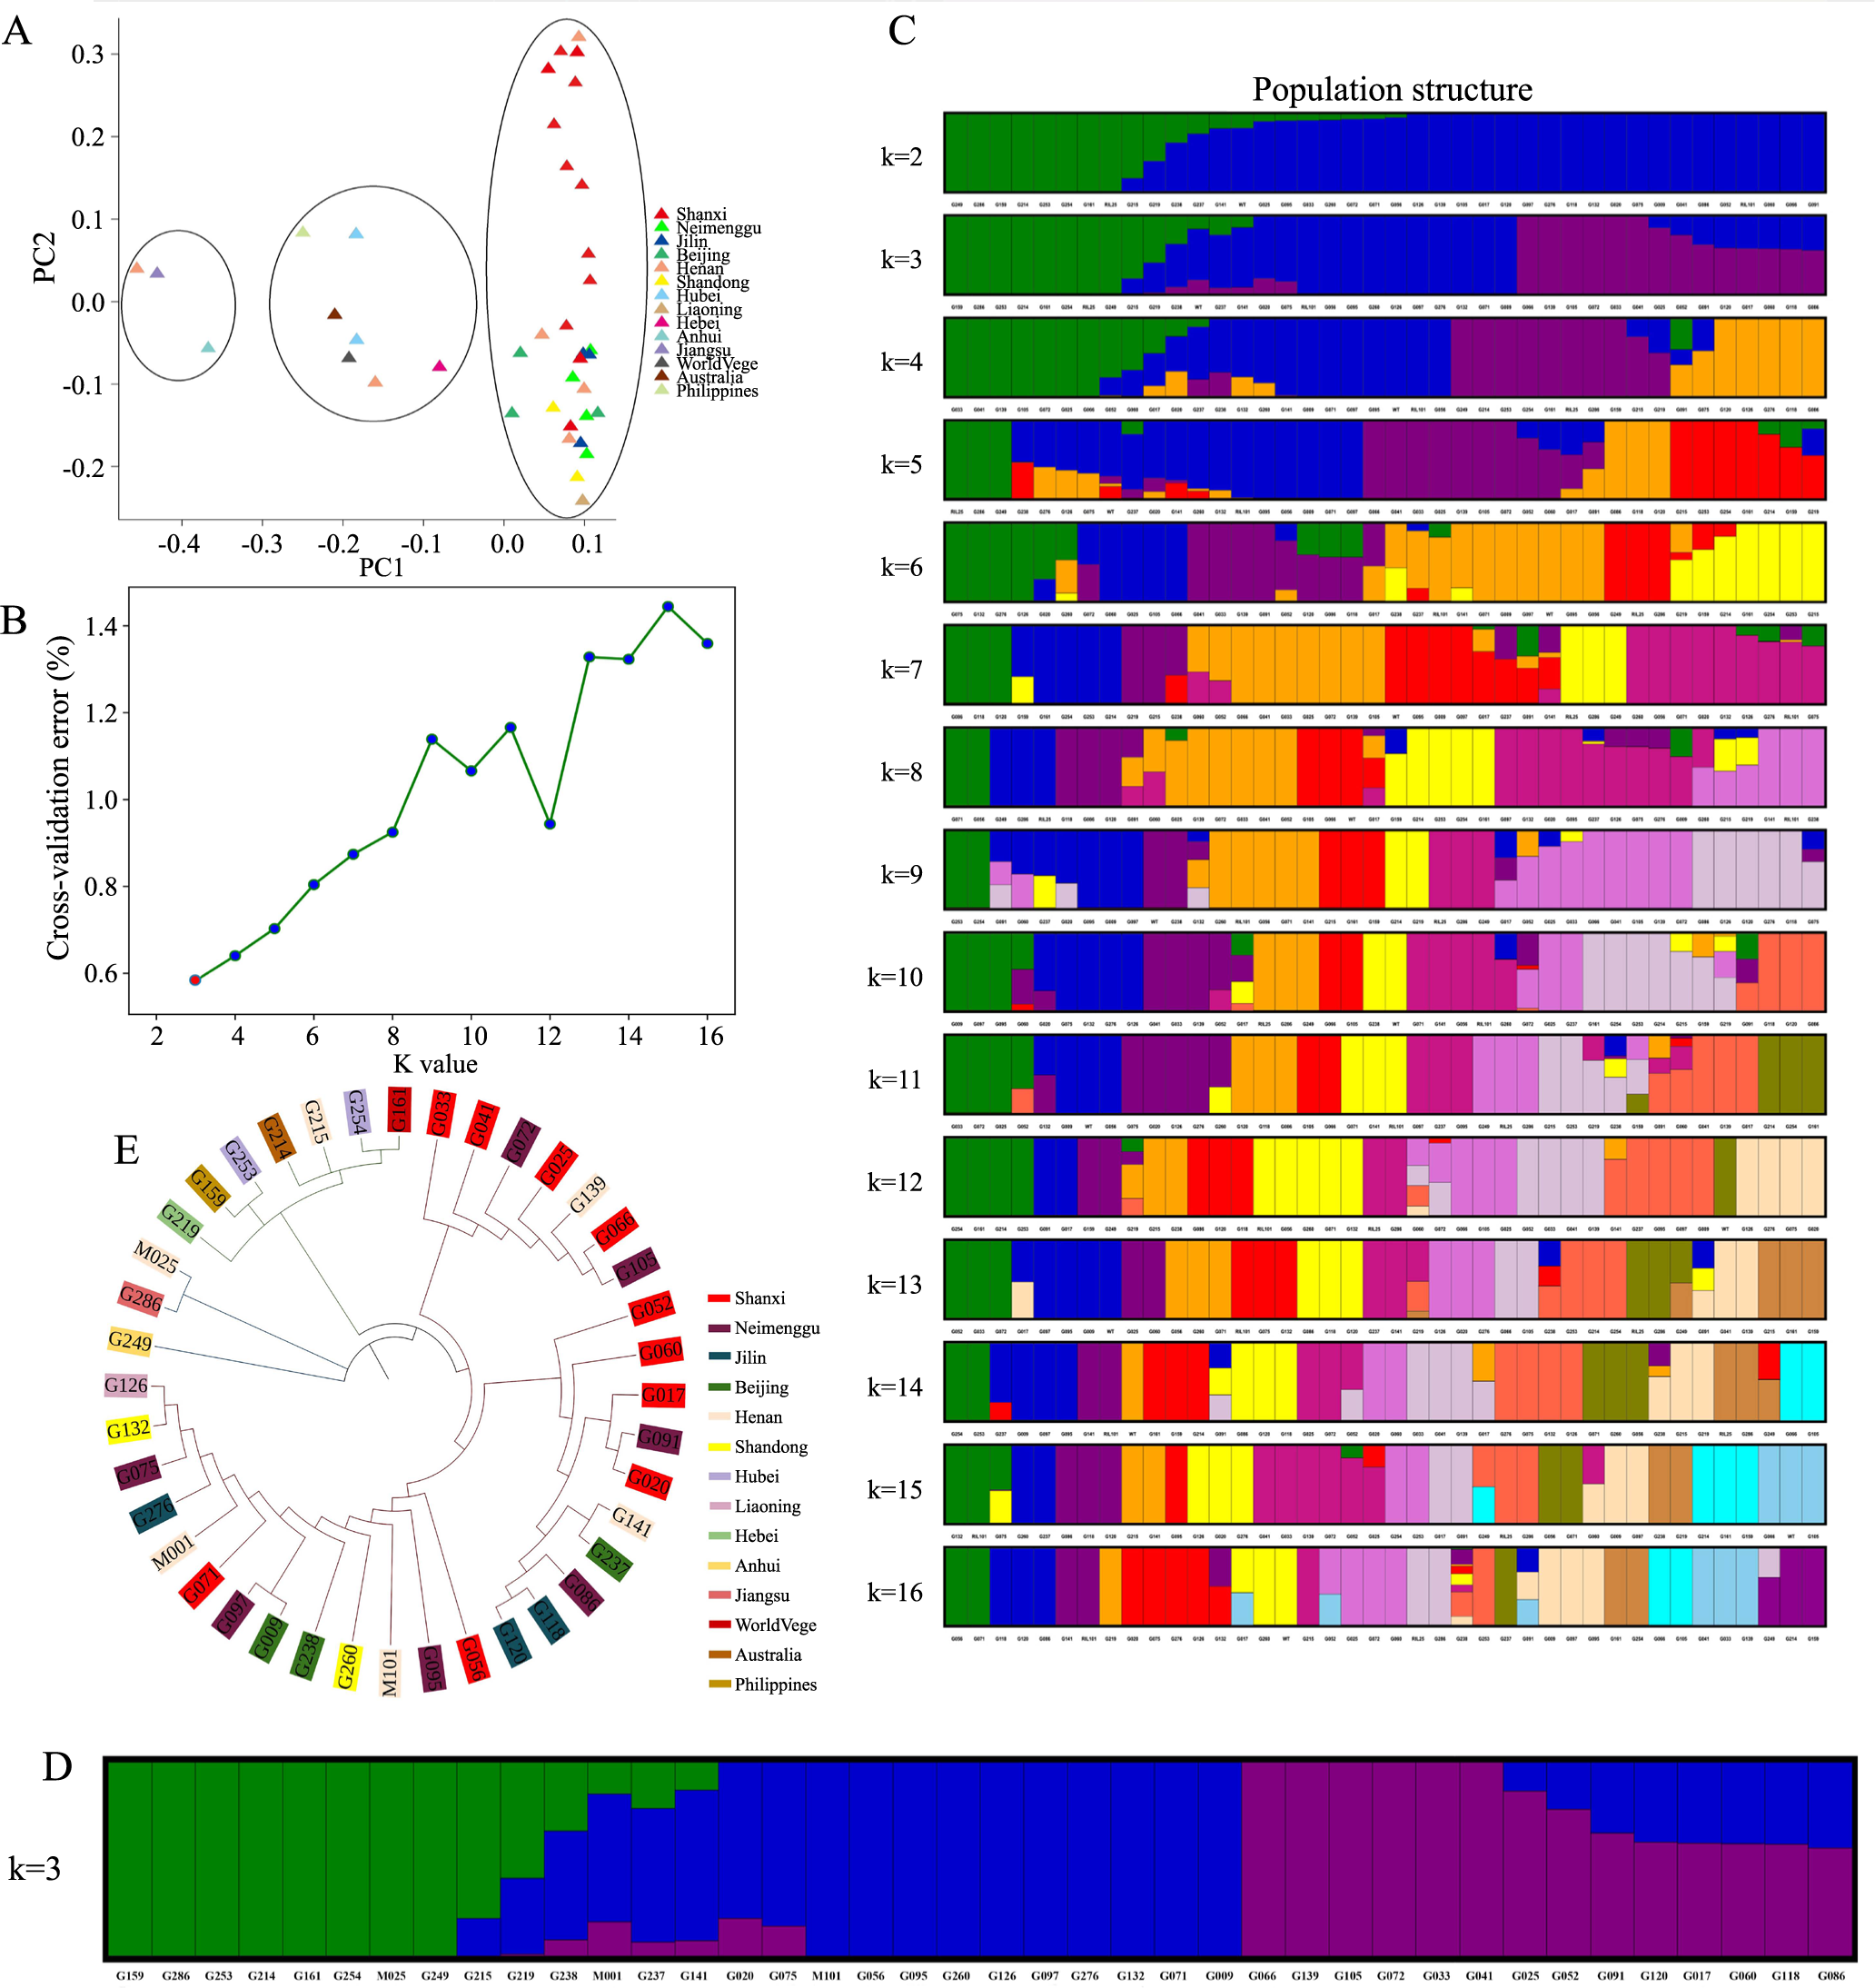
A two-dimensional PCA showed that 40 mung bean germplasms were divided into three well-separated groups, while each group contained germplasms from different geographical origins (Figure 2 A). The population structure analysis of these 40 germplasms showed that the lowest cross-validation error rate is K = 3; three obtained groups haven’t been completely classified according to their geographical origins (Figure 2 B-D). A maximum likelihood tree showed that 40 germplasms were also clustered into three groups with a high bootstrap value, which were not also completely classified by their geographical origins (Figure 2 E). These clustering results of PCA, population structure analysis, and phylogenetic tree were basically consistent and complemented one another, all of them indicating that the genetic background of these 40 germplasms were complex and diverse. Meanwhile, similar results were also observed by Lavanya et al. (2008), who report that 54 mung bean accessions were divided into two major groups and four subgroups, using random amplified polymorphic DNA (RAPD) markers, which also did not show any significant correlation between their genetic divergence and geographical distribution. The diversity evaluation differentiated mung bean accessions between cultivated (157) and wild (1) forms into nine subgroups, which also showed that no geographical distinctions existed among mung bean accessions collected in China (Chen et al., 2015). According to these morphological diversity analysis, the stem color was the most stable while the 100-seed weight was the most variable trait among these 40 core germplasms. These observed morphological characteristics did not rhyme with the genetic clustering or geographical origins of 40 core germplasms, which may be due to the complex genetic backgrounds and smaller environmental selection of 40 germplasms.

Phylogenetic and population genetic analysis of 40 core mung bean (Vigna radiata) germplasms based on polymorphic SNP loci. A, a two-dimensional diagram of PCA. B, Cross-validation error rates corresponding to different K values. C, Population structure of 40 core mung bean germplasms at different K values. D, Population structure of 40 core mung bean germplasms at K = 3. E) An unrooted maximum likelihood phylogenetic tree.
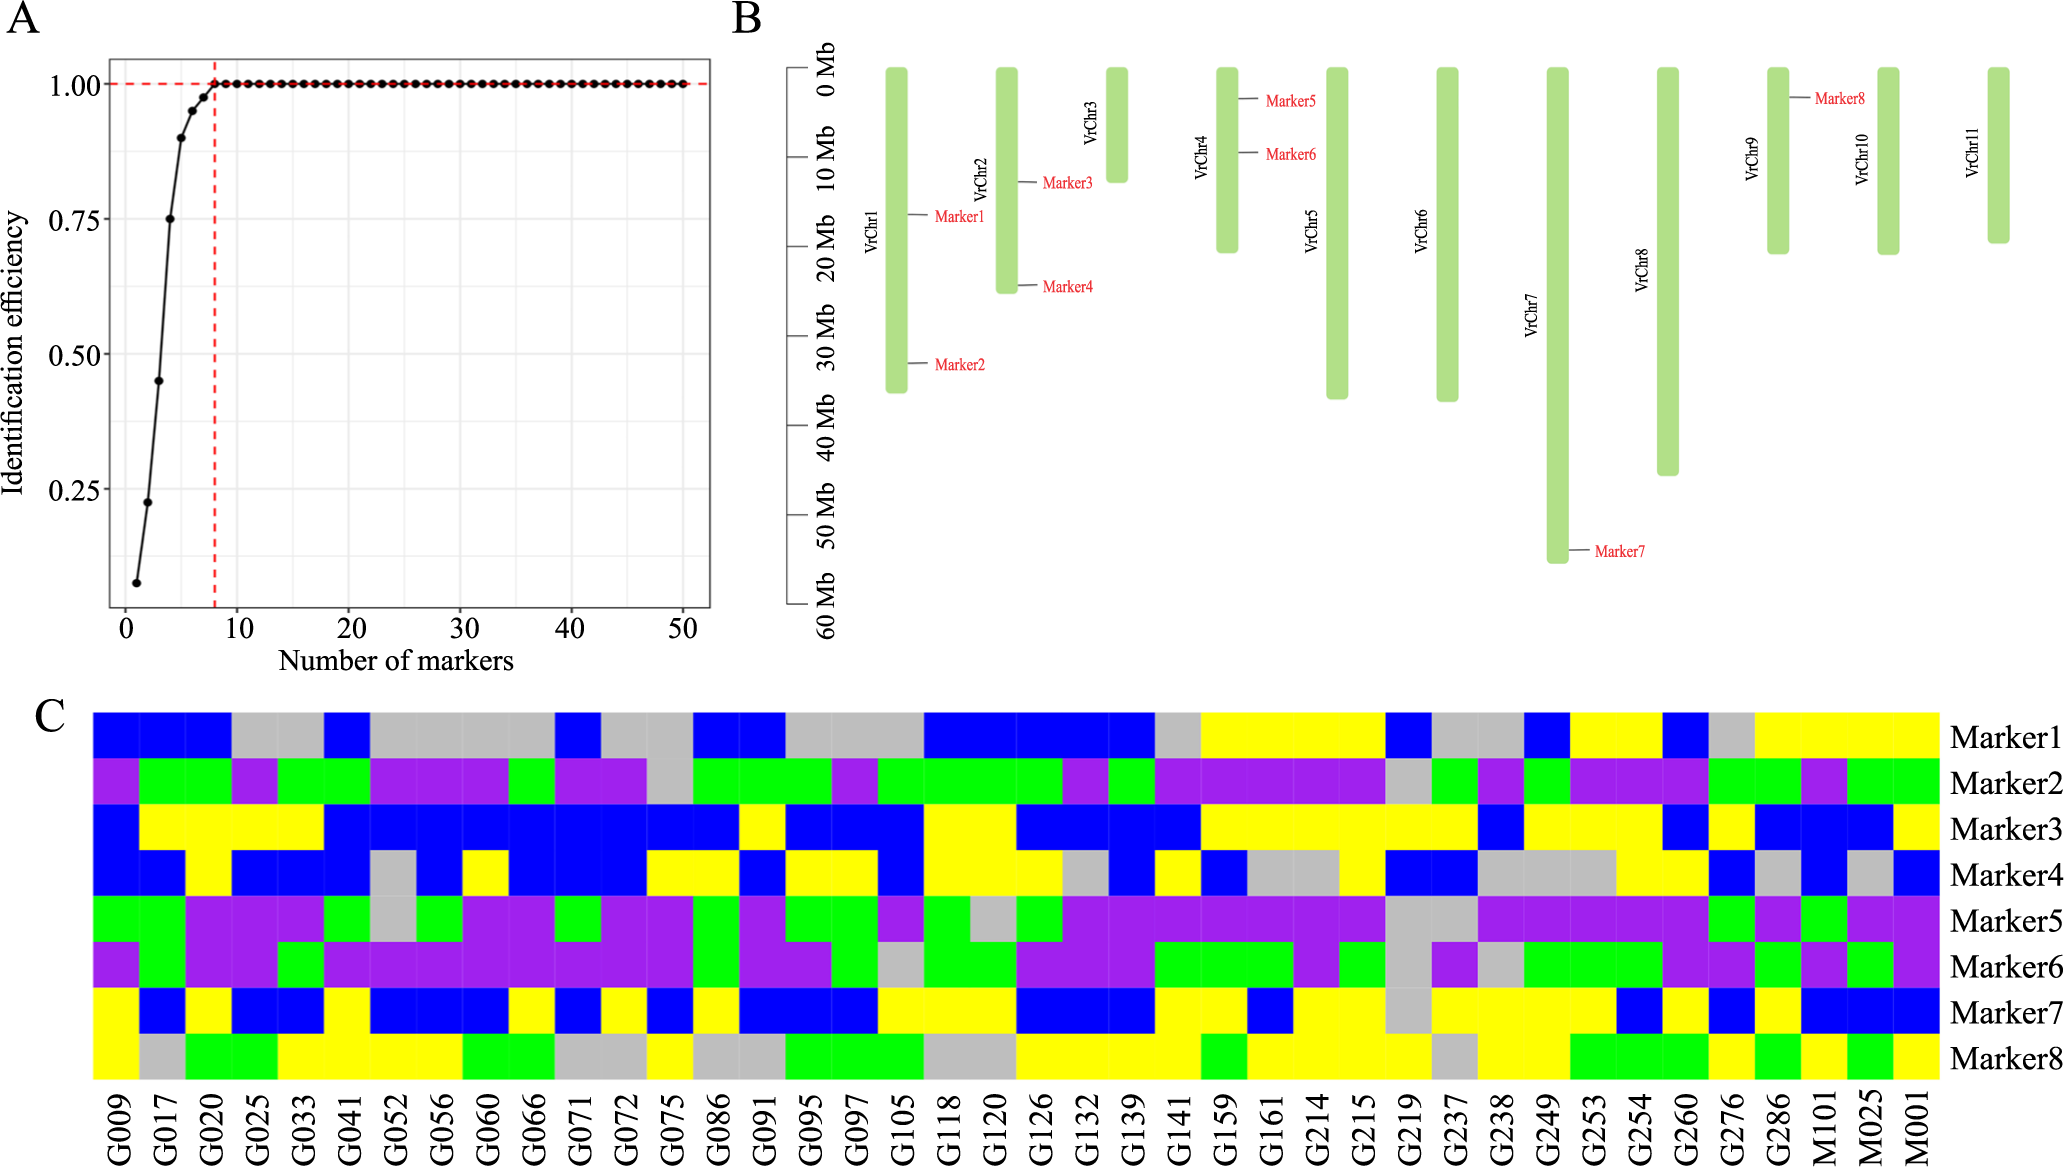
A total of 25,611 high-quality SNPs were successfully transformed into KASP markers with 46.54% transformation rate, which displayed good polymorphism and variety discrimination ability. KASP markers were distributed as follows: about 7,493 (29.26%) in the intergenic region; 7,147 (27.91%) in the intron region; 4,199 (16.40%) in the exon region; and 3,008 (11.74%) and 3,000 (11.71%) were distributed in the gene regulatory region at 2 kb upstream and downstream of the gene, respectively (Figure 3 A). The PIC values of 25,611 SNPs ranged from 0.350 to 0.375 (mean value = 0.366); MAF values ranged from 0.346 to 0.500 (mean value = 0.421); and observed heterozygosity ranged from 0 to 1.00 (mean value = 0.04) (Figure 3 B, C, D). A combination of chromosomal location, PIC, MAF, observed heterozygosity, and missing values of 40 mung bean genotypes were used to obtain 50 high-quality core SNP-based KASP markers. Owing to the biallelic nature of the SNP, the PIC value of SNPs was limited from 0 to 0.5 (Eltaher et al., 2018). In comparison with the mean values of genomic SSRs (0.40) and EST-based SSRs (0.30) markers in mung bean, the mean PIC value (0.421) of 50 core KASP markers was considered the highest one (Chen et al., 2015). The threshold of MAF significantly affected fingerprinting and inferred population structure; SNPs with higher MAF values tended to be more polymorphic (Linck & Battey, 2019). Sixty-six percent of core KASP markers had MAF values between 0.4 and 0.5 (mean value = 0.445), suggesting the polymorphic practicality of these core markers used in the present study. According to the saturation curve analysis of marker identification efficiency, eight core candidate KASP markers were finally selected for their higher PIC (0.351 ~ 0.375), higher MAF (0.350 ~ 0.500), lower observed heterozygosity (0 ~ 0.375), and no missing values (Figure 4 A). Detailed information on eight core KASP markers (marker name, location, variant type, and primer sequences) was provided (Table 4, Figure 4 B). Based on these eight newly developed core KASP markers, fingerprints of 40 mung bean germplasms were constructed (Figure 4 C). Different from most previous studies focusing on morphology and quality evaluation of different mung bean germplasms, the SNP fingerprinting using KASP technology provided a more accurate, rapid, convenient, and efficient method for the diversity identification of mung bean germplasms (Chen et al., 2020; Basnet et al., 2024).
Population genetic analysis of mung bean (Vigna radiata) germplasms based on SNP loci: A, distribution; B, PIC - polymorphism information content; C, MAF - minor allele frequency; and D, observed heterozygosity values for 25,611 SNP markers based on data from 40 core mung bean germplasms.
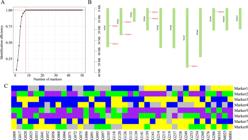
Fingerprint analysis of 40 core mung bean (Vigna radiata) germplasms: A, identification efficiency of the combined SNP markers; B, distribution of 8 core markers on mung bean chromosomes; C, fingerprints of the 40 core mung bean germplasms. Each row represents a genome, and each column represents a sample.
Conclusions
-
An integrated genotyping-by-sequencing and competitive allele specific PCR (KASP) technology is a powerful tool for investigating population structure and genetic diversity of mung bean (Vigna radiata) germplasms.
-
SNP-based KASP fingerprints are efficient for distinguishing 40 core mung bean germplasms.
Declaration of use of AI technologies
Data availability statement
Data available: genome-sequencing data reported in this study have been deposited in the China National GeneBank Database (https://db.cngb.org/cnsa/), under accession number sub072248.
Acknowledgments
This research was supported by the Natural Science Foundation projects of Nanyang Normal University (2019ZX027, 2022PY014, and 2024QN009), Natural Science Foundation of Henan province (232300420213), Key Scientific Research Project of Higher Education of Henan Province (24A210021), and Nanyang Science and Technology Program (23KJGG293 and 23KJGG264), in China.
Disclaimer/Publisher’s note:
References
-
BASNET, B.; UPRETI, U.; THAPALIYA, K.P. Genotypic variations in postfertility traits and yield components of mung bean (Vigna radiata (L.) R. Wilczek) germplasms in Chitwan, Nepal. Heliyon, v.10, e39226, 2024. DOI: https://doi.org/10.1016/j.heliyon.2024.e39226
» https://doi.org/10.1016/j.heliyon.2024.e39226 -
CHEN, H.; HU, L.; YANG, Y.; HAO, X.; LI, S.; WANG, S.; WANG, L.; CHENG, X. Evaluation and genetic diversity analysis of agronomic traits and bruchid resistance using 481 worldwide mung bean germplasms. Journal of Plant Genetic Resources, v.21, p.549-559, 2020. DOI: https://doi.org/10.13430/j.cnki.jpgr.20190717003
» https://doi.org/10.13430/j.cnki.jpgr.20190717003 -
CHEN, H.; QIAO, L.; WANG, L.; WANG, S.; BLAIR, M.W.; CHENG, X. Assessment of genetic diversity and population structure of mung bean (Vigna radiata) germplasm using EST-based and genomic SSR markers. Gene, v.566, p.175-183, 2015. DOI: https://doi.org/10.1016/j.gene.2015.04.043
» https://doi.org/10.1016/j.gene.2015.04.043 -
DUBE, S.P.; SIBIYA, J.; KUTU, F. Genetic diversity and population structure of maize inbred lines using phenotypic traits and single nucleotide polymorphism (SNP) markers. Scientific Reports, v.13, art.17851, 2023. DOI: https://doi.org/10.1038/s41598-023-44961-3
» https://doi.org/10.1038/s41598-023-44961-3 -
ELTAHER, S.; SALLAM, A.; BELAMKAR, V.; EMARA, H.A.; NOWER, A.A.; SALEM, K.F.M.; POLAND, J.; BAENZIGER, P.S. Genetic diversity and population structure of F3:6 Nebraska winter wheat genotypes using genotyping-by-sequencing. Frontiers in Genetics, v.9, art.76, 2018. DOI: https://doi.org/10.3389/fgene.2018.00076
» https://doi.org/10.3389/fgene.2018.00076 -
GONG, D.; HUANG, L.; XU, X.; WANG, C.; REN, M.; WANG, C.; CHEN, M. Construction of a high-density SNP genetic map in flue-cured tobacco based on SLAF-seq. Molecular Breeding, v.36, art.100, 2016. DOI: https://doi.org/10.1007/s11032-016-0514-7
» https://doi.org/10.1007/s11032-016-0514-7 -
HAPLOTYPECALLER. Available at: <https://gatk.broadinstitute.org/hc/en-us/articles/360042913231-HaplotypeCaller>. Accessed on: Nov. 27 2025.
» https://gatk.broadinstitute.org/hc/en-us/articles/360042913231-HaplotypeCaller -
HSU, Y.-M.; WANG, S.-S.; TSENG, Y.-C.; LEE, S.-R.; FANG, H.; HUNG, W.-C.; KUO, H.-I.; DAI, H.-Y. Assessment of genetic diversity and SNP marker development within peanut germplasm in Taiwan by RAD-seq. Scientific Reports, v.12, art.14495, 2022. DOI: https://doi.org/10.1038/s41598-022-18737-0
» https://doi.org/10.1038/s41598-022-18737-0 -
HUANG, H.; HE, S.; ZHENG, X.; SHI, D.; BAI, P.; ZHAO, Y.; YU, J.; NIU, X. Simple sequence repeat marker-based genetic diversity and chemical composition analysis of ancient Camellia sinensis in Jiulong County, Sichuan Province, China. Genes, v.15, art.1317, 2024. DOI: https://doi.org/10.3390/genes15101317
» https://doi.org/10.3390/genes15101317 -
JAGANATHAN, D.; THUDI, M.; KALE, S.; AZAM, S.; ROORKIWAL, M.; GAUR, P.M.; KISHOR, P.B.; NGUYEN, H.; SUTTON, T.; VARSHNEY, R.K. Genotyping-by-sequencing based intra-specific genetic map refines a ‘’QTL-hotspot” region for drought tolerance in chickpea. Molecular Genetics and Genomics, v.290, p.559-571, 2015. DOI: https://doi.org/10.1007/s00438-014-0932-3
» https://doi.org/10.1007/s00438-014-0932-3 -
JIA, Q.; HU, S.; LI, X.; WEI, L.; WANG, Q.; ZHANG, W.; ZHANG, H.; LIU, X.; CHEN, X.; WANG, X.; CHEN, H. Identification of candidate genes and development of KASP markers for soybean shade-tolerance using GWAS. Frontiers in Plant Science, v.15, art.1479536, 2024. DOI: https://doi.org/10.3389/fpls.2024.1479536
» https://doi.org/10.3389/fpls.2024.1479536 -
KUMAR, D.; CHHOKAR, V.; SHEORAN, S.; SINGH, R.; SHARMA, P.; JAISWAL, S.; IQUEBAL, M.A.; JAISWAR, A.; JAISRI, J.; ANGADI, U.B.; RAI, A.; SINGH, G.P.; KUMAR, D.; TIWARI, R. Characterization of genetic diversity and population structure in wheat using array based SNP markers. Molecular Biology Reports, v.47, p.293-306, 2020. DOI: https://doi.org/10.1007/s11033-019-05132-8
» https://doi.org/10.1007/s11033-019-05132-8 -
LAVANYA, G.R.; SRIVASTAVA, J.; RANADE, S.A. Molecular assessment of genetic diversity in mung bean germplasm. Journal of Genetics, v.87, p.65-74, 2008. DOI: https://doi.org/10.1007/s12041-008-0009-3
» https://doi.org/10.1007/s12041-008-0009-3 -
LI, H.; DURBIN, R. Fast and accurate short read alignment with Burrows-Wheeler transform. Bioinformatics, v.25, p.1754-1760, 2009. DOI: https://doi.org/10.1093/bioinformatics/btp324
» https://doi.org/10.1093/bioinformatics/btp324 -
LI, H.; HANDSAKER, B.; WYSOKER, A.; FENNELL, T.; RUAN, J.; HOMER, N.; MARTH, G.; ABECASIS, G.; DURBIN, R. 1000 genome project data processing subgroup, the sequence alignment/map format and SAMtools. Bioinformatics, v.25, p.2078-2079, 2009. DOI: https://doi.org/10.1093/bioinformatics/btp352
» https://doi.org/10.1093/bioinformatics/btp352 -
LI, J.; CHANG, X.; HUANG, Q.; LIU, P.; ZHAO, X.; LI, F.; WANG, Y.; CHANG, C. Construction of SNP fingerprint and population genetic analysis of honeysuckle germplasm resources in China. Frontiers in Plant Science, v.14, art.1080691, 2023. DOI: https://doi.org/10.3389/fpls.2023.1080691
» https://doi.org/10.3389/fpls.2023.1080691 -
LI, Y.D.; LUO, X.B.; PENG, X.; YANG, G.Q.; JIN, Y.Y.; ZU, G.D.; TIAN, H.; ZHANG, W.P. Development of SNP and InDel markers in radish and their association with phenotypic characters. Acta Agriculturae Zhejiangensis, v.36, p.1055-1066, 2024. DOI: https://doi.org/10.3969/j.issn.1004-1524.20230663
» https://doi.org/10.3969/j.issn.1004-1524.20230663 -
LINCK, E.; BATTEY, C.J. Minor allele frequency thresholds strongly affect population structure inference with genomic data sets. Molecular Ecology Resources, v.19, p.639-647, 2019. DOI: https://doi.org/10.1111/1755-0998.12995
» https://doi.org/10.1111/1755-0998.12995 -
LIU, C.; WANG, Y.; PENG, J.; FAN, B.; XU, D.; WU, J.; CAO, Z.; GAO, Y.; WANG, X.; LI, S.; SU, Q.; ZHANG, Z.; WANG, S.; WU, X.; SHANG, Q.; SHI, H.; SHEN, Y.; WANG, B.; TIAN, J. High-quality genome assembly and pan-genome studies facilitate genetic discovery in mung bean and its improvement. Plant Communications, v.3, art.100352, 2022. DOI: https://doi.org/10.1016/j.xplc.2022.100352
» https://doi.org/10.1016/j.xplc.2022.100352 -
LIU, C.; YAN, J.; ZHANG, Z.; PEI, L.; LI, C.; ZHANG, X.; SHI, S. Genetic variation analysis and development of KASP marker for leaf area and hight in southern-type Populus deltoides Plants (Basel), v.14, art.330, 2025. DOI: https://doi.org/10.3390/plants14030330
» https://doi.org/10.3390/plants14030330 -
MARKDUPLICATES (PICARD). Available at: <https://gatk.broadinstitute.org/hc/en-us/articles/360037052812-MarkDuplicates-Picard>. Accessed on: Nov. 27 2025.
» https://gatk.broadinstitute.org/hc/en-us/articles/360037052812-MarkDuplicates-Picard -
MWANGI, J.W.; OKOTH, O.R.; KARIUKI, M.P.; PIERO, N.M. Genetic and phenotypic diversity of selected Kenyan mung bean (Vigna radiata L. Wilckzek) genotypes. Journal of Genetic Engineering and Biotechnology, v.19, art.142, 2021. DOI: https://doi.org/10.1186/s43141-021-00245-9
» https://doi.org/10.1186/s43141-021-00245-9 -
PARIASCA-TANAKA, J.; LORIEUX, M.; HE, C.; MCCOUCH, S.; THOMSON, M.J.; WISSUWA, M. Development of a SNP genotyping panel for detecting polymorphisms in Oryza glaberrima/O. sativa interspecific crosses. Euphytica, v.201, p.67-78, 2015. DOI: https://doi.org/10.1007/s10681-014-1183-4
» https://doi.org/10.1007/s10681-014-1183-4 -
PRICE, M.N.; DEHAL, P.S.; ARKIN, A.P. FastTree 2 - approximately maximum-likelihood trees for large alignments. PLoS ONE, v.5, e9490, 2010. DOI: https://doi.org/10.1371/journal.pone.0009490
» https://doi.org/10.1371/journal.pone.0009490 -
RSTUDIO. Available at: <https://posit.co/products/open-source/rstudio-server/>. Accessed on: Nov. 27 2025.
» https://posit.co/products/open-source/rstudio-server/ -
SELECTVARIANTS. Available at: <https://gatk.broadinstitute.org/hc/en-us/articles/35967603979419-SelectVariants>. Accessed on: Nov. 27 2025.
» https://gatk.broadinstitute.org/hc/en-us/articles/35967603979419-SelectVariants -
SHARMA, J.S.; SINGH, L. Developing breeder-friendly KASP markers for rust R genes. Methods in Molecular Biology, v.2898, p.273-280, 2025. DOI: https://doi.org/10.1007/978-1-0716-4378-5_17
» https://doi.org/10.1007/978-1-0716-4378-5_17 -
SHEN, B.; SHEN, A.; TAN, Y.; LIU, L.; LI, S.; TAN, Z. Development of KASP markers, SNP fingerprinting and population genetic analysis of Cymbidium ensifolium (L.) Sw. germplasm resources in China. Frontiers in Plant Science, v.15, art.1460603, 2025. DOI: https://doi.org/10.3389/fpls.2024.1460603
» https://doi.org/10.3389/fpls.2024.1460603 -
SNPT SOFTWARE. Available at: <http://www.shigatox.net/stec/cgi-bin/snpt>. Accessed on: Nov. 27 2025.
» http://www.shigatox.net/stec/cgi-bin/snpt -
VARIANTFILTRATION. Available at: <https://gatk.broadinstitute.org/hc/en-us/articles/360041850471-VariantFiltration>. Accessed on: Nov. 27 2025.
» https://gatk.broadinstitute.org/hc/en-us/articles/360041850471-VariantFiltration -
WANG, Y.; LV, H.; XIANG, X.; YANG, A.; FENG, Q.; DAI, P.; LI, Y.; JIANG, X.; LIU, G.; ZHANG, X. Construction of a SNP fingerprinting database and population genetic analysis of cigar tobacco germplasm resources in China. Frontiers in Plant Science, v.12, art.618133, 2021. DOI: https://doi.org/10.3389/fpls.2021.618133
» https://doi.org/10.3389/fpls.2021.618133 -
WANG, Z.; ZENG, H.; QIN, X.; LI, Z.; TONG, Y.; LIU, K.; LI, Q. Genetic diversity and fingerprinting of Elaeagnus angustifolia based on SSR molecular markers. Chinese Journal of Biotechnology, v.40, p.3530-3547, 2024. DOI: https://doi.org/10.13345/j.cjb.240284
» https://doi.org/10.13345/j.cjb.240284 -
XING, X.; HU, T.; WANG, Y.; LI, Y.; WANG, W.; HU, H.; WEI, Q.; YAN, Y.; GAN, D.; BAO, C.; WANG, J. Construction of SNP fingerprints and genetic diversity analysis of radish (Raphanus sativus L.). Frontiers in Plant Science, v.15, art.1329890, 2024. DOI: https://doi.org/10.3389/fpls.2024.1329890
» https://doi.org/10.3389/fpls.2024.1329890 -
YANG, Y.; LYU, M.; LIU, J.; WU, J.; WANG, Q.; XIE, T.; LI, H.; CHEN, R.; SUN, D.; YANG, Y.; YAO, X. Construction of an SNP fingerprinting database and population genetic analysis of 329 cauliflower cultivars. BMC Plant Biology, v.22, art.522, 2022. DOI: https://doi.org/10.1186/s12870-022-03920-2
» https://doi.org/10.1186/s12870-022-03920-2 -
ZHANG, H.; LIN, P.; LIU, Y.; HUANG, C.; HUANG, G.; JIANG, H.; XU, L.; ZHANG, M.; DENG, Z.; ZHAO, X. Development of SLAF-sequence and multiplex SNaPshot panels for population genetic diversity analysis and construction of DNA fingerprints for sugarcane. Genes, v.13, art.1477, 2022. DOI: https://doi.org/10.3390/genes13081477
» https://doi.org/10.3390/genes13081477 -
ZHAO, Y.; WANG, Y.; WANG, L.; ZHANG, D. Molecular identification of mung bean accessions (Vigna radiata L.) from Northeast China using capillary electrophoresis with fluorescence-labeled SSR markers. Food and Energy Security, v.9, e182, 2020. DOI: https://doi.org/10.1002/fes3.182
» https://doi.org/10.1002/fes3.182