ABSTRACT
This study analyzed the productive strategies and technology of beef producers in the Vermelho basin in Goiás, Brazil. The data were used to develop a technological index, applicable to the local beef production systems. The data were obtained using questionnaires. A set of 60 properties was selected to provide a representative sample of the relief and soil quality within the study area. The data were analyzed using multiple correspondence, cluster analysis, and beta regression procedures. The variables that most contributed to the definition of the technological level were identified. The variables and production units each formed three clusters, corresponding to three levels of technology: low, mid, and high. The data were used to calculate a predictive index for the analysis and mapping of the technology used in the study area. High cattle densities were found in systems with low technology, indicating low productivity and profitability, and reduced environmental sustainability.
Keywords:
livestock; multiple correspondence analysis; beta regression
1 INTRODUCTION
The production of beef cattle in Brazil has advanced considerably over the past two decades through the improvement of rearing and management systems, the specialized management of large-scale, intensive methods, and investments in more efficient productive processes. Even so, the mean production parameters obtained by Brazilian animal husbandry are still much lower than those in more technologically-advanced countries, due to the predominance of relatively unproductive extensive rearing systems, which represent a comparatively unprofitable use of the land (Dias, 20165. DIAS LCP, PIMENTA FM & SANTOS AB ET AL. 2016. Patterns of land use, extensification, and intensification of Brazilian agriculture. Global Change Biology. DOI: 10.1111/GCB.13314.
https://doi.org/10.1111/GCB.13314...
).
The increasing demand for food in Brazil drives the ongoing intensification of the country’s cattle ranching sector, which is faced with the exhaustion of the available agricultural frontiers and increasing environmental controls. This situation is exacerbated by the growing demand for beef protein, currently increasing at a rate of 2.7% per annum, and the fact that the Brazilian currency, the Real, has been constantly devalued (Armenteras, 20132. ARMENTERAS D, RODR´IGUEZ N & RETANA J. 2013. Landscape dynamics in northwestern Amazonia: an assessment of pastures, fire and illicit crops as drivers of tropical deforestation. Plos One. DOI: 10.1371/Journal.Pone.0054310.
https://doi.org/10.1371/Journal.Pone.005...
; Robinson, 201425. ROBINSON TP, WINT GRW & CONCHEDDA G ET AL. 2014. Mapping the Global Distribution of Livestock. PLoS ONE. doi: 10.1371/journal.pone.0096084.
https://doi.org/10.1371/journal.pone.009...
; OECD/FAO, 201519. OECD-FAO. 2015. Overview of the OECD-FAO Agricultural outlook 2015-2024. http://dx.doi.org/10.1787/agr_outlook-2015-4-en.
http://dx.doi.org/10.1787/agr_outlook-20...
). The intensification of the sector results in the increasing verticalization of the production process, based on the growth in productivity, derived from investments in technology (Miziara, 200618. MIZIARA F. 2006. Expansão de fronteiras na ocupação do espaço no cerrado: o caso de Goiás. In: Guimarães LD, Silva MAD, Anacleto TC. (Org.). Natureza Viva Cerrado. Goiânia: UFG, 169-196.).
The increase in production can be related to a wide range of technological strategies, including genetic improvement, through natural or artificial insemination, the adequate planning of the timing of the breeding season, nutrition and animal health, infrastructure, management of the soil, plants, and animals, the application of technical assistance, and the increased use of machinery and equipment. Despite the diversity of strategies available to cattle ranchers in Brazil, most beef is raised on planted pasture, predominantly of the Brachiaria brizantha cv. Marandu forage variety, which demands the adequate management of climate-soil-plant-animal interactions (Alvim, 20021. ALVIM JM, BOTREL MA & XAVIER DF. 2002. As principais espécies de brachiarias utilizadas no país. Embrapa Gado de Leite. Juiz de Fora MG. DOC. TÉCNICO 22.).
Under the edapho-climatic conditions of the Brazilian Cerrado savanna, the pasture decreases considerably in cover and is less nutritious during the dry season. To increase the efficiency of production and economic returns during this period, pasture is supplemented with mineral salt mixed with urea or a multiple protein mix, which generates better results than the salt and urea mix, but is much more expensive (Gomes et al., 20158. GOMES RC, NUNES AJC & MARINO CT ET AL. 2015. Medeiros SR Estratégias alimentares para gado de corte: suplementação a pasto, semiconfinamento e confinamento. In: Nutrição de bovinos de corte fundamentos e aplicações. Org. MEDEIROS SR, GOMES RC, BUNGENSTAB DJ. Embrapa Gado de Corte. Brasília.). Other options include sugarcane and urea, elephant grass, forage legumes, and a combination of pasture and silage, prepared on the ranch by specialized crews. More pasture is available during the rainy season, and it is of better quality than that available during the dry season, although it may not always be sufficient to satisfy the expectations of the producer in terms of productive efficiency and profitability, for example, in the case of short-cycle cattle rearing, which often makes supplementation necessary (Poppi & McLennan, 199522. POPPI DP & MCLENNAN SR. 1995. Protein and energy utilization by ruminants at pasture. J. Anim.Scien., 73: 278-290.; Reis et al., 200924. REIS RA ET AL. 2009. Suplementação da dieta de bovinos de corte como estratégia do manejo das pastagens. R. Bras. Zootec., Viçosa, 38: 147-159.).
The creation of parameters that permit the systematic evaluation of the technological levels of these production systems is a considerable challenge, given the unique features of each productive unit, which may account for the general lack of publications on this topic. The present study, part of an integrated project on pasture, under development by the LAPIG/IESA/CIAMB/UFG, aimed to better understand and delineate the productive and technological strategies applied by cattle ranchers and propose an index that permits the systematic evaluation of the levels of technology applied to the productive systems. This assessment was based on a case study in the Vermelho River basin in Goiás, Brazil.
2 MATERIAL AND METHODS
2.1 Study area
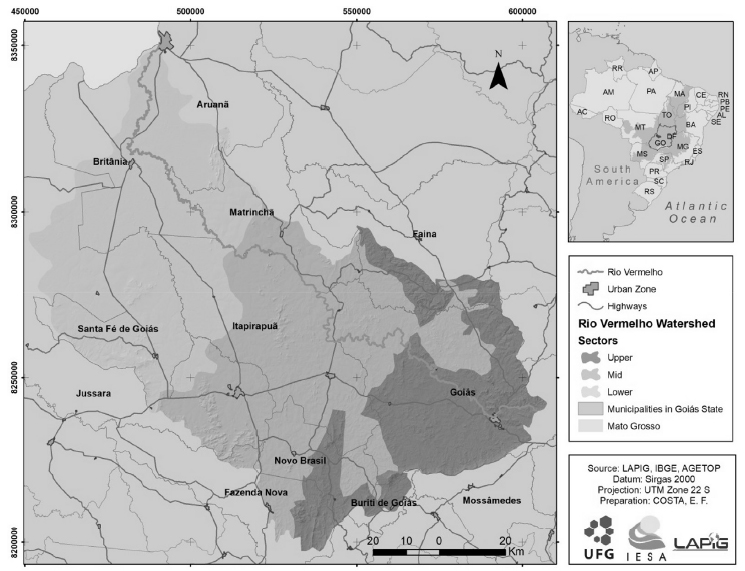
The Vermelho River basin is located in western Goiás, central Brazil (Fig. 1), within the Cerrado savanna biome, with a total area of 10,938.1 km2. The Vermelho River originates at an altitude of 830 m above sea level (asl), 17 km from the town of Goiás, and discharges into the right margin of the Araguaia River, at an altitude of 220 m asl, in the municipality of Aruanã. The Vermelho is one of the twelve most important tributaries of the Araguaia (Machado & Lima, 201116. MACHADO LEG & LIMA CVL. 2011. Compartimentação geomorfológica da basin hidrográfica do Rio Vermelho (GO), utilizando imagens ASTER. In: Simpósio Brasileiro de Sensoriamento Remoto - SBSR, 2011, Curitiba. Anais... São Paulo, Instituto Nacional de Pesquisa Espacial, p. 8231.).
For analysis, the Vermelho basin was divided into three sectors, according to its slopes and topographic profile, in order to guarantee representative samples of the conditions of relief and soils, which may influence the technological strategies adopted by the local producers. The different sectors of the basin were characterized and the sampling points were generated using topographic images of high spatial resolution (30 m) from the SRTM (Shuttle Radar Topography Mission), while the limits of the basin were generated using Rapideye (2012) satellite images, with a spatial resolution of 5 m. The three sectors were defined as (a) Upper basin, relief undulating to hilly, reflected in a greater variation in soil types, (b) Mid basin, with rolling to undulating relief, and (c) Lower basin, with flat to rolling relief.
Beef production in the region is based on distinct patterns of landholding in the three different sectors. In the upper basin, more than half (52.2%) of the properties are considered to be small, that is, with an area of no more than 50 hectares. This reflects the natural local conditions, which are less favorable for mechanization, given the steeper slopes and the shallower soils, which are relatively rocky. In the flatter lower basin, which is more appropriate for mechanization, a much larger proportion (68.3%) of the properties are classified as large (>2500 ha).
The Vermelho basin is a characteristic Cerrado region, dominated by both planted (67.6% of the total area) and natural pastures destined for the production of beef. In 2016, approximately 83% of the local stock (1,945,716 head) was made up of beef cattle (IBGE, 200612. INSTITUTO BRASILEIRO DE GEOGRAFIA E ESTAT´ISTICA (IBGE). 2006. Economia. Censo agropecuário. Available at: Available at: http://www.ibge.gov.br/home/estatistica/economia/agropecuaria/censoagro/default.shtm
. Access: Mar 05, 2015.
http://www.ibge.gov.br/home/estatistica/...
; IMB, 201713. INSTITUTO MAURO BORGES (IMB). 2017. Perfil dos municípios goianos. Available at: Available at: http://www.imb.go.gov.br/
. Acesso em: 10 fev. 2017.
http://www.imb.go.gov.br/...
). Other components of the production chain are present in the region, including cooperatives, companies that provide technical assistance, feed and supplies, and the region is relatively close to the state capital (Goiânia), which facilitates marketing of the produce. Beef is also produced by confinement, including a JBS facility in the municipality of Aruanã, which is the firms second largest, and has been projected to confine 70,000 animals per annum. There are also three meatpacking plants in the basin, in particular the JBS installation in Santa Fé de Goiás, which is responsible for the basins exports, together with other plants in neighboring regions, including Goiânia, which also purchase cattle (ABIEC, 20143. ASSOCIAÇÃO BRASILEIRA DAS INDÚSTRIAS EXPORTADORAS DE CARNE (ABIEC). 2016. Frigoríficos. Available at: Available at: http://www.abiec.com.br/2_mapa.asp
. Access 17 jul. 2016.
http://www.abiec.com.br/2_mapa.asp...
; SEFAZ, 201427. SECRETARIA DA FAZENDA (SEFAZ). 2014. Lista de frigoríficos. Available at: Available at: http://www.sefaz.go.gov.br/tare/consultaTaresFrigorificos/Lista_de_Frigor\%C3\%ADficos.pdf
. Access on: Dec 17, 2014.
http://www.sefaz.go.gov.br/tare/consulta...
; JBS, 201614. JBS SA. 2016. Confinamentos. Disponível em: Disponível em: http://www.jbs.com.br/pt-br/content/confinamento
. Access 13 ago. 2016.
http://www.jbs.com.br/pt-br/content/conf...
).
2.2 Data collection
Data were collected using a structured questionnaire, which was applied by the authors, in situ, to the administrators of 60 beef producing operations, following the signing of an informed consent form, in July 2016. The questionnaire was designed to cover socioeconomic factors, as well as the description of production systems and pasture management techniques, with the data being validated by the producers and specialists.
The questionnaire was designed in accordance with the objectives of the present study, and with other studies within the scope of the integrated project, which focuses on Brazilian pastures. The information obtained using this questionnaire was used to compile indices of the technology used in the beef production systems, based on three principal groups (see Appendix I): feed (pasture and supplements), machinery and equipment, and management.
The sample points were selected randomly within each sector of the basin, considering the variation in slope, per pixel (area), using the “Zonal Statistic as Table” tool in ArcGIS. The points were determined by relating the number of pixels (area) that refer to the variance in the slope, to the total area of the Vermelho basin.
2.3 Data analysis
The data were analyzed using a multivariate approach appropriate for the type of qualitative information collected during the survey (Kubrusly, 200115. KUBRUSLY LS. 2001. Um procedimento para calcular índices a partir de uma base de dados multivariados. Pesquisa Operacional, 21(1): 107-117. http://dx.doi.org/10.1590/S0101-74382001000100007.
http://dx.doi.org/10.1590/S0101-74382001...
). A data matrix was prepared in Excel, in which the lines represented each of the 60 cattle ranches and the columns, each of the categorical variables recorded during the collection of the data. This matrix was used to run multiple correspondence and cluster analyses, with the predictive validity of the results for the remaining properties of the study area being evaluated using a beta regression. The analyses were run in the R software.
2.3.1 Multiple Correspondence Analysis (MCA)
The Correspondence Analysis (CA) is an exploratory approach to interdependence, which is appropriate for the analysis of the interdependence of categorical variables in non-linear relationships, which permits the multivariate analysis of the data, reducing their intrinsic multidimensionality into an optimal (two-dimensional) space that permits the graphical representation of the individual sample units or the variables, as well as descriptive statistics (Escofier & Page´s, 19946. ESCOFIER B & PAGES J. 1994. Multiple factor analysis (AFMULT package). Computational statistics & data analysis, 18(1): 121-140. http://dx.doi.org/10.1016/0167-9473(94)90135-X.
http://dx.doi.org/10.1016/0167-9473(94)9...
). The data can be arranged in a rectangular, disjunctive matrix (Hair Jr et al., 200511. HAIR JR JF, ANDERSON RE & TATHAM RL ET AL. 2005. Análise multivariada de dados. Trad. Adonai Schlup Sant’Anna e Anselmo Chaves Neto. Porto Alegre: Bookman.; Pagés, 2014), which permits the application of contingency tables of frequencies, without the need for probabilistic models or distributions to generalize the results (Guedes et al., 200810. GUEDES TA, IVANQUI IL & MARTINS ABT ET AL. 2008. Seleção de variáveis categóricas utilizando análise de correspondência e análise procrustes. Acta Scientiarum. Technology, 21: 861-868.). The MCA is often applied to the analysis of data collected using interviews or questionnaires, in which the questions represent the variables, with the objective of reducing the total number of variables in the dimensions/indices which express outlying values (Osborne & Costelo, 200520. COSTELLO AB & OSBORNE JW. 2005. Best practices in exploratory factor analysis: Four recommendations for getting the most from your analysis. Practical Assessment, Research & Evaluation, 10(7): 1-9.). In this approach, the number of principal components obtained by the analysis is equal to the number of eigenvalues, which cannot be greater than either the number of lines or columns, whichever is smaller.
The MCA can be derived from a complete matrix or a Burt matrix. When the complete matrix is used, k binary columns are used to represent k categories, although this approach may generate artificial dimensions, given that a single variable is being represented by k dimensions. In this case, the variance of the spatial distribution of the derivatives is inflated, resulting in the underestimation of the variance explained by each of the principal variables. To resolve this problem, the eigenvalues were adjusted using the formula of Benzécri (Breenacre, 20079. GREENACRE M. 2007. Correspondence Analysis in Practice. Barcelona, Chapman and Hall/CRC.):
where λ
α denotes the α-th principal inertia of the complete disjunctive matrix, Q denotes the number of variables, and the 1Q threshold is the mean inertia of the complete disjunctive matrix. When the inertias are re-adjusted in the Burt matrix, it is necessary to consider λ
α = λ
b , where λ
b is the b-th principal inertia of the Burt matrix. Please note that Camiz & Gomes (20164. CAMIZ S & GOMES GC. 2016. Alternative methods to multiple correspondence analysis in reconstructing the relevant information in a burt’s table. Pesquisa Operacional, 36(1): 23-44. doi.org/10.1590/0101-7438.2016.036.01.0023.
https://doi.org/10.1590/0101-7438.2016.0...
) provide a complete description of the Benzécri formula.
The interpretation of the MCA is based on the graphical representation of the points and variables, which reveals aspects of the relationships among the different variables that the statistics are unable to show. Each categorical variable is represented by a point, and the proximity between any two points represents the degree of association between the corresponding variables. Each dimension has an eigenvalue, which indicates the relative contribution of this dimension to the total variance in the categories, also known as a measure of inertia. This technique has significant advantages for the exploratory analysis of categorical data, although caution is required for the extraction of inferences from the results. The criterion for the reduction of the number of dimensions depends on the application of relatively reliable procedures and the technique is sensitive to outlying data, while the interpretability of the data representation may depend on the experience of the researcher (Hair Jr et al., 2005; Pagés, 201421. PAGÈS J. 2014. Multiple Factor Analysis by example using R. CRC Press.).
Multiple Correspondence Analysis (MCA) was applied in the present study with the aim of establishing the relationships among the 60 production units and the 18 qualitative variables, with a total of 35 categories, which were selected as being representative of the technological level of the productive systems (Mangabeira, 200217. MANGABEIRA JAC ET AL. 2002. Tipificação de sistemas de produção rural: a abordagem da análise de correspondência múltipla em Machadinho d’Oeste-RO. Campinas: EMBRAPA, 2002. 26 p. (Circular Técnica, 8).).
2.3.2 Cluster Analysis
Cluster analyses apply a set of multivariate techniques to the evaluation of the combined similarities and dissimilarities of a set of variables, establishing clusters and representing the characteristics of the relationships among these different clusters (Hair Jr et al., 2005). However, cluster analysis demands a degree of care in relation to the characteristics of the sample: (a) there should be no outlying data points, and (b) the data must be representative of the population, to guarantee valid results (Punj & Stewart, 198323. PUNJ G & STEWART DW. 1983. Cluster analysis in marketing research: Review and suggestions for application. Journal of Marketing Research, p. 134-148. DOI: 10.2307/3151680
https://doi.org/10.2307/3151680...
).
The similarities between the samples can be measured by a number of different methods, including measures of correlation and distance (both based on continuous variables), and measures of association, for categorical variables. In the present study, the vectors composed of the different components of the MCA (continuous variables) were used to represent the samples to be clustered. The hierarchy of the data clusters can be analyzed through either divisional or agglomerative methods. In the present study, a hierarchical agglomeration procedure was used to establish a tree-type structure, in which an initial cluster is established and then progressively compared and agglomerated with other clusters, according to their characteristics, generating a set of groups and subgroups, resulting in a dendrogram.
The centroid, Ward, median, complete, and single clustering approaches were tested, and the Ward method provided the most reliable interpretation of the data. The Ward (196328. WARD JR JH. 1963. Hierarchical grouping to optimize an objective function. Journal of the American Statistical Association, 58(301): 236-244.) algorithm was applied to form the clusters using a similarity approach, based on the sum of the squares of the errors within the groups, given by:
where k represents the cluster being analyzed, n = the number of samples in cluster k, and xi is the i-th item of cluster k. The criterion for the formation of the clusters, in each iteration, depends on the lowest degree of deviation among the samples. The Ward approach minimizes the variability within groups, and maximizes the variability among groups.
2.3.3 Beta regression model
The beta regression is a statistical approach used to analyze the relationship between a single dependent or response variable, within the interval (0, 1) and a few independent or predictor variables (Sant’Anna & Caten, 201026. SANT’ANNA AMO & CATEN CST. 2010. Modelagem da fração de não-conformes em processos industriais. Pesquisa Operacional, 30(1): 53-72. doi: 10.1590/S0101-74382010000100004.
https://doi.org/10.1590/S0101-7438201000...
). In the present study, the response variable was obtained by the cumulative empirical distribution of the technological indices derived from the MCA, restricted to the interval (0 and 1), which is defined by:
Were
and y i is the index recorded on ranch i. The independent variables are the categorical variables that characterize the production system.
The probability density function for the family of beta distributions (Ferrari & Cribari-Neto, 20047. FERRARI SLP & CRIBARI-NETO F. 2004. Beta regression for modelling rates and proportions. Jounal of Applied Statistic, 31: 799-815.) is given by:
with the parameters 0 <μ< 1 and ϕ > 0, while Γ(ϕ) is the gamma function.
If the random variables y 1 , y 2 , ... , y n are independent, with density given by (3), with a mean μ t , for t = 1, ..., n and unknown ϕ, the beta regression model is obtained assuming that the mean μ t can be written using a logit link function, given by:
where β 0 is the intercept, β i is the i-th regression coefficient and X i is the i-th independent variable.
The confidence interval (1 − α) × 100% for the regression coefficients are given, respectively, by:
where Φ−1(·) is the inverse of the cumulative distribution of the standard normal distribution.
3 RESULTS AND DISCUSSION
The Multiple Correspondence Analysis generated eight dimensions, derived from the eight eigenvalues, of which components 1 and 2 (Fig. 2) together account for 72.40% of the total explained variance, with the other dimensions making a relatively minor contribution. Given that the objective of the present study was to obtain a metrical index of technological development, based on the synthesis of the set of categorical variables obtained on the beef production systems, component 1 (dimension 1) was adopted here, considering its much greater (59.9%) explanation of the variance, given that component 2 (dimension 2) explained only 12.5% (Fig. 2). These percentages indicate the contribution of each variable to the total variation (inertia) of each dimension, indicating which is the most relevant for the formation of each dimension.
The MCA based on the adjusted Burt matrix for the technological variables of the beef production systems of the Vermelho River basin, Goiás, Brazil - 2016.
The most relevant technological variables for the construction of dimension 1 were: the application of lime (uc:1), which explained 9.14% of the total variation of dimension 1, the use of fertilizers (uf:1), with 8.07%, the planning of the breeding season (tem:1) with 6.34%, and the analysis of the soil (as:1), with 5.77% (Appendix 2). The technological variables least relevant to the technological index were: all the cattle density indices [tl:0 with 0.35%; tl:1 with 0.02%; tl:2 with 0.4%; and tl:3 with 0.31%], the annual pasture rotation system, whether present or absent (sp:1 with 0.08% and sp:2 with 0.07%), and provisioning with 0.5-1 kg of feed per head per day (pmmp:2 com 0.05%).
The principal coordinates of dimension 1 for the variables and production units (ranches) were used for the cluster analysis, which provided a better visualization of the distribution of the variables (Fig. 3) and the ranches (Fig. 4). The cluster analysis of the variables indicated the presence of three significant groupings, the first cluster being formed by the variables that represent low levels of technology, including the highest cattle densities (Fig. 3). This association of low technological variables can also be observed in dimension 1 of the MCA (Fig. 2), in the quadrant of values below zero, which represents the absence of technological practices in the production system. These variables include, in particular, variables related to provisioning (pasture and salt only throughout the year [psm:1], and pasture, salt, and urea during the dry season [psmu:1]), which are extremely inefficient, principally during the dry season. In this quadrant, it is interesting to note the presence of the highest cattle density (tl:3), with two or more animals per hectare, which indicates that this density exceeds the support capacity of the pasture, resulting in inefficient production and reduced profitability, in addition to the degradation of the environment.
Dendrogram of the technological variables, derived from dimension 1 of the MCA for the beef production systems of the Vermelho River basin, Goiás, Brazil - 2016.
Dendrogram of the ranches, derived from dimension 1 of the MCA for the beef production systems of the Vermelho River basin, Goiás, Brazil - 2016.
The second cluster encompasses the mid-level technological variables, with investments in technology for the establishment and maintenance of pasture. These variables include the application of fertilizers (uf:1), analysis of the soil (as:1), application of lime (uc:1), the bromatological analysis of the grass (ap:1), the use of high powered tractors (> 100 hp), and the planning of the breeding season (tem:1). This group can be observed to the right of the (0.0; 0.6) interval in the MCA (Fig. 3), with the high-powered tractors (pt100CV:2) grouping together with the variables related to the establishment and maintenance of the pasture.
The third cluster refers to the highest technological level observed on the regions beef production units (ranches) which includes all the variables related to provisioning (pmmp:1; 2; and 3), water supplies (sga:1), technical assistance (at:1), the use of low-powered tractors (< 100 hp), dietary supplements (ui:1), annual pasture rotation (sp:1) or no rotation (sp:2), and cattle densities of 0.6-1.0 individuals/hectare (tl:1) and 1.1-2.0 individuals/hectare (tl:2). The inclusion of the two types of rotation (i.e., application or absence) indicates that the local producers who adopt supplementation avoid the need for pasture rotation strategies. One potential explanation for the indifferent effect of rotation is the predominance of supplementation during both the rainy and dry seasons, at all the concentrations evaluated. This high technology group can also be observed in the MCA (Fig. 2), with a greater concentration of the variables in the upper right quadrant, in the positive interval (0.0;0.2).
The cluster analysis of the variables indicates that the highest levels of technology evaluated in the present study, are related to the combination of supplementation with low (0.6-1.0 animals/ha) to medium (1.1-2.0 animals/ha) cattle densities. The production units based on the combination of pasture and supplementation obtain the most intensive systems, in comparison with those that invest predominantly in the establishment of pasture.
As for the analysis of the variables, three distinct clusters were observed in the cluster analysis of the production units, i.e., the ranches (Fig. 3). The first cluster (32%) was composed of the low technology units, the second (43%) by the mid-level units, and the third (25%) by the high technology units. These three clusters were well-defined, both by the proximity of the units within each cluster, and the distances between clusters.
The parameters estimated by the beta regression are shown in Table 1. Only the highest cattle density (> 2 animals per hectare) is not statistically significant, even at a 10% level significance. This indicates that the technological indices estimated for the ranches with the highest cattle densities (tl:3) do not vary significantly in comparison with those with the lowest densities (tl:0), the reference variable for this analysis, with all other variables maintained constant. For all other variables of the model, it is possible to verify that there is an increase in the index in comparison with the reference variable, when all others are maintained constant. The low standard error obtained for all the coefficients, except tl:3, indicates a reduced degree of variation when compared with a different model of the same size for this population. The model explains almost all the variance (adjusted R 2 = 98.09%), which indicates that the variables analyzed in the regression have a high degree of explanatory power for the definition of the technological index.
The coefficients of the beta regression were used to calculate the Technology Index (TI), based on the variables with significant explanatory value, which define the productive units of the Vermelho basin. The TI is obtained by:
where β i is the i-th coefficient estimated and x i ∈ {0, 1} is the i-th binary variable that indicates the technological strategies used by each beef-producing unit (0 = absent, 1 = present). Assuming that the sample used to create the index is representative of the production units in the Vermelho basin, and given the inferential capacity of the beta regression model, it is reasonable to conclude that the equation of the TI permits the acquisition of a reliable estimate of the technological level of any production unit within the Vermelho basin. The spatial distribution of the production units according to their technological level, or TI values (Fig. 5 and Appendix III) can be compared with the natural conditions found within each sector of the basin, providing an empirical baseline for the development of further research into the regions beef production systems.
Spatial distribution of the beef production units of the Vermelho basin, in Goiás, Brazil, showing their technological indices (TIs) - 2016.
The findings of the present study indicate that the lower and middle Vermelho River basin encompass larger number of production units with mid to high indices of technology. These sectors are characterized by relief and soil quality that are more appropriate for the implementation of technological practices in comparison with the upper basin, which is reflected in their higher technological indices. These sectors are also characterized by the largest properties, according to the Agricultural Census of 2006, which raises a number of questions with regard to the relationship between natural conditions and the size (area) of the property, and their influence on technological practices.
CONCLUSION
The Multiple Correspondence Analysis provided a reliable approach for the evaluation of the combined set of technological variables, producing a metrical index, derived from a range of qualitative variables, which are important for production systems, as well as the relationships within and among the different groups of variables and production units, based on a cluster analysis. The beta regression analysis provided a predictive equation for binary variables, with a high degree of adjustment (R 2 = 98.09%), allowing for reliable generalizations to the other production systems of the Vermelho basin.
The Multiple Correspondence Analysis identified the principal variables that contributed to the formation of the dimension (principal component 1, which explains 59.9% of the total variance) that represents the technological level of the production units. The dendrograms produced by the cluster analyses of the variables and the production units were each characterized by three, well-separated, homogeneous clusters, consistent with low, mid, and high levels of technology, reflecting the management strategies defined in the interviews with local producers. In particular, the present study indicated that the highest cattle densities (> 2 animals/hectare) can be found on ranches with the lowest technology level, resulting in low productivity and profitability, in addition to impacts on the environment.
The technological index, derived from the measurement of categorical variables, provides an important database for the establishment of public policies for the sustainable development of the Vermelho River basin, the training of personnel operating in the beef cattle sector, and the organization of the productive chain, within a given region, in the context of the specific characteristics of the technological strategies applied in this region, which are determined by the relationship among the principal variables, that is, climate-soil-plant-animal-management.
ACKNOWLEDGMENTS
We are grateful to the Goiás State Research Foundation (FAPEG) for financing the integration program (PRONEX/FAPEG/CNPq - Program for the Support of Nuclei of Excellence, chamada no. 12), which included the study presented here, and to FAPEG and CAPES (Coordination for Higher Education Personnel Training) for student stipends. This study was also supported by the Gordon and Betty Moore Foundation.
REFERENCES
-
1ALVIM JM, BOTREL MA & XAVIER DF. 2002. As principais espécies de brachiarias utilizadas no país. Embrapa Gado de Leite. Juiz de Fora MG. DOC. TÉCNICO 22.
-
2ARMENTERAS D, RODR´IGUEZ N & RETANA J. 2013. Landscape dynamics in northwestern Amazonia: an assessment of pastures, fire and illicit crops as drivers of tropical deforestation. Plos One. DOI: 10.1371/Journal.Pone.0054310.
» https://doi.org/10.1371/Journal.Pone.0054310 -
3ASSOCIAÇÃO BRASILEIRA DAS INDÚSTRIAS EXPORTADORAS DE CARNE (ABIEC). 2016. Frigoríficos. Available at: Available at: http://www.abiec.com.br/2_mapa.asp Access 17 jul. 2016.
» http://www.abiec.com.br/2_mapa.asp -
4CAMIZ S & GOMES GC. 2016. Alternative methods to multiple correspondence analysis in reconstructing the relevant information in a burt’s table. Pesquisa Operacional, 36(1): 23-44. doi.org/10.1590/0101-7438.2016.036.01.0023.
» https://doi.org/10.1590/0101-7438.2016.036.01.0023 -
5DIAS LCP, PIMENTA FM & SANTOS AB ET AL. 2016. Patterns of land use, extensification, and intensification of Brazilian agriculture. Global Change Biology. DOI: 10.1111/GCB.13314.
» https://doi.org/10.1111/GCB.13314 -
6ESCOFIER B & PAGES J. 1994. Multiple factor analysis (AFMULT package). Computational statistics & data analysis, 18(1): 121-140. http://dx.doi.org/10.1016/0167-9473(94)90135-X
» http://dx.doi.org/10.1016/0167-9473(94)90135-X -
7FERRARI SLP & CRIBARI-NETO F. 2004. Beta regression for modelling rates and proportions. Jounal of Applied Statistic, 31: 799-815.
-
8GOMES RC, NUNES AJC & MARINO CT ET AL. 2015. Medeiros SR Estratégias alimentares para gado de corte: suplementação a pasto, semiconfinamento e confinamento. In: Nutrição de bovinos de corte fundamentos e aplicações. Org. MEDEIROS SR, GOMES RC, BUNGENSTAB DJ. Embrapa Gado de Corte. Brasília.
-
9GREENACRE M. 2007. Correspondence Analysis in Practice. Barcelona, Chapman and Hall/CRC.
-
10GUEDES TA, IVANQUI IL & MARTINS ABT ET AL. 2008. Seleção de variáveis categóricas utilizando análise de correspondência e análise procrustes. Acta Scientiarum. Technology, 21: 861-868.
-
11HAIR JR JF, ANDERSON RE & TATHAM RL ET AL. 2005. Análise multivariada de dados. Trad. Adonai Schlup Sant’Anna e Anselmo Chaves Neto. Porto Alegre: Bookman.
-
12INSTITUTO BRASILEIRO DE GEOGRAFIA E ESTAT´ISTICA (IBGE). 2006. Economia. Censo agropecuário. Available at: Available at: http://www.ibge.gov.br/home/estatistica/economia/agropecuaria/censoagro/default.shtm Access: Mar 05, 2015.
» http://www.ibge.gov.br/home/estatistica/economia/agropecuaria/censoagro/default.shtm -
13INSTITUTO MAURO BORGES (IMB). 2017. Perfil dos municípios goianos. Available at: Available at: http://www.imb.go.gov.br/ Acesso em: 10 fev. 2017.
» http://www.imb.go.gov.br/ -
14JBS SA. 2016. Confinamentos. Disponível em: Disponível em: http://www.jbs.com.br/pt-br/content/confinamento Access 13 ago. 2016.
» http://www.jbs.com.br/pt-br/content/confinamento -
15KUBRUSLY LS. 2001. Um procedimento para calcular índices a partir de uma base de dados multivariados. Pesquisa Operacional, 21(1): 107-117. http://dx.doi.org/10.1590/S0101-74382001000100007
» http://dx.doi.org/10.1590/S0101-74382001000100007 -
16MACHADO LEG & LIMA CVL. 2011. Compartimentação geomorfológica da basin hidrográfica do Rio Vermelho (GO), utilizando imagens ASTER. In: Simpósio Brasileiro de Sensoriamento Remoto - SBSR, 2011, Curitiba. Anais... São Paulo, Instituto Nacional de Pesquisa Espacial, p. 8231.
-
17MANGABEIRA JAC ET AL. 2002. Tipificação de sistemas de produção rural: a abordagem da análise de correspondência múltipla em Machadinho d’Oeste-RO. Campinas: EMBRAPA, 2002. 26 p. (Circular Técnica, 8).
-
18MIZIARA F. 2006. Expansão de fronteiras na ocupação do espaço no cerrado: o caso de Goiás. In: Guimarães LD, Silva MAD, Anacleto TC. (Org.). Natureza Viva Cerrado. Goiânia: UFG, 169-196.
-
19OECD-FAO. 2015. Overview of the OECD-FAO Agricultural outlook 2015-2024. http://dx.doi.org/10.1787/agr_outlook-2015-4-en
» http://dx.doi.org/10.1787/agr_outlook-2015-4-en -
20COSTELLO AB & OSBORNE JW. 2005. Best practices in exploratory factor analysis: Four recommendations for getting the most from your analysis. Practical Assessment, Research & Evaluation, 10(7): 1-9.
-
21PAGÈS J. 2014. Multiple Factor Analysis by example using R. CRC Press.
-
22POPPI DP & MCLENNAN SR. 1995. Protein and energy utilization by ruminants at pasture. J. Anim.Scien., 73: 278-290.
-
23PUNJ G & STEWART DW. 1983. Cluster analysis in marketing research: Review and suggestions for application. Journal of Marketing Research, p. 134-148. DOI: 10.2307/3151680
» https://doi.org/10.2307/3151680 -
24REIS RA ET AL. 2009. Suplementação da dieta de bovinos de corte como estratégia do manejo das pastagens. R. Bras. Zootec., Viçosa, 38: 147-159.
-
25ROBINSON TP, WINT GRW & CONCHEDDA G ET AL. 2014. Mapping the Global Distribution of Livestock. PLoS ONE. doi: 10.1371/journal.pone.0096084.
» https://doi.org/10.1371/journal.pone.0096084 -
26SANT’ANNA AMO & CATEN CST. 2010. Modelagem da fração de não-conformes em processos industriais. Pesquisa Operacional, 30(1): 53-72. doi: 10.1590/S0101-74382010000100004.
» https://doi.org/10.1590/S0101-74382010000100004 -
27SECRETARIA DA FAZENDA (SEFAZ). 2014. Lista de frigoríficos. Available at: Available at: http://www.sefaz.go.gov.br/tare/consultaTaresFrigorificos/Lista_de_Frigor\%C3\%ADficos.pdf Access on: Dec 17, 2014.
» http://www.sefaz.go.gov.br/tare/consultaTaresFrigorificos/Lista_de_Frigor\%C3\%ADficos.pdf -
28WARD JR JH. 1963. Hierarchical grouping to optimize an objective function. Journal of the American Statistical Association, 58(301): 236-244.
Appendix I
Appendix II
Appendix III
Publication Dates
-
Publication in this collection
Jan-Apr 2018
History
-
Received
14 Nov 2017 -
Accepted
04 Mar 2018