Abstract
Since 2012 we have tracked general chemistry student success rates at the University of Utah. In efforts to improve those rates we have implemented math prerequisites, changed our discussion session format, installed some metacognitive exercises aimed at the lowest quartile of students and instituted a flipped classroom model. Furthermore, using Item Response Theory we have identified what topics each individual student struggles with on practice tests. These steps have increased our success rates to ~76%. As well, student performance on nationally normed American Chemical Society final exams has improved to a median of 86 percentile. Our lowest quartile of students in spring 2016 scored at the 51 st percentile, above the national median.
Keywords:
Item Response Theory; Dunning-Kruger effect; classroom management; metacognition; flipped classroom
INTRODUCTION
At the University of Utah, we determined that success in introductory chemistry is an excellent predictor of success in other college or university classes. Since 2012 we have tracked student success rates at the University of Utah, defining success as making a grade of C- or higher. From 2000-2012 our success rates have varied from a low of 64% to a high of 86% with an average of 77.5%. During this time period, students who failed general chemistry were tracked in their subsequent academic performance. Using this information, we determined that of the students who fail CHEM 1210 (General Chemistry I) 61.2% never retake the class, 13.4% retake and fail again, leaving only 25.4% of these students who pass the class after failing the course the first time. Even more troubling, failing chemistry is highly predictive of poor graduation rates: 6-year graduation rates for students who make a D, F, or W in CHEM 1210 were found to be 44%, 35%, and 34%, respectively.
To improve our success rate, two early changes were made to course structure and requirements. First, we enforced data based MATH prerequisites equivalent to that of college algebra. Additionally, attendance at TA help sessions was required by making it count 10% of the total grade. These two initial changes immediately improved our success rate by 9.5% while not decreasing yearly student enrollment.
Afterwards, our attention was drawn to the lowest quartile of students, who still experienced poor test scores in spite of the above mentioned changes. To meet these students' needs, we decided to employ metacognitive training to help these students understand their chemistry ability levels before exams. Metacognition is characterized as "thoughts about one's own thoughts and cognitions." 11 Dunlosky, J.; Metcalfe, J.; Metacognition, Sage Publications: Thousand Oaks, 2009. Within metacognition are two overarching concepts: metacognitive monitoring, "assessing or evaluating the ongoing progress or current state of a particular cognitive activity" and metacognitive control, "regulating an ongoing cognitive activity, such as stopping the activity, deciding to continue it, or changing it midstream."11 Dunlosky, J.; Metcalfe, J.; Metacognition, Sage Publications: Thousand Oaks, 2009. Together, these concepts represent flow of metacognitive thought during the learning process: a student assesses the learning process by comparing the current level of learning to desired levels of understanding, subsequently adjusting the learning process to achieve these goals.
Dunning and Kruger demonstrated that while metacognitive ability in high-achieving individuals is also high, metacognitive monitoring is low among individuals whose performance is low. In this study, individuals completed tests measuring their ability in various psychology tests. After being shown their scores, individuals were asked to rank themselves in their ability compared to their peers. The study found that the high-performing group estimated their rank accurately, but "participants scoring in the bottom quartile...grossly overestimated their test performance and ability."22 Kruger, J.; Dunning, D.; Journal of Personality and Social Psychology, 1999, 77, 1121. This occurrence has recently been demonstrated within chemistry: students in a general chemistry course took exams and estimated their percentile ability on the test relative to the other students. As predicted, the students in the bottom quartile overestimated their ability while students in the top quartile tended to underestimate their ability. 33 Pazicni, S.; Bauer, C. F.; Chem. Educ. Res. Pract. 2014, 15, 24. This trend has been demonstrated more recently among introductory chemistry students, with results indicating that poor prediction ability remains generally stable from one test to the next.44 Hawker, M. J.; Dysleski, L.; Ricky, D.; J. Chem. Educ. 2016, 93, 832.
In 2000, it was noted that "if the goal of enhanced student understanding of chemistry is to be achieved, chemistry instructors will need to include instruction on the use of relevant thinking strategies in their courses. Infusion of teaching of metacognitive skills in subject matter areas, in addition to general teaching of metacognitive skills in schools, is a promising approach to helping students learn to use their content knowledge more appropriately and flexibly." The paper also noted the need to improve research into assessing metacognitive ability, improving metacognition in problem solving, and improving metacognitive ability with regard to content knowledge.55 Ricky, D.; Stacy, A. M.; J. Chem. Educ.
2000, 77, 915. Since that time, research in chemical education has focused on building assessments of metacognitive abilities in problem solving and improving metacognition in problem solving.66 Siburt, C. J. P.; Bissell, A. N.; Macphail, R. A.; J. Chem. Educ.
2011, 88, 1489.
7 Solaz-Portolés, J. J.; Quim. Nova
2010, 33, 1403.
8 Cooper, M. M.; Sandi-Urena, S.; J. Chem. Educ.
2009, 86, 240.
9 Cooper, M. M.; Sandi-Urena, S.; Stevens, R.; Chem. Educ. Res. Pract.
2008, 9, 18.-1010 Cardellini, L.; Revista de Educación en Ciencias
2001, 2, 84. In regard to improving metacognitive ability related to content knowledge, research has been more limited. These studies have mainly focused on having students take a single practice test before the final assessment, with mixed results in improving test scores.1111 Schelble, S.M.; Wieder, M.J.; Dillon, D.L.; Tsai, E.; ACS Symp. Ser.
2014, 1182, 67.,1212 Knaus, K. J.; Murphy, K. L.; Holme, T. A.; J. Chem. Educ.
2009, 86, 827.
The most successful study that improved metacognition in content knowledge used SAT critical reading test scores to place students into two categories—low and high language comprehension. These students then either received "elaborative interrogation" pretests, having students explain in depth the concepts, or multiple-choice pretests before taking the midterm. The control class gave the students midterm exams without any pretests. Results indicated that providing students with multiple choice pretests significantly improved all students relative to the control, with the greatest gains being among low language students.1313 Pyburn, D. T.; Pazicni, S.; Benassi, V. A.; Tappin, E. M.; J. Chem. Educ. 2014, 91, 2045.
Outside chemical education, one key study demonstrates how regular metacognitive training can improve student test scores. In this study, a section of undergraduate educational psychology students were regularly trained in metacognitive monitoring and control. Each week, students were given a worksheet to rate their understanding of the day's content. Students assessed which concepts were difficult and determined what they would do to improve understanding. Finally, they took a number of quiz questions and practiced rating their ability on these questions. Later, students were given feedback on the accuracy of their monitoring. A control section of the course received the same course content but did not receive the weekly metacognitive training. In the exams for both classes, students rated how confidently they felt about their answers for each question. Results of the first test demonstrated no significant difference between the two sections' score or monitoring ability. However, as the semester continued, students in the treatment section demonstrated significant improvement in accuracy predictions and test scores compared to the control.1414 Nietfeld, J. L.; Cao, L.; Osborne, J. W.; Metacognition Learning 2006, 1, 159.
From these studies, we determined several aspects necessary to improve student metacognitive ability in test taking: practice tests before the actual test, prediction of ability and detailed feedback on prediction accuracy, regular self-assessment of ability by topic, making plans to improve ability by topic, and receiving feedback regarding this self-assessment.
In addition to metacognition, a flipped classroom model has recently been demonstrated to improve student performance within chemical education research. In the flipped classroom structure, the 'lecture' aspect of the course is shifted outside of class, represented by videos watched by students on their own time. During class, students focus on problem solving skills, with the instructor providing support during the problem solving process.1515 Christiansen, M. A.; J. Chem. Educ. 2014, 91, 1845. This setup of the classroom has been shown to improve student performance on homework and exams without increasing the time that students spend outside of class on chemistry.1616 Weaver, G.C.; Sturtevant, H.G.; J. Chem. Educ. 2015, 92, 1437.
We analyze students' abilities on specific topics using item response theory (IRT). IRT is a paradigm of psychometric test analysis that is an improvement on other analyses such as Classical Test Theory because it treats questions within a test as having different relative difficulties and abilities to discriminate. This allows for more accurate scoring as well as more effective test administration. Different forms of the same test, such as used for the GRE or SAT, can be directly compared to one another.1717 An, X.; Yung, Y.-F.; Proceedings of the SAS Global Forum 2014 Conference, Washington, 2014. IRT has been previously used in chemical education to identify difficult topics across an entire class2020 Schurmeier, K. D.; Atwood, C. H.; Shepler, C. G.; Lautenschlager, G. J.; J. Chem. Educ. 2010, 87, 1268.,2121 Schurmeier, K. D.; Shepler, C. G.; Lautenschlager, G. J.; Atwood, C. H.; ACS Symp. Ser. 2011, 1074, 137.. We sought to use IRT to identify difficult topics for each individual student.
To improve our students' metacognitive ability, we implemented a series of practice tests in the course to train students in metacognitive analysis of their pre-exam abilities. In this homework system, students were required to make initial estimates of their test scores. Students then received a detailed analysis, based upon IRT, of their practice test performance showing what topics they do and do not understand. Finally, students used this feedback to build study plans, highlighting topics they would focus their study time on. In the control course, students completed the same practice tests and received the same IRT feedback but did not receive metacognitive training through score prediction or the creation of study plans. To compare student performance between the two years, IRT was used to determine students' ability on an exam. Afterward, IRT Equate software was used to compare student abilities from one year to the next. Results indicate a significant improvement in equated test performance as a result of the practice tests and feedback. After, student scores between the control and treatment section were split by quartile and compared. Results indicate that the bottom quartile of students experienced between 2-4% improvement in exam performance compared to the control course.
Our most recent step was to utilize a flipped classroom model, embedding videos and textbook sections in 'preview' homework assignment questions for students to complete before class. This model, in conjunction with the implementation of the practice tests, improved success rates by 6.5% compared to the previous year. In the body of this paper we will show how each of these steps was designed, implemented, and provide a statistical analysis of the results.
EXPERIMENTAL
Pre-requisites
To determine factors that were most predictive of student success in general chemistry, data was obtained from the university regarding student performance between 2000 and 2012 school years. For each set of data, students' final grades in general chemistry I (GC1) were compared to math test scores from high school and university math and other course grades students received before taking the course.
Results indicated that ACT math and SAT math scores were highly correlated to GC1 pass rate. ACT math score had the greatest correlation (R2 = 0.936, p < 0.001, Figure 1) to pass rate. Results of the SAT Math scores demonstrate a similar correlation between test score and pass rate (R2 = 0.759, p < 0.001). Both results indicate that at the University of Utah, incoming high school math scores are highly predictive of chemistry pass rates.
After these results were determined, university math grades were reviewed and compared to ACT math scores. The goal of this process was to identify courses that students with poor incoming math skills could take to improve their math and/or chemistry abilities before coming into the GC1 course.
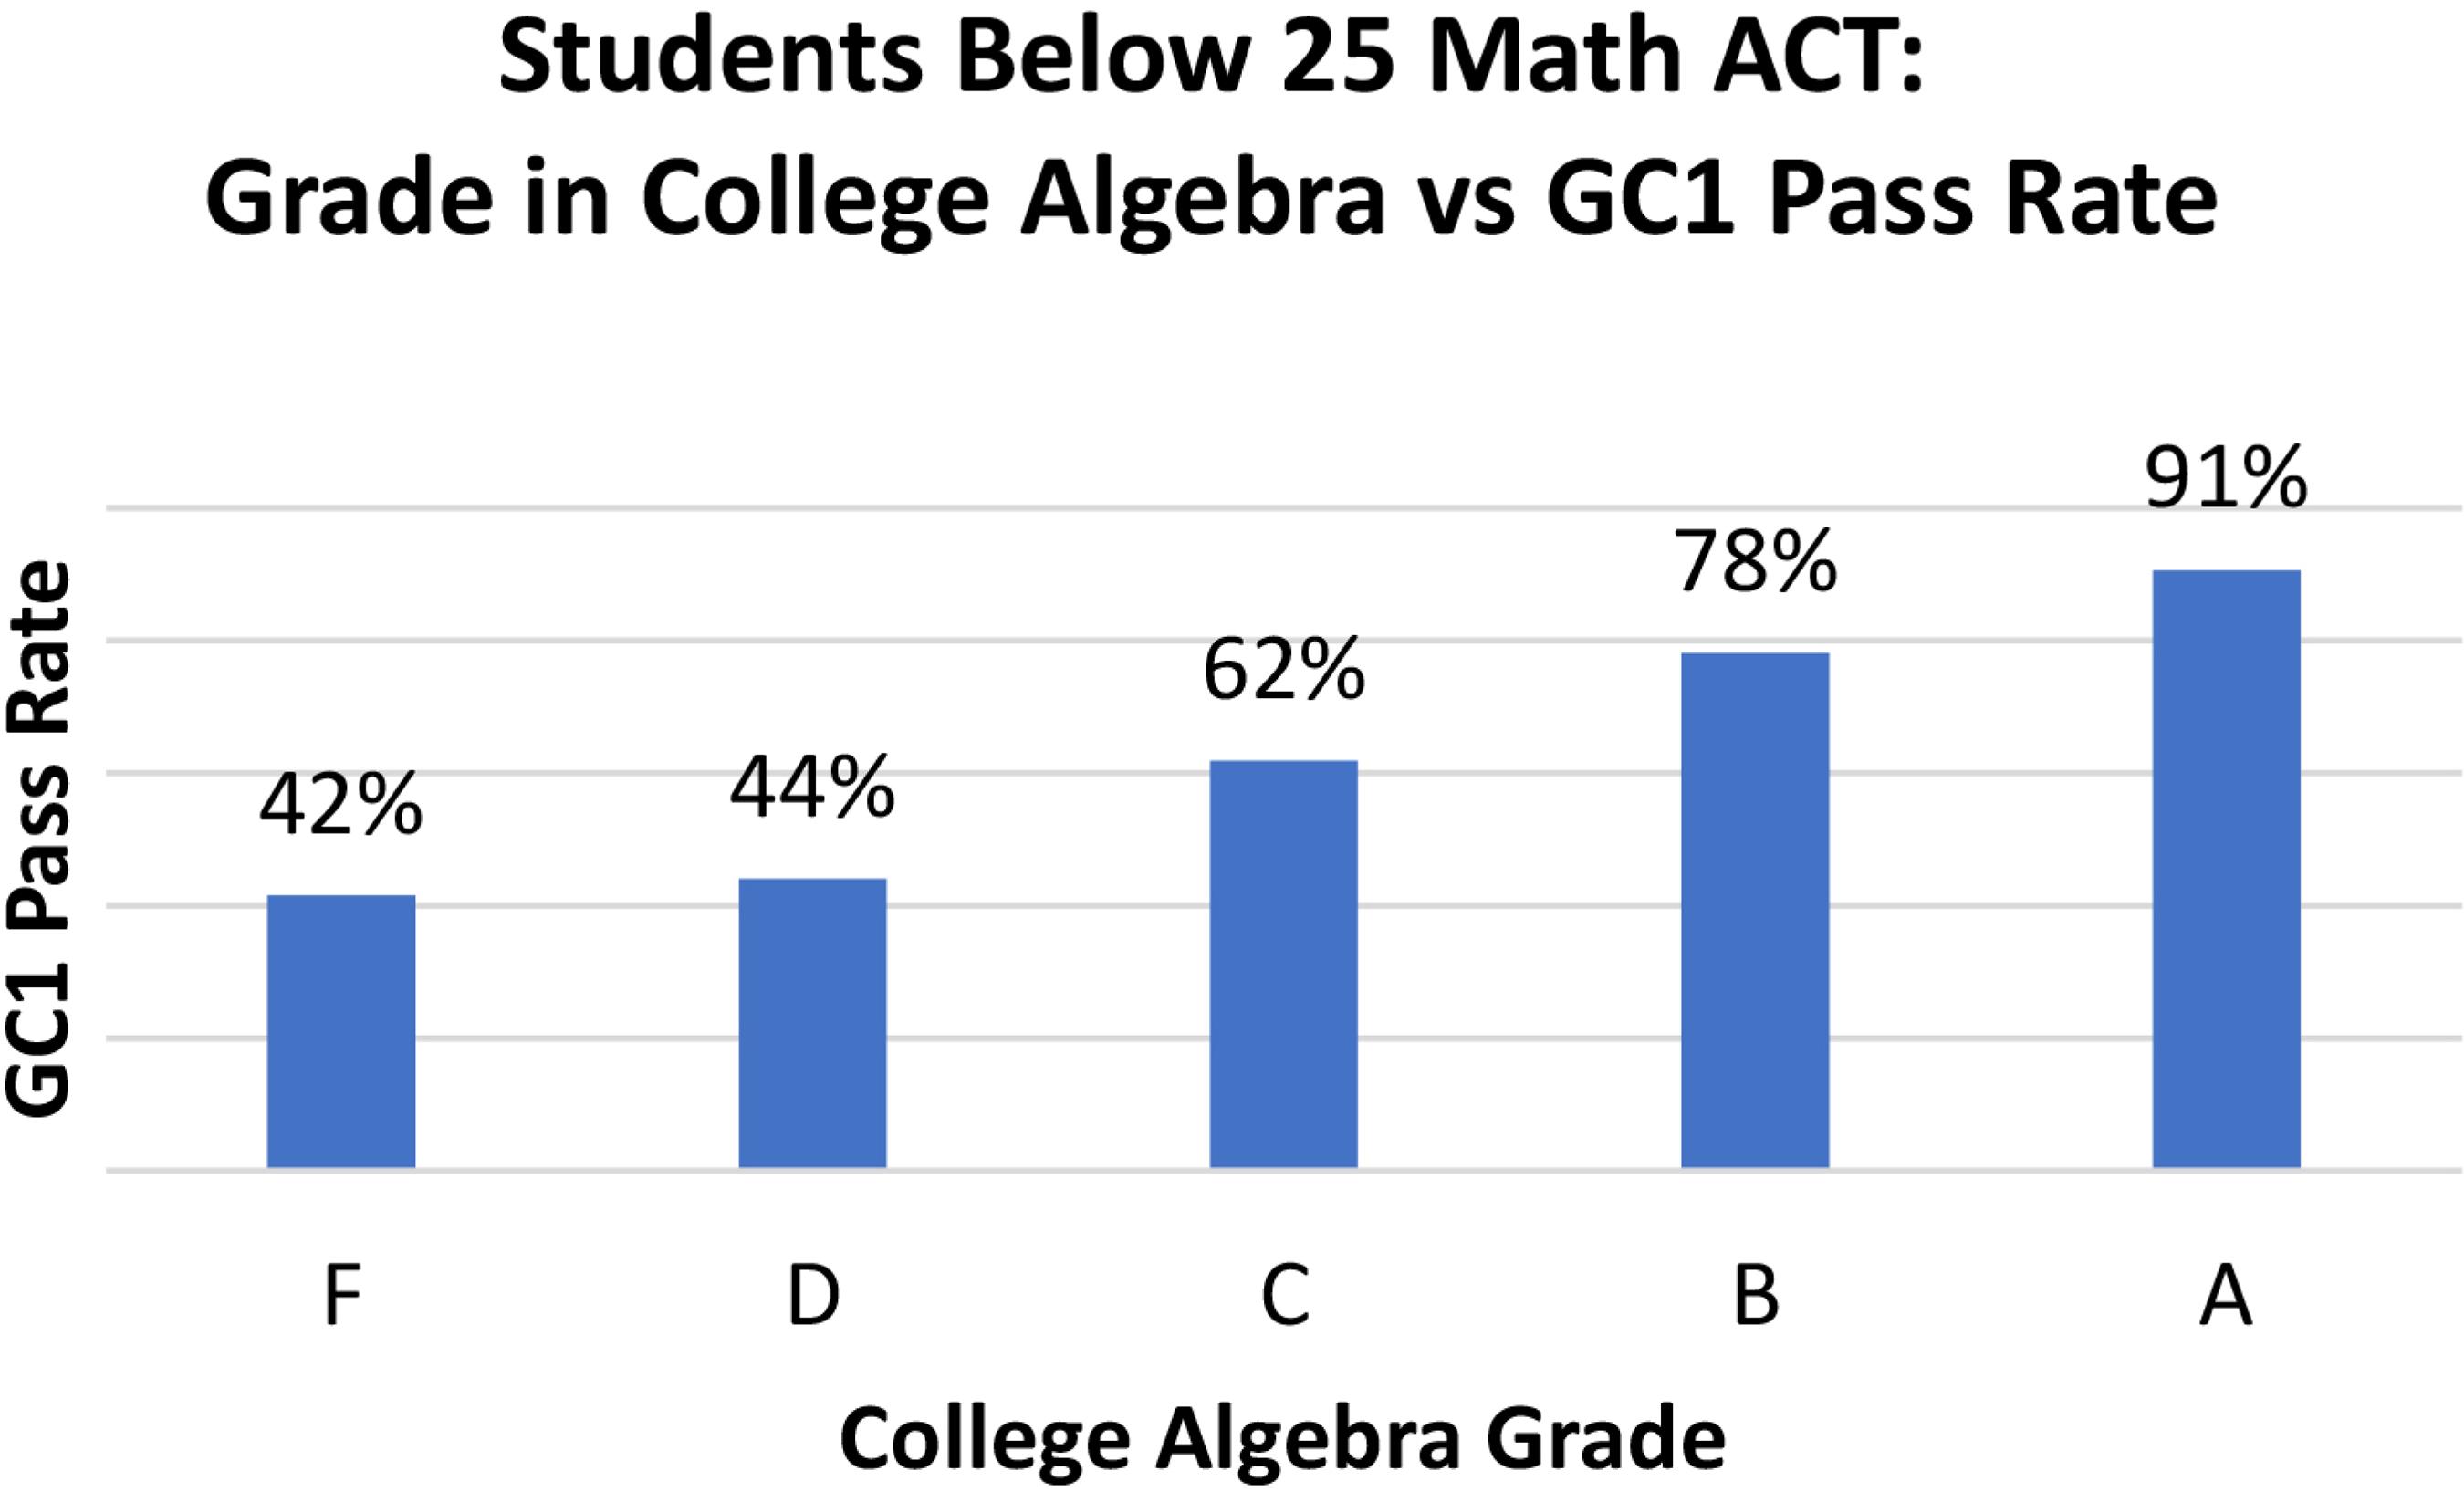
To simplify the analysis, students scoring below 25 on the Math ACT were considered to be at risk, while students scoring 25 and above were considered prepared to enter GC1. For at risk students, passing college algebra seemed to appreciably improve GC1 pass rates (Figure 2). Only 42.4% of these students who failed college algebra ultimately passed GC1, while passing college algebra dramatically improves at-risk students' likelihood of passing GC1: an 81.8% overall pass rate.
These results indicate that incoming math test grades are highly predictive of students' pass rates in general chemistry. However, for students that are at-risk of failing based on poor math test scores, passing college algebra at the university level overcomes this challenge helping to better prepare these students for entering GC1.
Mandatory attendance
During the spring 2014 semester, survey results on demographic, test score, and university grade data were obtained to predict factors correlated to passing GC2. Results indicated that end of semester final GC2 grades were highly correlated to the grade received the previous semester in GC1 (R2 = 0.456, p < 0.001). Using this data, students were retro-actively split at the end of the semester into three grade categories based on their incoming GC1 grade: at-risk, average, and above average (Figure 3).
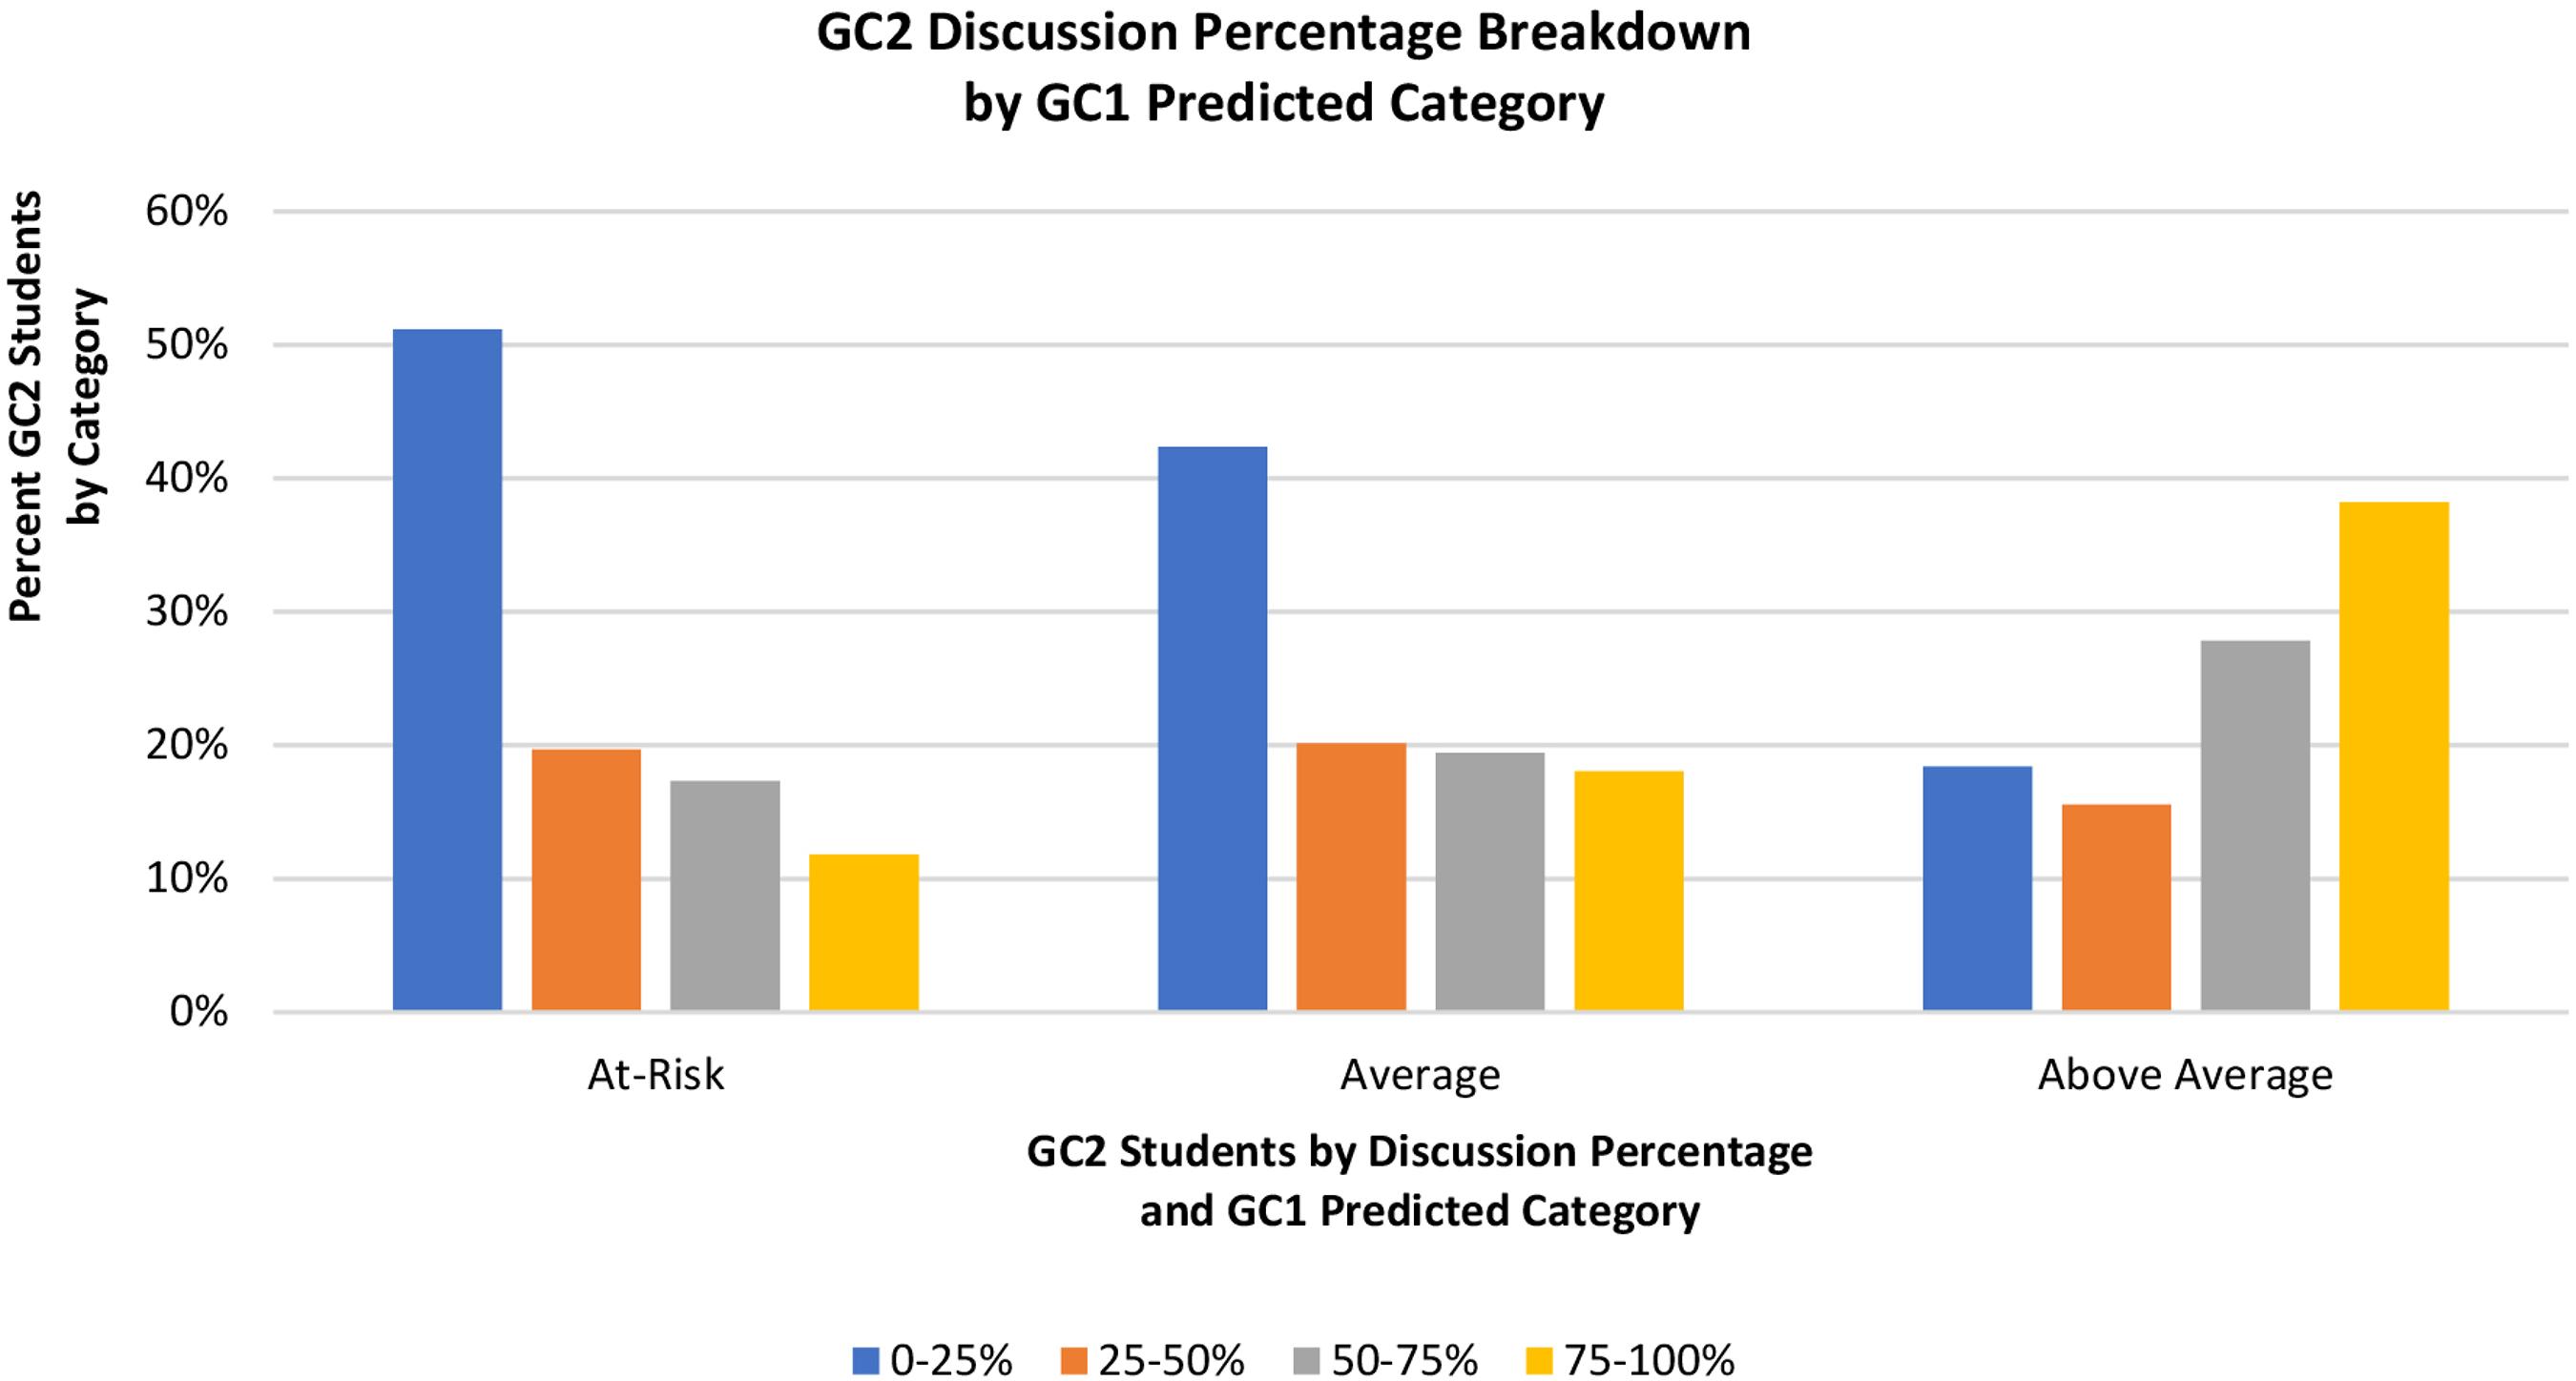
At the end of the semester, students' GC2 grade data was analyzed to find highly indicative factors of at-risk students passing the course. In this analysis, students' incoming general chemistry I grades were compared to their attendance at TA led help sessions during the semester. For ease of analysis, help session scores were split into four categories based on the total percent of points received in the sections: 0% to 25%, 25% to 50%, 50% to 75%, and 75% to 100%. Results indicated that at-risk and average students over-represented those students receiving between 0% and 25% of the possible help-session points (Figure 4).
End of semester discussion percentage in GC2 compared to GC1 grade prediction category. Note the over-representation of students receiving 0-25% of discussion points for at-risk and average students (N = 483)
When these results were compared to students' end of semester grade, they demonstrated a statistically significant (p < 0.001) correlation between discussion attendance and pass rate for students deemed as 'at-risk.' Our findings indicate that at-risk students are least likely to attend discussion when not required. However, results also indicate that at-risk student pass rate improved dramatically as percentage of earned discussion points increased. (Figure 5).
GC2 pass rate compared to discussion percentage in GC2 and GC1 grade prediction category. Note the significant improvement in pass rate for at-risk students who regularly attended discussion (N = 483)
Based on these findings, attendance in discussion was made mandatory by inclusion in the final grade calculation. Additionally, math and course prerequisites were set in place for students to enroll in GC1.
Metacognitive training and IRT feedback
During the fall 2015 semester, a test review system was implemented with the goal of improving student performance on exams. The system consists of a series of practice tests that the students took the week before each exam. Like the exams themselves, these practice tests were taken online using the testing platform we have created in collaboration with Madra Learning. Counting the practice tests towards the students' homework grade encouraged participation. Practice tests were created to mirror the respective exams as closely as possible in terms of material covered, overall difficulty, question format and the ratio of number of questions to available time. The students were given a 48 hour period in which to take each practice test. At the end of each 48 hour period, practice test results were analyzed using IRT and feedback was provided to the students (Figure 6).
Test Review System. Students take a series of pre-tests the week before each midterm exam. After the exam closes, students receive feedback letting them know what topics they should focus on
For students in the treatment section, practice tests also included questions before and after taking the test where students predicted their ability by question topic. Additionally, students predicted the score that they would receive on the test. Students were given a separate homework score based on how accurate their prediction score was to their actual score.
After the 48 hour test session closed, IRT was used to determine each student's overall ability as well as their ability on each exam topic. The IRT analysis was conducted on Bilog-MG3 software using Marginal Maximum Likelihood Estimation (MMLE). MMLE is an iterative process in which the question parameters are successively estimated, compared to the data being modeled and changed to correspond more closely with it.1919 Johnson, M. S.; Journal of Statistical Software 2007, 20, 1. All of the student abilities are integrated to form a normal distribution by "chunking" similar-scoring students into quadratures. Each individual student's response to a question is assumed to be randomly sampled from its quadrature allowing question difficulty to be estimated independently of student ability.1818 Ayala, R. J.; The Theory and Practice of Item Response Theory, The Guilford Press: New York, 2009.Bilog-MG3 then estimates student abilities by fitting each student's responses to the calculated question difficulties using Maximum Likelihood Estimation (MLE). MLE calculates the likelihood (L) of a student with a particular ability producing their actual set of correct and incorrect responses. L is obtained by multiplying the individual question probabilities for a student with this ability: P(θ,a,b,c) for a correct response and 1-P(θ,a,b,c) for incorrect. L is thus a function of student ability since each question's probability is also a function of ability. The maximum of this likelihood function is the student's ability and is calculated by iterating through a series of θ values and calculating L for each.1818 Ayala, R. J.; The Theory and Practice of Item Response Theory, The Guilford Press: New York, 2009.
Overall ability was determined using student responses on all of the questions on a given test. Then, to calculate student ability on individual topics, test questions were divided by topic. For example, the second test of General Chemistry 1 covered nomenclature, bonding and some of the basics of quantum mechanics. Student responses to only those questions involving bonding were separated from the rest and analyzed using Bilog-MG3 to calculate the student ability on that topic. Questions were also divided based on whether they involved problem solving or were more conceptual in nature to determine student ability in these areas.
Students' IRT abilities by topic were then generated. A sample of these scores is shown in Table 1. In general, IRT abilities have a standard deviation of approximately 1.0 with an average of zero, and a positive score is considered above average ability. As such, abilities greater than 1.5 (1.5 standard deviations above average) were considered as 'well above average,' 1.5 to 0.5 as 'above average,' 0.5 to -0.5 as 'average,' -0.5 to -1.5 as 'below average' and less than -1.5 as 'well below average.' Student topic abilities were then converted into a Likert scale making them easier for students to understand. Some students, such as Student I, had a high overall ability and no weaknesses on any topic; others, like Student XII, were weak in every area. Finally, some students were high ability in one or more areas and low ability in others such as Student VI. This student scored slightly above average on naming and excelled on bonding but was still slightly below average overall because he/she scored so poorly on quantum.
Student’s IRT abilities by first practice test topic. Abilities were translated to Likert-scale categories for ease of student interpretation
After each practice test closed, students were emailed Likert scale scores of their overall ability and their abilities on each topic. This process was repeated for each practice test during the week prior to each midterm exam. For students in the treatment section, brief study plans were completed where they indicated their areas of strength and weakness and selected specific areas to focus their studying. They also chose from several study methods to improve their topic ability.
In summary, both sections received the same practice tests and IRT feedback. Additionally, the treatment section were required to predict their practice test scores, and these students also made study plans to improve their ability in areas of weakness. In the control section, students did not predict scores or create study plans.
IRT Equating Method
Each exam contained 20 or 25 questions. Of these, 5 to 10 were reused from one year to the next while the remaining questions differed. Because the tests differed from year to year, IRT equating was used to compare the exams and put student scores on the same scale. This process resulted in a prediction of how students would have scored if they were given the previous year's exam.
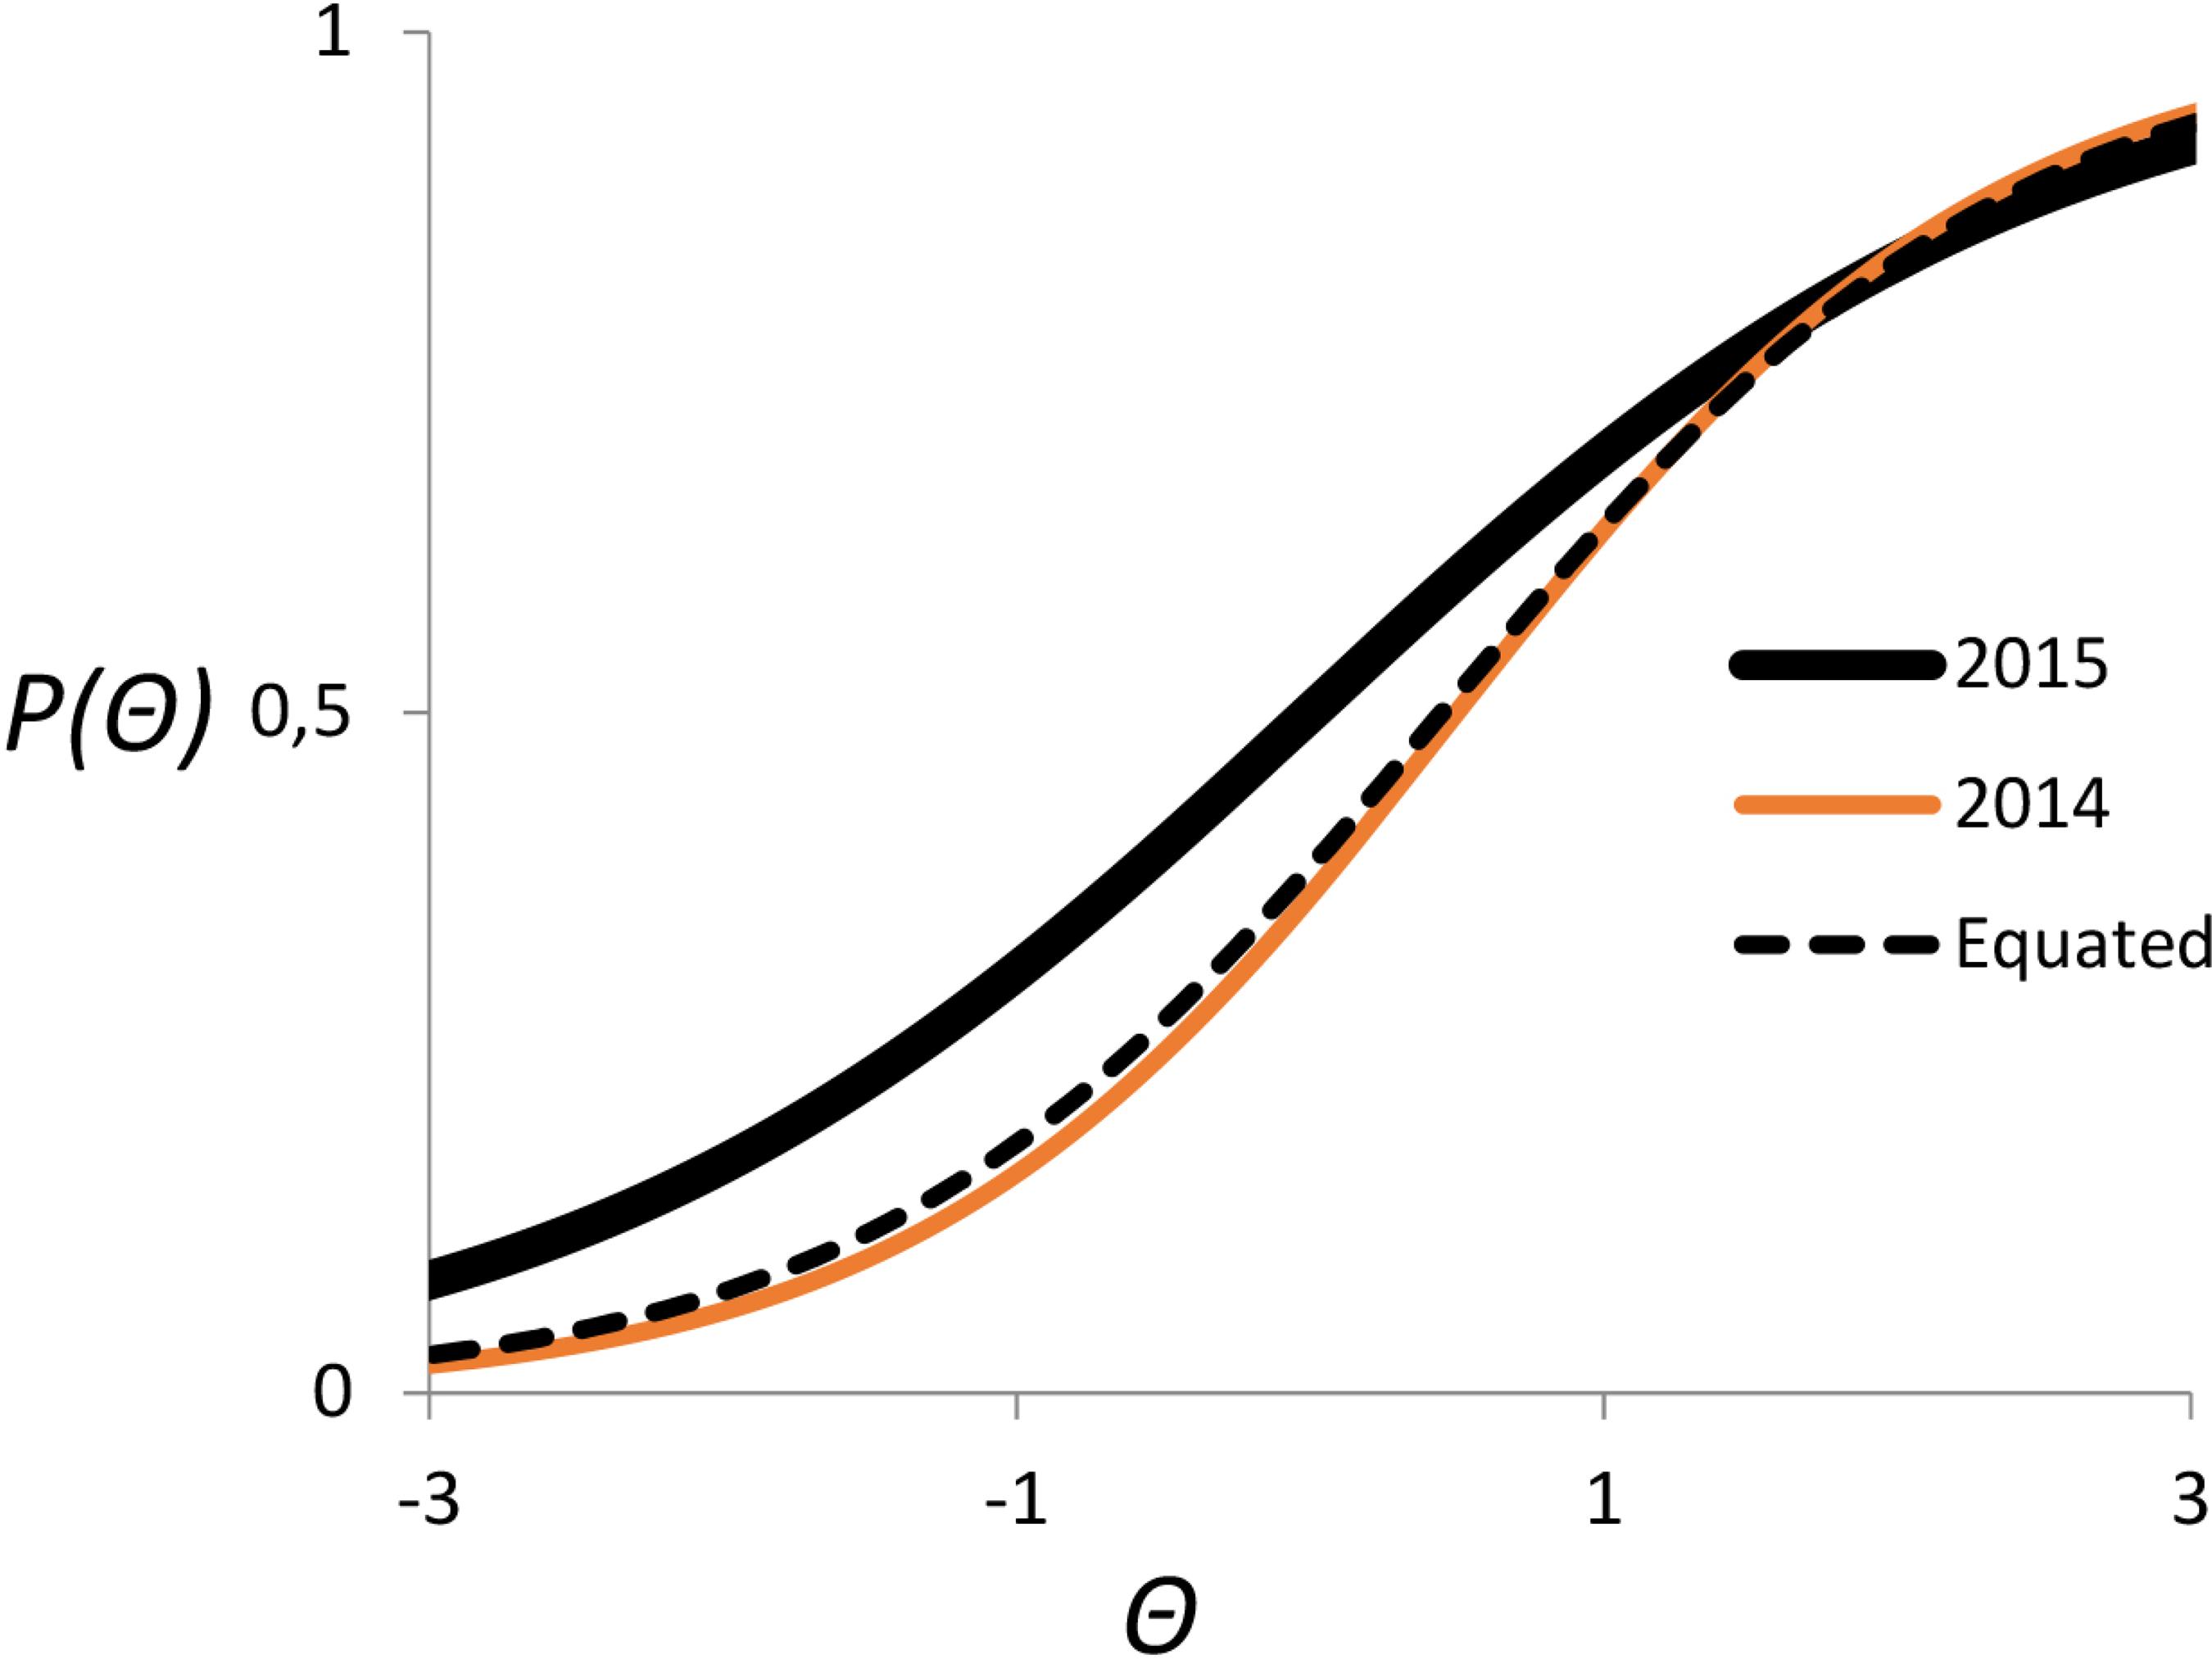
Exams were equated using the Stocking and Lord method of equating total characteristic curves.2424 Stocking, M. L.; Lord, F. M.; Applied Psychological Measurement 1983, 7, 201. In this process, the 5 to 10 conserved questions acted as anchor points. The IRT equate software first compared the calculated IRT question parameters for each year on these particular questions. After, the program converted the IRT question parameters and student abilities from one year onto the IRT scale of the other year. Item characteristic curves (ICC) for the conserved questions were summed, resulting in a total characteristic curve (TCC). The total characteristic curves for each year are then compared and a linear regression is created to transform one TCC onto the other. This regression equation was then used to calculate the equated question parameters and student abilities (Figure 7).
IRT total characteristic curves (TCC) comparison for 2014 and 2015. The graph demonstrates the process of equating these curves for IRT ability comparison from 2014 to 2015
Flipped classroom and practice tests
During the spring 2016 semester in the GC2 course, the Madra Learning homework system was used to implement a flipped classroom homework system. As part of this system, students were required to complete 'preview' assignments before each lecture. These preview assignments first directed students to the relevant portions of the textbook to prepare for the upcoming class. After, students watched one or more short videos on the concepts that were covered on the upcoming 'lecture' topic. Finally, students completed a few basic questions that guided them through the concepts. For videos that were more calculation intensive, the questions following the video guided students through several steps of a sample calculation.
During the class portion, the professors did little to no lecturing on the concepts. Instead, clicker response devices were employed throughout the class on questions that focused on problem solving and conceptual understanding of the material. At the end of each week, students completed a weekly assignment on the previous week's concepts as well as completing practice tests the week before each exam.
RESULTS AND DISCUSSION
Pre-requisites and mandatory attendance
During fall 2014 semester, prerequisites were set in place to ensure that students had adequate math ability before entering the course. Additionally, attendance at the TA help sessions was made a mandatory portion of the course.
To analyze the effect of this change, the students took the ACS GC1 final each year. As part of the comparison, raw numbers of questions correct were converted to national percentile scores. To analyze the effect of the change on all students in both years, results included any zero and missing scores. For this and all other analyses, a two-tailed t-Test was performed assuming equal variance. As part of the calculation, p values were obtained, representing the likelihood that the result was due to chance. As such, p values less than 0.05 were considered statistically significant. Test score comparisons indicated a statistically significant increase (p < 0.001, Figure 8) in performance on the ACS final: averaging 60.95 percentile in fall 2013 and 68.08 percentile in fall 2014. Note that these scores include any missing or zero scores.
Comparison of the nationally normed ACS final exam scores for GC1 Fall 2013 to GC1 Fall 2014 semesters
Pass rates were then determined and compared for the fall 2013 and fall 2014 semester. To exclude any direct effect of the attendance requirement for TA help sessions on student grades, course grades were calculated as students' average test score, with the ACS final exam weighted twice as much as the midterms. A passing grade was set as having greater than 64% average test score: this average test percent minimum best matched the reported pass rate during the fall 2014 semester. Test average scores demonstrate that 62.6% of students passed in 2013, while 72.1% of students passed in 2014: an increase of 9.5% in pass rate.
Due to the implementation of prerequisites, student enrollment during the fall 2014 semester decreased approximately 7.5% between the fall 2013 and the fall 2014 semesters. However, because the improvement in pass rate was greater than the drop in enrollment, the drop in enrollment cannot be exclusively responsible for the improvement in pass rate and exam scores. Importantly, enrollment in subsequent semesters during the overall school year increased relative to the previous school year. Comparing enrollment for the 2013-2014 school year to the 2014-2015 school year demonstrated an increase in enrollment from the 2013-2014 school year to 2014-2015 school year: 1683 were enrolled in the class during the 2013-2014 school year and 1706 students were enrolled during the subsequent school year. These results indicate that the implementation of pre-requisites improved pass rate without decreasing yearly student enrollment.
General effect of practice exams and IRT feedback on student performance
During the fall 2015 semester, practice exams and IRT feedback was employed to prepare students for each exam. Test scores during this semester were compared to test scores during the previous year. Upon initial inspection, test scores from the CHEM 1210 fall 2015 semester changed little from the previous year. The first two exams had slightly higher averages, while the third saw a slight decrease.
Because the exams differed from year to year however, a direct comparison of raw scores is not particularly useful. Using IRT equating to analyze the exam scores provides a more complete analysis. The equated scores column shown in Table 2 indicate the average equated score for the students from the fall 2015 semester year if they had taken the exam given during the fall 2014 semester. These results demonstrate a significant (p < 0.001) improvement in equated scores on all midterms from fall 2014 to equated scores in fall 2015: scores improved 3.9, 5.8 and 12.1 percent for the first, second and third midterm exams respectively. The apparent drop in raw score on the third exam demonstrates that this was a much more difficult test: IRT equate scores correct for this difference in difficulty.
For both the fall 2014 and fall 2015 semesters, the ACS general chemistry final exam was used. As before, raw scores were converted to nationally normed percentile scores. Unfortunately, students did not perform significantly better (p = 0.685) on the final exam during the fall 2015 semester than during the fall 2014 semester.
Metacognitive training
To test the effect of practice tests on metacognition, students in the treatment section were first split into quartiles based on their performance on each midterm. Afterwards, students' predicted scores for each practice test were compared to their actual practice test score. On the first set of practice tests, results indicated that all quartiles overestimated their ability on the first practice test, but by the fourth practice test students were predicting their score on average to within 5% of their actual score (Figure 9). By the final exam practice tests, students on average underestimated their scores (Figure 10). These results indicate that students seem to be improving in metacognitive monitoring, or an awareness of their true ability, as the semester progressed. We attribute this to students taking regular practice tests and predicting their score: by consciously predicting their score, and receiving their actual score in comparison, they were forced to recognize the discrepancy between the two. We hypothesize that this helped students improve their knowledge of their actual ability throughout the semester.
Comparison of students’ accuracy of prediction for the first set of practice tests. Values calculated as predicted score minus actual score
Comparison of students’ accuracy of prediction for the final exam set of practice tests. Values calculated as predicted score minus actual score
To test the effect of metacognitive training on test scores, test averages between the treatment and control sections were compared. On the first exam the treatment section did, on average, 2.53% better on the first midterm (p = 0.015). However, the treatment section, on average, did not do statistically significantly better on the subsequent midterms or the final (Table 3).
Differences in exam averages overall and for the lowest quartile of students between the treatment and control class, calculated as treatment – actual. ***p < 0.001, **p < 0.01, *p < 0.05
To further explore the results, students were split into quartiles based on their performance on each midterm. Overall exam averages and exam averages were calculated for each quartile. These averages were compared between the treatment and control sections by subtracting the average in the control section from the average in the treatment section (Table 3). Results indicated that for the first and third midterm, and for the final exam, the lowest quartile of the treatment course (the bottom 25%) did significantly better than the lowest quartile in the control course. Most importantly, the bottom 25% of the treatment course did 6 percentile better, on average, than the control course. Comparing the performance of the higher performing quartiles of the treatment course to the quartiles in the control course generally demonstrated a difference in exam performance that was not statistically significant. This data suggests that the lowest quartile benefitted most from the metacognitive training.
Unfortunately, this data does not represent all of the details. Different professors taught the treatment and control courses, and the courses were taught at different times. To control for these variations between courses, final exam scores were obtained for the fall 2014 semester, during which both the treatment and control professors taught.
The goal of the statistical analysis was to remove the unique effect of the instructor and class time on student performance in order to isolate the metacognitive training effect on the bottom quartile's exam performance.
To accomplish this, an interaction regression was created to test the effect of the following three variables:
-
Year: the overall effect in comparing fall 2014 to fall 2015 semesters.
-
Class: the overall effect of the difference between the control and treatment professors, independent of the year.
-
Interaction: this represents the change in the average difference between professors from one year to the next for the bottom quartile. As such, this represents the effect of adding metacognitive training to the treatment section.
This process was used to isolate the effect of metacognitive training for the bottom quartile's performance on the ACS final exam. Results of the interaction are summarized in Table 4. Notably, though the class effect was statistically significant (Slope = 4.16, p = 0.022), the interaction effect was not statistically significant (Slope = 3.94, p = 0.277). These results demonstrate that the bottom quartile of the treatment professor in general outperformed the bottom quartile of the control professor by 4.16 percentile on the final exam. In comparison, the effect of the metacognitive training seems to improve student average performance by 3.9 percentile, but this difference was not large enough to be statistically significant.
Interaction regression results, analyzing the bottom quartile on the final exam. The interaction represents the effect of the addition of metacognitive treatment
Initial results indicate that the practice tests with metacognitive training improved the bottom quartile's performance on the final exam when compared to the control class. However, when corrected to remove the effect of the professor and class time, the resulting interaction effects demonstrate that the improvement is not statistically significant.
Flipped classroom
During the spring 2016 semester in GC2, the flipped classroom was implemented as part of the homework system. Notably, the same professors taught GC2 during the spring 2015 and spring 2016 semester. To test the effect of the addition of the flipped classroom homework system, exam scores were compared between the two years. For this portion of the study, Cohen's d effect sizes were calculated. This effect size compares the differences in mean to the 'pooled' standard deviation of the sample. Cohen's d values around 0.2 are considered 'small' effect sizes, around 0.5 are considered 'medium' effect sizes,' and effect sizes around 0.8 are considered 'large' effect sizes.2222 Cohen, J.; Statistical Power Analysis for the Behavioral Sciences, Routledge, 1988
Results indicated a statistically significant improvement in performance in all overall test averages when compared to the previous year. The first midterm experienced an 8.1% improvement in 2016 compared to 2015 (p < 0.001, d = 0.60). The second midterm had an almost identical increase of 8.0% from 2015 to 2016 (p < 0.001, d = 0.47).
Using IRT equate to compare the results demonstrated that this improvement was even more pronounced. The average 2015 equated scores from 2016 were 17.0% and 15.6% higher than the 2016 scores (Table 5). The improvement of both the raw scores and the equated scores indicates that the tests are more difficult than in previous years, but the average student ability increased more than enough to compensate for this increase.
Raw midterm scores comparing spring 2015 to spring 2016. IRT equate was used to convert scores on the spring 2016 semester midterm to theoretical spring 2015 scores
As with other semesters, the ACS final was employed to measure students' general performance. Once more, students' scores were converted to nationally normed percentiles. Results indicated that the final exam performance improved by 6.1 percentile in 2016 compared to 2015 (p < 0.001, d = 0.28, Figure 11). Most significantly, the median score of students in spring 2016 reached the 86 percentile and the median score for the lowest quartile of students was 51 percentile, scoring above the national average.
In the same process as the fall 2014 to 2015 pass rate comparison, students' exam scores were averaged to determine their 'final percent.' Results indicate a significant improvement in student exam average as a result of implementing the flipped classroom homework system (Figure 12). Setting 64% as passing demonstrated that pass rates rose from 69.0% in the spring 2015 semester to 75.7% in the spring 2016 semester: a 6.7% increase in student success rate. These results indicate that enforcing the flipped classroom as part of the homework system significantly improves test performance and student pass rate.
CONCLUSIONS
Since 2012 we have worked to increase general chemistry success rates at the University of Utah. Our initial implementation of prerequisites and mandatory discussion attendance began improving our success rate. In this process it became apparent the lowest student quartile was the real issue. The work of Dunning and Kruger led us to the realization that these students' poor metacognitive skills were their Achilles heel. Consequently, we began the design and implementation of a flipped classroom and metacognitive exercises in our homework/testing system. Using IRT equate, we determined that the implementation of practice tests with IRT feedback significantly improved students' test scores compared to the previous year.
We then compared the treatment section, which received metacognitive training, to the control section that did not. Results of the metacognitive training initially seemed to demonstrate that the bottom quartile of students improved in test scores in the treatment section when compared to the control. However, when these scores were compared to the previous year's results using an interaction study, the results indicated the improvement in test score for the bottom quartile on the final exam was no longer statistically significant. For future studies, we have hypothesized more regular metacognitive training will significantly increase the effectiveness of this study on the bottom quartile's test scores.
Another piece of the puzzle fell into place with the inclusion of videos and text reading embedded in our pre-class homework assignments. Results of the implementation of the flipped classroom homework system demonstrated a significant improvement in test score on each exam, including student percentiles on the ACS nationally normed final exam.
For future studies, we have also looked toward embedding the study cycle within our online homework system. In general, the study cycle involves students previewing the material before coming to class, attending class, and reviewing the material after class. After, students study for and are given frequent assessments. To test the effect of the study cycle on student performance, the researcher prepared a presentation on the study cycle immediately following students' first exam. Students in attendance that day were taught the steps of the study cycle and committed, in writing, to implementing some or all of the steps of the study cycle. In particular, they indicated which aspects of the study cycle they would utilize the remainder of the semester. The students not in attendance that day did not receive the training and were considered the control group. The study demonstrated a significant improvement in later test scores for students receiving training on the study cycle when compared to the control group. 99 Cooper, M. M.; Sandi-Urena, S.; Stevens, R.; Chem. Educ. Res. Pract. 2008, 9, 18.
Our plan is to implement a study cycle based form of the flipped classroom. In this format, students will perform pre- and post-lecture assignments receiving topic based feedback after both assignments. Students will then prepare an online study plan to assist their preparation for future at home studying. Every weekend students will be assigned a computer based quiz that addresses topics covered in class that week. As before, they will be asked to predict their scores prior to taking the quiz. It is our belief that enhanced metacognitive training coupled with a rigorous study cycle will improve our students' success rates.
-
#
This paper was presented in the SBQ - ACS symposium on Chemical Education, held in Goiânia, on May 2016. Publication costs were assisted by INCT Inomat, CNPq process 573644/2008-0
REFERENCES
-
1Dunlosky, J.; Metcalfe, J.; Metacognition, Sage Publications: Thousand Oaks, 2009.
-
2Kruger, J.; Dunning, D.; Journal of Personality and Social Psychology, 1999, 77, 1121.
-
3Pazicni, S.; Bauer, C. F.; Chem. Educ. Res. Pract. 2014, 15, 24.
-
4Hawker, M. J.; Dysleski, L.; Ricky, D.; J. Chem. Educ. 2016, 93, 832.
-
5Ricky, D.; Stacy, A. M.; J. Chem. Educ. 2000, 77, 915.
-
6Siburt, C. J. P.; Bissell, A. N.; Macphail, R. A.; J. Chem. Educ. 2011, 88, 1489.
-
7Solaz-Portolés, J. J.; Quim. Nova 2010, 33, 1403.
-
8Cooper, M. M.; Sandi-Urena, S.; J. Chem. Educ. 2009, 86, 240.
-
9Cooper, M. M.; Sandi-Urena, S.; Stevens, R.; Chem. Educ. Res. Pract. 2008, 9, 18.
-
10Cardellini, L.; Revista de Educación en Ciencias 2001, 2, 84.
-
11Schelble, S.M.; Wieder, M.J.; Dillon, D.L.; Tsai, E.; ACS Symp. Ser. 2014, 1182, 67.
-
12Knaus, K. J.; Murphy, K. L.; Holme, T. A.; J. Chem. Educ. 2009, 86, 827.
-
13Pyburn, D. T.; Pazicni, S.; Benassi, V. A.; Tappin, E. M.; J. Chem. Educ. 2014, 91, 2045.
-
14Nietfeld, J. L.; Cao, L.; Osborne, J. W.; Metacognition Learning 2006, 1, 159.
-
15Christiansen, M. A.; J. Chem. Educ. 2014, 91, 1845.
-
16Weaver, G.C.; Sturtevant, H.G.; J. Chem. Educ. 2015, 92, 1437.
-
17An, X.; Yung, Y.-F.; Proceedings of the SAS Global Forum 2014 Conference, Washington, 2014.
-
18Ayala, R. J.; The Theory and Practice of Item Response Theory, The Guilford Press: New York, 2009
-
19Johnson, M. S.; Journal of Statistical Software 2007, 20, 1.
-
20Schurmeier, K. D.; Atwood, C. H.; Shepler, C. G.; Lautenschlager, G. J.; J. Chem. Educ. 2010, 87, 1268.
-
21Schurmeier, K. D.; Shepler, C. G.; Lautenschlager, G. J.; Atwood, C. H.; ACS Symp. Ser. 2011, 1074, 137.
-
22Cohen, J.; Statistical Power Analysis for the Behavioral Sciences, Routledge, 1988
-
23Cook, E.; Kennedy, E.; McGuire, S. Y.; J. Chem. Educ. 2013, 90, 961.
-
24Stocking, M. L.; Lord, F. M.; Applied Psychological Measurement 1983, 7, 201.
Publication Dates
-
Publication in this collection
May 2017
History
-
Received
13 Oct 2016 -
Accepted
29 Nov 2016