 SYNTHESIS OF A SCHIFF BASE COMPLEX: A STUDY OF ITS DFT AND NON-LINEAR OPTICAL PROPERTIES
Abstract
A Schiff base ligand (L) copper complex (LCu) is synthesized and examined using ultraviolet-visible (UV-Vis), proton nuclear magnetic resonance (1H NMR), carbon-13 nuclear magnetic resonance (13C NMR), and mass spectrometry. Chemical computational modelling was carried out utilizing the density functional theory (DFT)/Coulomb-attenuated method (CAM) at the Becke’s 3-parameter Lee-Yang-Parr (B3LYP) functional with a 6-31+G(d’,p’) basis set to optimize the geometry and molecular structure of the LCu. The highest occupied molecular orbital (HOMO) and lowest unoccupied molecular orbital (LUMO) energy parameters with non-linear optical (NLO) characteristics are calculated. The findings showed that the prepared LCu exhibited optical properties as the experimental and theoretical results are in good agreement. The LCu displayed diffraction patterns (DPs) when exposed to a 473 nm continuous wave (CW) laser beam and strong self-defocusing (SDF) in a Z-scan experiment. The magnitude of the non-linear refractive index (NLRI) of the LCu, estimated using the former and latter techniques, was found to be 4.82 × 10⁻⁷ and 0.17 × ١٠–7 cm2 W–1, respectively. Two laser beams are employed to study the all-optical switching (AOS) behavior of the LCu compound.
Keywords:
Schiff base complex; density functional theory; non-linear optical; diffraction patterns; all-optical switching
INTRODUCTION
When a Gaussian laser beam passes through a non-linear medium that has an intensity-dependent refractive index, several spatial visualizations, self-defocusing (SDF), focusing and phase modulations1-3 will be detectable. The non-linear optical (NLO) features of many media have been the subject of intense experimental work to study their potential applications, in areas such as optical computing4 and optical signal processing.5 The refractive index and response time are the key factors for the media to be used in these applications. That is why there is a need to improve the properties of available materials by subjecting them to γ-rays or to synthesize new materials.6-8 Three visualization methods can be used to calculate the non-linear refractive index (NLRI) of a medium, namely diffraction patterns (DPs),9,10 thermal lens11,12 and Z-scans.13,14 The azomethine group plays a significant role in the formation of Schiff bases, which are essential in various domains, including both scientific and industrial fields.15 These compounds are notably valuable in the pharmaceutical sector and serve as biochemical catalysts.16
A specific category of Schiff bases features heterocyclic rings, characterized by the inclusion of elements such as nitrogen, oxygen, or sulfur, in addition to carbon. This heterogeneity imparts unique physical and chemical properties, making them highly relevant for numerous applications. Heterocyclic Schiff bases can have various ring sizes and compositions, contributing to their structural diversity. They also display unique spectral characteristics, enhancing their use in analytical contexts, as well as their roles in biological applications and the design of drugs and therapeutic agents due to their medicinal properties.17,18 Heterocyclic Schiff bases have exhibited an ability to combine with transition metals to prepare stable complexes. They are utilized in a range of applications, acting as chemical catalysts in oxidation-reduction reactions.19,20 Their notable stability makes them effective remedies for environmental pollution, such as in the removal of heavy metals from contaminated water.
Additionally, they are instrumental in the development of advanced materials, including polymers and nanocomposites. Furthermore, these compounds are biologically active, displaying effectiveness against bacteria and fungi, as well as serving as anticancer agents.21-24 Due to their wide range of visualization, antibacterial, antifungal, antimalarial, and anticancer properties, Schiff bases are being used widely in modern technologies. Their optical activity and photo and thermochromic characteristics are useful in modern technological advances. They are used to measure and control light intensity in optical parts, and also as photo stabilizers, solar collectors and solar filters, and in optical sound recording technology, to name a few.
The present work was aimed at finding a material with high NLO properties for use in photonic applications. Previous studies25-37 in this field, spanning two decades and focusing on the NLO properties of materials, have shown that Schiff bases possess high NLO properties, thus motivating this research group to develop a range of Schiff bases in the past.38-40
In continuation of its studies on Schiff bases, this research group synthesized and identified a Schiff base ligand copper complex (LCu) using ultraviolet-visible (UV-Vis), proton nuclear magnetic resonance (1H NMR), and carbon-13 nuclear magnetic resonance (13C NMR), and mass spectrometry. The NLO features of the LCu were determined under irradiation with two low-power, visible, continuous wave (CW) laser beams, where the magnitude of the NLRI was evaluated utilizing DPs and the Z-scan technique together with all-optical switching (AOS).
EXPERIMENTAL
Substances and procedures
All reagents and substances were purchased from Aldrich and used without further purification. A Shimadzu 8400S Fourier transform infrared (FTIR) spectrometer was used to record the infrared spectra of the Schiff base ligand (L) and the LCu complex using potassium bromide (KBr) discs. Ethanol was used as the solvent, and the UV-Vis spectra of L and LCu were recorded using a Shimadzu UV-1800 spectrophotometer. The 1H NMR and 13C NMR spectra were recorded in dimethyl sulfoxide (DMSO-d6) at 400 and 100 MHz, respectively, using a Bruker spectrophotometer. Mass spectra of the ligand were recorded using an Agilent Technologies spectrometer operating at 70 eV under electron impact (EI) ionization. The mass spectra of LCu were obtained by liquid chromatography-mass spectrometry (LC-MS) using electrospray ionization (ESI) in positive ion mode. The NLO features of the synthesized Schiff base were investigated using two Gaussian-profile laser beams at 473 and 532 nm, emitted by solid-state laser sources with the same spot size (1.5 mm) and power ranges of 0-60 and 0-50 mW, respectively. The powers were measured using a multi-wavelength (λ) power meter. The synthesized samples were kept in a 1-mm-thick glass cell. The generated DPs fell on two screens and were registered using a digital camera with a shutter speed of 1/32 s. The usual Z-scan technique was used.41 Two glass lenses with a focal length of 20 cm were used with the AOS, together with the two laser beams, with 473 nm as the controlling beam and 532 nm as the controlled beam. The static AOS was obtained when both beams operated in a CW mode, whereas the dynamic AOS was obtained once the controlling beam was switched to pulsed mode by connecting the laser head to the transistor-transistor logic function of a frequency generator.
Preparation of Schiff base ligand (L)
A Schiff base was prepared by mixing 0.2142 g of benzidine with 0.3483 g of 4-oxo-chromo-3-carbaldehyde in 50 mL of ethanol and adding acidified glacial acetic acid. The mixture was allowed to stand for 4 h after reflux distillation; it was then cooled, and the yellow precipitate formed was filtered off (Figure 1) and then separated, dried, and recrystallized from 100% ethanol. The following results were obtained from spectral measurements of the L:

1H NMR (dimethyl sulfoxide (DMSO)-d6, 400 MHz) δ 11.9 (s, 1H, –HC=O–), 8.2 (s, 1H, HC=N), 7.8-7.08 (m, 1H, Ar-H); 13C NMR (DMSO-d6, 100 MHz) δ 180.43 (–C=O), 156.02 (C=N), 145.31 (–N–C–), exhibited two bands at 287 nm (molar absorption coefficient (ε) = 20000 mol–1 cm–1) and 400.1 nm (ε = 16900 mol–1 cm–1). The mass spectrum showed that the molecular ion of L was at m/z 497.
Density functional theory (DFT) calculations
In accordance with the objectives of this research, the DFT was used as the fundamental computational framework to study all the electronic structures and features. All DFT calculations were performed using the Gaussian 16 software package.42 The geometry of the studied compound was optimized with the Coulomb-attenuated method (CAM) at the Becke’s 3-parameter Lee-Yang-Parr (B3LYP) functional with a 6-31+G(d’,p’) basis set.43 The oscillation frequencies were computed to correspond to the minimum surface potential energy and to validate the absence of imaginary frequencies, aiming to produce a stable electronic structure of the studied molecules. The prepared LCu was represented as a two-core system with two CuII centres, in which each copper atom have an electronic distribution of d9 and a charge of +2, totaling +4. The spin multiplicity was defined as a single state (m = 1) to precisely depict the electronic structure of the steady state since the individual electrons on the two copper centres exhibited antiferromagnetic coupling. This closed-shell system offered maximum geometric stability for an accurate assessment of the molecular orbital boundary and NLO features. To guarantee a high level of internal consistency in the given results, the same theoretical level was used for all the computational methods, from the geometric optimization to the evaluation of total energies and NLO attributes, such as the dipole moment (μ), polarizability (α), and hyperpolarizability (β).
Experiment setup
DMSO was used as the solvent for the Z-scan measurements because of its excellent solubility for the prepared LCu and its high optical transparency whitin the studied λ range. Figures 2 and 3 show the experimental setups for the DPs and AOS, respectively, that were used in the present work.


RESULTS AND DISCUSSION
Metal copper complex (LCu) synthesis
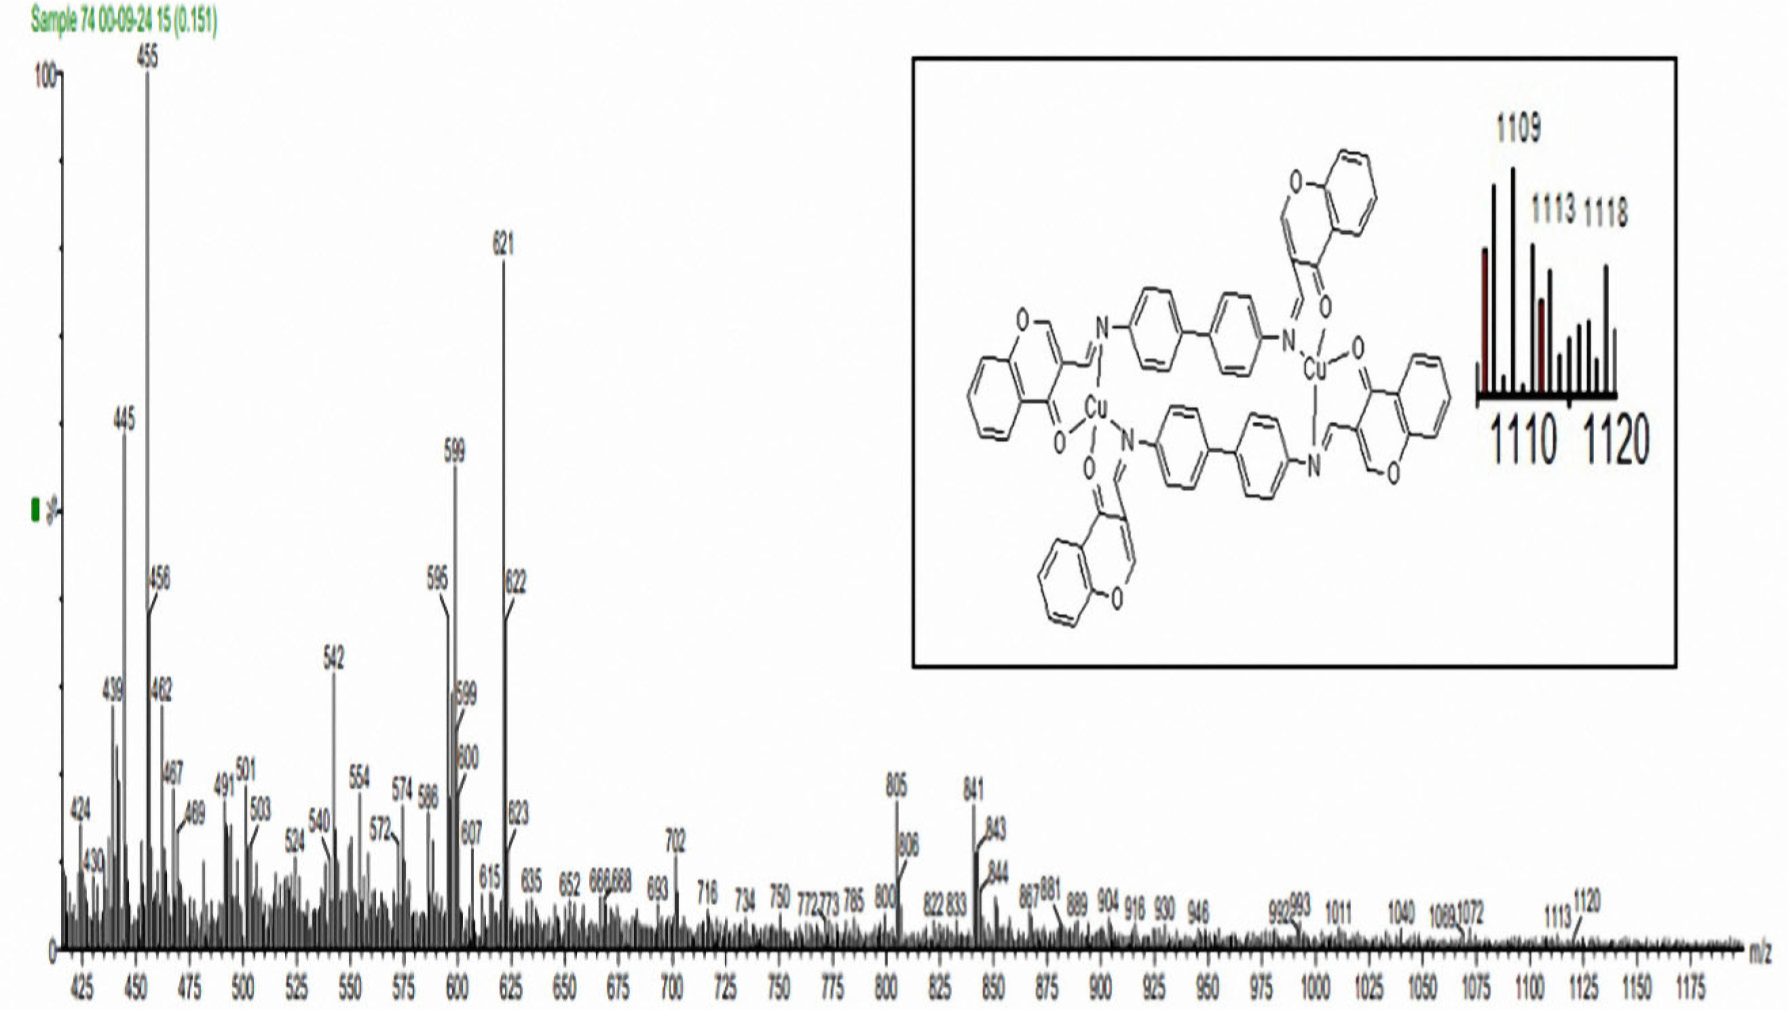
Reflux distillation was used to prepare the LCu by mixing aqueous copper chloride salts with a Schiff base at a molar ratio of 2:2 in a 50-mL flask. The mixture was then allowed to sit for 3 h and yielded a dark brown LCu precipitate (Figure 4). The precipitate was filtered, dried, and recrystallized in absolute ether. The peak at m/z 1118 in the mass spectrum was caused by the molecular ion (M+) of the LCu.

Conductivity and magnetic moments
The LCu complex exhibited a high molar conductance of 120 Ω–1 cm2 mol–1 in DMSO (10–3 M) (Table 1), indicating its electrolytic nature. The magnetic moment of the LCu was 1.694 B.M (Bohr magnetons) (Table 1). This data confirmed the tetrahedral shape and paramagnetic properties of the LCu.
UV-Vis electronic spectral data, molar conductivity, and magnetic moments for the Schiff base ligand (L) and its copper complex (LCu)
Electronic spectra
Table 1 summarizes the UV-Vis electronic spectral data of L and LCu in DMSO. The absorption spectrum of L (Figure 5) exhibited two bands at 287 nm (ε = 20000 mol–1 cm–1) and 400.1 nm (ε = ١٦٩٠٠ mol–1 cm–1), which might be referring to the electronic π → π* transition. The UV-Vis spectrum of LCu (Figure 6) showed absorption bands at 280.4 and 398 nm, which may also be assigned to the electronic π → π* transition. The spectrum also showed new bands at 618 nm due to the d-d transition of the metal ions. The linear absorption coefficients of LCu at 473 and 532 nm were 16.95 and 2.15 cm–1, respectively. The α was computed using the formula reported in a previous research7 and the data presented in Figure 6.


Spectroscopic properties
The chemical structure of the synthesized compound was confirmed by 1H NMR, 13C NMR, and mass spectrometry data. The molecular ion peaks observed in the mass spectrum of the Schiff base at m/z 497.10 corresponded to [C27H16N2O4]•+. At m/z 389, the base peak corresponding to [C25H13N2O3]+ was observed (Figure 7). Following the rupture of the chromium ring in the molecular ion, the ion at m/z 392 (C25H16N2O3)+ underwent cyclization and aromatization to produce a high stable and flat ion that appeared in the spectrum as a clear base peak at m/z 389 (C25H13N2O3)+. The 1H NMR spectrum of the Schiff base (L) in DMSO-d6 is presented in Figure 8. It shows a singlet signal at 8.2 ppm due to the proton in the group CH=N,44 while the signal at 11.9 ppm was due to the proton –HC=O–. In addition, many signals found in the range of 7.08-7.8 ppm were ascribed to aromatic protons. The carbon signal of the CH=N group appeared at 156.02 ppm in the 13C NMR spectrum of the compound (Figure 9) in solvent DMSO-d6, whereas the carbon atom of the –C=O group was responsible for the signal at 180.43 ppm. Meanwhile, the chemical shift at 145.31 ppm was attributed to the carbon group (–N–C–).


As observed in Figure 10, the mass spectrum of the LCu prepared with the Schiff base and aqueous chloride salts at a molar ratio of 2:2 revealed a peak at m/z 1118, which was attributed to the molecular ion of LCu. This confirmed the correctness of the proposed structure for LCu. The low relative abundance of the molecular ions may have resulted from the rapid breaking of weak coordination bonds (fragmentation) before the ions reached the detector, as the LCu complex lost solvent support upon transitioning to the gas phase (inside the spectrometer).

Analysis of the electronic, non-linear optical (NLO), and geometric features
The geometric optimization of the LCu was carried out at CAM-B3LYP/6-31+G(d’,p’) using Gaussian-16 software. The oscillation frequencies were calculated to correspond to the minimum surface potential energy and to confirm the absence of imaginary frequencies. The most stable conformer and the frontier molecular orbitals of the LCu are presented in Figure 11, while Table 2 shows the results of the calculated quantum chemical parameters of the prepared LCu compound, urea and p-nitroaniline (PNA). The urea and PNA served as standard substances for the characterization of the NLO capabilities.45 The highest occupied molecular orbital (HOMO) and the lowest unoccupied molecular orbital (LUMO) are frontier molecular orbitals that are generally important in determining a variety of intrinsic electronic properties of molecules, including electron affinity, chemical hardness, ionization potential, and softness.46 The distribution of the frontier molecular orbitals (Figure 12) was used to further study the electronic transition and subsequent charge transfer in the LCu. The spatial distribution of the LUMO indicated that the electron density was mostly centered above the copper ions, azomethine linker (C=N), and adjacent phenyl ring. The spreading of the nodal patterns across the conjugated system confirmed that the LUMO have a unique π* feature, whereas the HOMO spread mostly from the biphenyl rings to the azomethine group, which served as the donor moiety (π character). This orbital dispersion increased the hyperpolarizability (β) of the molecule by reducing the energy gap (Eg) and promoting polarizability (α) through the conjugated π system. In addition, the strong intramolecular charge transfer between the metal centers and organic parts enhanced the overall NLO response and the β value. EHOMO is a quantum chemical parameter that describes the ability of a molecule to give out electrons. If the EHOMO energy of a molecule is high, it can give out electrons to a proper receiver molecule with vacant unoccupied molecular orbitals. On the other hand, the ELUMO illustrates how a molecule accepts electrons. Low ELUMO energies are necessary for nucleophile-based reactions.47 The Eg = (ELUMO – EHOMO) provides an easy way to determine the α ability, kinetic stability, and NLO properties of a molecule. A material with a small Eg is soft, easily polarized, and exhibits high NLO properties and low kinetic stability, as it may rapidly share electrons with an acceptor.48,49 The ELUMO – EHOMO order was urea > PNA > L > LCu. Based on the above mentioned arrangement, the LCu showed high NLO characteristics, high α capability, and low kinetic stability compared to the reference materials. The outcome of multiplying the number of fractional charges in a chemical molecule by the separation between these charges is called the dipole moment (μ).50 Table 2 shows that LCu exhibited a higher μ than urea, but a lower μ than PNA. A linear α can be used to determine the first-order response of the μ to external electrical fields. The refractive index and absorbance are examples of linear optical properties that are impacted by changes in polarizability.51 The LCu molecule had a higher α than urea and PNA. According to calculations, LCu had a higher α than L, PNA, and urea (Table 2). β is a marker of an NLO response and is observed in molecules with an extensive intramolecular charge transfer.52 The β value of LCu was five times higher than that of L. Due to its distinct electronic structure, the dual-core copper(II) complex demonstrated exceptional NLO performance. Effective intramolecular charge transfer was made possible by the coupling between the two copper centers, which was reflected in the single spin state (m = 1) and the total charge of +4. This enhanced intramolecular charge transfers and large β value resulted in increased sensitivity to incident light, in agreement with the experimental results. Due to the narrower Eg of LCu compared to L and reference materials, such as urea and PNA, the β values and related NLO features of LCu were strong.53,54 The order of the β values for the molecules was LCu > L > pNA > urea.

Calculated LUMO and HOMO energies, energy gap, and some quantum chemical parameters of the prepared complex

It was observed that LCu exhibits a distorted tetrahedral geometry. The molecular structure of LCu was deformed by the Jahn-Teller effect. In addition to the impact of Eg on the optical features discussed in the previous paragraph, the LCu molecules exhibited strong NLO features as a result of this geometric deformation.55-58 Table 3 shows the specific bond lengths and angles of LCu. The lengths of the Cu-N bonds were 1.992 and 1.987 Å, whereas the bond distances between copper were 1.871 and 1.871 Å. The distances between the copper bonds and the oxygen of the coordinated carbonyl of LCu were 3.815 and 3.814 Å. The strong Jahn-Teller effect was responsible for the increase in the bond length between the copper ions and the oxygen of the carbonyl group.59,60
Selected geometrical parameters of the title compound and values calculated at the DFT/CAM-B3LYP/6-31+G(d’,p’) level of theory
In the structure of LCu, the CuII ion was encircled in a deformed tetrahedral configuration by two N-coordinates from the azomethine groups and two O-coordinates from the carbonyl groups. The diagonal angles of N1-Cu1-N2 and N1-Cu2-N2 were 107.752° and 107.782°, respectively. The distortion of tetrahedral complexes can be assigned to the angle. For the metals, the O1-Cu1-N1 and O1-Cu2-N1 angles of 116.5° primarily differed from the ideal tetrahedral angle. The increase in the O-Cu-N angles can be attributed to the π repulsions between the orbitals of L.61
Although exact crystallographic data for LCu wer lacking, the improved geometry was compared with the experimental structures for their roughly equivalent Cu+2 analogues reported in the literature.61 The calculated coordination bond lengths and angles were consistent with the usual values observed in similar Cu+2 complexes.62,63 The details of this comparison and the values are shown in Table 3. The calculated distance for N1-Cu1 was 1.987 Å, which was consistent with the experimental measurement of 1.974 Å. In the same direction, the measured value of the O2-Cu1 bond was 1.90 Å, while the theoretical value was 1.871 Å. With a theoretical value of 94.281°, the N2-Cu1-O2 angle showed strong proximity to the measured value of 95.3° found in the literature. Despite the convergence between the theoretical and practical values established in the literature, deviations were observed in the values of some bonds and angles. As scientifically expected, theoretical calculations were performed on the molecule in the gaseous state (gas phase), isolated from external influences, while practical calculations were carried out in the solid state (crystalline state), which was subject to the effects of crystal stacking forces, inter-hydrogen bonds, and vacuum obstruction factors within the crystal lattice.
Diffraction patterns (DPs)
When a 473-nm beam passed through the LCu, part of the energy was absorbed by the medium, based on its absorption coefficient, and a certain amount of heat was released, resulting in DPs. At low power, the laser beam drew a single bright spot with no rings. As the power of the beam increased, a large amount of the energy was absorbed, leading to an increase in the spot area as an outcome of SDF. Then, at a certain power threshold, it split into rings in the x-y plane that were symmetrical with respect to the z-axis. As the power increased, vertical symmetry was lost due to the vertical thermal convection current. Such behavior is illustrated in Figure 13. The beam wavefront was convergent when the sample was positioned before the lens focus, while the beam wavefront was divergent when the sample was positioned after the lens focus. In those two positions, the beam resulted in two types of DPs, as shown in Figure 14. Such an effect was noticed in 1984 by Santamato and Shen,64 and later, by Deng et al.65 and Chavez-Cerda and co-authors.66 It is believed that the type of DPs generated depends on the interaction of the beam with the medium, based on the radius and sign of the beam wavefront (± R). The temporal behavior of the DPs is shown in Figure 15.


Images of the DPs relative to two wavefronts with an input power of 57 mW in the LCu complex

Mathematical description of the DPs
Consider a CW laser beam with a Gaussian distribution and wavelength λ, traversing a sample of thickness (d), with a linear absorption coefficient (α) along the z-axis. When the input power of the laser beam is low, it results in a small, solid, full spot, meaning that initially, there are no DPs. As the power rises, the spot increases in area and subsequently splits into rings, with the number of rings increasing as the power increases. The production of one ring is the result of a beam phase change (Δφ) of 2π radians. When the total number of rings is N, the total change in phase (Δφ’) of the beam is expressed as:67
Δφ can be related to λ, d, change of the medium refractive index (Δn) and beam radius (ω, in e–2), so that
where k is the beam wave vector, then Δn can be obtained by
and NLRI (n2), is related to Δn and beam intensity, , so that
Z-scan
A Z-scan was performed using a 473-nm incident beam at an intensity of 688.28 W cm–2 and an input power of 4 mW (Figure 16). Figure 16a shows a peak followed by a valley, confirming the occurrence of SDF. A straight horizontal line was obtained during the open-aperture (OA) Z-scan (Figure 16b), indicating that the LCu did not exhibit a non-linear absorption coefficient. Thermal non-linearity occurred due to the use of a CW laser beam.68,69 When the laser beam passed through the sample, the sample absorbed some of its energy, which was converted into heat, thus creating a thermal concave lens in the medium. This thermal lens produced a phase shift in the laser beam. When the phase shift was < π, SDF behavior was observed. However, when the phase shift was ≥ 2π, constructive and destructive interference occurred, leading to the formation of DPs. The DPs and Z-scan experiments were repeated with compound L, but neither ring formation nor SDF in the Z-scan was observed, indicating that L did not exhibit NLO features, while LCu did. This aligned with the rationale outlined in “Diffraction patterns (DPs)” sub-section.

Mathematical description of the Z-scan
The total phase change of the beam in the Z-scan case is given by the Equation 5:70
The NLRI is associated with the difference between the transmittance of the peak and valley (ΔTp–v) as follows:71
All-optical switching (AOS)
Two laser beams were used in the AOS experiments. One laser beam (λ1 = 473 nm) was used as the controlling beam against the non-linear sample with a high absorption coefficient, while the other beam (λ2 = 532 nm) was used as the controlled beam against the non-linear sample with a small absorption coefficient. In the first case, the beam created DPs when it traversed the sample alone, while in the second case, no DPs were created. Once both beams simultaneously traversed the sample, two tipes of DPs resulted: one due to the first beam, based on the spatial self-phase modulation,70 and the other due to the enhancement of the first beam, based on the cross self-phase modulation.72 Figures 17 and 18 show the two types of DPs when both beams had a CW characteristic, while the other one occurred when the first beam was a pulse, and the second exhibit a CW characteristics. Figure 17 shows the static AOS, while Figure 18 shows the dynamic AOS. All-AOS or all-optical data conversion is a type of information conversion from a specific λ1 channel to λ2 using optical control technology.73

Static AOS using a 473 nm controlling beam and a 532 nm controlled beam, both with CW character

Dynamic AOS using a 473 nm controlling beam and a 532 nm controlled beam. The former has a pulsed character, whereas the latter operates in CW mode
CONCLUSIONS
L and LCu were effectively synthesized and analyzed using a number of spectroscopic methods, including UV-Vis, 1H NMR, mass spectrometry, FTIR, and 13C NMR. The analysis of the UV-Vis spectrum indicated that d-d transitions were responsible for the weak absorption peak of the LCu at 618 nm. Additionally, the CAM-B3LYP/6-31+G(d’,p’) was used in the DFT calculations to study the structural, electronic, and NLO properties of L and LCu. The experimental X-ray data for similar compounds and the structural parameters calculated at the CAM-B3LYP/6-31+G(d’,p’) of LCu aligned relatively well. Based on the calculated β value for LCu, it appears to be a good candidate for NLO applications and may assist in the design and synthesis of new materials with unique optical properties. The NLO properties of LCu was examined employing DPs, Z-scan, and AOS. The results led to the determination of the NLRI (n2) for LCu via DPs and Z-scan utilizing a CW laser beam (λ = 473 nm). It was observed that the magnitude of n2 for LCu, calculated by both methods, was on the order of 10–7 cm2 W–1. The NLRI resulted from the effect of thermal nonlinearity, which led to the appearance of bright and dark rings in the experiment, and to SDF behavior in the Z-scan measurements. The low ∆E and high μ, α, and β values obtained indicate that LCu provides good conditions for the development of NLO materials.
DATA AVAILABILITY STATEMENT
All data generated or analyzed during this study are included in this published article.
ACKNOWLEDGMENTS
The authors sincerely acknowledge the University of Basrah, Iraq, for providing the 1H and 13C NMR spectra.
REFERENCES
-
1 Lu, L.; Wang, Z.; Yu, J.; Qiao, C.; Lin, R.; Cai, Y.; Front. Phys. 2022, 9, 807542. [Crossref]
» [Crossref] -
2 Ebady, S. S.; Al-Timimy, Kh. A.; Emshary, C. A.; Sultan, H. A.; Hassan, Q. M. A.; Hussein, H. F.; J. Electron. Mater. 2025, 54, 7660. [Crossref]
» [Crossref] -
3 Zhang, Z.; Yuan, Z.; Yang, R.; He, Y.; J. Cent. South Univ. 2019, 26, 2245. [Crossref]
» [Crossref] -
4 McMahon, L.; Nat. Rev. Phys. 2023, 5, 717. [Crossref]
» [Crossref] -
5 Ogawa, K.; Zhang, T.; Yoshihara, K.; Kobuke, Y.; J. Am. Chem. Soc. 2002, 124, 22. [Crossref]
» [Crossref] -
6 Sawsan, F.; Qusay, M. A. H.; Adil, M. D.; Sultan, H. A.; Emshary, C. A.; Radiat. Eff. Defects Solids 2023, 178, 699. [Crossref]
» [Crossref] -
7 Jabbar, H. J.; Qusay, M. A.; Hassan, M. F. A.; Ahmed, S. A.; Elias, R. S.; Bahjat, A. S.; Emshary, C. A.; Phys. Scr. 2020, 95, 045804. [Crossref]
» [Crossref] -
8 Hamsa, H. A.; Qusay, M. A. H.; Faeza, A. A.; Sultan, H. A.; Adil, M. D.; Ahmed, M. J.; Emshary, C. A.; Optik 2022, 265, 169477. [Crossref]
» [Crossref] -
9 Gordon, J. P.; Leite, R. C.; Moore, R. S.; Porto, S. P. S.; Whinner, J. R.; J. Appl. Phys. 1965, 36, 3. [Crossref]
» [Crossref] -
10 Callen, W. R.; Huth, B. G.; Pantell, R. H.; Appl. Phys. Lett. 1967, 11, 103. [Crossref]
» [Crossref] -
11 Pilla, V.; Chillcce, E. F.; Neves, A. A. R.; Munin, E.; Catunda, T.; Cesar, C. L.; Barbosa, L. C.; J. Mater. Sci. 2007, 42, 2304. [Crossref]
» [Crossref] -
12 Varga, A. D. V.; Vargas, E.; Castellanos-Duran, F. R.; Mejoradu, J.; Isidro-Ojeda, M. A.; Cedeno-Berani, E.; Rojas-Trigos, J. B.; Juarez, A. G.; Calderon, A.; Marin, E.; Latin-American Journal of Physics Education 2022, 16, 3313. [Link] accessed in July 2026
» [Link] -
13 Sheik-Bahae, M.; Said, A. A.; Van Stryland, E. W.; Opt. Lett. 1989, 14, 955. [Crossref]
» [Crossref] -
14 Sheik-Bahae, M.; Said, A. A.; Wei, T.; Hagan, D. J.; Van Stryland, E. W.; IEEE J. Quantum Electron. 1990, 26, 760. [Crossref]
» [Crossref] -
15 Sumrra, S. H.; Zafar, W.; Malik, S. A.; Mahmood, K.; Shafqat, S. S.; Arif, S.; Acta Chim. Slov. 2022, 69, 200. [Crossref]
» [Crossref] -
16 Mawat, T. H.; Al-Jeboori, M. J.; J. Mol. Struct. 2020, 1208, 127876. [Crossref]
» [Crossref] -
17 Fonkui, T. Y.; Ikhile, M. I.; Ndinteh, D. T.; Njobeh, P. B.; Trop. J. Pharm. Res. 2018, 17, 2507. [Crossref]
» [Crossref] -
18 Mahmoud, W. A.; Hassan, Z. M.; Baghdad Science Journal 2017, 14, 135. [Crossref]
» [Crossref] -
19 Mahmoud, W. A.; Hassan, Z. M.; Ali, R. A.; J. Phys.: Conf. Ser. 2020, 1660, 012027. [Crossref]
» [Crossref] -
20 Alshawi, M. S.; Mohammed, Q. M.; Alesary, H. F.; Ismail, H. K.; Barton, S.; ACS Omega 2022, 7, 20405. [Crossref]
» [Crossref] -
21 Al-Redha, H. M.; Ali, S. H.; Mohammed, S. S.; Baghdad Science Journal 2022, 19, 704. [Crossref]
» [Crossref] -
22 Ghanghas, P.; Choudhary, A.; Kumar, D.; Poonia, K.; Inorg. Chem. Commun. 2021, 130, 108710. [Crossref]
» [Crossref] -
23 Manpreet, K.; Malik, A. K.; Environ. Sci. Pollut. Res. 2023, 30, 118801. [Crossref]
» [Crossref] -
24 Yousif, E.; Abdallh, M.; Hashim, H.; Ahmed, A.; Ahmed, D. S.; Yusop, R. M.; Emergent Mater. 2019, 2, 505. [Crossref]
» [Crossref] -
25 Manjunatha, K. B.; Supriya, S.; Shakeel, S.; Ranjan, P.; Chakraborty, T.; Poornesh, P.; Dileep, R.; Mater. Sci. Semicond. Process. 2022, 51, 107012. [Crossref]
» [Crossref] -
26 Rezvan, V. H.; Pour, S. B.; Sardroodi, J.; Results Chem. 2024, 12, 101907. [Crossref]
» [Crossref] -
27 Evecen, M.; Tanak, H.; Ağar, A.; Meral, S.; Özdemir, N.; Optik 2022, 228, 166133. [Crossref]
» [Crossref] -
28 Xiao, X.; Liu, M.; Zhou, J.; Zhu, H.; Wang, C.; Chen, C.; Wang, Y.; Xiao, S.; He, J.; Opt. Mater. 2022, 132, 112773. [Crossref]
» [Crossref] -
29 Ahmed, M. J.; Qusay, M. A.; Faeza, A. A.; Sultan, H. S.; Adil, M. D.; Emshary, C. A.; Luma, T. T. A.; Opt. Mater. 2021, 122, 111750. [Crossref]
» [Crossref] -
30 Abdullmajed, H. A.; Sultan, H. A.; Al-Asadi, R. A.; Qusay, M. A. H.; Asaad, A. A.; Emshary, C. A.; Phys. Scr. 2022, 97, 025809. [Crossref]
» [Crossref] -
31 Luma, T. A.; Qusay, M. A. H.; Dhumad, A. M.; Sultan, H. A.; Emshary, C. A.; J. Fluoresc. 2025, 35, 3589. [Crossref]
» [Crossref] -
32 Hong, J. J.; Min, T. X.; Jin, L. Y.; Jian, S. W.; Liang, H.; Rong, G. R.; Fen, Z. Y.; Chem. Phys. Lett. 2011, 514, 114. [Crossref]
» [Crossref] -
33 Vijayalakshmi, S.; Kalyanaraman, S.; Opt. Mater. 2013, 35, 440. [Crossref]
» [Crossref] -
34 Muñoz-Flores, B. M.; Santillán, R.; Farfán, N.; Álvarez-Venicio, V.; Jiménez-Pérez, V. M.; Rodríguez, M.; Morales-Saavedra, O. G.; Lacroix, P. G.; Lepetit, C.; Nakatani, K.; J. Org. Chem. 2014, 769, 64. [Crossref]
» [Crossref] -
35 Derkowska-Zielinska, B.; Barwiolek, M.; Cassagne, C.; Boudebs, G.; Opt. Laser Technol. 2020, 124, 105968. [Crossref]
» [Crossref] -
36 Ebenazer, A.; Munusamy, S.; Sampathkumar, N.; Shanmugam, R.; Muhammad, A.; Chaudhry, S.; Lakkaboyana, H.; Trilaksana, R. M. N.; Kalla, J.; Lee P. S.; J. Mol. Struct. 2025, 1324, 140781. [Crossref]
» [Crossref] -
37 Feng, X.; Ma, J.; Xu, K.; Wu, Y.; Zhai, Y.; Xuan, F.; Zhai, D.; Cao, L.; Teng, B.; J. Mol. Struct. 2025, 1327, 141200. [Crossref]
» [Crossref] -
38 Tariq, S.; Tahir, I. S.; Saqib, M.; Haq, S.; Aftab, H.; Imran, M.; Shafiq, Z.; J. Mol. Struct. 2024, 1308, 138135. [Crossref]
» [Crossref] -
39 Tahir, M.; Aftab, H.; Shafiq, I.; Khalid, M.; Haq, S.; El-kott, A. F.; Zein, M. A.; Hani, U.; Shafiq, Z.; RSC Adv. 2024, 14, 4221. [Crossref]
» [Crossref] -
40 Avci, D.; Özge, Ö.; Sönmez, F.; Başoğlu, A.; Tamer, Ö.; Atalay, Y.; Mater. Sci. Semicond. Process. 2024, 179, 108523. [Crossref]
» [Crossref] -
41 Jinan, K. S.; Qusay, M. A. H.; Ahmed, M. J.; Sultan, H. A.; Adil, M. D.; Emshary, C. A.; Opt. Mater. 2022, 133, 112917. [Crossref]
» [Crossref] - 42 Frisch, M. J.; Trucks, G. W.; Schlegel, H. B.; Scuseria, G. E.; Robb, M. A.; Cheeseman, J. R.; Scalmani, G.; Barone, V.; Petersson, G. A.; Nakatsuji, H.; Li, X.; Caricato, M.; Marenich, A. V.; Bloino, J.; Janesko, B. G.; Gomperts, R.; Mennucci, B.; Hratchian, H. P.; Ortiz, J. V.; Izmaylov, A. F.; Sonnenberg, J. L.; Williams-Young, D.; Ding, F.; Lipparini, F.; Egidi, F.; Goings, J.; Peng, B.; Petrone, A.; Henderson, T.; Ranasinghe, D.; Zakrzewski, V. G.; Gao, J.; Rega, N.; Zheng, G.; Liang, W.; Hada, M.; Ehara, M.; Toyota, K.; Fukuda, R.; Hasegawa, J.; Ishida, M.; Nakajima, T.; Honda, Y.; Kitao, O.; Nakai, H.; Vreven, T.; Throssell, K.; Montgomery Junior, J. A.; Peralta, J. E.; Ogliaro, F.; Bearpark, M. J.; Heyd, J. J.; Brothers, E. N.; Kudin, K. N.; Staroverov, V. N.; Keith, T. A.; Kobayashi, R.; Normand, J.; Raghavachari, K.; Rendell, A. P.; Burant, J. C.; Iyengar, S. S.; Tomasi, J.; Cossi, M.; Millam, J. M.; Klene, M.; Adamo, C.; Cammi, R.; Ochterski, J. W.; Martin, R. L.; Morokuma, K.; Farkas, O.; Foresman, J. B.; Fox, D. J.; Gaussian 16, revision C.01, Gaussian Inc., Wallingford, 2016.
-
43 Yanai, T.; Tew, D. P.; Handy, N. C.; Chem. Phys. Lett. 2004, 393, 51. [Crossref]
» [Crossref] -
44 Almashal, F. A.; Mohammed, M. Q.; Qusay, M. A. H.; Emshary, C. A.; Sultan, H. A.; Dhumad, A. M.; Opt. Mater. 2020, 100, 109703. [Crossref]
» [Crossref] -
45 Zahraa, S. F.; Qusay, M. A. H.; Kawkab, A. H.; Sultan, H. A.; Jasim, M. S. A.; Emshary, C. A.; Phys. Scr. 2024, 99, 065525. [Crossref]
» [Crossref] -
46 Abduljleel, A. M.; Alshawi, J. M.; Hussein, K. A.; Ismael, S.; Revista Bionatura 2023, 8, 61. [Crossref]
» [Crossref] -
47 Choudhary, V. K.; Bhatt, A. K.; Dash, D.; Sharma, N.; J. Comput. Chem. 2019, 40, 235448. [Crossref]
» [Crossref] -
48 Shuhaib, Z. A.; Hussein, K. A.; Ismael, S. M.; Russ J. Gen. Chem. 2023, 93, 1171. [Crossref]
» [Crossref] -
49 Kawkab, A. H.; Sultan, H. S.; Abdul-Radha, A.; Aljaber, M.; Hassan, Q.; Emshary, C. A.; Opt. Quantum Electron. 2024, 56, 1056. [Crossref]
» [Crossref] - 50 Kotz, J. Z.; Treichel, P.; Townsend, R.; Treichel, D. A.; Chemistry & Chemical Reactivity, 10th ed.; Cengage Learning: Boston, 2019.
-
51 Abdulzahra, H. N.; Ismael, S.; Almashal, F. A.; Journal of Basrah Researches 2024, 50, 203. [Crossref]
» [Crossref] -
52 Khan, M. U.; Ibrahim, M.; Khalid, M.; Braga, A.; Ahmed, S.; Sultan, A.; J. Cluster Sci. 2019, 30, 415. [Crossref]
» [Crossref] -
53 Labidi, N. S.; Int. J. Met. 2013, 2013, 964328. [Crossref]
» [Crossref] -
54 Khan, M. U.; Khalid, M. N.; Asim, S.; Hussain, R.; Mahmood, K.; Iqbal, J.; Akhtar, M.; Hussain, A.; Imran, A.; Irfan, A.; Ali, A.; Rehman, F.; Jiang, Y.; Lu, C.; Frontiers in Materials 2021, 8, 719971. [Crossref]
» [Crossref] -
55 Kim, Y. M.; Lee, D. W.; Ok, O.; Inorg. Chem. 2014, 53, 5240. [Crossref]
» [Crossref] -
56 Pan, S.; Smit, S. J.; Watkins, B.; Marvel, M.; Stern, S.; Poeppelmeier, K.; J. Am. Chem. Soc. 2006, 128, 11631. [Crossref]
» [Crossref] -
57 Hyun-Seup R.; Ok, K.; Halasyamani, S.; J. Am. Chem. Soc. 2003, 125, 7764. [Crossref]
» [Crossref] -
58 Bersuker, I. B.; Symmetry 2021, 13, 1577. [Crossref]
» [Crossref] -
59 Azeem, M.; Li, W.; Cai, W.; Li, Y.; Li, X.; Wu, X.; Lu, P.; J. Phys. Chem. Lett. 2018, 9, 751. [Crossref]
» [Crossref] -
60 Yan, L. Q.; Daqiang, Y.; Li, X.; Cryst. Growth Des. 2007, 7, 1832. [Crossref]
» [Crossref] -
61 Albano, V. G.; Pier, L. B.; J. Organomet. Chem. 1972, 38, 155. [Crossref]
» [Crossref] -
62 Elder, R. C.; Hill, M. C.; Inorg. Chem. 1979, 18, 729. [Crossref]
» [Crossref] -
63 Rodríguez, L.; Labisbal, E.; Sousa-Pedrares, A.; García-Vázquez, J. A.; Romero, J.; Sousa, A.; Inorg. Chim. Acta 2010, 363, 1284. [Crossref]
» [Crossref] -
64 Santamato, E.; Shen, Y. R.; Opt. Lett. 1984, 9, 564. [Crossref]
» [Crossref] -
65 Deng, L.; He, K.; Zhou, T.; Li, C.; J. Opt. A: Pure Appl. Opt. 2005, 7, 409. [Crossref]
» [Crossref] -
66 Nascimento, C. M.; Alencar, M. A. R. C.; Chávez-Cerda, S.; da Silva, M. G. A.; Meneghetti, M. R.; Hickmann, J. M.; J. Opt. A: Pure Appl. Opt. 2006, 8, 947. [Crossref]
» [Crossref] -
67 Ogusu, K.; Kohtani, Y.; Shao, H.; Opt. Rev. 1993, 3, 232. [Crossref]
» [Crossref] -
68 Sana, K. K.; Qusay, M. A. H.; Emshary, C. A.; Sultan, H. A.; J. Photochem. Photobiol., A 2022, 427, 113809. [Crossref]
» [Crossref] -
69 Qusay, M. A. H.; Emshary, C. A.; Sultan, H. A.; Phys. Scr. 2021, 96, 095503. [Crossref]
» [Crossref] -
70 Cuppo, F. L. S.; Figueiredo Neto, A. M.; Gómez, S. L.; Palffy-Muhoray, P.; J. Opt. Soc. Am. 2002, 19, 1342 [Crossref]
» [Crossref] -
71 Sendhil, K.; Vijayan, C.; Kothiyal, M. P.; Opt. Laser Technol. 2006, 38, 512. [Crossref]
» [Crossref] -
72 Xuejun, Z.; Zhen, Y.; Rui-xin, Y.; Yi-lin, H.; J. Cent. South Univ. 2019, 26, 2295. [Crossref]
» [Crossref] -
73 Agrawal, G. P.; Phys. Rev. Lett. 1987, 59, 880. [Crossref]
» [Crossref] -
74 Jia, Y.; Liao, Y.; Wu, L.; Shan, Y.; Dai, X.; Cai, H.; Xiang, Y.; Fan, D.; Nanoscale 2019, 11, 4515. [Crossref]
» [Crossref]
Edited by
-
Executive Editor handled this article:
Gustavo F. S. Andrade