 QUALITY RESEARCH ON LERCANIDIPINE HYDROCHLORIDE TABLETS BASED ON NEAR-INFRARED SPECTROSCOPY TECHNOLOGY
Abstract
This study aimed to develop a near-infrared (NIR) spectroscopy method as an auxiliary tool for the rapid determination of active ingredient content (lercanidipine hydrochloride) and drug dissolution of lercanidipine hydrochloride tablets. NIR spectra of 96 batches were collected in the range of 4000-10000 cm-1. Spectral preprocessing methods were compared, and second derivative (SD) was identified as the optimal pretreatment for both content (r (correlation coefficient) = 0.8503, RMSEC (root mean square error of calibration) = 0.996, RMSEP (root mean square error of prediction) = 1.07) and dissolution (r = 0.8356, RMSEC = 2.47, RMSEP = 3.81). Following preprocessing, feature selection algorithms were further applied. For content prediction, manual selection of spectral intervals (4000-7000 cm-1 and 7800-10000 cm-1) achieved excellent performance with a correlation coefficient (r) of 0.9096, RMSEC of 0.786, and RMSEP of 1.08. For dissolution prediction, the interval combination optimization (ICO) algorithm yielded the best results (r = 0.8952, RMSEC = 2.01, RMSEP = 3.79). The proposed NIR method provides a fast, non-destructive auxiliary approach for pharmaceutical quality assessment, with strong potential to support routine quality control of lercanidipine hydrochloride tablets.
Keywords:
NIR; lercanidipine hydrochloride tablets; partial least squares; quantitative model.
INTRODUCTION
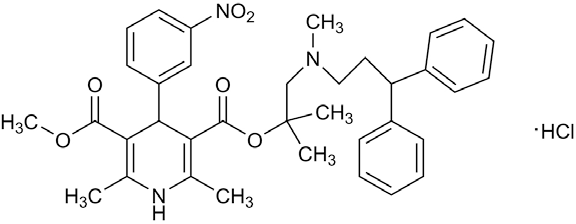
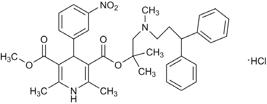
Lercanidipine hydrochloride tablets, which have the chemical formula C36H42ClN3O6, are depicted in Figure 1 with their chemical structure. It has significant blood pressure lowering effects and nephroprotective properties.1 It effectively blocks L-type calcium channels (CaL) and shows high selectivity for T-type calcium channels (CaT), which may offer new therapeutic strategies for preventing calcium-mediated remodeling and arrhythmias in cardiovascular diseases.2,3 Regarding its synthesis, lercanidipine can be produced using the Hantzsch dihydropyridine method or the esterification method, with the synthesis of the side-chain alcohol being a crucial step in the latter approach.4 Furthermore, its high lipophilicity, vascular selectivity, long-term slow release, and reduced negative impact on the heart confer significant clinical advantages in the treatment of hypertension.5 Currently, high-performance liquid chromatography (HPLC) is the primary method for detecting lercanidipine hydrochloride in tablet form.6 Although this method exhibits high accuracy and reliability, it still faces challenges such as complex sample pretreatment, prolonged analysis cycles, and low detection efficiency, which impose certain limitations in rapid detection and online quality control.
Near-infrared (NIR) spectroscopy is a rapid and non-destructive analytical technique based on molecular vibrational energy level transitions. It primarily detects the absorption of overtones and combination bands of hydrogen-containing groups (such as C-H, O-H, N-H) in organic matter. This technology is typically combined with chemometrics methods, establishing mathematical models between spectral signals and target indicators to achieve rapid prediction of component concentrations in complex systems.7,8 Due to its notable advantages - such as high efficiency, environmental friendliness, and the absence of complex pretreatment - near-infrared spectroscopy is widely applied in various fields, including agriculture, food, pharmaceuticals, and petrochemicals.9,10 Compared with other rapid analytical techniques such as Raman, mid-infrared (MIR), and hyperspectral imaging, NIR offers superior sample penetration capability and higher analytical efficiency, giving it potential for quality control of solid dosage forms. Raman spectroscopy provides high spatial resolution, and MIR offers more extensive chemical information, while hyperspectral imaging excels in spatial distribution analysis. However, NIR remains a preferred method due to its simplicity and rapid, non-destructive nature.11 Therefore, this study attempts to establish a near-infrared quantitative model for the content and dissolution of lercanidipine hydrochloride tablets using 96 batches of real production samples. While the model shows potential for quick screening, it is not yet as precise as traditional HPLC methods. This study aims to provide a reference for rapid detection and quality control in solid dosage forms, especially in early-stage quality monitoring and real-time analysis during production, where NIR spectroscopy could be a valuable tool for rapid screening and process optimization.
EXPERIMENTAL
Instruments and test drugs
The instruments used in this study included an Antaris II Fourier Transform Near-Infrared Analyzer (Thermo Fisher Scientific, Waltham, MA, USA), TQ Analyst software (version 8.3.125, Thermo Fisher Scientific, Waltham, MA, USA, 2009), and MATLAB (R2024a, The MathWorks, Inc., Natick, MA, USA, 2024) for data analysis.
The test drugs comprised lercanidipine hydrochloride tablets, with a total of 96 batches, all manufactured by Anhui Hongye Pharmaceutical Co., Ltd. In addition, pure active pharmaceutical ingredients (API) and excipients were provided by the same company.
Determination of main component content and drug dissolution
The content of lercanidipine hydrochloride was determined by HPLC according to General Chapter 0512 and the monograph for lercanidipine hydrochloride tablets in the Chinese Pharmacopoeia (2020 edition).12 The analysis was conducted by Anhui Hongye Pharmaceutical Co., Ltd. The mobile phase consisted of 0.15 mol L-1 sodium perchlorate solution (pH 3.0) and acetonitrile (39:61, v/v), with detection at 240 nm, a flow rate of 1.0 mL min-1, a column temperature of 30 °C, and an injection volume of 15 μL.
Dissolution was determined according to General Chapter 0931 Method II of the Chinese Pharmacopoeia (2020 edition),13 using 900 mL of 0.1 mol L-1 hydrochloric acid containing 0.3% (w/v) polysorbate 80 as the dissolution medium at 50 r min-1, with sampling at 45 min. The chromatographic conditions were the same as those used for content determination, except that the injection volume was 20 μL. In this study, the dissolution value used for modeling refers to the pharmacopoeial dissolution result measured at 45 min, rather than to a complete dissolution profile.
According to the product quality standard, the content should be 95-105% of the labeled amount, and the dissolution limit should be 70%. Among the 96 batches, the content ranged from 90.0 to 102.6%, and the dissolution ranged from 81.0 to 106.0%. The reference HPLC analyses for content and dissolution were conducted at Anhui Hongye Pharmaceutical Co., Ltd., whereas the NIR spectral acquisition, preprocessing, chemometric modeling, and data analysis were performed by the authors.
NIR spectroscopy collection
Samples were placed in glass vials for scanning, and the spectral collection conditions included a wavelength range of 4000 10000 cm 1, absorbance mode, 32 scans, and a resolution of 8 cm-1. Spectra were collected in diffuse reflectance mode using an integrating sphere. Preliminary trials indicated that transmission measurement was not feasible for the studied tablets because their thickness prevented effective penetration of NIR radiation and stable spectral acquisition. Therefore, diffuse reflectance mode was adopted in this study.
Establishment of quantitative analysis model
Sample processing
This experiment analyzed a total of 96 batches of lercanidipine hydrochloride tablets. For each batch, seven tablets were measured, and two spectral data points were randomly selected from each batch for model construction. This resulted in a sample set comprising 192 samples.
Removal of abnormal spectra
During spectral collection, some spectra may deviate from true characteristics and form abnormal samples due to factors such as sample inhomogeneity, instrument state fluctuations, and environmental interference.14 To prevent noise, erroneous information, or irrelevant features from affecting data quality and subsequent analysis, this study employs principal component analysis (PCA) combined with Mahalanobis distance (MD) to identify and screen abnormal spectra.15
Initially, PCA is used to reduce the dimensionality of the original spectral data, extracting the main feature components and effectively removing redundant noise while preserving the primary variation information of the data. Subsequently, the MD of each sample spectrum is calculated within the feature subspace defined by the principal components. This distance measures the relative position of a sample in a multi-dimensional space and its degree of deviation from the overall distribution center. By setting an appropriate distance threshold, spectral data points that deviate from the main distribution can be objectively identified and removed, enhancing the robustness of the dataset and the reliability of the analysis results.16,17
Spectral preprocessing and feature variable selection
Prior to model establishment, the original spectra require preprocessing to suppress noise interference and enhance effective features. This study utilizes multiple methods for spectral data preprocessing, including multivariate scatter correction (MSC), standard normal variate transformation (SNV), first derivative (FD), second derivative (SD), Savitzky-Golay convolution smoothing (SG), and their combinations to identify the optimal preprocessing approach. For SG smoothing, as well as for the combined preprocessing methods SG + FD and SG + SD, a window size of 7 data points and a polynomial order of 3 were used throughout the study. The choice of a 7-point window size is based on the trade-off between noise reduction and preserving spectral details. A smaller window size may not sufficiently suppress noise, while a larger window may over-smooth and obscure key spectral features. A polynomial order of 3 was selected, as it effectively balances smoothness and accuracy, capturing the relevant spectral features without introducing excessive distortion. MSC is employed to correct the scattering effects and improve spectral consistency. SNV reduces the scattering effect by adjusting the mean and variance of each sample. Firstand second-order derivatives are applied to highlight effective spectral features and suppress baseline drift. SG smoothing, which uses polynomial fitting, effectively reduces noise while preserving key signal features.18-20
Although full-spectrum data contains comprehensive response information, it typically suffers from high dimensionality and low signal-to-noise ratio. Irrelevant wavelengths and background noise can easily lead to model overfitting, which weakens its generalization ability. Feature wavelength selection helps eliminate redundant information and focuses on variables that are highly correlated with the target characteristics.21,22 In this study, multiple wavelength selection strategies were employed, including comparing the spectral characteristics of API and tablet samples, manual selection based on the average spectra after preprocessing, as well as using CARS (competitive adaptive reweighted sampling) and ICO (interval combinatorial optimization) algorithms to select feature wavelengths from the full-spectrum data.
For manual selection, wavelengths were chosen by visually inspecting the average preprocessed spectra. The selected ranges were based on the identification of significant spectral features, with specific focus on regions containing functional group absorbances related to the API and excipients.23,24
CARS applies the principle of “survival of the fittest”, integrating Monte Carlo sampling with an exponential decay mechanism. During each iteration, a partial least squares (PLS) model is constructed, and wavelengths are weighted based on the absolute values of their regression coefficients. Wavelengths with lower weights are gradually eliminated, and the optimal wavelength combination is ultimately selected according to cross-validation error.25,26
ICO divides the full spectrum into multiple intervals and systematically evaluates the synergistic efficacy of different interval combinations. Its core process iteratively involves “combining-mutating-selecting” to eliminate substantial redundant spectral information, ultimately focusing on key spectral intervals with the richest information content and the least collinearity among themselves, significantly enhancing the efficiency and predictive accuracy of the analysis model.27,28
Model construction method and performance evaluation
This study employs partial least squares regression (PLSR) to develop a quantitative analysis model. PLSR effectively addresses the multicollinearity problems typically found in spectral data by extracting latent variables that are most relevant to the target properties, thus providing a robust regression model.
To comprehensively assess the performance of the model, the correlation coefficient (r) and root mean square error (RMSE) are selected as the primary evaluation metrics. The correlation coefficient measures the degree of linear correlation between predicted and actual values. Meanwhile, the RMSE of the calibration (RMSEC) set evaluates the fitting accuracy of the model, and the RMSE of the prediction (RMSEP) set rigorously tests the predictive capability of the model and generalization to unknown samples.29
External validation
For external validation, 15 batches of samples, which were not used during model construction, were selected. The NIR spectra of these samples were predicted using the established models for both lercanidipine hydrochloride content and drug dissolution. The predicted values were then compared with the actual values obtained from HPLC measurements. The performance of the model was evaluated by linear regression between the predicted and reference values, and the key performance metrics, such as RMSEP, were calculated to assess the prediction accuracy.30-32
RESULTS AND DISCUSSION
Original NIR spectra of samples
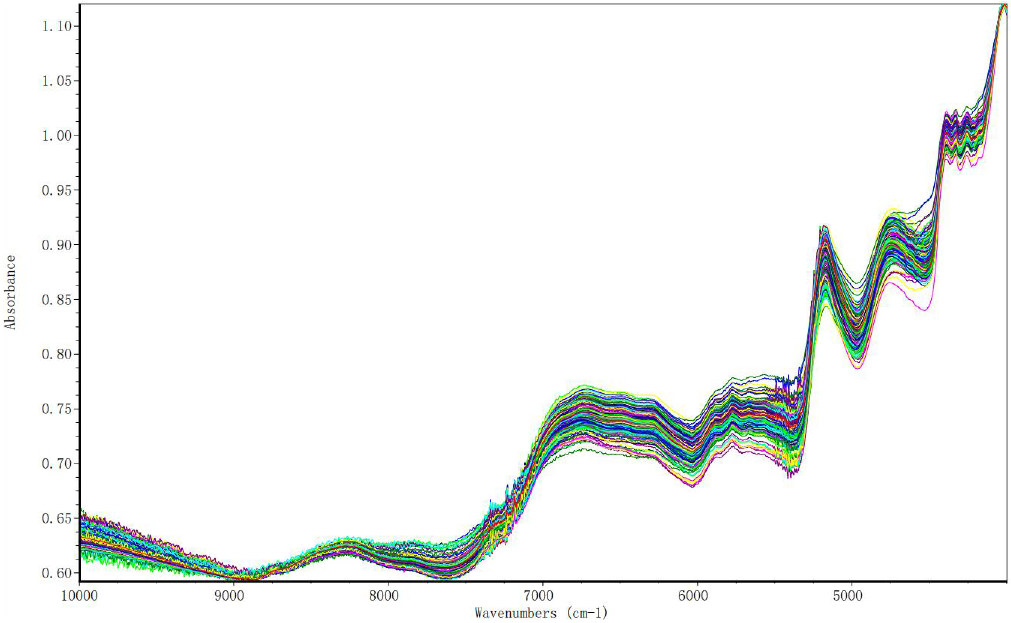
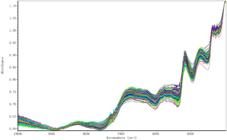
Figure 2 presents the original spectra of 96 batches of samples. It can be observed that the overall contour and trend of the spectra across different samples are generally consistent, suggesting similarity in the chemical composition of the main components and excipients among these samples. However, factors such as instrument noise and insufficient sample uniformity introduce numerous noise spikes in some spectral regions, such as 9000-10000 cm-1. Additionally, there is significant overlap and crossing between spectra. Therefore, prior to establishing the quantitative calibration model, it is necessary to perform spectral data preprocessing and feature extraction to enhance the prediction accuracy and robustness of the model.
Abnormal sample screening and dataset division
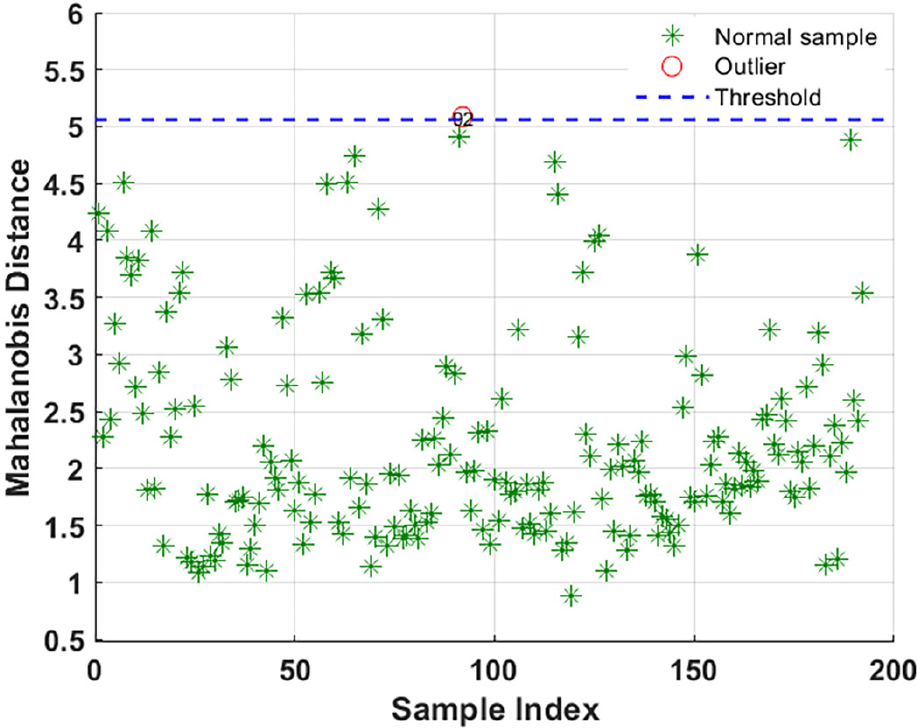
To identify potential outliers, PCA was first applied to the raw spectral data for dimensionality reduction, and the first 6 principal components were retained, accounting for 98.46% of the cumulative variance. Mahalanobis distances were then calculated, and the mean ± 3 times the standard deviation (k = 3) was used as the threshold. The screening results are shown in Figure 3, where the dashed line represents the threshold and the red circles indicate samples identified as potential outliers by the algorithm. The results show that the Mahalanobis distance of sample No. 92 slightly exceeded the threshold. However, further examination revealed that the raw spectral profile of this sample showed no significant difference from those of the other samples, and its corresponding reference value did not exhibit any extreme deviation. Based on comprehensive judgment, this sample was not considered a true outlier caused by measurement error; instead, its slight deviation in Mahalanobis distance was more likely related to normal process variability, such as fluctuations in physical properties including compression force or tensile strength. Therefore, this sample was not excluded from subsequent modeling analyses, and all 192 samples were retained for model development.33

For sample set division, a batch-wise random partitioning strategy was adopted. The 192 samples were divided into a calibration set (144 samples) and a validation set (48 samples) at a ratio of 3:1. This partitioning method ensures that samples from each batch are evenly distributed across both sets while introducing randomness, thereby avoiding data distribution biases that may result from fixed or improper random splitting. Consequently, this approach enhances the generalization ability of the model and the reliability of the evaluation results.34,35
Analysis of spectral preprocessing results
To mitigate light scattering effects and noise, this study applied multiple preprocessing methods, including MSC, SNV, SG smoothing, FD, and SD, as well as their combinations, to the raw spectra.
As shown in Figure 4, the average spectra obtained after different preprocessing methods provide a clearer visualization of the preprocessing effects. After SG smoothing, the average spectrum exhibits a smoother overall profile, with noise suppressed while the main absorption features of the original spectra are largely preserved. FD preprocessing reduces baseline drift and enhances the resolution of overlapping peaks, making spectral variations more apparent. SD preprocessing further sharpens the absorption features and highlights subtle spectral differences, although it also introduces some high frequency noise. Both MSC and SNV effectively correct baseline shifts and tilts caused by particle scattering, reducing overall spectral displacement and making the spectral profiles easier to compare. After these corrections, the positions and shapes of major peaks and valleys become more clearly observable.

Average NIR spectra following different pretreatments. (a) SG smoothing; (b) FD; (c) SD; (d) MSC; (e) SNV
PLSR quantitative models for lercanidipine hydrochloride content and drug dissolution were developed using both raw and preprocessed spectral data, with the modeling results presented in Table 1. For both response variables, the SD preprocessing method demonstrated relatively good model performance.
Feature wavelength selection
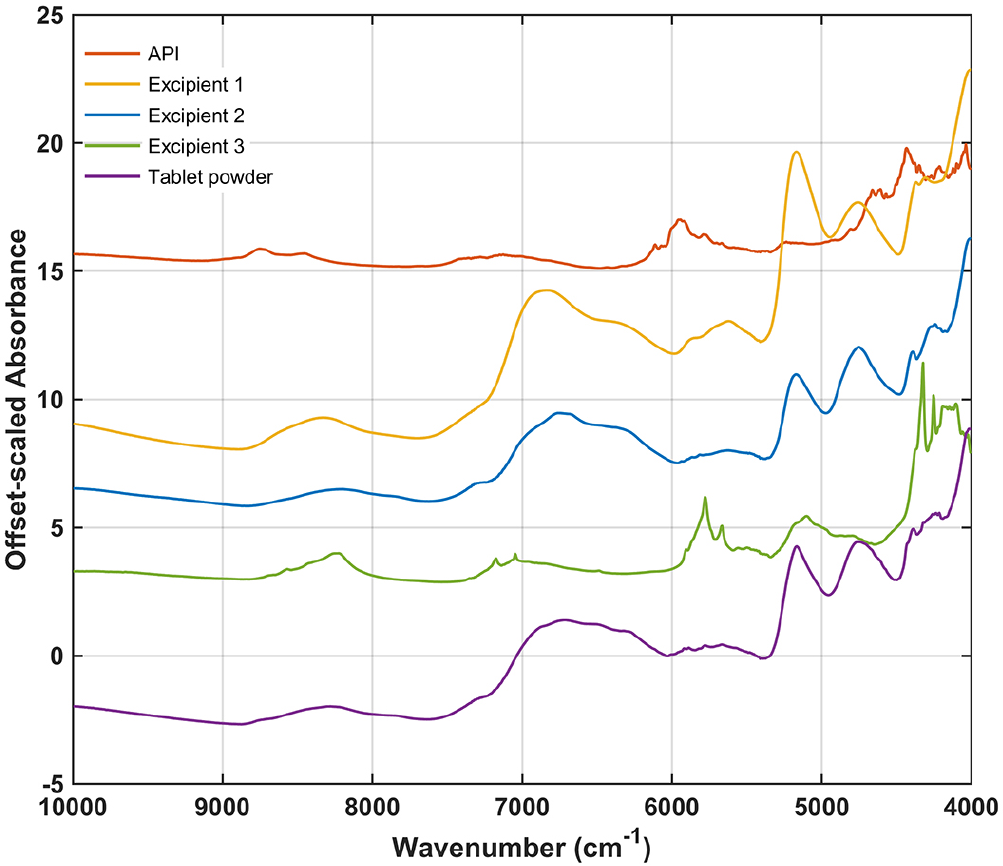
In the process of spectral range selection, the influence of the 8000-10000 cm-1 region on the modeling of API content was first investigated. Figure 5 shows the raw NIR spectra of the API, three excipients, and tablet powder samples, with representative spectra shown for each sample type. It can be seen that the API did not exhibit obvious characteristic absorption in the 8000-10000 cm-1 region, whereas the three excipients showed certain spectral variation in this region. The tablet powder samples also showed spectral variation in this region. This may be related to the fact that NIR absorption mainly arises from overtone and combination vibrations of X-H groups, such as C-H, O-H, and N-H, and that the API contributes less strongly to the overall spectral response in this region than the excipients in the tablet matrix.
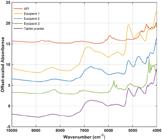
Based on this observation, quantitative models for API content were established using both the full spectral range (4000-10000 cm-1) and the reduced spectral range (4000-8000 cm-1). The results showed that the full-spectrum model provided better predictive performance (see Table 2). This suggests that although the API lacks distinct characteristic absorption in the 8000-10000 cm-1 region, this region still contains useful spectral information associated with excipients and matrix-related physicochemical differences among samples. Such information, while not directly attributable to the API itself, may still be correlated with API content and thus improve the performance of multivariate models when the full spectral range is used. Considering that drug dissolution is related not only to chemical composition but also to the physical properties of the tablets, the full spectral range (4000-10000 cm-1) was also retained for dissolution modeling.
Based on the above results, the full spectrum was used as the initial spectral interval for subsequent feature band selection using three strategies: manual selection, CARS, and ICO.
First, manual selection was performed. Based on the characteristics of the average second-derivative spectrum, the regions of 4000 7000 cm-1 and 7800-10000 cm-1 were selected as the modeling spectral intervals. The 4000-7000 cm-1 region contains the characteristic absorption information of the main functional groups of lercanidipine hydrochloride and serves as the core band for quantitative calibration. Although the 7800-10000 cm-1 region shows no obvious characteristic peaks of the active ingredient, it contains weak absorption information from the tablet excipients, which can be used to correct matrix effects and improve model prediction performance. In contrast, the 7000-7800 cm-1 region exhibits an abnormally sharp noise peak, which may introduce interference and lead to model overfitting; therefore, it was excluded. This manual band selection strategy retains effective chemical information and matrix correction information while reducing noise variables, thereby improving model stability and generalization ability.
Then, the CARS algorithm was adopted, as illustrated in Figure 6. The key results are as follows: the algorithm was executed 100 times, for main component content model, the lowest root mean square error of cross-validation (RMSECV) was achieved at the 35th run, with the number of retained variables reduced to 158. Similarly, for the drug dissolution model, the optimal RMSECV occurred at the 45th run, retaining 81 variables. In both cases, the corresponding regression coefficient paths exhibited significant convergence, indicating the effective elimination of non-informative wavelengths. The number of variables was drastically reduced compared to the full-wavelength set. These selected characteristic wavelengths provide a refined basis for establishing high-precision quantitative models.
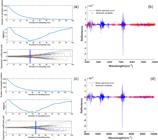
Characteristic band analysis by competitive adaptive reweighted sampling (CARS). (a,b) Characteristic band selection process for lercanidipine hydrochloride content prediction: (a) variation of the number of selected variables, RMSECV values, and regression coefficient paths during CARS iterations, (b) selected characteristic wavelengths based on the mean spectral curve and variable selection results; (c,d) characteristic band selection process for drug dissolution prediction: (c) variation of the number of selected variables, RMSECV values, and regression coefficient paths during CARS iterations, (d) selected characteristic wavelengths based on the mean spectral curve and variable selection results
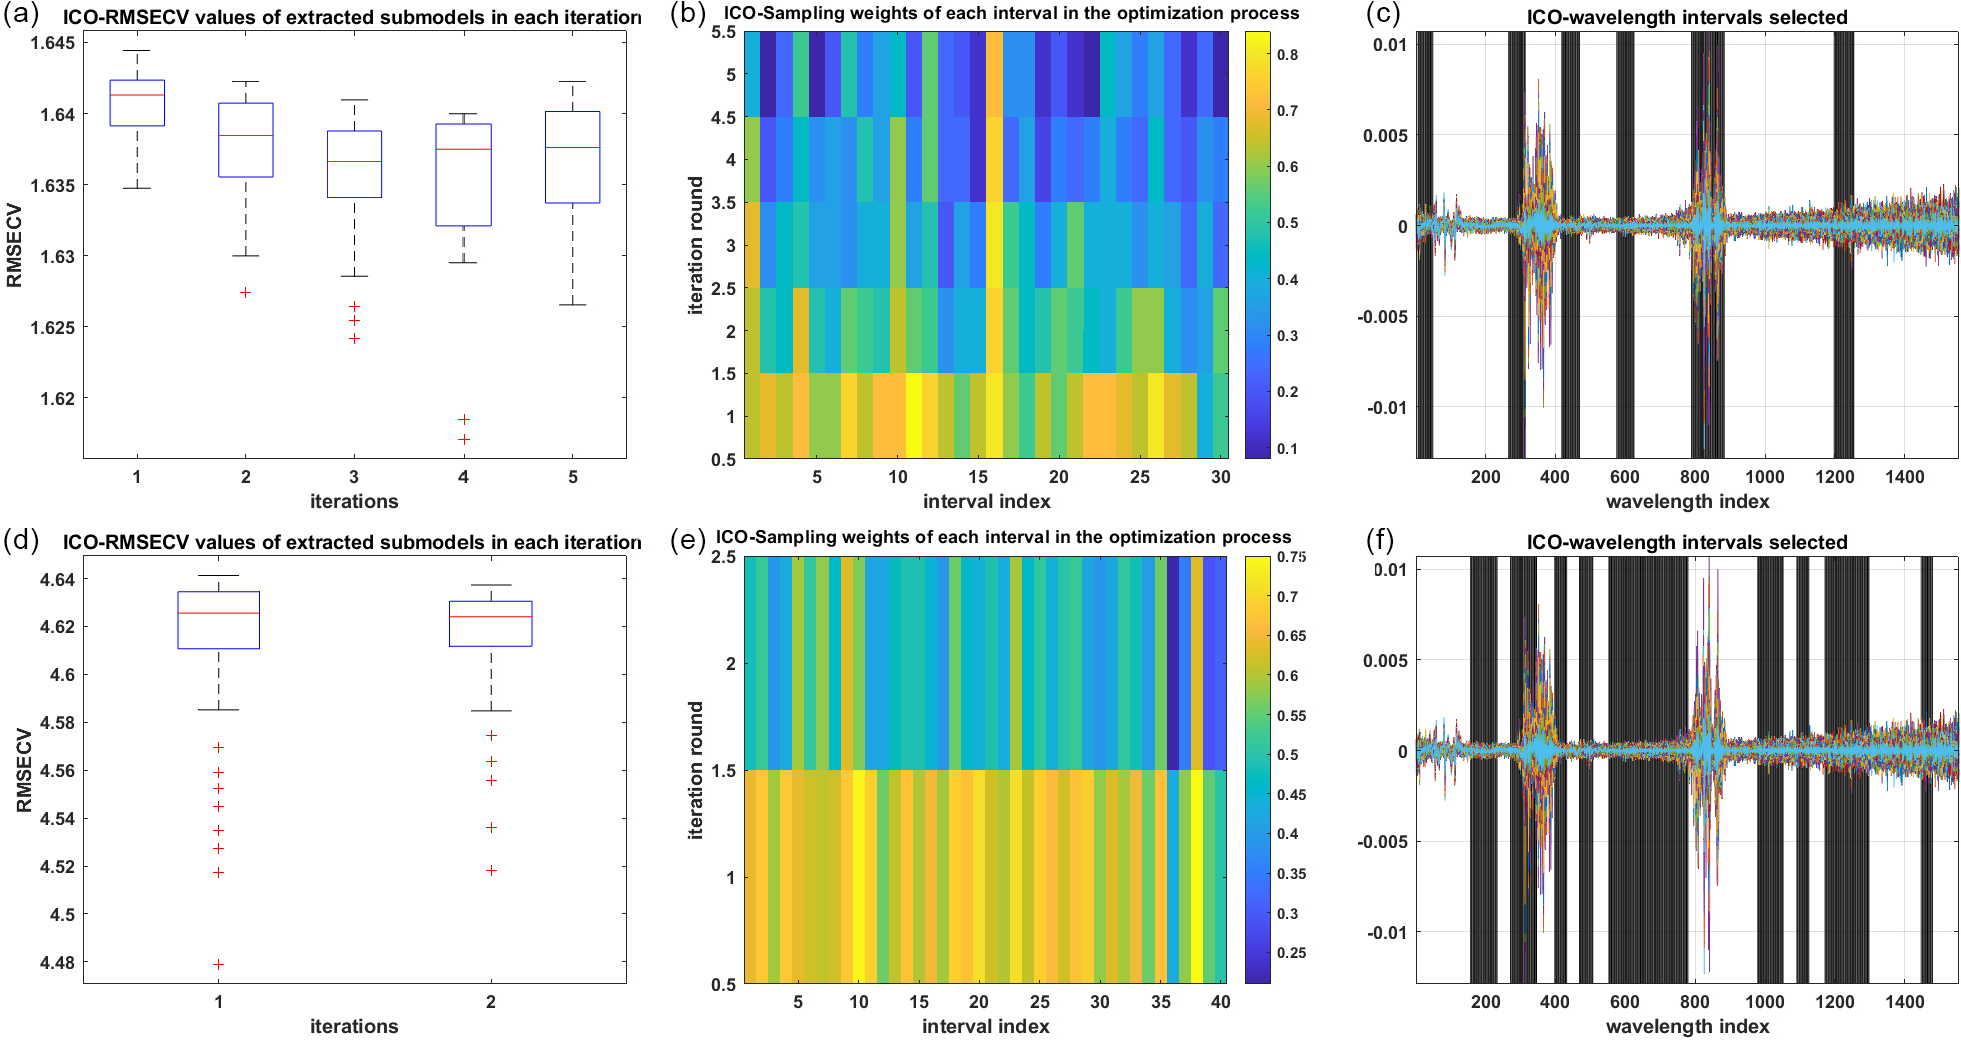
Finally, the ICO algorithm is adopted, as shown in Figure 7. As the number of iterations increases, RMSECV gradually decreases, and it reaches its minimum and stabilizes when the ICO algorithm iterates up to 5 and 2 rounds, respectively. Additionally, with the increase in iterations, the sampling weights of different intervals change gradually. These weights range from 0 to 1, with a color transition from blue to yellow, thereby helping to determine the optimized interval.

Characteristic band analysis by interval combinatorial optimization (ICO). (a-c) Characteristic band selection process for lercanidipine hydrochloride content prediction: (a) RMSECV values of extracted submodels during each iteration, (b) sampling weights of different spectral intervals during the optimization process, (c) selected characteristic wavelength intervals; (d-f) characteristic band selection process for drug dissolution prediction: (d) RMSECV values of extracted submodels during each iteration, (e) sampling weights of different spectral intervals during the optimization process, (f) selected characteristic wavelength intervals
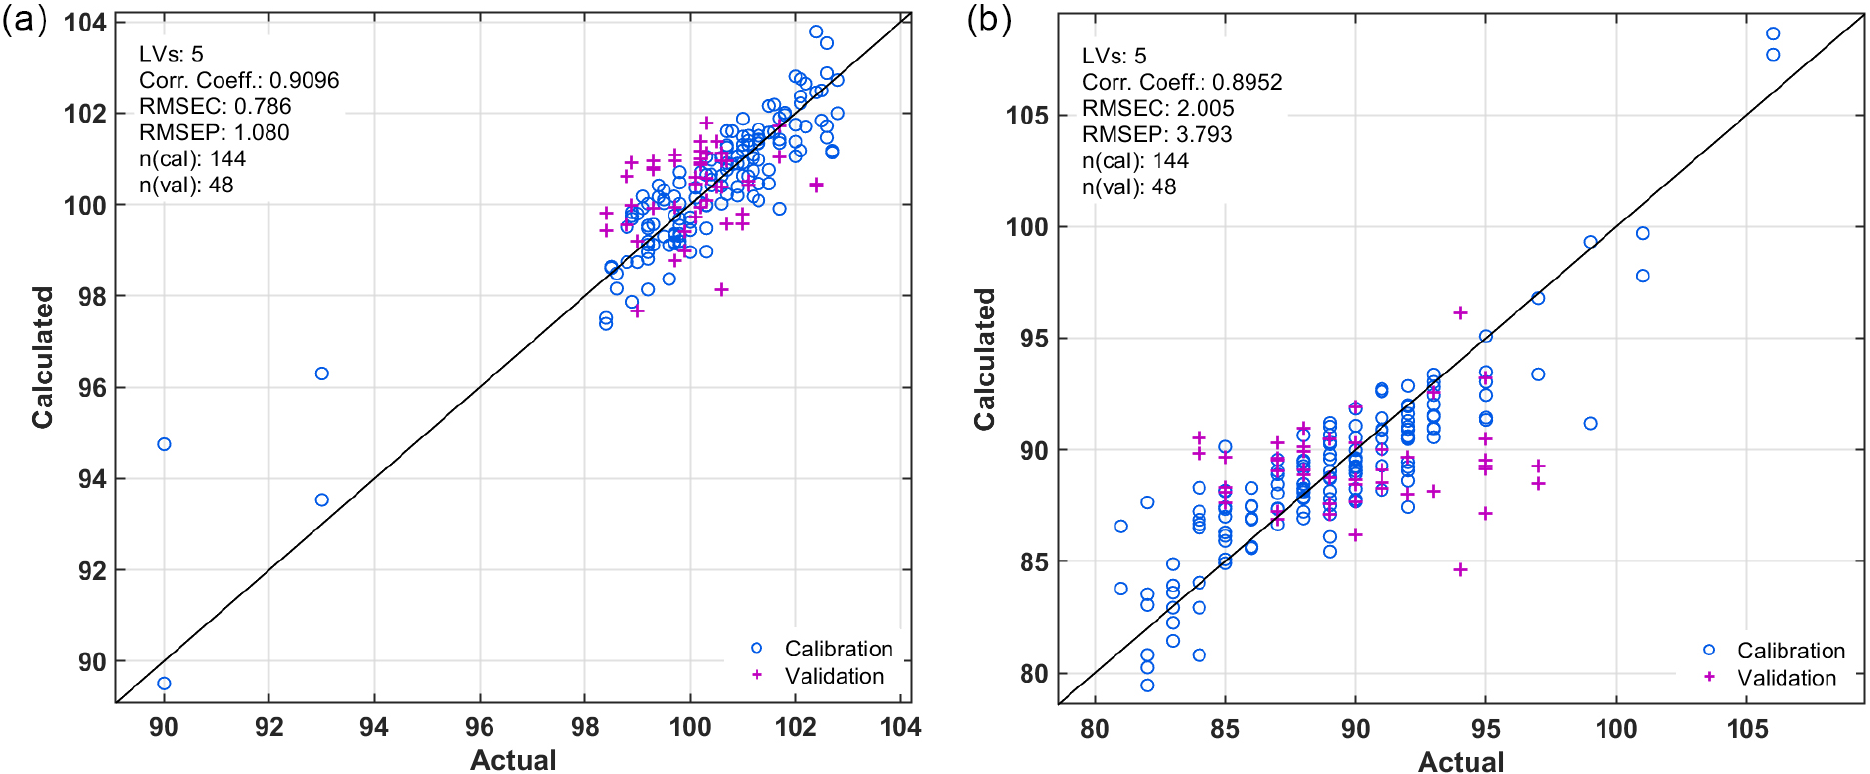
Based on the modeling results in Table 3 and Figure 8, most lercanidipine hydrochloride tablet samples had a content within the label range (95-105%), with a few samples showing 90%. The manual selection method performed well for the higher content samples, effectively utilizing excipient signals. However, its accuracy decreased for low-content samples (90%), limiting its applicability. For drug dissolution, the ICO algorithm outperformed the other methods. Although the RMSEP for dissolution was relatively large, it remains within an acceptable range considering the influence of multiple physicochemical factors. Overall, while NIR provides a rapid prediction method, further improvement is needed for low-content samples and dissolution prediction to enhance its practical applicability.
Model validation
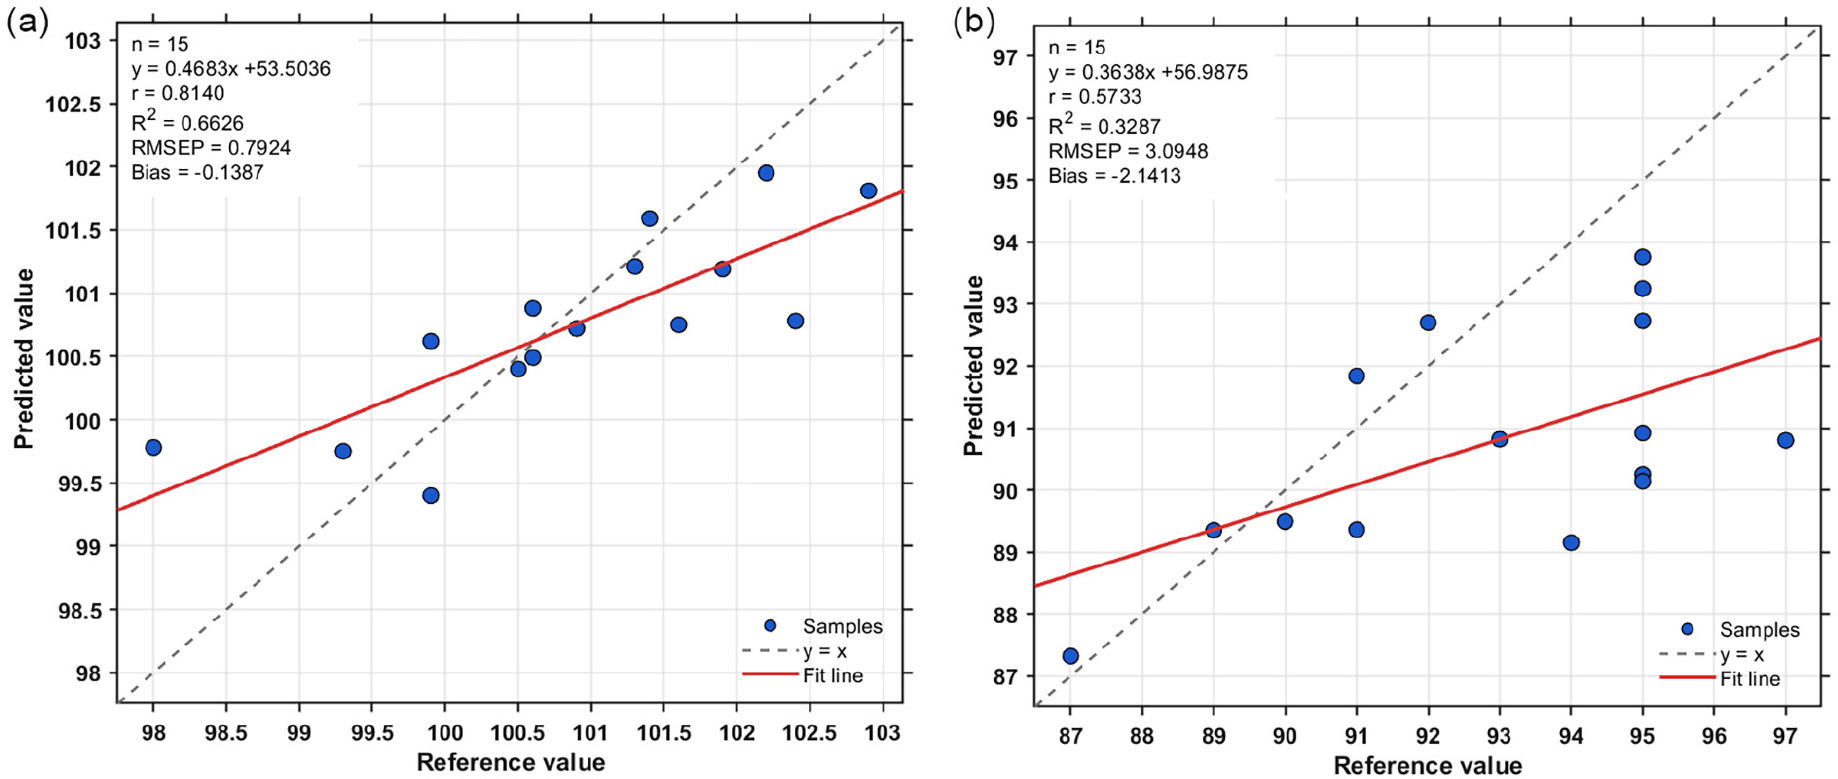
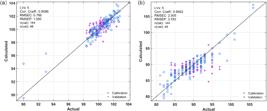
The external validation results are shown in Table 4. The content prediction model achieved a correlation coefficient of 0.8140, RMSEP of 0.7924, and bias of -0.1387, indicating moderate predictive capability. Figure 9a presents the external validation results for content, where the predicted values show reasonable agreement with the actual values. However, the drug dissolution model (Figure 9b) showed poorer performance, with a correlation coefficient of 0.5733, RMSEP of 3.0948, and a bias of -2.1413, indicating relatively high prediction errors, especially in the low and high value ranges. This could be attributed to the dissolution being influenced by the physical and chemical properties of the formulation. Further optimization is needed to improve the predictive accuracy of the dissolution model.

External validation results of (a) lercanidipine hydrochloride content and (b) drug dissolution
CONCLUSIONS
This study aimed to develop a near-infrared spectroscopy (NIR) method combined with chemometrics as an auxiliary tool for the rapid quality assessment of lercanidipine hydrochloride tablets. For active ingredient content, the model based on manually selected spectral intervals achieved a correlation coefficient of 0.9096 and RMSEP of 1.08, supporting its use as a rapid pre-screening tool for samples within the normal range (95-105%), while samples near the lower limit (90%) would still require conventional HPLC confirmation. For drug dissolution, although the ICO algorithm yielded the best performance among the tested methods, the correlation coefficient of 0.8952 and RMSEP of 3.79 indicate that the model is not suitable for accurate prediction of absolute dissolution values; however, it may still offer value for trend monitoring of relative changes within batch production. The current spectral acquisition was performed off-line using glass vials. With further model improvement and appropriate in-line instrumentation, the method could potentially be adapted for real-time quality assessment during manufacturing. Future work should enrich the calibration set with more low-content samples and explore more advanced modeling strategies to improve predictive accuracy.
ACKNOWLEDGMENTS
The authors would like to acknowledge the financial and institutional support from the following projects: Anhui Provincial Quality Project for Education in the New Era (Graduate Education, No. 2025zyxwjxalk280); Key Project of Natural Science Research in Colleges and Universities of Anhui Province (No. 2024AH051214); Anhui Provincial Quality Projects in Colleges and Universities (No. 2024cywzy039, No. 2024fwxx042); and the Practice Program for Science and Engineering Teachers of Anhui Colleges and Universities to Take Temporary Posts in Enterprises (No. 2024jsqygz56).
In addition, the authors express their sincere gratitude to the supervisors, teachers and fellow students of the research group for their valuable support, scientific guidance and fruitful collaboration throughout the development of this study.
DATA AVAILABILITY STATEMENT
The core data supporting the conclusions of this study have been presented in the manuscript. The original HPLC records and raw near-infrared spectral data are not publicly available, but they have been properly archived and may be obtained from the corresponding author upon reasonable request.
REFERENCES
-
1 Ferri, N.; Corsini, A.; Pontremoli, R.; Eur. Rev. Med. Pharmacol. Sci. 2022, 26, 7482. [Crossref]
» Crossref -
2 Hajdys, J.; Fularski, P.; Leszto, K.; Majchrowicz, G.; Stabrawa, M.; Młynarska, E.; Rysz, J.; Franczyk, B.; Int. J. Mol. Sci. 2023, 24, 14048. [Crossref]
» Crossref -
3 Cerbai, E.; Mugelli, A.; Eur. Rev. Med. Pharmacol. Sci. 2018, 22, 4025. [Crossref]
» Crossref -
4 Yang, J. H.; He, Y. H.; Yang, S. L.; Guangzhou Chem. Ind. 2015, 43, 15 (in Chinese). [Crossref]
» Crossref -
5 Grassi, G.; Robles, N. R.; Seravalle, G.; Fici, F.; J. Pharmacol. Pharmacother. 2017, 8, 155. [Crossref]
» Crossref -
6 Yang, Y.; Huang, J. T.; Liu, T. T.; Zhao, C. J.; Shenyang Yaoke Daxue Xuebao 2021, 38, 264 (in Chinese). [Crossref]
» Crossref -
7 Awotunde, O.; Cai, J.; El Azar, C. G.; Medina, D.; Eyolfson, S. I.; Hayes, K.; Waffo, C.; Djang’eing’a, R. M.; Ziemons, E. M.; Sacré, P.-Y.; Lieberman, M.; J. Pharm. Biomed. Anal. 2024, 246, 116189. [Crossref]
» Crossref -
8 Reddy, P.; Guthridge, K. M.; Panozzo, J.; Ludlow, E. J.; Spangenberg, G. C.; Rochfort, S. J.; Sensors 2022, 22, 1981. [Crossref]
» Crossref -
9 Beć, K. B.; Grabska, J.; Huck, C. W.; Chem. - Eur. J. 2021, 27, 1514. [Crossref]
» Crossref -
10 Chu, X.-L.; Chen, P.; Li, J.-Y.; Liu, D.; Xu, Y.-P.; J. Instrum. Anal. 2020, 39, 1181 (in Chinese). [Crossref]
» Crossref -
11 Usman, A. G.; Ghali, U. M.; Işık, S.; J. Fac. Pharm. Ankara Univ. 2020, 44, 188. [Crossref]
» Crossref - 12 Chinese Pharmacopoeia Commission; Pharmacopoeia of the People’s Republic of China, 2020 ed., Part IV; China Medical Science Press: Beijing, China, 2020, General Chapter 0512.
- 13 Chinese Pharmacopoeia Commission; Pharmacopoeia of the People’s Republic of China, 2020 ed., Part IV; China Medical Science Press: Beijing, China, 2020, General Chapter 0931.
-
14 Gerloff, C.; Yücel, M. A.; Mehlem, L.; Konrad, K.; Reindl, V.; Neurophotonics 2024, 11, 045008. [Crossref]
» Crossref -
15 Gu, Y.; Zhong, H.; Wu, J.; Li, K.; Huang, Y.; Fang, H.; Hassan, M.; Yao, L.; Zhao, C.; Foods 2025, 14, 1847. [Crossref]
» Crossref -
16 Zhu, J.; Ji, G.; Chen, B.; Yan, B.; Ren, F.; Li, N.; Zhu, X.; He, S.; Mu, Z.; Liu, H.; Front. Nutr. 2024, 11, 1505407. [Crossref]
» Crossref -
17 Li, X. X.; Wei, C. H.; Liang, B. W.; J. Food Saf. 2024, 44, e13167. [Crossref]
» Crossref -
18 Yan, C.; iScience 2025, 28, 112759. [Crossref]
» Crossref -
19 Zhang, W.; Kasun, L. C.; Wang, Q. J.; Zheng, Y.; Lin, Z.; Sensors 2022, 22, 9764. [Crossref]
» Crossref -
20 Fan, C. L.; Liu, Y.; Cui, T.; Qiao, M. M.; Yu, Y.; Xie, W. J.; Huang, Y. P.; Foods 2024, 13, 4173. [Crossref]
» Crossref -
21 Wang, F.; Wang, C.; Song, S.; Xie, S.; Kang, F.; Food Sci. Nutr. 2021, 9, 4420. [Crossref]
» Crossref -
22 Xia, Y. F.; Liu, Y.; Zhang, H.; Che, J. K.; Liang, Q.; Horticulturae 2025, 11, 352. [Crossref]
» Crossref -
23 Zou, X.; Zhao, J.; Povey, M. J. W.; Holmes, M.; Mao, H.; Anal. Chim. Acta 2010, 667, 14. [Crossref]
» Crossref -
24 Marañón, M.; Fernandez-Novales, J.; Tardaguila, J.; Gutiérrez, S.; Diago, M. P.; Biosyst. Eng. 2023, 229, 167. [Crossref]
» Crossref -
25 Beć, K. B.; Grabska, J.; Huck, C. W.; Molecules 2020, 25, 2948. [Crossref]
» Crossref -
26 Wang, F.; Wang, C.; Foods 2022, 11, 3133. [Crossref]
» Crossref -
27 Zhang, J.; Li, Y.; Wang, B.; Song, J.; Li, M.; Chen, P.; Shen, Z.; Wu, Y.; Mao, C.; Cao, H.; Wang, X.; Zhang, W.; Lu, T.; Anal. Bioanal. Chem. 2023, 415, 1719. [Crossref]
» Crossref -
28 Jiao, X.; Guo, D.; Zhang, X.; Su, Y.; Ma, R.; Chen, L.; Tian, K.; Su, J.; Sahati, T.; Aierkenjiang, X.; Xia, J.; Xie, L.; Foods 2025, 14, 366. [Crossref]
» Crossref -
29 Liu, S.; Chen, Y. M.; Wang, F.; Wu, J. J.; Tang, G.; Bai, S.; Quim. Nova 2025, 48, e-20250065. [Crossref]
» Crossref -
30 Abreu, L. F.; Lana, Â. M. Q.; Climaco, L. C.; Matrangolo, W. J. R.; Barbosa, E. P.; da Silva, K. T.; Rowntree, J. E.; da Silva, E. A.; Simeone, M. L. F.; Agronomy 2023, 13, 2525. [Crossref]
» Crossref -
31 Kakumba, J. M.; Hamuli, P. C.; Luyinama, M. M.; Kasago, F. M.; Monyele, M. T.; Kitenge, D. I.; Menanzambi, T. B.; Malongo, T. K.; Kialengila, D. M.; Kindenge, J. M.; Spectrosc. J. 2024, 2, 105. [Crossref]
» Crossref -
32 Wang, Y. L.; Zhang, C.; Li, X. H.; Xing, L. Z.; Lv, M. C.; He, H. J.; Pan, L. Q.; Ou, X. Q.; Foods 2025, 14, 2393. [Crossref]
» Crossref -
33 Zhang, J. F.; Qin, Y. H.; Zhang, H.; Hu, W. Y.; Bai, X. L.; J. Anal. At. Spectrom. 2025, 40, 2548. [Crossref]
» Crossref -
34 Raposo-Neto, J. J.; Kowalski-Neto, E.; Luiz, W. B.; Fonseca, E. A.; Cedro, A. K. C. L.; Singh, M. N.; Martin, F. L.; Vassallo, P. F.; Campos, L. C. G.; Barauna, V. G.; J. Pers. Med. 2024, 14, 9. [Crossref]
» Crossref -
35 Yang, Q.; Li, Y.; Li, J.; Zhang, Z.; Liu, Q.; Guo, G.; Wang, S.; Wang, X.; Xie, G.; ACS Omega 2025, 10, 14755. [Crossref]
» Crossref
Edited by
-
Associate Editor handled this article: Eduardo M. Richter