Abstract
In Brazil, sub-national governments have played a particularly important role as the key actors implementing non-pharmaceutical interventions to halt the spread of COVID-19. Building on the methodology proposed by the Oxford COVID-19 Government Response Tracker (OxCGRT), we coded the stringency levels of state-level school, commerce, services, industry, public gathering, and private event closure policies and describe these actions’ duration at the state-level in Brazil from early February to mid-May 2020. Our results suggest significant heterogeneity across Brazil and across weeks in social distancing policy stringency during this period. We then apply dynamic times-series cross-sectional methods to evaluate the effect of anti-contagion policies on the population’s mobility using cell phone location data. We find that anti-contagion policies had a significant effect on producing higher adherence to remaining at home even though social distancing policies were relatively moderate as compared to other countries. Our results also suggest that social distancing policies have a greater impact when a more complete and coherent set of policies were introduced and sustained by state governments.
Keywords:
COVID-19; non-pharmaceutical interventions; Brazil; states; federalism
Resumo
No caso brasileiro, os governos subnacionais exerceram um papel particularmente importante na implementação de medidas não farmacológicas para contenção do alastramento do COVID-19. Baseando-se na metodologia do Oxford COVID-19 Government Response Tracker (OxCGRT), codificamos a rigidez das políticas de fechamento de escolas, comércio e serviços, aglomerações públicas e eventos privados implementadas em nível estadual e descrevemos sua duração nos estados brasileiros entre meados de fevereiro e a metade de maio de 2020. Nossos resultados sugerem alta heterogeneidade ao longo do tempo e entre os estados na rigidez das políticas de distanciamento social durante o período analisado. Aplicamos em seguida métodos dinâmicos de séries temporais em painel com o objetivo de avaliar o efeito da rigidez das políticas sobre a mobilidade da população. Para isso, utilizamos dados de localização provenientes de celulares para mensurar mobilidade. Apesar da adesão relativamente moderada às medidas de distanciamento social pelos estados brasileiros, em comparação a estados em outros países durante o mesmo período, nossos achados sugerem que as políticas de distanciamento social tiveram efeito significativo na produção de níveis mais altos de adesão à permanência em casa pela população. Nossos resultados também sugerem que as políticas de distanciamento social têm maior impacto quando um conjunto mais completo e coerente de políticas é introduzido e sustentado pelos governos estaduais.
Palavras-chave:
COVID-19; intervenções não farmacológicas; Brasil; estados; federalismo
Resumen
Los gobiernos implementaron una serie de políticas para combatir la pandemia de COVID-19. En el caso brasileño, los gobiernos subnacionales jugaron un papel particularmente importante como actores clave en la implementación de medidas no farmacológicas para contener la propagación del virus. A partir de la metodología del Rastreador de Respuestas Gubernamentales frente a la COVID-19 desarrollado por la Universidad de Oxford (OxCGRT), codificamos las distintas restricciones como el cierre de escuelas, comercios, servicios, industrias y la prohibición de aglomeraciones públicas y eventos privados, implementados en los estados brasileños y describimos su duración entre mediados de febrero y la primera quincena de mayo de 2020. Nuestros resultados sugieren una alta heterogeneidad respecto de la rigidez de las políticas de distanciamiento social, a través de los estados y a lo largo de las semanas de este período. Luego aplicamos la técnica de análisis de series temporales dinámicas del tipo panel para evaluar el efecto de las políticas para evitar contagios sobre la movilidad de la población, empleando datos de la ubicación de teléfonos celulares. Encontramos que a pesar de que las medidas de distanciamiento social implementadas por los estados brasileños fueron relativamente moderadas, en comparación con los estados de otros países durante el mismo período, nuestros hallazgos sugieren que las políticas para combatir los contagios tuvieron un efecto significativo en el logro de mayores niveles de adhesión a la permanencia en el hogar. Asimismo, nuestros resultados indican que las políticas de distanciamiento social tuvieron un mayor impacto cuando los gobiernos estatales introdujeron y mantuvieron un conjunto más amplio de medidas coherentes e integrales.
Palabras clave:
COVID-19; intervenciones no farmacológicas; Brasil; estados; federalismo
1. INTRODUCTION
Governments across the world have responded rapidly and with an unprecedented wide-range of measures to address the spread of a coronavirus, which was first detected in China and reported to the WHO in December 2019.1
1
The Chinese government first reported to the WHO Country Office in China a pneumonia of unknown cause detected in Wuhan, China on December 31, 2019.
The virus (abbreviated “COVID-19”) was declared a pandemic by the World Health Organization (WHO) on March 11, 2020 (World Health Organisation, 2020World Health Organisation. (2020, March 11). WHO Director-General’s Opening remarks at the media briefing on COVID-19. Retrieved from https://www.who.int/dg/speeches/detail/who-director-general-s-opening-remarks-at-the-media-briefing-on-covid-19---11-march-2020
https://www.who.int/dg/speeches/detail/w...
) and was detected in most countries by early March. A range of policies have been adopted by most nations (Hsiang et al., 2020Hsiang, S., Allen, D., Annan-Phan, S., Bell, K., Ian Bolliger, … Wu, T. (2020). The effect of large-scale anti-contagion policies on the COVID-19 pandemic. Nature, 584(7820), 262-267.; Kim & Castro, 2020Kim, S. & Castro, M. C. (2020). Spatiotemporal pattern of COVID-19 and government response in South Korea (as of May 31, 2020). International Journal of Infectious Diseases, 98, 328-333.; Maier & Brockmann, 2020Maier, B. F., & Brockmann, D. (2020). Effective containment explains subexponential growth in recent confirmed COVID-19 cases in China. Science, 368(6492), 742-746.). These policies have included non-pharmaceutical interventions to increase social distancing, augment public health provision, and fiscal and monetary policies to sustain economic activity. There has been significant scholarship directed at assessing the effectiveness of these policies (Niud & Xu, 2020Niud, Y., & Xu, F. (2020). Deciphering the power of isolation in controlling COVID-19 outbreaks. The Lancet Global Health, 8(4), e452-e453.; Rader et al., 2020Rader, B., Scarpino, S. V., Nande, A., Hill, A. L., Adlam, B. ... Kraemer, M. U. G . (2020). Crowding and the shape of COVID-19 epidemics. Nature medicine, 26, 1829-1834.).
As one of the world’s most populous democracies encompassing roughly half of South America, the COVID pandemic struck Brazil, a country with over 200 million inhabitants, as it continued to face political and economic duress stemming from the aftermath of a protracted regression that began in 2014 (Barbosa, 2017Barbosa, F. H, Filho. (2017). A crise econômica de 2014/2017. Estudos Avançados, 31(89), 51-60.) and political polarization stemming from the impeachment of president Dilma Rouseff in 2016 and the election of Jair Bolsonaro in 2018 (Abrucio, Grin, Franzese, Segatto & Couto, 2020Abrucio, F. L., Grin, E. J., Franzese, C., Segatto, C. I., & Couto, C. G. (2020). Combate à COVID-19 sob o federalismo bolsonarista: um caso de descoordenação intergovernamental. Revista de Administração Pública, 54(4), 663-677.). In this context, the risks posed by the coronavirus were especially high for millions of people who live in poverty or have only recently emerged from it and due to the limited infrastructure that exists for those requiring hospital care (Rache et al., 2020Rache, B., Rocha, R., Nunes, L., Spinola, P., Malik, A. M., & Massuda, A. (2020). Necessidades de infraestrutura do SUS em preparo à COVID- 19: leitos de UTI, respiradores e ocupação hospitalar. São Paulo, SP: Instituto de Estudos para Políticas de Saúde.). Since the first confirmed case in Brazil occurred on February 25, 2020 (Candido et al., 2020Candido, D. S., Watts, A., Abade, L., Kraemer, M. U. G., Pybus, O. G., ... Faria, N. R. (2020). Routes for COVID-19 importation in Brazil. Journal of Travel Medicine, 27(3). Retrieved from https://academic.oup.com/jtm/article/27/3/taaa042/5809508
https://academic.oup.com/jtm/article/27/...
), the epicenter of COVID-19 infection rates remained concentrated in the State of São Paulo up until mid-May 2020 (Ministry of Health, 2020Ministry of Health, Brazil. (2020). COVID-19 State and Local Policy Dashboard. Retrieved from https://covid.saude.gov.br/
https://covid.saude.gov.br/...
). The coronavirus pandemic struck many of the states of Brazil, and although the proportion of infections was still low in some states by early May, other states experienced a rapid increase in infections and the collapse of their hospital system due to the sudden surge in patients (Orellana, Cunha, Marrero, Horta & Leite, 2020Orellana, J. D. Y., Cunha, G. M., Marrero, L., Horta, B. L., & Leite, I. C. (2020). Explosão da mortalidade no epicentro amazônico da epidemia de COVID-19. Cadernos de Saúde Pública, 36, e00120020.).2
2
We are well aware that there are reasons to suspect that these low figures may be because testing was limited to severely ill patients in the early months of the pandemic, as well as other problems that may affect why the official rate of confirmed cases may be lower than the actual, or ”true” rate (Li et al., 2020).
As we document in this paper, sub-national governments played a particularly important role as the key actors implementing social distancing measures to halt the spread of the virus in Brazil (Barberia et al., 2020bBarberia, L. G., Moreira, N. P., Cantarelli, L., Claro, M. L., Rosa, I S. C. ... Zamudio, M. (2020b). Falta de coordenação entre o governo Federal e estados enfraquece a política de distanciamento social. A flexibilização sem critérios pode agravar a pandemia. Rede de Pesquisa Solidária em Políticas Públicas e Sociedade. Retrieved from https://redepesquisasolidaria.org/nao-categorizado/falta-de-coordenacao-entre-o-governo-federal-e-estados-enfraquece-a-politica-de-distanciamento-social-a-flexibilizacao-sem-criterios-pode-agravar-a-pandemia/
https://redepesquisasolidaria.org/nao-ca...
). Building on Oxford COVID-19 Government Response Tracker (OxCGRT) (Hale et al., 2020Hale, T., Angrist, N. Cameron-Blake, E., Hallas, L., Kira, B., … Webster, S. ( 2020 ). Oxford COVID-19 Government Response Tracker. Retrieved from http://www.bsg.ox.ac.uk/covidtracker
http://www.bsg.ox.ac.uk/covidtracker...
), we show how the stringency of government policy responses to COVID-19 can be used to better understand how state governments deterred COVID-19 in the context of federalism in a middle-income country. In this sense, our study contributes to a series of recent studies that have aimed to examine how sub-national policies affect mobility (Jay et al., 2020Jay, J., Bor, J., Nsoesie, E. O., Lipson, S. K., Jones, D K... … Raifman, J. (2020). Neighbourhood income and physical distancing during the COVID-19 pandemic in the United States. Nat Hum Behav. Retrieved fromhttps://doi.org/10.1038/s41562-020-00998-2
https://doi.org/10.1038/s41562-020-00998...
), cases and hospitalizations (Courtemanche, Garuccio, Le, Pinkston & Yelowitz, 2020Courtemanche, C., Garuccio, J., Le, A., Pinkston, J., & Yelowitz, A. (2020). Strong Social Distancing Measures In The United States Reduced The COVID-19 Growth Rate: Study evaluates the impact of social distancing measures on the growth rate of confirmed COVID-19 cases across the United States. Health Affairs, 39(7), 1237-1246. Retrieved fromhttps:/doi.org/10.1377/hlthaff.2020.00608
https://doi.org/10.1377/hlthaff.2020.006...
; Hsiang et al., 2020Hsiang, S., Allen, D., Annan-Phan, S., Bell, K., Ian Bolliger, … Wu, T. (2020). The effect of large-scale anti-contagion policies on the COVID-19 pandemic. Nature, 584(7820), 262-267.), and how sub-national political dynamics impact policy adoption distinctly in federations (Adolph, Amano, Bang-Jensen, Fullman & Wilkerson, 2020Adolph, C., Amano, K., Bang-Jensen, B., Fullman, N., & Wilkerson, J. (2020). Pandemic Politics: Timing State-Level Social Distancing Responses to COVID-19. Journal of Health Politics, Policy and Law. Retrieved from https://doi.org/10.1215/03616878-8802162
https://doi.org/10.1215/03616878-8802162...
). Unlike these studies, which mainly focus on developed economies in North America and Europe, we explore dynamics in Latin America’s largest federation.
After introducing the (COVID-19 Government Response Tracker for the Brazilian Federation [CGRT-BRFED]) (Barberia et al., 2020aBarberia, L. G.; Moreira, N. P.; Cantarelli, L.; Claro, M. L.; Rosa, I S. C.; ... Aparecida, D. (2020a). COVID-19 Government Response Tracker for the Brazilian Federation (CGRT-BRFED). Retrieved from https://github.com/cgrtbrfed/covid19policytracker
https://github.com/cgrtbrfed/covid19poli...
), the remaining sections of this study evaluate whether variations in the social distancing policies adopted by the 26 states of the Brazilian federation and the federal district since the onset of the pandemic led to different rates of mobility by citizens residing in these states. Using the CGRT-BRFED, which details the school, work, and large, public gathering closure policies that have been enacted and the duration of these actions at the state level in Brazil, we test whether state-level Social Distancing Policy Stringency policies impacted the movement of the population.3
3
These indicators are being included in the original Oxford COVID-19 Government Response Tracker (OxCGRT) to code the sub-national policies of Brazil in collaboration with scholars from Oxford and the Fundac¸a˜o Getulio Vargas.
Our results suggest that social distancing policies had a greater impact on reducing mobility when a more complete and rigorous set of policies were adopted. As a robustness check, further tests were conducted to verify if these results were robust to national political dynamics. Specifically, our results show that state-level Social Distancing Policy Stringency remained relevant to explaining population mobility holding constant President Bolsonaro’s televised presidential addresses and key political events, such as the firing of Health Minister Luiz Mandetta, on April 16th, 2020, and the resignation of Nelson Teich, the second Health Minister of the Bolsonaro government, on May 15th, 2020.
2. DATA AND METHODS
To slow the spread of the virus, a broad range of policies have been enacted by governments to increase the physical distance between people. These policies have been commonly referred to as non-pharmaceutical interventions. To contain the spread of the virus’s transmission, approximately three weeks after the first confirmed case in the country, the primary response in the early stages of the pandemic to enact social distancing policies was made by state governments in mid-March 2020. These actions were made possible because the authority to adopt social distancing policies was given to sub-national governments by the Federal government in early February4 4 Retrieved from http://www.planalto.gov.br/ccivil_03/_ato2019-2022/2020/lei/l13979.htm and subsequently affirmed by the Supreme Court5 5 Retrieved from http://www.stf.jus.br/arquivo/cms/noticiaNoticiaStf/anexo/ADI6341.pdf . In the early stages, state policies also tended to supersede local municipal policies because although the responsibility for adopting measures against COVID-19 in the Brazilian federation is concurrently shared between federal, state, and city governments, Supreme Court rulings affirmed that lower levels of government could not adopt less stringent policies than those adopted by higher- level governments.
Similar to the original Oxford COVID-19 Government Response Tracker (OxCGRT) (Hale et al., 2020Hale, T., Angrist, N. Cameron-Blake, E., Hallas, L., Kira, B., … Webster, S. ( 2020 ). Oxford COVID-19 Government Response Tracker. Retrieved from http://www.bsg.ox.ac.uk/covidtracker
http://www.bsg.ox.ac.uk/covidtracker...
) indicators, the CGRT-BRFED uses publicly available information to code the stringency measures adopted by the federal and 26 state governments and the federal district of Brasilia. The novelty of the CGRT-BRFED is that it emphasizes that a wide range of government policies are being enacted by levels of government (federal, state, and municipal). We coded policies as prescribed in government decrees, laws, and other official rulings published in government official gazettes for each policy. Our thorough approach to search these official government sources reduces measurement error. For each policy, the length of the policy was recorded. The time-series cross-section data set consists of 145 (February 2nd to May 23rd, 2020) observations for each state (26 units) and the Federal District of Brasilia.6
6
Following the OxCGRT, the indicators of the CGRT-BRFED were scored for each day starting on January 1st, 2020. This is well in advance of the onset of the first confirmed cases of COVID-19 in Brazil. In this study, we focus on the data from February 2nd to May 23rd. By February 1st, the WHO had already declared a health emergency, and cases had been detected in several countries.
As an airborne virus, measures have been enacted to reduce physical and social contact and ensure individuals’ physical distancing. These measures are deemed to be particularly important in public spaces where many people frequent facilities (e.g., schools, workplaces in city centers) or gatherings that assemble large crowds (e.g., church, concerts, cinemas, shopping centers, etc.). Table 1 describes the closure policies for: schools (SDP1), the commerce and service sectors (SDP2A), industry (SDP2B), public gatherings (SPD3), and private events (SDP4)7 7 In the OxCGRT, overall work closures are recorded. As we are interested in more granular-level diagnostics at the local level, the CGRT-BRFED further desegregates economic activity to distinguish whether states restricted commercial, service-sector, and industrial activities. .
Following the OxCGRT coding, policy decisions regarding social distancing for variables SDP1, SDP2A, and SDP2B receive a score of 1 (one) if they recommend closures, 2 (two) if the closure is mandatory, but non-essential services are permitted to operate within the state’s jurisdiction, and 3 (three) if the suspension becomes mandatory for all levels and sectors. In case there are no closure mandates in place, a score 0 (zero) was assigned. We consider non-essential services as referring to activities that are not specifically related to either the health or food sectors. For the public gatherings (SDP3), policies are scored from 0 (zero) to 2 (two). Lastly, private gatherings and events (SPD4) receive a score of 1 (one) when there is a restriction on gatherings of over 1000 people, 2 (two) if there are restrictions on gatherings between 101-1000 people, 3 (three) if there are restrictions on gatherings between 11-100 people, and 4 (four) if there are restrictions on gatherings of up to 10 people. Furthermore, each policy is also coded for its geographical coverage. If the closure policies are directed at the entire state, these policies receive a geographical target score of 1 (one), and if the policy are geographically targeted for specific hot spots a score of 0 (zero) is assigned. Finally, each policy receives a combined score, considering the two dimensions. Additionally, the four social distancing indicators were then summed to get a composite Social Distancing Policy Stringency measure, and this measure was re-scaled to create a composite Social Distancing Policy Stringency (SDPS) Index that ranges from 0 (no policy intervention) to 100 (maximum level of intervention)8 8 As part of our project to map public policies, we expect to make future changes to further refine the coding and overall Social Distancing Policy Stringency Index. We also plan to make further refinements to address geographic implications. These changes and new indicators will be posted at: https://github.com/cgrtbrfed/covid19policytracker. . As we carefully inspected all government decrees and therefore clearly identified mandated versus recommended closures as regulated in laws, there are no missing data for these indicators in the CGRT-BRFED data set9 9 Additional policies targeting social distancing that do not refer to closures or activity suspension were not analyzed in this study. We recognize the importance of these measures in combating the COVID-19 pandemic. Nevertheless, we decided to restrict our analysis to analyze the intensity of closures’ intensity on mobility. .
There are other approaches that have been employed to evaluate social distancing policies and how they affect the pandemic. For example, Hsiang et al. (2020Hsiang, S., Allen, D., Annan-Phan, S., Bell, K., Ian Bolliger, … Wu, T. (2020). The effect of large-scale anti-contagion policies on the COVID-19 pandemic. Nature, 584(7820), 262-267.) emphasize the discrete effect of the deployment of these policies. Since our goal in this paper is to measure the intensity of the social distancing policies on compliance, the SDPS - as an aggregate index that measures the intensity of the combined stringency policies- is well suited to the purpose of this study.
To capture the extent to which citizens in different states comply with social distancing policies, we use different measures of location mobility based on aggregated data from the location analysis company InLoco, which tracks about 60 million smart- phone cellphone users nation-wide daily (Ferraz, 2020Ferraz, A. (2020). Carta Aberta: Os dados de geolocalização das operadoras de telefonia podem atrapalhar mais do que ajudar no combate à crise do COVID-19. InLoco. Retrieved from https://www.linkedin.com/pulse/carta-aberta-os-dados-de-geolocaliza
https://www.linkedin.com/pulse/carta-abe...
). InLoco provided us with data based on three measures. The first measure is the percentage of cellphones at the same geographical location as they were during work hours as they were in non-work hours (10 p.m. to 6 a.m.). The second measure is the change in the average number of kilometers traveled on a specific day in each state relative to the first five weeks of the year. The third measure is the change in the average percentage of non-essential trips made on each specific day in each state relative to the first five weeks of the year. It should be noted that these data are regarded as highly precise to location as the estimated standard error has been calculated to be 2.8 meters. The data are aggregate measures of overall mobility each day in each state.
It is important to note that these mobility measures are not equivalent to the general population’s behavior. The data capture the behavior of a sub-sample of smartphone users, and they do not represent the significant share of the population who do not own smartphones, which is larger in the poorer states of the Brazilian federation. In addition, January and February are summer vacation months in Brazil. There are reasons to suspect that mobility patterns are lower due to schools not being in session in these months or only recently restarting. Due to this feature, the data on the change in distance traveled, and change in non-essential trips may suffer from measurement error. These measures should also not be interpreted as capturing individual adherence to social distancing practices, such as mask use, hand-washing, and maintaining at least 2 meters of distance from others in public spaces.
We also created dummy variables for key national political events, holidays and the days of the week. We include a dummy for the carnaval, Easter, Tiradentes, Mother’s day, and Workers’ day holidays, a dummy variable for the day of the week, and a time trend. Besides, we include a variable coded as equal to one for those dates following the evening in which the President delivered a nation-wide address during the pandemic addressing COVID-19. Finally, we include a dummy variable for April 16, 2020, which is when President Bolsonaro fired the Minister of Health, Luiz Mandetta, and for May 15th, 2020, which is the date the second Health Minister, Nelson Teich, resigned.
The dynamic time-series cross-section model can be summarized as10 10 The unit root tests indicate that our main dependent variables does not contain a unit root process. We applied the Fisher test for panel unit roots which perform Augmented Dickey-Fuller and Phillips-Perron approaches to test for stationary processes. :
3. STATE-LEVEL SOCIAL DISTANCING POLICIES
The Social Distancing Policy Stringency (SDPS) Index of the CGRT-BRFED confirms the strong role states played in mobilizing quickly and collectively to adopt social distancing policies in mid-March throughout the Brazilian federation. States adopted social distancing measures to close a wide array of activities, including schools (SDP1), commerce and industry (SDP2A and SDP2B), and to restrict public gatherings (SDP3), and private events (SDP4). In some states, policies were adopted in consonance with the first weeks of the epidemic. However, in other states, governments acted preemptively, adopting more stringent social distancing measures in advance of a more widespread outbreak. However, no state implemented what is equivalent to a full lockdown containment strategy (Barberia et al., 2020bBarberia, L. G., Moreira, N. P., Cantarelli, L., Claro, M. L., Rosa, I S. C. ... Zamudio, M. (2020b). Falta de coordenação entre o governo Federal e estados enfraquece a política de distanciamento social. A flexibilização sem critérios pode agravar a pandemia. Rede de Pesquisa Solidária em Políticas Públicas e Sociedade. Retrieved from https://redepesquisasolidaria.org/nao-categorizado/falta-de-coordenacao-entre-o-governo-federal-e-estados-enfraquece-a-politica-de-distanciamento-social-a-flexibilizacao-sem-criterios-pode-agravar-a-pandemia/
https://redepesquisasolidaria.org/nao-ca...
). Thus, though there is strong evidence of across country stringency increases, there is significant heterogeneity depending on the specific state and the specific phase of the epidemic.
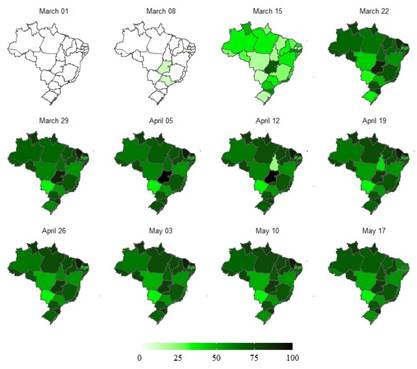
Figure 1 depicts the evolution in the level of the Social Distancing Policy Stringency index in each Brazilian state in the twelve weeks from March 1 to May 23, 2020. The darkest colored states in each map are the states with the highest intensity in the stringency level of social distancing in that specific week.

By comparing across these weekly figures, we are able to view how the stringency of social distancing increased within and across states over time. As Figure 1 confirms, Social Distancing Policy Stringency measures were only in place in three states: Goiás, São Paulo and Rio de Janeiro by March 13, 2020. This is two weeks after the first case was confirmed in the state of São Paulo, and by when there were 25 positive cases already confirmed by the Ministry of Health. By March 20, 2020 there was a rapid and exponential rise in the SDPS index across all states in Brazil. In other words, nearly four weeks after the onset of the pandemic, there was no state that had not responded by introducing some type of social distancing policies to halt the transmission of coronavirus. By March 27, 2020, there were 3,477 cases across Brazil and by this date, we can see there is a marked response in increased social distancing measures being adopted. The states with the most stringent response were Goiás and Ceará in the week of March 15, even though the epicenter of the pandemic remained in São Paulo state throughout this period.

Figure 2 provides an overview of the timing and stringency level of the policies adopted in the state of São Paulo. The richest and most populous state of Brazil, São Paulo was the pandemic’s Brazilian epicenter from March to May 2020. São Paulo issued orders to mandate school closures by March 16. Commercial activities were also closed, but industry closures were never issued. There were no mandates issued to prohibit public gatherings; the state’s government issued only recommendations, and no restrictions were placed on private gatherings. Although it was a pioneer in the early adoption of non-pharmaceutical interventions, the state ended the month of May being among the least stringent states in the federation. By then, there were already announcements of the further lifting of measures in the coming weeks, especially in commerce and activities regulations, that were the object of protestations by private parties. Even though, the alarming fact remains that the state led in daily cases and deaths in this period.

Social Distancing Policy Stringency (SDPS) Index in States with THE Highest Deaths per 100 Thousand, March 1-May 20, 2020
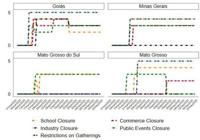
Social Distancing Policy Stringency (SDPS) Index in States with THE Lowest Deaths per 100 Thousand, March 1-May 23, 2020
Figure 3 plots the evolution in the Social Distancing Policy Stringency (SDPS) Index for the four states with the highest number of deaths per 100,000 people. This figure highlights that the state of Rio de Janeiro was the first of these to react. Ceará adopted the strictest measures as it was the only to close industries. There is considerable heterogeneity in the measures adopted by each of the four states, especially in Rio, where there were many policy changes.
Figure 4 shows the Social Distancing Policy Stringency for the four states with the lowest number of deaths per 100,000 people. In an earlier stage of the epidemic, Mato Grosso do Sul had few cases and adopted few policies. It was the Brazilian state with the lowest stringency score in this period. Goiás, on the other hand, has been very active in mandating social distancing and, for some time, was the state with some of the most stringent policies. However, the state began to ease policies in mid-April.
4. RESULTS
In this section, we use time-series cross-sectional analysis to examine the impact of the level of stringency of the social distancing policies adopted by Brazilian states to examine whether mobility depends on the rigidity of the types of measures enacted. We estimate autoregressive distributed lag models (ARDL) to examine the impact of social distancing policies on mobility (Equation 1). Our dependent variable is mobility. We employ three different measures: home permanence, non-essential trips, and distance traveled. Our key independent variable is a composite measure of social distancing policies.
We estimate the impact of the SDPS index and the separate effect of each of the six policies (school closures, commerce and service-sector closures, industry closures, public gathering restrictions, and private gathering restrictions) as described in Table 1. The estimation results for the ARDL models are presented in Table A3 11 11 For robustness checks, we estimated models controlling for possible omitted variables. The results are presented in the appendix. Table A4 shows the coefficients for controlling for Bolsonaro 2018 vote share as a proxy for political ideology and the coefficients for state fixed-effects models. Table A5 presents the results when we control for daily deaths and daily cases. Figure A1 shows the long-term effects of School Closures, Industry Closures, Commerce Closures, Public Gatherings Prohibitions, and Private Gathering Prohibitions as well as the long-term coefficients for the Social Distancing Policy Index for all the models employed in robustness checks. .
To assess our hypothesis that more rigid social distancing policies led to lower mobility, we calculate and test the statistical significance of the short and long-term effects of the social distancing policies on quarantine compliance. The estimated coefficient on each policy variable in levels and the lagged dependent variable are is used to calculate the long-term impact (De Boef & Keele, 2008De Boef, S., & Keele, L. (2008). Taking time seriously. American Journal of Political Science, 52(1), 184-200.). We are mainly interested in the long-term effects of the social distancing policy variables, as these show how compliance to quarantine is permanently affected after an increase in social distancing policies.
The results reported in Table A3 show that social distancing policy stringency (SDPS) is a strong predictor of state-level mobility. Social distancing policies had a positive short-term impact on the percentage of cellphones at the same geographical location as they were during work hours as they were in non-work hours (10 p.m. to 6 a.m.). When sub-national governments adopt the highest-level social distancing policy stringency (SDPS), there is an expected short-run impact of 4.86% (or between 2.54 and 7.18% using a 95% confidence interval) on home permanence (column 2). The expected short-run impact of rigorous social distancing policies (SDPS = 100) is a reduction of 19% (or between -0.27 and -0.11 using a 95% confidence interval) on the average trips to non-essential locations (column 4). Finally, stringent social distancing policies (SDPS = 100) produce a reduction of 0.11 (or between -0.15 and -0.06 using a 95% confidence interval) on the average kilometers driven by an individual in a specific day in a state (column 6). Nonetheless, up to now, among all Brazilian states, only Goiás (from April 5 to April 18, 2020) enacted rigorous policies and achieved the highest level of stringency in the SDPS due to these four closure policies (SDPS = 100).
The short-run impacts of each policy on quarantine compliance measures underscore that there are benefits from changing a single policy’s stringency. When states suspend or cancel classes in all schools in that place (S1 = 4), our results suggest that such a measure produces an immediate increase of 2.08% (or between 0.89 and 3.27 using a 95% confidence interval) in the share of people that stayed home (column 1). A strict policy of school closures also produces an immediate decrease of 0.09% (or between -0.13 and -0.06 using a 95% confidence interval) on trips for non-essential services (column 3) and a reduction of 0.04 (or between -.08 and -0.01 using a 95% confidence interval) on the average distance traveled (column 5). Besides school closures, a strict policy of prohibition of public gatherings reduces in 0.08% (or between -0.13 and -0.04 using a 95% confidence interval) the trips to non-essential services (column 3). Commerce and service closures also produce an immediate impact on quarantine compliance. A strict policy on commerce and service closures reduces in 0.06 (or between -0.08 and -0.02 using a 95% confidence interval) the average kilometers undertaken on a specific day in a state (column 5). All else equal, our results suggest that the changes in other policies did not have a statistically significant short-run impact on quarantine compliance measures.
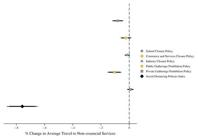
The LONG-TERM Impact of Social Distancing Policies on the Change in Non-Essential Trips from Baseline

The LONG-TERM Impact of Social Distancing Policies on the Change in Distance Traveled from the Baseline
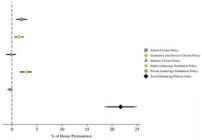
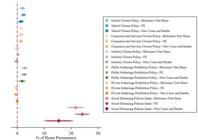
Figure 5 depicts the parameter estimates and the 95% confidence intervals for the long-term effects for social distancing policies reported in Table A3. There are long-term effects on the percentage of people that stay at home when governments enact closure policies directed at schools, commerce and services and public and private gatherings. However, the long-run impact is substantively larger when states implement a package of policies together. Rigorous social distancing policies (SDPS = 100) increases the percentage of people that stayed at home by 21.70% (or between 18.47% and 24.94% using a 95% confidence interval).
Figure 6 depicts the long-term effects of social distancing policies on the change in non-essential trips. A package of stringent social distancing policies produces a reduction of 0.76% (or between -0.87 and -0.65 using a 95% confidence interval) in the trips made for non-essential services relative to the baseline.
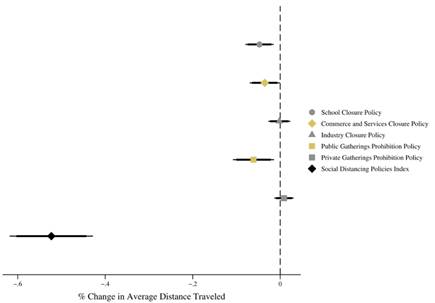
Figure 7 shows the long-term effects of social distancing policies on the change in average distance traveled in the state. As in the case of the other compliance measures analyzed, a package of rigorous social distancing policies reduces the average kilometers traveled in a day by 0.52 (or between -0.62 and -0.43 using a 95% confidence interval) relative to the baseline.
5. CONCLUSION
The goal of this study was to contribute to the understanding of the effectiveness of social distancing policy measures to contain the further spread of COVID-19 across Brazil’s 26 states and the federal district in the early pandemic stage. By providing a comparable measure of the stringency of social distancing policies adopted by state governments over time, our results highlight that state government were instrumental in Brazil’s efforts to slow down the transmission rate. First, social distancing measures were enacted across a wide range of activities by state governments in the weeks immediately after the first cases were detected. Second, some states stand out for their proactive adoption of stringent social distancing policies before a widespread outbreak. Finally, states introduced social distancing measures and kept these measures in place for several weeks.
As shown in the analysis, each non-pharmaceutical policy contributed to the mobility of specific groups across states. Consequently, holding the remaining policies constant, school closures (SDP1), commerce and industry closures (SDP2A and 2B), restrictions on public and private gatherings (SDP3 and SDP4) affected social distancing. Moreover, the adoption of coherent policy sets that include, preferably, a wide range of policy areas had a bigger impact on home permanence.
As the pandemic continued to exact a decisive and deathly impact across Brazil, nevertheless, our study also confirms that these policies were relatively moderate. Similarly, the permanence at home peaked in the last weeks of March. Since then, even though non-pharmaceutical intervention policies remained in place, mobility patterns gradually increased. Our results show that although mobility patterns did not return to pre-pandemic levels, significant increases took place. Furthermore, the pace of this movement in mobility can be linked with the policies adopted by state governments. By allowing commerce, services, and industry to remain open, consumers are shopping, and workers traveled to work. Our results suggest that the effectiveness of non-pharmaceutical interventions to increase social distancing is stronger when comprehensive measures are put into place and sustained over time. Small changes in specific non-pharmaceutical interventions, holding all else equal, had a limited impact on mobility.
ACKNOWLEDGMENTS
The additional authors of this study that were not listed due to space limitations include Pedro Schmalz, Marcela Zamudio and Fabiana Pereira. We are grateful for the comments from members of the Rede de Pesquisa Solidária em Políticas Públicas e Sociedade, the Observatório COVID-19 Br, and the Quantitative Methods Research Group in the Department of Political Science, and colleagues at the University of São Paulo, and most especially to Guy D. Whitten. Lorena Barberia thanks the Fundação de Amparo a Pesquisa do Estado de São Paulo (FAPESP) for research grant support (2018/20853-1 and 2013/15658-1). Maria Letıcia Claro is supported by a grant from CNPq (132580/2019-5). Luiz Guilherme Cantarelli is supported by a grant from CAPES (88887.355183/2019-00). Natália de Paula Moreira thanks the Fundação de Amparo a Pesquisa do Estado de São Paulo (FAPESP) for research grant support 2016/13199-8. All errors are our own.
REFERENCES
- Abrucio, F. L., Grin, E. J., Franzese, C., Segatto, C. I., & Couto, C. G. (2020). Combate à COVID-19 sob o federalismo bolsonarista: um caso de descoordenação intergovernamental. Revista de Administração Pública, 54(4), 663-677.
- Adolph, C., Amano, K., Bang-Jensen, B., Fullman, N., & Wilkerson, J. (2020). Pandemic Politics: Timing State-Level Social Distancing Responses to COVID-19. Journal of Health Politics, Policy and Law Retrieved from https://doi.org/10.1215/03616878-8802162
» https://doi.org/10.1215/03616878-8802162 - Barberia, L. G.; Moreira, N. P.; Cantarelli, L.; Claro, M. L.; Rosa, I S. C.; ... Aparecida, D. (2020a). COVID-19 Government Response Tracker for the Brazilian Federation (CGRT-BRFED) Retrieved from https://github.com/cgrtbrfed/covid19policytracker
» https://github.com/cgrtbrfed/covid19policytracker - Barberia, L. G., Moreira, N. P., Cantarelli, L., Claro, M. L., Rosa, I S. C. ... Zamudio, M. (2020b). Falta de coordenação entre o governo Federal e estados enfraquece a política de distanciamento social. A flexibilização sem critérios pode agravar a pandemia. Rede de Pesquisa Solidária em Políticas Públicas e Sociedade Retrieved from https://redepesquisasolidaria.org/nao-categorizado/falta-de-coordenacao-entre-o-governo-federal-e-estados-enfraquece-a-politica-de-distanciamento-social-a-flexibilizacao-sem-criterios-pode-agravar-a-pandemia/
» https://redepesquisasolidaria.org/nao-categorizado/falta-de-coordenacao-entre-o-governo-federal-e-estados-enfraquece-a-politica-de-distanciamento-social-a-flexibilizacao-sem-criterios-pode-agravar-a-pandemia/ - Barbosa, F. H, Filho. (2017). A crise econômica de 2014/2017. Estudos Avançados, 31(89), 51-60.
- Candido, D. S., Watts, A., Abade, L., Kraemer, M. U. G., Pybus, O. G., ... Faria, N. R. (2020). Routes for COVID-19 importation in Brazil. Journal of Travel Medicine, 27(3). Retrieved from https://academic.oup.com/jtm/article/27/3/taaa042/5809508
» https://academic.oup.com/jtm/article/27/3/taaa042/5809508 - Courtemanche, C., Garuccio, J., Le, A., Pinkston, J., & Yelowitz, A. (2020). Strong Social Distancing Measures In The United States Reduced The COVID-19 Growth Rate: Study evaluates the impact of social distancing measures on the growth rate of confirmed COVID-19 cases across the United States. Health Affairs, 39(7), 1237-1246. Retrieved fromhttps:/doi.org/10.1377/hlthaff.2020.00608
» https://doi.org/10.1377/hlthaff.2020.00608 - De Boef, S., & Keele, L. (2008). Taking time seriously. American Journal of Political Science, 52(1), 184-200.
- Ferraz, A. (2020). Carta Aberta: Os dados de geolocalização das operadoras de telefonia podem atrapalhar mais do que ajudar no combate à crise do COVID-19. InLoco Retrieved from https://www.linkedin.com/pulse/carta-aberta-os-dados-de-geolocaliza
» https://www.linkedin.com/pulse/carta-aberta-os-dados-de-geolocaliza - Hale, T., Angrist, N. Cameron-Blake, E., Hallas, L., Kira, B., … Webster, S. ( 2020 ). Oxford COVID-19 Government Response Tracker Retrieved from http://www.bsg.ox.ac.uk/covidtracker
» http://www.bsg.ox.ac.uk/covidtracker - Hsiang, S., Allen, D., Annan-Phan, S., Bell, K., Ian Bolliger, … Wu, T. (2020). The effect of large-scale anti-contagion policies on the COVID-19 pandemic. Nature, 584(7820), 262-267.
- Jay, J., Bor, J., Nsoesie, E. O., Lipson, S. K., Jones, D K... … Raifman, J. (2020). Neighbourhood income and physical distancing during the COVID-19 pandemic in the United States. Nat Hum Behav Retrieved fromhttps://doi.org/10.1038/s41562-020-00998-2
» https://doi.org/10.1038/s41562-020-00998-2 - Kim, S. & Castro, M. C. (2020). Spatiotemporal pattern of COVID-19 and government response in South Korea (as of May 31, 2020). International Journal of Infectious Diseases, 98, 328-333.
- Li, R., Pei, S., Chen, B., Song, Y. Zhang, T. … Shaman, J. (2020). Substantial undocumented infection facilitates the rapid dissemination of novel coronavirus (SARS-CoV2). Science, 368(6490), 489-493.
- Maier, B. F., & Brockmann, D. (2020). Effective containment explains subexponential growth in recent confirmed COVID-19 cases in China. Science, 368(6492), 742-746.
- Ministry of Health, Brazil. (2020). COVID-19 State and Local Policy Dashboard Retrieved from https://covid.saude.gov.br/
» https://covid.saude.gov.br/ - Niud, Y., & Xu, F. (2020). Deciphering the power of isolation in controlling COVID-19 outbreaks. The Lancet Global Health, 8(4), e452-e453.
- Orellana, J. D. Y., Cunha, G. M., Marrero, L., Horta, B. L., & Leite, I. C. (2020). Explosão da mortalidade no epicentro amazônico da epidemia de COVID-19. Cadernos de Saúde Pública, 36, e00120020.
- Rache, B., Rocha, R., Nunes, L., Spinola, P., Malik, A. M., & Massuda, A. (2020). Necessidades de infraestrutura do SUS em preparo à COVID- 19: leitos de UTI, respiradores e ocupação hospitalar São Paulo, SP: Instituto de Estudos para Políticas de Saúde.
- Rader, B., Scarpino, S. V., Nande, A., Hill, A. L., Adlam, B. ... Kraemer, M. U. G . (2020). Crowding and the shape of COVID-19 epidemics. Nature medicine, 26, 1829-1834.
- World Health Organisation. (2020, March 11). WHO Director-General’s Opening remarks at the media briefing on COVID-19 Retrieved from https://www.who.int/dg/speeches/detail/who-director-general-s-opening-remarks-at-the-media-briefing-on-covid-19---11-march-2020
» https://www.who.int/dg/speeches/detail/who-director-general-s-opening-remarks-at-the-media-briefing-on-covid-19---11-march-2020
-
1
The Chinese government first reported to the WHO Country Office in China a pneumonia of unknown cause detected in Wuhan, China on December 31, 2019.
-
2
We are well aware that there are reasons to suspect that these low figures may be because testing was limited to severely ill patients in the early months of the pandemic, as well as other problems that may affect why the official rate of confirmed cases may be lower than the actual, or ”true” rate (Li et al., 2020).
-
3
These indicators are being included in the original Oxford COVID-19 Government Response Tracker (OxCGRT) to code the sub-national policies of Brazil in collaboration with scholars from Oxford and the Fundac¸a˜o Getulio Vargas.
-
4
Retrieved from http://www.planalto.gov.br/ccivil_03/_ato2019-2022/2020/lei/l13979.htm
-
5
Retrieved from http://www.stf.jus.br/arquivo/cms/noticiaNoticiaStf/anexo/ADI6341.pdf
-
6
Following the OxCGRT, the indicators of the CGRT-BRFED were scored for each day starting on January 1st, 2020. This is well in advance of the onset of the first confirmed cases of COVID-19 in Brazil. In this study, we focus on the data from February 2nd to May 23rd. By February 1st, the WHO had already declared a health emergency, and cases had been detected in several countries.
-
7
In the OxCGRT, overall work closures are recorded. As we are interested in more granular-level diagnostics at the local level, the CGRT-BRFED further desegregates economic activity to distinguish whether states restricted commercial, service-sector, and industrial activities.
-
8
As part of our project to map public policies, we expect to make future changes to further refine the coding and overall Social Distancing Policy Stringency Index. We also plan to make further refinements to address geographic implications. These changes and new indicators will be posted at: https://github.com/cgrtbrfed/covid19policytracker.
-
9
Additional policies targeting social distancing that do not refer to closures or activity suspension were not analyzed in this study. We recognize the importance of these measures in combating the COVID-19 pandemic. Nevertheless, we decided to restrict our analysis to analyze the intensity of closures’ intensity on mobility.
-
10
The unit root tests indicate that our main dependent variables does not contain a unit root process. We applied the Fisher test for panel unit roots which perform Augmented Dickey-Fuller and Phillips-Perron approaches to test for stationary processes.
-
11
For robustness checks, we estimated models controlling for possible omitted variables. The results are presented in the appendix. Table A4 shows the coefficients for controlling for Bolsonaro 2018 vote share as a proxy for political ideology and the coefficients for state fixed-effects models. Table A5 presents the results when we control for daily deaths and daily cases. Figure A1 shows the long-term effects of School Closures, Industry Closures, Commerce Closures, Public Gatherings Prohibitions, and Private Gathering Prohibitions as well as the long-term coefficients for the Social Distancing Policy Index for all the models employed in robustness checks.
-
[Original version]
APPENDIX
Publication Dates
-
Publication in this collection
05 Mar 2021 -
Date of issue
Jan-Feb 2021
History
-
Received
01 June 2020 -
Accepted
25 Nov 2020

 Source: CGRT-BRFED (2020).
 Source: CGRT-BRFED (2020).
 Source: CGRT-BRFED (2020).
 Source: CGRT-BRFED (2020).
 Source: Elaborated by the authors.
 Source: Elaborated by the authors.
 Source: Elaborated by the authors.
 Source: Elaborated by the authors.