ABSTRACT
The uncontrolled expansion of human activities may lead to a reduction in vegetation cover, an increase in erosion processes and soil sealing. The aim of this study is to examine forest cover using the Weights of evidence method based on land use maps between the years of 1996 and 2011 in the micro-region of the Campanha Ocidental located in the state of Rio Grande do Sul (Brazil). The spatial database was constructed in SPRING software (version 5.2.1) based on LANDSAT 5 images, which were georeferenced and classified. Geophysical and socioeconomic variables were included in the database for further analysis in Dinamica EGO software (version 2.2.8). In order to parameterize the probabilistic model for the analysis of the dynamics of forest cover change, we calculated the percentage of class change through transition matrices; calculated the intervals for discretization of continuous variables; calculated the weights of evidence (W+); analyzed the correlation between the weights of the input variables for all transitions; simulated future scenarios and; validated the simulated final map based on the historical map. This model was adequate for understanding the variables that most contribute to forest cover change in the region. The results showed that the emergence of new forest areas was influenced by hypsometry, distance to sandy lands and per capita income, while deforestation by rural population and distance to the sandy lands.
Key words:
Remote sensing; Landsat 5; Dynamic modeling
RESUMO
A expansão desordenada das atividades humanas pode acarretar a redução da cobertura vegetal, o aumento de processos erosivos e de áreas impermeabilizadas. O objetivo desse estudo é avaliar a cobertura florestal utilizando método de pesos de evidência a partir de mapas do uso da terra entre o ano 1996 e 2011 na Microrregião da Campanha Ocidental - RS. O banco de dados espaciais foi construído no aplicativo SPRING na versão 5.2.1 a partir de imagens LANDSAT 5, as quais foram georreferenciadas e classificadas. Variáveis geofísicas e socioeconômicas foram incluídas no banco de dados para posterior análise no aplicativo Dinamica EGO na versão 2.2.8. Para a parametrização do modelo probabilístico de análise da dinâmica de mudança da cobertura florestal, foi realizado o cálculo de percentual das mudanças de classes por meio de matrizes de transição; cálculo das faixas para discretização das variáveis contínuas; cálculo dos pesos de evidência (W+); análise da correlação dos pesos entre as variáveis de entrada para todas as transições; simulação de cenários futuros e; validação do mapa final simulado com base no mapa histórico. Esse modelo mostrou-se adequado para o entendimento das variáveis que mais contribuem para as mudanças da cobertura florestal na região. O surgimento de novas áreas florestais foi influenciado pelas condicionantes hipsometria, distância aos areais e renda per capita, enquanto que o desmatamento, pela população rural e distância aos areais.
Palavras-chave:
Sensoriamento remoto; Modelagem dinâmica; Modelo Bayesiano
1. INTRODUCTION
The increase in the world's population and the demand for food to meet the need of mankind has made man transform the environment to expand agricultural areas. Silva (2011)Silva EA. Mapeamento do uso e cobertura vegetal do Município de Floresta-PE [dissertação]. Recife: Universidade Federal Rural de Pernambuco; 2011. 56p. suggests that the sprawl of human activities may lead to reduction in vegetation cover, increased erosion and soil sealing, with subsequent contamination of water courses. The same author reports that, in addition to being correlated, some of these causes enable the silting of watercourses and reservoirs, which in turn is triggered by deforestation and unsustainable anthropogenic activities.
Remote sensing and geoprocessing tools have the capacity to aid in large-scale spatialization and in obtaining answers to help identify problems inherent to the unrestrained use of the soil and, consequently, the reduction of forest cover.
The Weights of evidence method can be used to understand forest dynamics, which according to Bonham-Carter (1994)Bonham-Carter GF. Geographic Information Systems for Geoscientists: Modelling with GIS. Ontario: Pergamon; 1994. 305p. is defined as the probability of an event occurring, considering factors that influence it, that is, by combining evidence. According to Perrota (1998)Perrota MM. Potencial aurífero de uma região no Vale do Ribeira, São Paulo, estimado por modelagem de dados geológicos, geoquímicos, geofísicos e de sensores remotos num sistema de informações geográficas [tese] São Paulo: Universidade de São Paulo; 1998. 149p., in the Bayesian method, the combination of a collection of data (or maps) is done using a probability structure. Probabilities are measures of proportions between the areas of the evidence maps and those of the occurrences. The unit area corresponds to a cell, or pixel, which should be sufficiently small to represent an occurrence.
According to Bonham-Carter (1994)Bonham-Carter GF. Geographic Information Systems for Geoscientists: Modelling with GIS. Ontario: Pergamon; 1994. 305p., the advantages of Bayesian model are: objectivity, which prevents the subjective choice of weighting factors; the possibility of combining multiple evidence maps in a model that can be easily adapted to computational languages; the incorporation of incomplete data into the input map model; the possibility of applying multi-class maps, where each slice is treated as a present evidence (or probability ratio); and the modeling of uncertainties due to variations in weights and incomplete data.
Within this context, this study aims to assess forest cover using the Weights of evidence method based on land use maps from 1996 to 2011. Furthermore, we intend to identify the probability of areas susceptible to forest cover change, through dynamic, physical and socioeconomic variables, thus facilitating the understanding of anthropic pressure within the forest fragments.
2. MATERIAL AND METHODS
This research was conducted in the Southwest mesoregion of the state of Rio Grande do Sul, where the micro-region of the Campanha Ocidental is located between latitudes 27º56'37'' S and 30º33'41'' S and between longitudes 54º42''7'' W and 57º41'28'' W, covering the cities of Alegrete, Barra do Quaraí, Garruchos, Itaqui, Maçambara, Manoel Viana, Quaraí, São Borja, São Francisco de Assis and Uruguaiana (Silva et al., 2014Silva EA, Pereira RS, Silva CK, Goergen LCG, Schuh MS. Uso de imagens orbitais no geoprocessamento algébrico da microrregião da Campanha Ocidental, Rio Grande do Sul. FLORAM - Revista Floresta e Ambiente. 2014;21(3):277-85.).
The spatial database was constructed in SPRING software (version 5.2.1), which contains matrix and vector information plans for the region. We acquired seven scenes with Landsat 5 satellite images for the years of 1996 and 2011. Georeferencing was done using 20 control points for each image and adopting mean errors of 0.7. The classification technique was supervised and algorithm used was the Bhattacharya, with acceptance threshold of 99%.
The classified images had resolution of 30 m, from which we obtained the classes of land use of forest, agriculture, grassland, water and sandy land. In addition to this main set of data, vector bases were also used to compose the class group and input variables in the model, both with the same UTM projection system and WGS 84 datum.
Therefore, we obtained the set of variables that make up the model for the analysis of the dynamics of forest cover change during the studied period. The variables were the land use and land cover maps, which were the continuous variables, and the discrete variables were: hydrography, road network, hypsometry, declivity, geology, urban population concentration, rural population concentration, per capita income, gross domestic product, and concentration of sheep and cattle farming. The model was developed in DINAMICA EGO software (version 2.2.8)(Soares Filho et al., 2008Soares Filho BS, Rodrigues HO, Falieri A, Costa WL. Dinamica EGO Tutorial. Belo Horizonte: CSR-UFMG; 2008.). For the reliability of the land use and land cover mapping, we used the Kappa index (Equation 1).
Where, r is the number of classes; Xij is the number of elements correctly classified; Xi+ is total number of elements classified into a category i ; X+i is total number of reference elements sampled for a category i ; N is the total number of samples.
The Kappa index values (K) vary between -1 and 1, where 1 reflects total agreement between the classified image and the real image, while -1 reflects total disagreement. These values are compared and tested with the concepts defined by Landis and Koch (1977)Landis J, Koch GG. The measurements of agreement for categorical data. Biometrics. 1977;33(3):159-79., which are used to assess the accuracy of thematic map obtained from the image classification.
2.1 Model Parameterization
The input data for the calibration of the model were the initial and final land cover and land use maps, corresponding to the years of 1996 and 2011, respectively, as well as a cube of discrete and continuous static physical variables. According to Macedo et al. (2013)Macedo RC, Almeida CM, Santos JR, Rudorff BFT. Modelagem dinâmica espacial das alterações de cobertura e uso da terra relacionadas à expansão canavieira. Boletim de Ciências Geodésicas [Online]. 2013;19:313-37., the probabilistic model for the analysis of dynamics of land use and land cover change designed by Soares Filho et al. (2001)Soares Filho BS, Assunção RM, Pantuzzo AE. Modeling the spatial transition probabilities of landscape dynamics in an Amazonian colonization frontier. BioScience. 2001;51(12):1059-67. consists of six steps: a) calculating the percentage of class changes through transition matrices; b) calculating the intervals for discretization of continuous variables; c) calculating the weights of evidence (W+); d) analyzing the correlation of weights among the input variables for all transitions; e) simulating and adjusting; f) validating the simulated final map based on the historical map.
Firstly, we calculated the percentage of global changes based on the classes of land cover and land use. This calculation is done after a cross-tabulation between the map of the initial year (1996) and the final year (2011), which generates transition matrices containing the change in percentage during the period.
According to Macedo et al. (2013)Macedo RC, Almeida CM, Santos JR, Rudorff BFT. Modelagem dinâmica espacial das alterações de cobertura e uso da terra relacionadas à expansão canavieira. Boletim de Ciências Geodésicas [Online]. 2013;19:313-37., another type of calculation is the local transition probability, in which the transition probabilities of each cell are calculated considering natural and anthropic characteristics of the physical site.
Weights of evidence consist of a Bayesian method, in which the effect of a spatial variable in a transition is calculated independently from a combined solution. The Weights of evidence represent each influence on a variable in the spatial probability of a transition iàj (Equation 2 and 3).
Where, W+ is the Weights of evidence of the occurrence of an event "D" given a spatial pattern "B". The a posteriori probability of a transition i > j, given a set of spatial data (B, C, D, ..., N) is expressed by Equation 4.
Where, B, C, D and N are the values of the K spatial variables, measured at locations x, y and represented by their weights W+N.
The results of the Weights of evidence are used to parameterize the simulation model, which is related to the spatial dynamics of the phenomenon. The Weights of evidence method operates only with categorical variables, and thus calculates ranges or intervals according to data structures presented in continuous form (Macedo et al., 2013Macedo RC, Almeida CM, Santos JR, Rudorff BFT. Modelagem dinâmica espacial das alterações de cobertura e uso da terra relacionadas à expansão canavieira. Boletim de Ciências Geodésicas [Online]. 2013;19:313-37.).
As a result of this process we obtained a skeleton file of the Weights of evidence, which was used as input to calculate the coefficients, in addition to the final and initial land use maps and the static variables.
The assumption required for the Weights of Evidence method is that the input maps should be spatially independent. We used the Cramer's coefficient and Joint information Uncertainty to evaluate the correlation of the variables. We adopted a correlation threshold of 0.5 as a requirement for the selection of the variables for the model, that is, variables with correlation above 0.5 were discarded. In an interval of zero to one, the variables are independent when their value is equal to zero and completely dependent when equal to one.
For the simulation model of the transitions of the spatial patterns of the classes of use, we considered the patcher and the expander algorithms, incorporated in Dinamica EGO, in addition to the variance of the area of change calculated in the map of changes and the isometry index. We carried out tests to obtain the most appropriate model by varying the input parameters.
The most appropriate model was defined through validation, which was given by the fuzzy similarity test between the simulated map of 2011 and the reference map for the same year. This test is an adaptation of the fuzzy similarity index developed by Hagen (2003)Hagen A. Fuzzy set approach to assessing similarity of categorical maps. International Journal of Geographical Information Science. 2003;17(3):235-49. for application in the Dinamica EGO software, and uses exponential decay function and constant decay function (Soares Filho et al., 2009Soares-Filho BS, Rodrigues HO, Costa WL. Modelagem de dinâmica ambiental com Dinamica EGO. Belo Horizonte: Centro de Sensoriamento Remoto/Universidade Federal de Minas Gerais; 2009.), which were evaluated in the study. The closer to 1, the higher is the similarity between the maps.
In this method, the representation of a cell is influenced by itself and, to a lesser extent, by the cells in its proximity, in varying windows sizes of 1x1 to 13x13 pixels (Soares Filho et al., 2008Soares Filho BS, Rodrigues HO, Falieri A, Costa WL. Dinamica EGO Tutorial. Belo Horizonte: CSR-UFMG; 2008.). In this study, we considered windows from 3x3 to 11x11 pixels. According to Macedo et al. (2013)Macedo RC, Almeida CM, Santos JR, Rudorff BFT. Modelagem dinâmica espacial das alterações de cobertura e uso da terra relacionadas à expansão canavieira. Boletim de Ciências Geodésicas [Online]. 2013;19:313-37., the validation, in this case, contributes for adjustments to be made in the parameters of the expander and patcher functions, until the model is compatible with the phenomenon that occurred between the periods. Indices close to 0.4 indicate a good level of compatibility between the simulated and the real scenario.
3. RESULTS
3.1 Mapping of land use and land cover
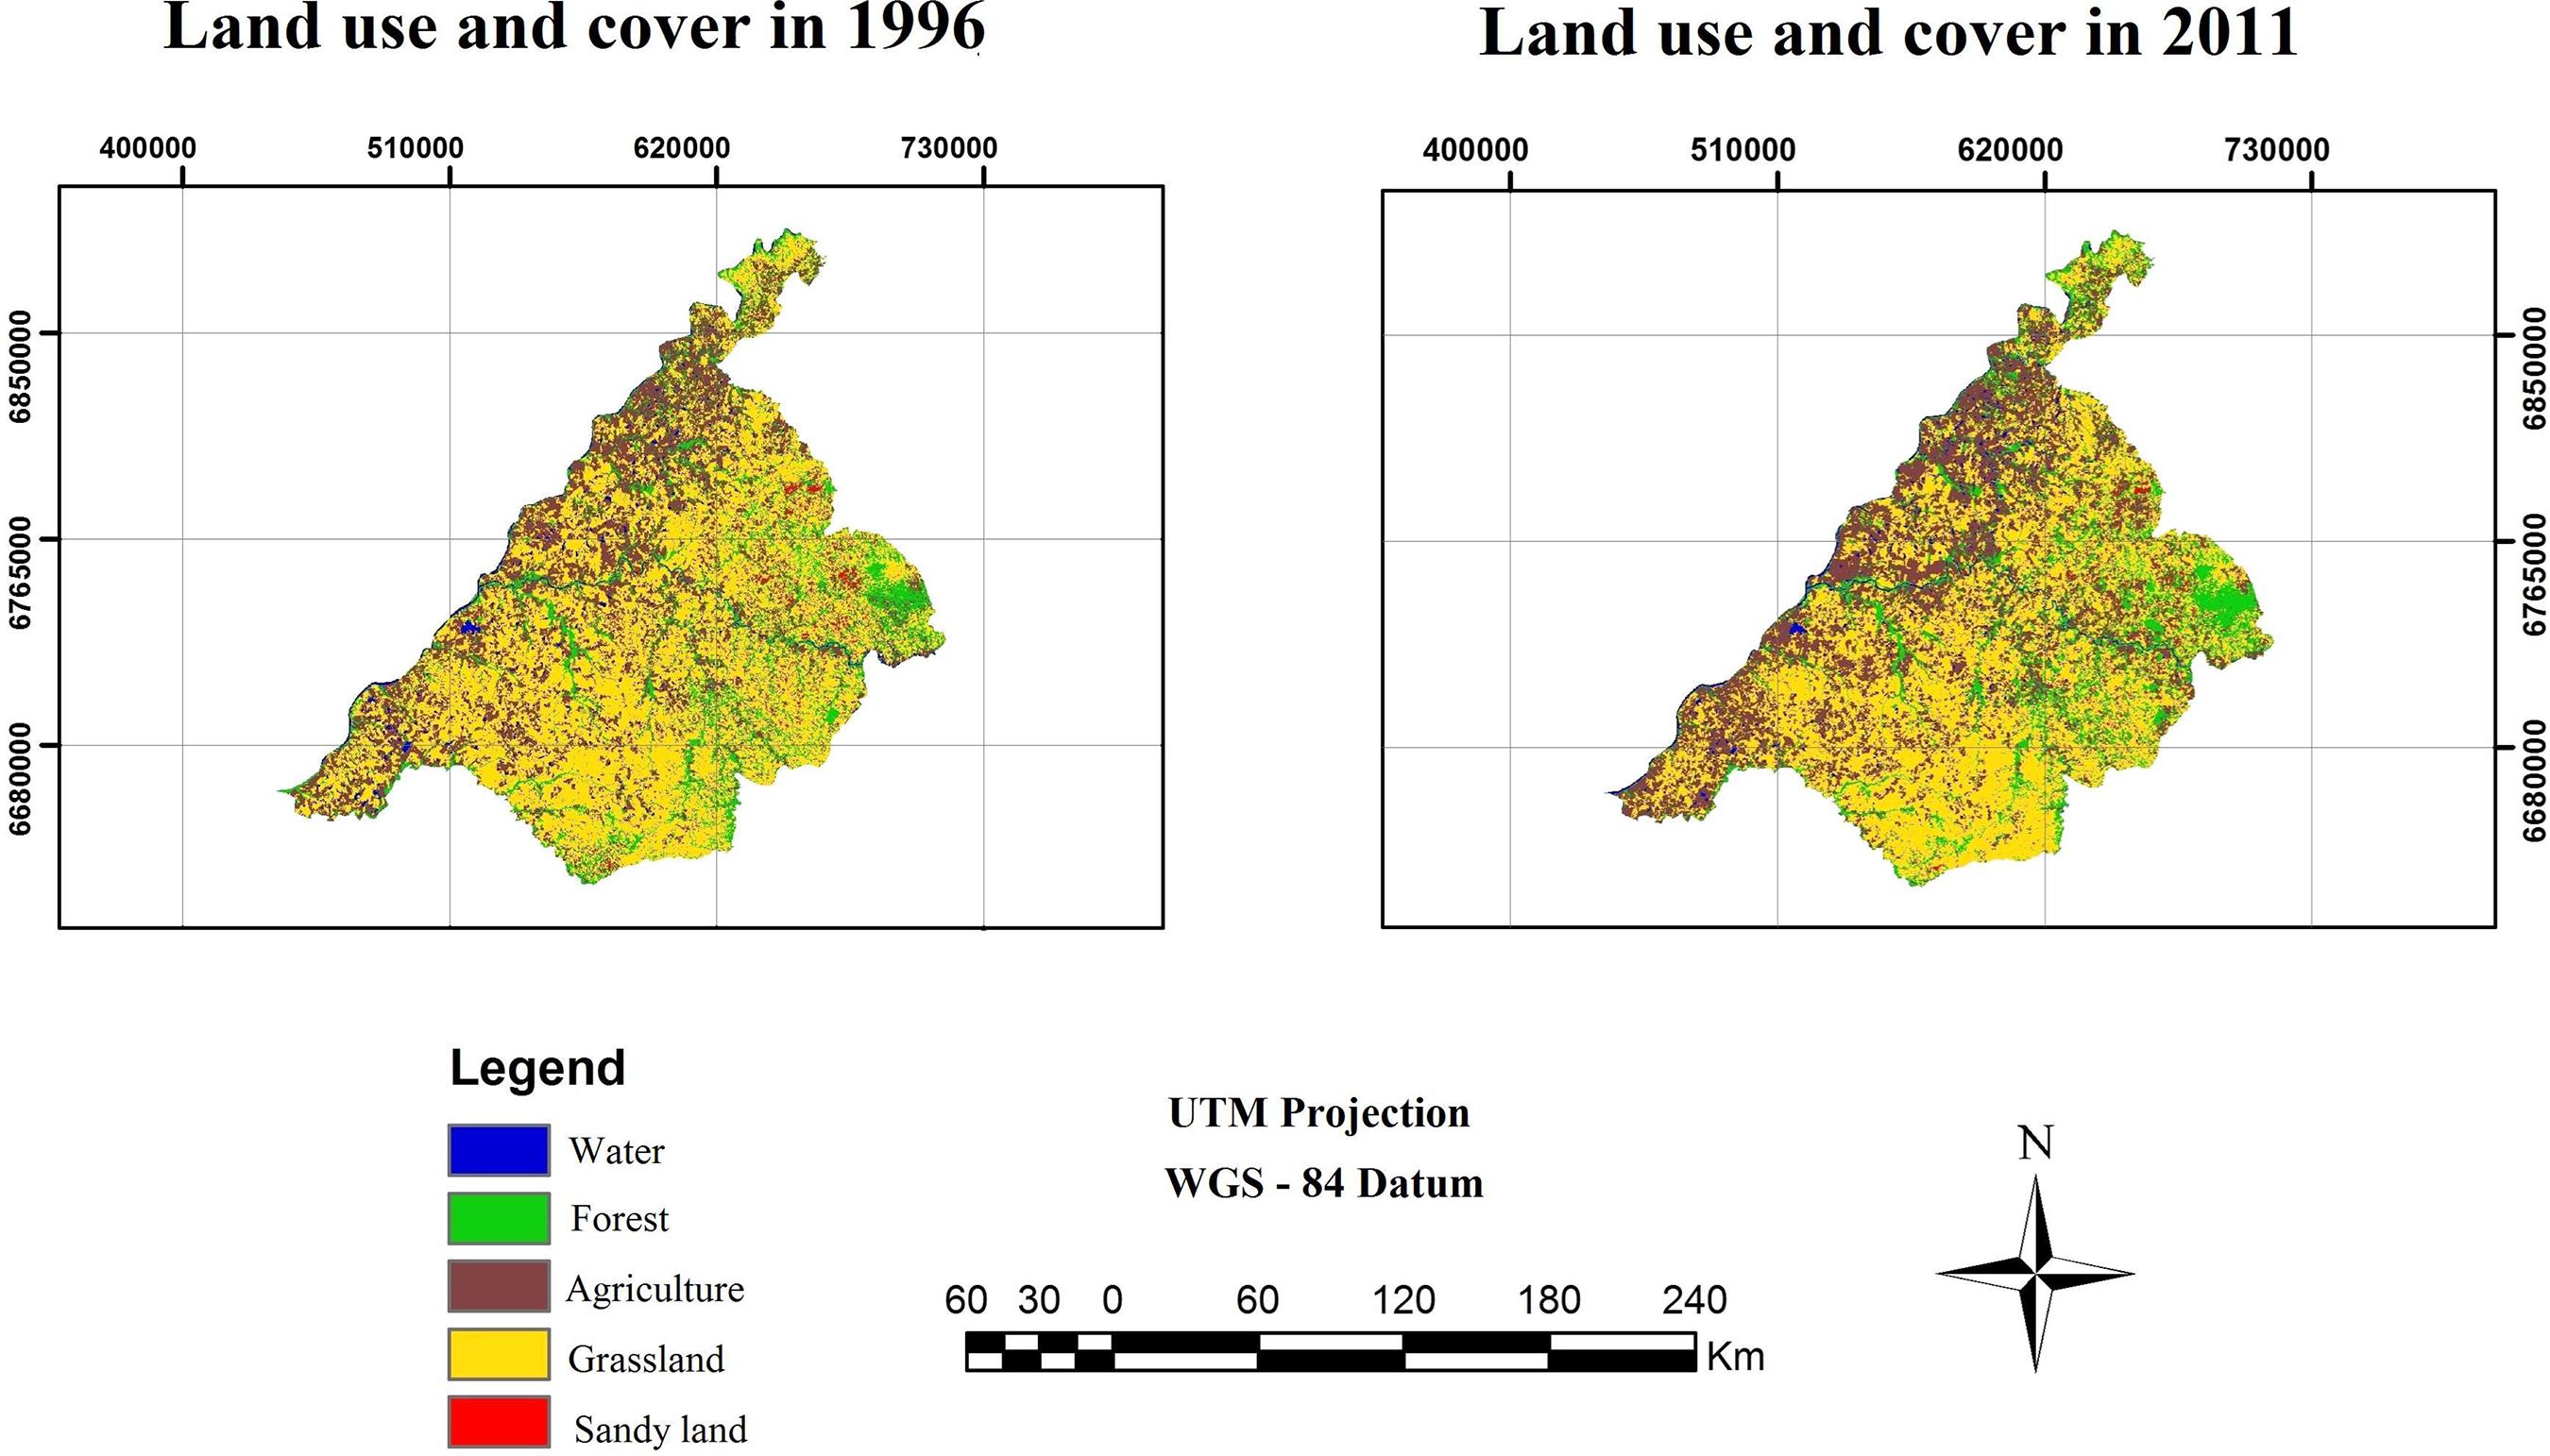
Based on the LANDSAT 5 image classification, it was possible to quantify land use and land cover in the Campanha Ocidental micro-region satisfactorily (Table 1). Land use and land cover maps can be seen in Figure 1.
Quantification of land use and land cover in the Campanha Ocidental (RS) in 1996 and 2011.
Tabela 1
Quantificação do uso e cobertura da terra na Campanha Ocidental-RS, nos anos de 1996 e 2011.
Land use and land cover maps of the Campanha Ocidental-RS micro-region in 1996 and 2011.
Figura 1
Mapas de uso e cobertura da terra da microrregião Campanha Ocidental - RS, nos anos de 1996 e 2011.
We observed that there is a greater predominance of livestock in the available grassland areas, but from one period tothe other there was an increase in agricultural frontiers, especially in rice cultivation. As regards forest areas, we observed an increase in forest expansion and a decrease of the sandy lands during the 15-year period.
The confusion matrix discriminates the accuracy of the producer and the accuracy of the generated product. The Kappa indices obtained in the initial and final maps, which were 0.9986 for the year of 1996 and 0.9972 for the year of 2011, were satisfactory.
3.2 Variable Analysis through the Weights of Evidence Method
In the calibration of the model, observing the results of the Cramer (V) and Joint Information Uncertainty (U) indices, and due to redundancy in relation to the variables Urban Population Concentration, Sheep Concentration and road network, these variables were discarded for having a high association with other variables and because they present similar situations in the course of the correlation results. Thus, it is evident that the modeler should be sensible in analyzing the data and removing irrelevant variables from the model accordingly.
The main variables of the model that explain the emergence of new forest areas and also deforestation are shown in the graphs of Figure 2.
Weight of the variables that most influenced forest cover change for the year 2011.
Figura 2
Pesos de variáveis que mais influenciaram nas mudanças da cobertura florestal para o ano de 2011.
We found that the formation of new forest areas is influenced mainly by low altitude, the proximity to the sandy lands, and the areas with the lowest per capita income of the region.
Regarding forest expansion in the region, the results showed that the conversion of areas from agriculture to forest was influenced by the per capita income of the population, that is, in these areas despite the economic the transition between grassland and forest, the presence value of agricultural products, there is a greater concern of sandy lands was highlighted, as they were in increasing forest cover due to increased rigor in considerably recovered due to government incentives environmental laws, causing producers to invest in and stabilization of companies in the forest sector, areas of permanent preservation and legal reserve. In especially in the last 5 years.
The conversion between sandy land and forest was influenced by the presence of hypsometry in the region, which is related to the declivity of the land. Therefore, these areas that are susceptible to erosion, as a result of leaching and wind action, have been protected and recovered over time with forests. However, proximity to the sandy land class, and the variable of rural population concentration also favor deforestation. Thus, the larger the rural population, the greater the deforestation.
The transition from forest to agriculture and grassland is basically influenced by the rural population of these regions. It is believed that due to the increase in credit lines and the need to expand agricultural and livestock areas, forests are being suppressed to give way to pasture or agriculture. On the other hand, the transition between forest and sandy land is influenced by the sandy land itself. This can be explained by the cutting cycle of some species used in these degraded areas that promote forest reduction, thus contributing to the increase of the phenomenon.
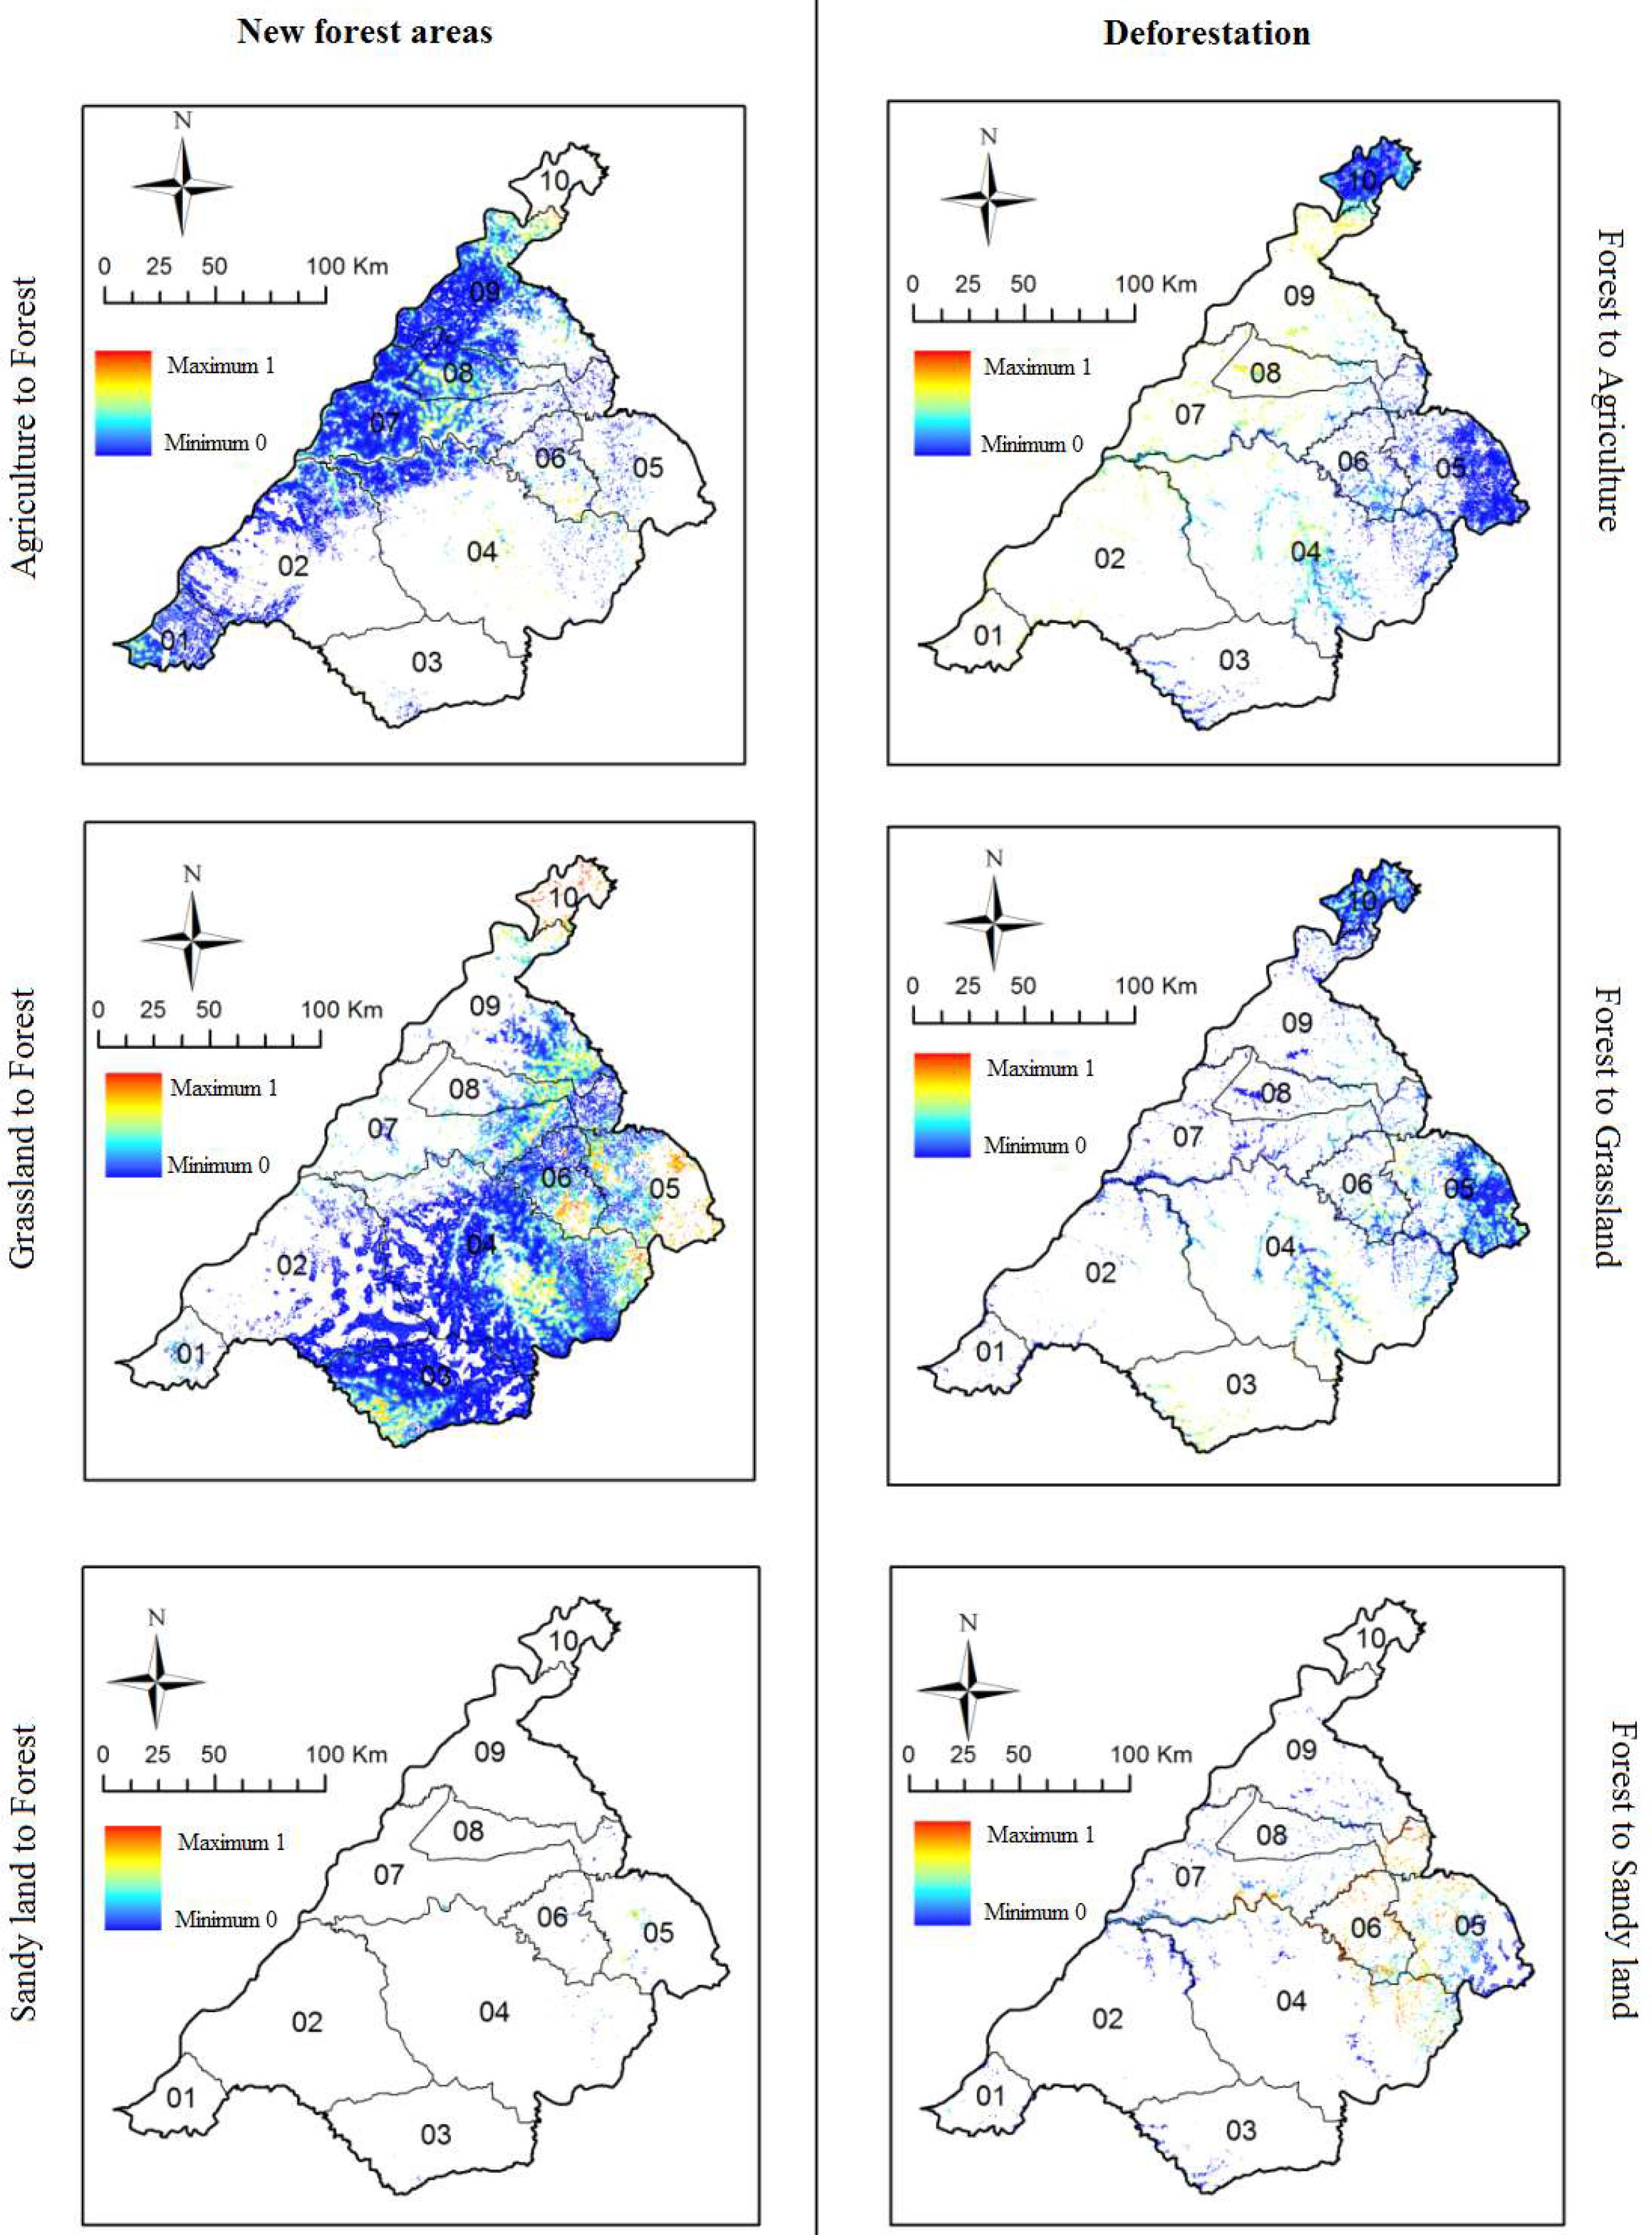
The probability of new forest areas and deforestation taking place between 1996 and 2011 for each land use and land cover are highlighted in Figure 3. We noted that there is a greater probability of increased forest areas occurring in the North and Northeast of the region, especially in the cities of Alegrete, Manoel Viana, São Francisco de Assis, Garruchos, São Borja, Maçambará and in the east of Itaqui.
Probabilities of increasing in forest areas and deforestation by city from 1996 to 2011.
Figura 3
Probabilidades de ocorrer aumento de áreas florestais e desmatamento por município entre o ano de 1996 a 2011.
In relation to deforestation, the greatest probabilities of occurrence were mainly due to the loss of ciliary forest in the central, eastern and in western parts of the region, caused by the increase in agricultural areas. In the cities of Manoel Viana, São Francisco de Assis and Alegrete, this greater probability is due to the fact that this region is located in the geological condition of Botucatu sandstone, which generates a greater tendency for the transformation of forest areas into sandy lands. As for the cities in the western region, such as São Borja, Maçambará, Itaqui, Uruguaiana and Barra do Quaraí, the economy is mainly focused on rice cultivation and consequently the increase of these areas.
3.3 Validation of the model for the Weights of evidence
The similarity indexes in the function of constant decay and exponential decay obtained from the fuzzy method in evaluating the results are listed in Table 2.
Fuzzy similarity indices obtained by calculating the functions of constant and exponential decay for different window sizes of from 1996 to 2011.
Tabela 2
Índices de similaridade fuzzy obtidos por meio de cálculos das funções de decaimento constante e exponencial para diferentes tamanhos de janelas entre o período de 1996 a 2011.
4. DISCUSSION
In the period analyzed in this study there was an increase in forest areas. In this sense, Silva et al. (2014)Silva EA, Pereira RS, Silva CK, Goergen LCG, Schuh MS. Uso de imagens orbitais no geoprocessamento algébrico da microrregião da Campanha Ocidental, Rio Grande do Sul. FLORAM - Revista Floresta e Ambiente. 2014;21(3):277-85. suggest that preservation is occurring in this region, as well as the increase of reforested and native areas as a result of fiscal incentives. This fact is a reflection of the abandonment of areas that are more difficult to cultivate, the greater rigor of the legislation and also the awareness of the owners about the importance of forests to the environment and as another source of income.
When analyzing the variables using the Weights of evidence method, we noticed that part of the result generated by the calibration of the model consists of crucial data in revealing the influence exerted by the input variables in the occurrence of the transitions. The analysis of the Weights of evidence makes it easy to recognize potential areas of change of state in each transition, which can be verified through the transition probability maps.
The probability of an increase in forest areas can be attributed to the fact that these areas already have forest masses, both native and planted stands, which suggests that there was conservation of these natural areas, increased regeneration and increase of commercial plantations of the Pinus and Eucalyptus genus in the region.
Some studies with Dinamica EGO report that the results found with similarity indices based on the fuzzy method are consistent with those obtained by other authors. In validating dynamic models to simulate deforestation in the Amazon, Ximenes et al. (2008)Ximenes AC, Almeida CM, Amaral S, Escada MIS, Aguiar APA. Modelagem dinâmica do desmatamento na Amazônia. Boletim de Ciências Geodésicas. 2008;14(3):370-91. found indices between 0.87 and 0.9 for windows of 3 x 3 and 13 x 13. Almeida (2008)Almeida CM, Gleriani JM, Castejon EF, Soares-Filho BS. Using neural networks and cellular automata for modeling intra-urban land use dynamics. International Journal of Geographical Information Science. 2008;22(9):943-63. obtained results between 0.83 and 0.85 for the evaluation by multiple resolutions in dynamic models applied to urban areas.
Rossetti et al. (2013)Rossetti LAFG, Pinto SAF, Almeida CM. Cellular Automata-Based spatial dynamic modeling for analyzing urban land use change. In: Joint Urban Remote Sensing Event 2013. JURSE; 2013. p.288-91. found values between 0.57 and 0.71 for windows of 3 x 3 and 9 x 9, evaluating changes in use in urban areas using the spatial dynamic modeling through cellular automata. Macedo et. Al. (2013)Macedo RC, Almeida CM, Santos JR, Rudorff BFT. Modelagem dinâmica espacial das alterações de cobertura e uso da terra relacionadas à expansão canavieira. Boletim de Ciências Geodésicas [Online]. 2013;19:313-37., through making spatial dynamic modeling of land cover and land use changes related to sugar cane expansion, found values of 0.52 for windows of 11 x 11.
Studies carried out in the state of Rio Grande do Sul using Dinamica EGO software in land use modeling were also compared with the results obtained in this study. For example, Ferrari (2008)Ferrari R. Modelagem de uso e cobertura da terra da Quarta Colônia, RS [dissertação]. Santa Maria: Universidade Federal de Santa Maria; 2008. 127p. found indices between 0.44 and 0.84 when simulating the dynamics of use and cover of the Quarta Colônia region; Benedetti (2010)Benedetti ACP. Modelagem dinâmica para simulação de mudanças na cobertura florestal das Serras do Sudeste e Campanha Meridional do Rio Grande do Sul [tese]. Santa Maria: Universidade Federal de Santa Maria; 2010. 166p., using dynamic modeling to simulate changes in the forest cover of the regions of the Serras do Sudeste and Campanha Meridional, found values between 0.64 and 0.99.
5. CONCLUSIONS
Based on the results obtained in this study, it was possible to identify and adequately quantify the land use and land cover patterns in the micro-region of the Campanha Ocidental of Rio Grande do Sul using LANDSAT 5 satellite images.
Using physical and socioeconomic variables for the development of a dynamic model, it was possible to understand the determining factors for the changes in forest cover between 1996 and 2011. This model was adequate for understanding the variables that contribute most to forest cover change in the region, especially the conditioners hypsometry, distance to the sandy lands and per capita income for the development of new forest areas, as well as rural population and distance to the sandy lands for deforestation.
Finally, the model created in this study can be used for future simulations of forest cover, aiming to promote the incidence of public policies, such as forest management, for maintaining and expanding forest areas in the region.
6. REFERENCES
- Almeida CM, Gleriani JM, Castejon EF, Soares-Filho BS. Using neural networks and cellular automata for modeling intra-urban land use dynamics. International Journal of Geographical Information Science. 2008;22(9):943-63.
- Benedetti ACP. Modelagem dinâmica para simulação de mudanças na cobertura florestal das Serras do Sudeste e Campanha Meridional do Rio Grande do Sul [tese]. Santa Maria: Universidade Federal de Santa Maria; 2010. 166p.
- Bonham-Carter GF. Geographic Information Systems for Geoscientists: Modelling with GIS. Ontario: Pergamon; 1994. 305p.
- Ferrari R. Modelagem de uso e cobertura da terra da Quarta Colônia, RS [dissertação]. Santa Maria: Universidade Federal de Santa Maria; 2008. 127p.
- Hagen A. Fuzzy set approach to assessing similarity of categorical maps. International Journal of Geographical Information Science. 2003;17(3):235-49.
- Landis J, Koch GG. The measurements of agreement for categorical data. Biometrics. 1977;33(3):159-79.
- Macedo RC, Almeida CM, Santos JR, Rudorff BFT. Modelagem dinâmica espacial das alterações de cobertura e uso da terra relacionadas à expansão canavieira. Boletim de Ciências Geodésicas [Online]. 2013;19:313-37.
- Perrota MM. Potencial aurífero de uma região no Vale do Ribeira, São Paulo, estimado por modelagem de dados geológicos, geoquímicos, geofísicos e de sensores remotos num sistema de informações geográficas [tese] São Paulo: Universidade de São Paulo; 1998. 149p.
- Rossetti LAFG, Pinto SAF, Almeida CM. Cellular Automata-Based spatial dynamic modeling for analyzing urban land use change. In: Joint Urban Remote Sensing Event 2013. JURSE; 2013. p.288-91.
- Silva EA, Pereira RS, Silva CK, Goergen LCG, Schuh MS. Uso de imagens orbitais no geoprocessamento algébrico da microrregião da Campanha Ocidental, Rio Grande do Sul. FLORAM - Revista Floresta e Ambiente. 2014;21(3):277-85.
- Silva EA. Mapeamento do uso e cobertura vegetal do Município de Floresta-PE [dissertação]. Recife: Universidade Federal Rural de Pernambuco; 2011. 56p.
- Soares Filho BS, Assunção RM, Pantuzzo AE. Modeling the spatial transition probabilities of landscape dynamics in an Amazonian colonization frontier. BioScience. 2001;51(12):1059-67.
- Soares Filho BS, Rodrigues HO, Falieri A, Costa WL. Dinamica EGO Tutorial. Belo Horizonte: CSR-UFMG; 2008.
- Soares-Filho BS, Rodrigues HO, Costa WL. Modelagem de dinâmica ambiental com Dinamica EGO. Belo Horizonte: Centro de Sensoriamento Remoto/Universidade Federal de Minas Gerais; 2009.
- Ximenes AC, Almeida CM, Amaral S, Escada MIS, Aguiar APA. Modelagem dinâmica do desmatamento na Amazônia. Boletim de Ciências Geodésicas. 2008;14(3):370-91.
Publication Dates
-
Publication in this collection
2017
History
-
Received
10 Feb 2015 -
Accepted
27 Oct 2016