
Abstracts
Objective:
To evaluate a protocol for two-dimensional (2D) hydrogen proton (1H) magnetic resonance spectroscopy (MRS) (Siemens Medical Systems; Erlangen, Germany) in the detection of adrenal nodules and differentiation between benign and malignant masses (adenomas, pheochromocytomas, carcinomas and metastases).
Materials and Methods:
A total of 118 patients (36 men; 82 women) (mean age: 57.3 ± 13.3 years) presenting with 138 adrenal nodules/masses were prospectively assessed. A multivoxel system was utilized with a 2D point-resolved spectroscopy/chemical shift imaging sequence. The following ratios were calculated: choline (Cho)/creatine (Cr), 4.0–4.3/Cr, lipid (Lip)/Cr, Cho/Lip and lactate (Lac)/Cr.
Results:
2D-1H-MRS was successful in 123 (89.13%) lesions. Sensitivity and specificity values observed for the ratios and cutoff points were the following: Cho/Cr ≥ 1.2, 100% sensitivity, 98.2% specificity (differences between adenomas/pheochromocytomas and carcinomas/ metastases); 4.0–4.3 ppm/Cr ≥ 1.5, 92.3% sensitivity, 96.9% specificity (differences between carcinomas/pheochromocytomas and adenomas/metastases); Lac/Cr ≤ –7.449, 90.9% sensitivity and 77.8% specificity (differences between pheochromocytomas and carcinomas/adenomas).
Conclusion:
Information provided by 2D-1H-MRS were effective and allowed for the differentiation between adrenal masses and nodules in most cases of lesions with > 1.0 cm in diameter.
Adrenal gland; Magnetic resonance imaging; Spectroscopy
Objetivo:
Avaliar um protocolo de espectroscopia por ressonância magnética (ERM) do próton de hidrogênio (1H) bidimensional (2D) disponível comercialmente (Siemens Medical Systems; Erlangen, Alemanha), aplicado para nódulos adrenais e diferenciação das massas (adenomas, feocromocitomas, carcinomas e metástases).
Materiais e Métodos:
Um total de 118 pacientes (36 homens e 82 mulheres), apresentando-se com 138 nódulos/massas adrenais, foi avaliado prospectivamente (média de idade: 57,3 ± 13,3 anos). Uma sequência de ERM-1H-PRESS-CSI (espectroscopia por resolução de ponto-imagem por desvio químico) multivoxel foi utilizada. Análise espectroscópica foi realizada da esquerda-direita, sentido crânio-caudal, usando três sequências sagitais, além de sequências axiais e coronais T2-HASTE. Os seguintes índices foram calculados: colina (Cho)/creatina (Cr), 4,0–4,3 ppm/Cr, lipídio (Lip)/Cr, Cho/Lip e lactato (Lac)/Cr.
Resultados:
ERM-1H-2D foi bem sucedida em 123 (89,13%) lesões. Os valores de sensibilidade e especificidade encontrados para as proporções e pontos de corte avaliados foram: Cho/Cr ≥ 1,2, sensibilidade de 100% e especificidade de 98,2% (diferenciação de adenomas e carcinomas de feocromocitomas e metástases); 4,0–4,3 ppm/Cr ≥ 1,5, 92,3% de sensibilidade, especificidade de 96,9% (diferenciação de carcinomas e feocromocitomas de adenomas e metástases); Lac/Cr ≤ –7,449, sensibilidade de 90,9% e especificidade de 77,8% (diferenciação de feocromocitomas contra carcinomas e adenomas).
Conclusão:
Os dados da ERM-1H-2D foram eficazes e permitiram a diferenciação entre massas adrenais e nódulos na maioria das lesões com diâmetro > 1,0 cm.
Glândula adrenal; Ressonância magnética; Espectroscopia
INTRODUCTION
The adrenal glands, also called suprarenal glands, are affected by complex physiological and neoplastic processes. In addition to that, such glands are small and located in the retroperitoneum, which by itself creates difficulties for the physical examination(11 Krebs TL, Wagner B. MR imaging of the adrenal gland: radiologicpathologic correlation. Radiographics. 1998;18:1425-40.).
Thus, any suspicion of the presence of a mass in the adrenal gland requires anamnesis and thorough physical examination, biochemical evaluation of all pertinent hormones and additional imaging studies. Adrenal insufficiency occurs when there is destruction of more than 90% of the gland(22 Lockhart ME, Smith JK, Kenney PJ. Imaging of adrenal masses. Eur J Radiol. 2002;41:95-112.).
Algorithms for endocrinological testing and imaging are utilized to investigate adrenal masses etiology, including primary hyperaldosteronism, pheochromocytoma, virilization and Cushing’s syndrome. The differentiation between malignant and benign masses is of utmost importance, as metastases in the adrenal glands are common, representing the fourth most common site of metastasis in the human body. Adrenocortical carcinoma, on the other hand, has a low prevalence, but remains as an object of clinical interest because of its high mortality rate(33 Mansmann G, Lau J, Balk E, et al. The clinically inapparent adrenal mass: update in diagnosis and management. Endocr Rev. 2004;25:309-40.).
Magnetic resonance imaging (MRI) and computed tomography (CT) are commonly utilized in the evaluation of adrenal lesions, either incidental or not(22 Lockhart ME, Smith JK, Kenney PJ. Imaging of adrenal masses. Eur J Radiol. 2002;41:95-112.,44 Boland GWL, Blake MA, Hahn PF, et al. Incidental adrenal lesions: principles, techniques, and algorithms for imaging characterization. Radiology. 2008;249:756-75.,55 Mitchell DG, Crovello M, Matteucci T, et al. Benign adrenocortical masses: diagnosis with chemical shift MR imaging. Radiology. 1992;185:345-51.). However, the morphological image, in spite of its usefulness, is limited in cases of low-fat adenomas, metastases and heterogeneous masses(11 Krebs TL, Wagner B. MR imaging of the adrenal gland: radiologicpathologic correlation. Radiographics. 1998;18:1425-40.–99 Korobkin M, Giordano TJ, Brodeur FJ, et al. Adrenal adenomas: relationship between histologic lipid and CT and MR findings. Radiology. 1996;200:743-7.).
In order to overcome such a limitation, there is the possibility of resorting to functional MRI. Such an imaging method, duly dedicated, can provide metabolic data of nodules and masses in the adrenal gland. The functional MRI techniques are based on the concentration of intracellular lipids in the mass(55 Mitchell DG, Crovello M, Matteucci T, et al. Benign adrenocortical masses: diagnosis with chemical shift MR imaging. Radiology. 1992;185:345-51.,66 Jhaveri KS, Wong F, Ghai S, et al. Comparison of CT histogram analysis and chemical shift MRI in the characterization of indeterminate adrenal nodules. AJR Am J Roentgenol. 2006;187:1303-8.,99 Korobkin M, Giordano TJ, Brodeur FJ, et al. Adrenal adenomas: relationship between histologic lipid and CT and MR findings. Radiology. 1996;200:743-7.), on differences in perfusion between malignant and benign masses(44 Boland GWL, Blake MA, Hahn PF, et al. Incidental adrenal lesions: principles, techniques, and algorithms for imaging characterization. Radiology. 2008;249:756-75.,88 Korobkin M, Lombardi TJ, Aisen AM, et al. Characterization of adrenal masses with chemical shift and gadolinium-enhanced MR imaging. Radiology. 1995;197:411-8.) and on the metabolic activity of the mass(77 Kilickesmez O, Inci E, Atilla S, et al. Diffusion-weighted imaging of the renal and adrenal lesions. J Comput Assist Tomogr. 2009;33:828-33.,1010 Faria J, Goldman SM, Szejnfeld J, et al. Adrenal masses: characterization with in vivo proton MR spectroscopy - initial experience. Radiology. 2007;245:788-97.,1111 Kim S, Salibi N, Hardie AD, et al. Characterization of adrenal pheochromocytoma using respiratory-triggered proton MR spectroscopy: initial experience. AJR Am J Roentgenol. 2009;192:450-4.).
Besides the functional characteristics, MRI has the best contrast resolution for adrenal evaluation as compared with other imaging methods. It has appropriate spatial resolution for the detection of lesions of ≥ 0.5 cm. Fat suppression is utilized in strongly T2-weighted images which are not degraded by chemical shift artifacts produced by the fat surrounding the adrenal glands. Multiplanar images are helpful in detecting the invasion of adjacent structures by adrenal masses(44 Boland GWL, Blake MA, Hahn PF, et al. Incidental adrenal lesions: principles, techniques, and algorithms for imaging characterization. Radiology. 2008;249:756-75.).
Among the functional MRI techniques, one should highlight hydrogen-1 (1H) magnetic resonance spectroscopy (MRS), a noninvasive technique free of potential risks with which one may monitor either acute or chronic stages of a disease. The development of methods for spatial location of samples with relative levels of mobile metabolites in a volume defined from MR images is the basis for the integration of data obtained by such a technique. The association of anatomical and pathological data with MR images provides a new way to understand the origins and progression of the diseases(1212 Bolinger L, Insko EK. Spectroscopy: basic principles and techniques. In: Edelman RR, Hesselink JR, Zlatkin MB, editors. Clinical magnetic resonance imaging. Philadelphia: WB Saunders; 1996. p. 353-79).
For more than ten years, Universidade Federal de São Paulo (Unifesp) has been sponsoring the Group of Advanced Studies on Adrenal Pathologies, which comprises the disciplines of Imaging Diagnosis, Endocrinology and Urology. Along these last years, the authors studied at least two hundred cases of adrenal masses and had the opportunity to start a pilot project on functional evaluation of adrenal masses by means of 1H MRS, whose initial experiment was published in 2007(1010 Faria J, Goldman SM, Szejnfeld J, et al. Adrenal masses: characterization with in vivo proton MR spectroscopy - initial experience. Radiology. 2007;245:788-97.). However, much has needed to be improved since then.
Given the actual prospects of significant improvements in the etiological diagnosis of masses in the adrenal glands by means of 1H MRS, the authors have sought, on the grounds of the mentioned project, to develop and define the protocol for acquisition and post-processing of spectroscopic data at the Department of Imaging Diagnosis of Hospital São Paulo – Escola Paulista de Medicina (EPM-Unifesp).
MATERIALS AND METHODS
Study
Prospective study evaluating 118 patients with adrenal nodules or masses (36 men and 82 women), with a mean age of 57.3 ± 13.3 years. All the patients were previously evaluated either by adrenal CT (60 patients) with a dedicated protocol (density measurement in the post-contrast phase) and calculation of the absolute washout rate, or by MRI (58 patients) with T1-weighted in-phase and out-phase sequences (for detection of intracellular lipids), and contrast-enhanced T2-weighted sequences. Forty-five nodules or masses were located exclusively in the right adrenal gland, and 53 were located in the left adrenal gland. Twenty patients presented with bilateral masses or nodules, totaling 138 nodules. All patients underwent MRI with the proposed hydrogen-1 MRS protocol. The patients were referred to the Department of Imaging Diagnosis of Unifesp by the units of Endocrinology and Urology. The data collection for the study occurred between January 2007 and December 2009.
Such protocol was previously submitted and approved by the Committee for Ethics in Research of EPM-Unifesp.
Inclusion criteria
The patients were selected according to the following inclusion criteria: a) patient with adrenal nodule or mass with > 1.0 cm in diameter and previous CT or MRI scan with a dedicated adrenal protocol; b) histopathological confirmation by biopsy or surgery in cases of pheochromocytoma, functional adenoma, carcinoma, or uncharacteristic lesions; c) lesion stability for more than 12 months at CT or MRI in patients diagnosed with adenoma.
Non-inclusion criteria
Non-inclusion criteria were the following: a) patients included in chemotherapy protocols or those with previous history of adrenal biopsy/surgery; b) patients for whom it was not possible to schedule the 1H MRS.
Exclusion criteria
Although previously selected, some of the patients ended up being excluded for: a) presenting with lesions > 1.0 cm in diameter, but with no voxel eligible for analysis; b) presenting with adrenal nodule mass with almost 1.0 cm in diameter, presenting with contamination in the spectroscopic curves.
Thus, among the 20 patients with bilateral masses or nodules, only 6 had their lesions with greater diameter analyzed, and in other 2 patients, both were excluded. Among the patients with unilateral lesions, two were not included, one for not being cooperative during the scan and the other for presenting with a nodule < 1.0 cm in diameter. Five other patients were excluded for presenting with adenomas with approximately 1.0 cm in diameter but with no voxel eligible for analysis.
Thus, 109 patients (34 men and 75 women) met all the inclusion criteria in the study for final analysis, with a mean age of 57.8 ± 13.1 years, presenting with adrenal lesion > 1.0 cm (mean ± standard-deviation: 3.67 ± 2.39 cm), with a total of 123 masses or nodules, separated into four groups (adenoma, carcinoma, pheochromocytoma and metastasis).
Scan protocol
Patient preparation and positioning
The patient preparation before the scan consisted of four-hour fasting, intravenous administration of an antispasmodic drug 10 minutes before the scan, and application of a questionnaire about contraindications for MRI.
The patients were positioned with the feet going into the MRI apparatus first, with the arms extended along the body in dorsal decubitus over the spine coil (SP-spine). Once the patient was properly centered on the exam table, the anterior phased array coil was positioned.
Scan technique
MRI protocol
The scans were performed in a 1.5 T, 43 mT/m gradient equipment (Magnetom Sonata; Siemens Medical Systems, Erlangen, Germany), at the Department of Imaging Diagnosis of EPM-Unifesp, and in a 1.5 T, 33 mT/m gradient equipment (Magnetom Espree; Siemens Medical Systems, Erlangen, Germany), at Centro de Ultrassonografia e Radiologia Aplicada (Cura). The experiment period(1010 Faria J, Goldman SM, Szejnfeld J, et al. Adrenal masses: characterization with in vivo proton MR spectroscopy - initial experience. Radiology. 2007;245:788-97.) for learning and development of the study was from August 2004 to December 2006, to assist in adjustments of the protocol and scan sequences.
The MRI scan was performed at the level of the adrenal mass, and consisted of half-Fourier acquisition single-shot turbo spin-echo (HASTE) T2-weighted sequences, and in phase and out of phase T1-weighted CSI following the same criteria of the previous study developed by the authors. Table 1 shows a summary of the physical parameters of the sequences in the two apparatuses and for all patients, regardless the existence of previous MRI studies.
The HASTE sequences were performed in the three orthogonal planes for the three-dimensional (3D) localization of the mass with 1H MRS planning purposes. In order to determine the correct insertion of the volume of interest, three sagittal HASTE localization sequences were performed, with the same programming characteristics, with free breathing, and maximum inspiration and expiration.
Thus, the gland position and mobility intervals were obtained, from the highest (expiration) to the lowest (inspiration), with determination of the region where the nodule or adrenal mass would possibly be localized during the 1H MRS acquisition with free breathing. Thus, the probability of the adrenal mass or nodule being located within this interval was increased.
Protocol for the acquisition of spectroscopic data
A multiple volume system was utilized to select the spectroscopic volume of interest acquired by means of 2D PRESSCSI sequence, with spectral water suppression, commercially available through Siemens Medical Systems, in such a manner to minimize possible artifacts from periadrenal structures.
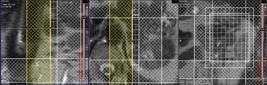
The 1H MRS programming was performed with T2weighted HASTE sequences in two stages. In the first stage, only sagittal images at maximum inspiration and expiration and free breathing were utilized, with the multivoxel grid carefully positioned at center of the lesion, with the use of all three sagittal sequences, as per Figure 1, to include as much of the lesion area as possible or, preferentially, the entire lesion and part of the adjacent fat tissue.

Once the dimensions of the field of view and of the shimming were determined, the second phase of the programming was carried out, with three orthogonal planes at expiration. Such a procedure was aimed at determining the thickness of the voxel, enabling only the radiofrequency (RF) coilclosest to the mass or nodule, and positioning the external saturation bands, as shown on Figure 2.
Besides being freely angled, without impairing the spectroscopic acquisition, the 1H MRS sequence provides the possibility of resorting to six 30 mm-thick external saturation bands positioned around the adrenal gland, minimizing the effects of the non-homogenization of the field by the magnetic susceptibility effect originated in the air in the lung parenchyma, bone structures, periadrenal fat and in the fluids present in the biliary tree and kidneys.
The total scan time including patient positioning and images and spectroscopic data acquisition was approximately 30 minutes.
Images and spectroscopic data analysis
The acquired data were analyzed by two observers, each one with seven-year experience, in consensus. Both observers had access to all clinical data from the patients, including previous CT and MRI studies. The images were processed on a workstation (Leonardo®; Siemens Medical Systems) equipped with a dedicated software for spectroscopy analysis. A 1000 Hz Gaussian filter and priority was given to transformation of Fourier data into two spatial directions, with a the Hamming filter.
The 1H MRS matrix was adjusted to the three orthogonal planes utilized in the programming, and the most appropriate voxels were selected for analysis. A voxel was considered eligible whenever 100% of its area was located within the tumor tissue, with a satisfactory spectral curve. Voxels located in the adjacent fat tissue were not included in the spectral analysis.
Once the amplitudes of the metabolites of interest were measured, the following metabolic ratios were calculated: choline (Cho)/creatine (Cr), 4.0–4.3 ppm/Cr, Cho/lipid (Lip) and Lip/Cr. In the differentiation of the masses or nodules, only the two first ratios observed since the first study were taken into consideration(1010 Faria J, Goldman SM, Szejnfeld J, et al. Adrenal masses: characterization with in vivo proton MR spectroscopy - initial experience. Radiology. 2007;245:788-97.), as being those with higher sensitivity and specificity to differentiate adenomas, carcinomas, pheochromocytomas and metastases. The time required for analysis of the spectroscopic data was approximately one hour, varying according to the size of the nodule or adrenal mass being studied.
Initially, the reproducibility of the spectral results and respective classification of nodules and masses were verified in relation to the previous study developed by the authors.
With the purpose of utilizing other metabolites for the spectroscopy study of the adrenal gland, lactate (Lac) was also considered, and once the amplitudes of such a metabolite were obtained, the mathematical ratio with creatine was calculated (Lac/Cr).
Statistical analysis
Data were analyzed by utilizing the Excel® and BioEstat 4.0® softwares for a better characterization of nodules and masses metabolic ratios in the four groups under analysis (adenoma, carcinoma, pheochromocytoma and metastasis). For such a purpose, central tendency and dispersion values were calculated for each one of the groups.
The Student’s t test was also applied for paired samples, comparing the average metabolic ratios in the different groups, and the chi-squared test to correlate the differences between relationships, with the Yates correction or the exact Fisher’s test for cell values < 5.
The receiver operating characteristic (ROC) curve was utilized to determine ratio where masses or nodules present intergroup differences, and the tables’ analysis capability was evaluated. Sensitivity, specificity, positive predictive value (PPV) and accuracy were calculated from the determined cutoff points. Significance was set at value < 0.05 (p < 0.05).
RESULTS
Based on the proposed sequences and reading method, the authors were able to perform the scans of 123 (89.13%) of the studied masses or nodules. Amongst the excluded lesions, 10 (7.25%) corresponded to lesions with < 1.0 in their largest diameter. The remaining cases (five nodules; 3.62%) were excluded from the study for not presenting with eligible voxels (unsatisfactory spectral curve), even with nodule size above the pre-established value. Even so, amongst the 123 masses or nodules included in the present study, 32 (25.2%) were between 1.0 and 1.9 cm (mean = 1.64 ± 0.27 cm).
Tables 2, 3 and 4 show that the reproduction of the results obtained in the previous study(1010 Faria J, Goldman SM, Szejnfeld J, et al. Adrenal masses: characterization with in vivo proton MR spectroscopy - initial experience. Radiology. 2007;245:788-97.) was possible utilizing the ratio Cho/Cr ≥ 1.2 to differentiate adenoma and pheochromocytoma from carcinoma and metastasis, with a sensitivity of 100%, specificity of 98.2%, PPV of 83.3% and accuracy of 98.4%, with analysis capability of 0.9872. The ratio 4.0–4.3 ppm/Cr ≥ 1.5 was utilized to differentiate carcinoma and pheochromocytoma from adenoma and metastasis, with sensitivity of 92.3%, specificity of 96.9%, PPV of 89.3% and accuracy of 95.93%, with analysis capability of 0.7843. Figure 3 shows the spectroscopic behavior of the studied masses.

Spectroscopic charts of the adrenal gland in four different masses: adenoma (A), pheochromocytoma (B), carcinoma (C), metastasis (D). The respective Cho, Cr, Lip and H2O peaks are identified on their respective curves.
The authors also included the Lac metabolite in the evaluation, as the presence of lactate peaks was observed in the majority of the masses. Such an evaluation was also made by means of the relation with Cr. For the Lac/Cr ratios, the groups behaved as shown on Table 5.
The ROC curve calculated for the differentiation between pheochromocytoma and adenoma, demonstrated on Figure 4, determined a cut-off point of –4.79, with sensitivity of 65.3%, specificity of 72.7%, PPV of 91.44%, accuracy of 66.65% and analysis capability of 0.67. On the other hand, the ROC curve for differentiation between pheochromocytoma and carcinoma (Figure 4B) determined a cut-off point of –7.449, with sensitivity of 90.9%, specificity of 77.8%, PPV of 83.35%, accuracy of 85.01% and analysis capability of 0.93.

ROC curve of the Lac/Cr ratio between adenoma (A) and carcinoma (B) groups with pheochromocytoma. A: Lac/Cr ≤ –4.79 (adenoma). B: Lac/Cr ≤ –7.449 (carcinoma).
DISCUSSION
The utilization of CT and MRI in the imaging investigation of adrenal glands is well established in the differentiation between adenomas e non-adenomas(22 Lockhart ME, Smith JK, Kenney PJ. Imaging of adrenal masses. Eur J Radiol. 2002;41:95-112.,44 Boland GWL, Blake MA, Hahn PF, et al. Incidental adrenal lesions: principles, techniques, and algorithms for imaging characterization. Radiology. 2008;249:756-75.,1313 Rescinito G, Zandrino F, Cittadini G Jr, et al. Characterization of adrenal adenomas and metastases: correlation between non-enhanced computed tomography and chemical shift magnetic resonance imaging. Acta Radiol. 2006;47;71-6.). However, the difficulties associated with radiodiagnosis techniques applied to suprarenal glands are not only in the diagnosis of atypical adenomas, but also in the detection of other changes such as metastases, pheochromocytomas and the adenocarcinomas(66 Jhaveri KS, Wong F, Ghai S, et al. Comparison of CT histogram analysis and chemical shift MRI in the characterization of indeterminate adrenal nodules. AJR Am J Roentgenol. 2006;187:1303-8.,99 Korobkin M, Giordano TJ, Brodeur FJ, et al. Adrenal adenomas: relationship between histologic lipid and CT and MR findings. Radiology. 1996;200:743-7.,1414 Park BK, Kim B, Ko K, et al. Adrenal masses falsely diagnosed as adenomas on non-enhanced and delayed contrast-enhanced computed tomography: pathological correlation. Eur Radiol. 2006;16:642-7.,1515 Blake MA, Krishnamoorthy SK, Boland GW, et al. Low-density pheochromocytoma on CT: a mimicker of adrenal adenoma. AJR Am J Roentgenol. 2003;181:1663-8.). Benign pheochromocytoma features at CT and at MRI are generally confused with those of carcinomas and metastases(1616 Szolar DH, Korobkin M, Reittner P, et al. Adrenocortical carcinomas and adrenal pheochromocytomas: mass and enhancement loss evaluation at delayed contrast-enhanced CT. Radiology. 2005;234:479-85.). The present study demonstrates the utilization of 1H MRS as a new tool in the diagnosis of adrenal nodules and masses, increasing the MRI specificity.
The utilization of MRS techniques with high sensitivity and high spatial resolution was required because of the deep location of the adrenal glands, the complexity of their anatomy and zonal physiology, their proximity with regions with significant magnetic susceptibility effect and due to the heterogeneous nature of the nodules and masses that affect those glands.
A static magnetic field of at least 1.5 T is necessary in order for the in vivo spectroscopic study to reach appropriate sensitivity with a clinically acceptable acquisition time and resolute distribution of the signals from different tissues(1717 Cox IJ. Development and applications of in vivo clinical magnetic resonance spectroscopy. Prog Biophys Mol Biol. 1996;65:45-81.). Such a condition is relevant since the polarization or vector intensity depends directly on the externally applied B0(1212 Bolinger L, Insko EK. Spectroscopy: basic principles and techniques. In: Edelman RR, Hesselink JR, Zlatkin MB, editors. Clinical magnetic resonance imaging. Philadelphia: WB Saunders; 1996. p. 353-79).
The gradient coils are also incorporated into the MRI apparatus in order to produce magnetic fields that vary linearly throughout the sample so as it is possible to utilize one (1D), two (2D) or three (3D) dimensions of the phase encoding gradient when obtaining the spectrum(1818 Smith JK, Castillo M, Kwock L. MR spectroscopy of brain tumors. Magn Reson Imaging Clin N Am. 2003;11:415-29.). In the present study, a 2D spectroscopic sequence was utilized, combining an appropriate spatial resolution with a clinically feasible acquisition time of approximately 7 minutes for large lesions and approximately 12 minutes for small lesions.
The technical advances in abdominal MR images acquisition comprised the development of phased-array RF coils or multi-coil systems, either for utilization as single coils with anterior and posterior elements, or for utilization of different coils, which may be either combined or used individually(1919 Misic GJ, inventor; Medrad Inc., assignee. Multimode operation of quadrature phased array MR coil systems. United States patent US 20020190716 A1. 2002 Dec 19.).
This coil provides improved signal-noise ratio (SNR), uniform sensitivity and spatial resolution of a surface coil, but with an increased field of view. Such a characteristic is normally utilized for abdomen imaging without increasing the acquisition time. It may be utilized not only to produce images but also to acquire spectrographic charts, with no restrictions regarding type of pulse sequence to be applied.
Additionally, the most important feature of the phased-array coil is the minimization of artifacts resulting from mutual coupling between surface coils. That causes the separation of the resonance frequencies and interrupts the signal transmission and reception pattern(2020 Roemer PB, Edelstein WA, Hayes CE, et al. The NMR phased array. Magn Reson Med. 1990;16:192-225.).
Soon after the introduction of the phased-array coils, one observed that they could also be utilized to further reduce the images acquisition time by sampling the MRI signal in a parallel mode. Such a technique is based on the concept that the acquisition time is proportional to the number of phase encoding lines in a Cartesian approach. In parallel MR image, the utilization of phased-array antennas is important to decrease or prevent fold-over artifacts(2121 Glockner JF, Hu HH, Stanley DW, et al. Parallel MR imaging: a user's guide. Radiographics. 2005;25:1279-97.).
The techniques of partially parallel imaging with simultaneous acquisition of spatial harmonics (SMASH) has been combined with single-shot imaging protocols, such as echoplanar acquisition, burst and half-Fourier single-shot turbo spin-echo (HASTE or RARE) acquisitions. The latter, used in the present study, is characterized by an ultrafast T2-weighted MRI sequence which acquires more than one-half of a 2D image in the K space after a single excitation pulse by means of an echo train separated by refocusing pulses. Such a sequence is less sensitive to motion and can be acquired in apnea(2222 Zhang L, Kholmovski EG, Guo J, et al. HASTE sequence with parallel acquisition and T2 decay compensation: application to carotid artery imaging. Magn Reson Imaging. 2009;27:13-22.).
In the present study, the PRESS method was utilized for the spectroscopic localization. Such a method excites directly the volume of interest, with minimum excitation in the rest of the sample. The volume encoding, whether single or multiple, may be obtained by a single pulse sequence, with three selective pulses, each one of them along the x, y, and z directions in order to obtain the location.
The PRESS method may be preceded by selective chemical shift pulses (CHESS) and the BASING protocol in order to obtain water suppression. The suppression performed by the external saturation bands may also be programmed before the spectroscopic acquisition. By the spectral suppression method, the transverse magnetization is selectively de-phased before and after the second spin-echo pulse. The de-phasing affects water only between 4.0 and 5.4 ppm(1212 Bolinger L, Insko EK. Spectroscopy: basic principles and techniques. In: Edelman RR, Hesselink JR, Zlatkin MB, editors. Clinical magnetic resonance imaging. Philadelphia: WB Saunders; 1996. p. 353-79,2323 Siemens. MR spectroscopy operator manual. Version syngo MR 2002B. USA: Siemens Medical solutions; 2002. p. 1-467.).
In the present experiment, the multidimensional CSI localization method was utilized in addition to PRESS. The data acquisition is carried out in the absence of the frequency encoding gradient, so that the information of the chemical shift can be saved. It is classified into sequence with and without spin-echo. In the present study, he advantage of the method with echo is the movement with data acquisition, connecting the gradients and allowing for all resonances to get into phase during the phase encoding(1212 Bolinger L, Insko EK. Spectroscopy: basic principles and techniques. In: Edelman RR, Hesselink JR, Zlatkin MB, editors. Clinical magnetic resonance imaging. Philadelphia: WB Saunders; 1996. p. 353-79,2323 Siemens. MR spectroscopy operator manual. Version syngo MR 2002B. USA: Siemens Medical solutions; 2002. p. 1-467.).
The first in vivo 1H MRS studies of the adrenal gland were performed by utilizing spectroscopic images, as a way to select the region of spectroscopic interest. In spite of the satisfactory initial results, some limitations of such a method should be highlighted, namely: the impossibility of constructing the spectral charts, the visualization of the mass/nodule in only one orthogonal plane, the low B0 value, and the visualization restricted to only water and fat(2424 Leroy-Willig A, Bittoun J, Luton JP, et al. In vivo MR spectroscopic imaging of the adrenal glands: distinction between adenomas and carcinomas larger than 15 mm based on lipid content. AJR Am J Roentgenol. 1989;153:771-3.).
In 2009, Kim et al. proposed the utilization of in vivo single voxel 1H MRS with respiratory monitoring for the study of the suprarenal gland. Even with the encouraging initial results, the problems in utilizing the single voxel localization technique remained, be it in the inability to access the spatial distribution of the observed metabolic changes; in the difficult comparison of metabolic levels between two different regions; in the positioning of the volume to be scanned with basis on the MR images where it may be difficult to determine the region of interest; or the limitation to study relatively large masses (8–27 cm3) and short TE(1111 Kim S, Salibi N, Hardie AD, et al. Characterization of adrenal pheochromocytoma using respiratory-triggered proton MR spectroscopy: initial experience. AJR Am J Roentgenol. 2009;192:450-4.).
With the objective of overcoming such limitations, the multiple 2D volume was initially utilized, as a way to select the region of spectroscopic interest, with activation of two gradients, from the suprarenal gland sagittal plane(1111 Kim S, Salibi N, Hardie AD, et al. Characterization of adrenal pheochromocytoma using respiratory-triggered proton MR spectroscopy: initial experience. AJR Am J Roentgenol. 2009;192:450-4.). The acquisition of multiple volumes provides spectral information on the spatial extent and metabolic heterogeneity of the cancer, without the need for knowing its exact location(2525 Kurhanewicz J, Vigneron DB, Males RG, et al. The prostate: MR imaging and spectroscopy. Present and future. Radiol Clin North Am. 2000;38:115-38.).
In the present study, it was necessary to make some modifications in the acquisition phases and in the post-processing of the adrenal 1H MRS protocol, as compared with the early phases of the project(1010 Faria J, Goldman SM, Szejnfeld J, et al. Adrenal masses: characterization with in vivo proton MR spectroscopy - initial experience. Radiology. 2007;245:788-97.). In addition to the two-dimensional character of the spectral pulse sequence, the nonangulation of the multi-voxel, the improvement in the adjustment of the field of view to the mass/nodule and the signal-to-noise ratio balance, with adjustment of the number of acquisitions, were items exhaustively worked upon, causing and important impact on this optimization. No other relevant changes were needed in relation to the physical parameters of the spectral sequence applied in the previous study.
The acquisition of three sagittal planes (free breathing, maximum inspiration and maximum expiration) was maintained in order to determine the most probable lesion location, restricting shimming to this region. Such a method is not perfect, but it compensates for the lack of respiratory monitoring in the multi-voxel sequence.
As regards post-processing, the protocol changes progressed along with the new applications developed by Siemens Medical Systems, which have allowed for an improved analysis of the spectroscopic data. The post-processing with different scales with greater amplitude (0.5 to 8.5 ppm) to a smaller amplitude (0.5 to 4.7 ppm) allowed for better adjustment of the baseline, taking into consideration the water peak with the other metabolites in the automatic and manual determination of the spectral phase and frequency. Such factors have allowed for a faster and more reliable determination of the eligible voxel.
Even with the positive impact from such changes, the mathematical criteria determined in the authors’ previous study continued to be satisfactory in the determination of adenomas, carcinomas, pheochromocytomas and metastases.
Thus, the present study sample demonstrated a sensitivity of 100%, specificity of 98.2%, PPV of 83.3% and accuracy of 98.4% for the Cho/Cr ratio ≥ 1.20 in the differentiation of carcinomas and metastases from adenomas and pheochromocytomas. In the previous study, the authors had observed, respectively, 92%, 96%, 86% and 95%. On the other hand, for the ratio 4.0–4.3 ppm/Cr ≥ 1.50, sensitivity was 92.3%, specificity 96.9%, PPV 89.3% and accuracy 95.93% in the differentiation of carcinomas and pheochromocytomas from adenomas and metastases, as compared with 87%, 98%, 98%, and 95%, respectively, observed in the previous study.
In the present study, the authors observed the frequent presence of Lac peak. Thus, similarly to other metabolites, they decided to include such a metabolite in their analysis as ratio with Cr.
A statistically significant difference was as the Lac/Cr ratio was applied in the comparison of the pheochromocytoma group with the adenoma and carcinoma groups. The ROC curve demonstrated that such metabolic ratio, when above –7.449, has a sensitivity of 90.9%, specificity of 77.8%, PPV of 83.35%, and accuracy of 85.01% in the differentiation between carcinomas and pheochromocytomas, one of the most significant difficulties in relation to the previous study. Therefore, by adding this new ratio, the diagnosis and differentiation capability was increased.
CONCLUSION
With the presently described 1H MRS sequence, it was possible to establish an effective protocol for the differentiation of nodules/masses with > 1.0 cm in diameter in the adrenal glands. As the present results are compared with the previous study results, there was a gain in sensitivity (from 92% to 100%) and in specificity (from 96% to 98.2%) for the differentiation of carcinomas and metastases from adenomas and pheochromocytomas as the Cho/Cr ≥ 1.20 ratio is applied. However, despite the significant gain in the sensitivity of the 4.0–4.3 ppm/Cr ? 1.50 ratio (from 87% to 92.3%) in the differentiation of carcinomas and pheochromocytomas from adenomas and metastases, there was a decrease in specificity (from 98% to 96.9%). On the other hand, the Lac/Cr ratio demonstrated sensitivity of 90.9% and specificity of 77.8% in the differentiation between carcinomas and adenomas from pheochromocytomas. It is expected that the application of more powerful magnetic fields (3T) will increase the spectral resolution, allowing for a significant improvement in the performance of the present protocol.
-
*
Study developed at Department of Imaging Diagnosis – Escola Paulista de Medicina da Universidade Federal de São Paulo (EPM-Unifesp), São Paulo, SP, Brazil.
Acknowledgement
To Conselho Nacional de Desenvolvimento Científico e Tecnológico (CNPq), for the financial support.
REFERÊNCIAS
-
1Krebs TL, Wagner B. MR imaging of the adrenal gland: radiologicpathologic correlation. Radiographics. 1998;18:1425-40.
-
2Lockhart ME, Smith JK, Kenney PJ. Imaging of adrenal masses. Eur J Radiol. 2002;41:95-112.
-
3Mansmann G, Lau J, Balk E, et al. The clinically inapparent adrenal mass: update in diagnosis and management. Endocr Rev. 2004;25:309-40.
-
4Boland GWL, Blake MA, Hahn PF, et al. Incidental adrenal lesions: principles, techniques, and algorithms for imaging characterization. Radiology. 2008;249:756-75.
-
5Mitchell DG, Crovello M, Matteucci T, et al. Benign adrenocortical masses: diagnosis with chemical shift MR imaging. Radiology. 1992;185:345-51.
-
6Jhaveri KS, Wong F, Ghai S, et al. Comparison of CT histogram analysis and chemical shift MRI in the characterization of indeterminate adrenal nodules. AJR Am J Roentgenol. 2006;187:1303-8.
-
7Kilickesmez O, Inci E, Atilla S, et al. Diffusion-weighted imaging of the renal and adrenal lesions. J Comput Assist Tomogr. 2009;33:828-33.
-
8Korobkin M, Lombardi TJ, Aisen AM, et al. Characterization of adrenal masses with chemical shift and gadolinium-enhanced MR imaging. Radiology. 1995;197:411-8.
-
9Korobkin M, Giordano TJ, Brodeur FJ, et al. Adrenal adenomas: relationship between histologic lipid and CT and MR findings. Radiology. 1996;200:743-7.
-
10Faria J, Goldman SM, Szejnfeld J, et al. Adrenal masses: characterization with in vivo proton MR spectroscopy - initial experience. Radiology. 2007;245:788-97.
-
11Kim S, Salibi N, Hardie AD, et al. Characterization of adrenal pheochromocytoma using respiratory-triggered proton MR spectroscopy: initial experience. AJR Am J Roentgenol. 2009;192:450-4.
-
12Bolinger L, Insko EK. Spectroscopy: basic principles and techniques. In: Edelman RR, Hesselink JR, Zlatkin MB, editors. Clinical magnetic resonance imaging. Philadelphia: WB Saunders; 1996. p. 353-79
-
13Rescinito G, Zandrino F, Cittadini G Jr, et al. Characterization of adrenal adenomas and metastases: correlation between non-enhanced computed tomography and chemical shift magnetic resonance imaging. Acta Radiol. 2006;47;71-6.
-
14Park BK, Kim B, Ko K, et al. Adrenal masses falsely diagnosed as adenomas on non-enhanced and delayed contrast-enhanced computed tomography: pathological correlation. Eur Radiol. 2006;16:642-7.
-
15Blake MA, Krishnamoorthy SK, Boland GW, et al. Low-density pheochromocytoma on CT: a mimicker of adrenal adenoma. AJR Am J Roentgenol. 2003;181:1663-8.
-
16Szolar DH, Korobkin M, Reittner P, et al. Adrenocortical carcinomas and adrenal pheochromocytomas: mass and enhancement loss evaluation at delayed contrast-enhanced CT. Radiology. 2005;234:479-85.
-
17Cox IJ. Development and applications of in vivo clinical magnetic resonance spectroscopy. Prog Biophys Mol Biol. 1996;65:45-81.
-
18Smith JK, Castillo M, Kwock L. MR spectroscopy of brain tumors. Magn Reson Imaging Clin N Am. 2003;11:415-29.
-
19Misic GJ, inventor; Medrad Inc., assignee. Multimode operation of quadrature phased array MR coil systems. United States patent US 20020190716 A1. 2002 Dec 19.
-
20Roemer PB, Edelstein WA, Hayes CE, et al. The NMR phased array. Magn Reson Med. 1990;16:192-225.
-
21Glockner JF, Hu HH, Stanley DW, et al. Parallel MR imaging: a user's guide. Radiographics. 2005;25:1279-97.
-
22Zhang L, Kholmovski EG, Guo J, et al. HASTE sequence with parallel acquisition and T2 decay compensation: application to carotid artery imaging. Magn Reson Imaging. 2009;27:13-22.
-
23Siemens. MR spectroscopy operator manual. Version syngo MR 2002B. USA: Siemens Medical solutions; 2002. p. 1-467.
-
24Leroy-Willig A, Bittoun J, Luton JP, et al. In vivo MR spectroscopic imaging of the adrenal glands: distinction between adenomas and carcinomas larger than 15 mm based on lipid content. AJR Am J Roentgenol. 1989;153:771-3.
-
25Kurhanewicz J, Vigneron DB, Males RG, et al. The prostate: MR imaging and spectroscopy. Present and future. Radiol Clin North Am. 2000;38:115-38.
Publication Dates
-
Publication in this collection
Dec 2014
History
-
Received
2 June 2013 -
Accepted
22 Apr 2014


