Abstracts
The spatial correlation between soil properties and weeds is relevant in agronomic and environmental terms. The analysis of this correlation is crucial for the interpretation of its meaning, for influencing factors such as dispersal mechanisms, seed production and survival, and the range of influence of soil management techniques. This study aimed to evaluate the spatial correlation between the physical properties of soil and weeds in no-tillage (NT) and conventional tillage (CT) systems. The following physical properties of soil and weeds were analyzed: soil bulk density, macroporosity, microporosity, total porosity, aeration capacity of soil matrix, soil water content at field capacity, weed shoot biomass, weed density, Commelina benghalensis density, and Bidens pilosa density. Generally, the ranges of the spatial correlations were higher in NT than in CT. The cross-variograms showed that many variables have a structure of combined spatial variation and can therefore be mapped from one another by co-kriging. This combined variation also allows inferences about the physical and biological meanings of the study variables. Results also showed that soil management systems influence the spatial dependence structure significantly.
cross-variogram; co-kriging; physical and biological meanings
A correlação espacial entre atributos de solo e de plantas espontâneas tem importância agronômica e ambiental. O entendimento dessa correlação é fundamental para a interpretação do seu significado, tendo em conta a influência de fatores como os mecanismos de dispersão, a produção e a sobrevivência das sementes e a extensão da influência das práticas de manejo do solo. O objetivo deste trabalho foi de avaliar a correlação espacial entre atributos físicos de solo e plantas espontâneas em sistema plantio direto (PD) e preparo convencional (PC). Os atributos físicos de solo foram: densidade do solo, macroporosidade, microporosidade, porosidade total, capacidade de aeração da matriz do solo, água retida na capacidade de campo; e os de plantas espontâneas: biomassa da parte aérea das plantas, densidade de plantas, densidade de Commelina benghalensis e densidade de Bidens pilosa. Os alcances das correlações espaciais foram em geral maiores no PD do que no PC. Os variogramas cruzados evidenciaram que muitas variáveis apresentam estrutura de variação conjunta no espaço e, portanto, podem ser mapeadas umas pelas outras pela co-krigagem. A variação conjunta permitiu também fazer inferências sobre os significados físicos e biológicos das variáveis estudadas. Os resultados demonstraram também que os sistemas de manejo do solo exercem influência significativa na estrutura da dependência espacial.
variograma cruzado; co-krigagem; significados físicos e biológicos
INTRODUCTION
The spatial correlation between soil and weed variables has attracted the attention of researchers in recent years, due to their agronomic and environmental significance. Andreasen et al. (1991)Andreasen C, Streibig JC, Haas H. Soil properties affecting the distribution of 37 weed species in Danish soil. Weed Res. 1991;31:181-7. and Bonham et al. (1995)Bonham CD, Reich RM, Leader KK. Spatial cross-correlation of Bouteloua gracilis with site factors. Grass Sci. 1995;41:196-201. established the spatial correlation between weeds and soil properties from linear correlation coefficients, without taking spatial positioning into consideration. Furthermore, the co-variation between soil properties and weed distribution is not yet well understood. Thus, understanding the degree of correlation between soil physical properties and the influence of biological factors such as dispersal mechanisms, seed production and survival, and the range of influence of factors such as soil and weed management is crucial for interpreting the meaning of the spatial correlations between these variables (Dieleman et al., 2000Dieleman JA, Mortensen DA, Buhler DD, Cambardella CA, Moorman TH. Identifying associations among site properties and weed species abundance. I. Multivariate analysis. Weed Sci. 2000;48:567-75.).
The management system of a soil is considered one of the most important sources for
variability of soil physical properties (Stone and
Silveira, 2001Stone LF, Silveira PM. Efeitos do sistema de preparo e da rotação de
culturas na porosidade e densidade do solo. R Bras Ci Solo.
2001;25:395-401.; Schaffrath et al.,
2008Schaffrath VR, Tormena CA, Gonçalves ACA, Fidalski J. Variabilidade
e correlação espacial de propriedades físicas de solo sob plantio direto e
preparo convencional. R Bras Ci Solo. 2008;32:1369-77.; Vitória et al., 2012Vitória EL, Fernandes HC, Teixeira MM, Cecon PR, Lacerda EG.
Correlação linear e espacial entre produtividade de Brachiaria
brizantha, densidade do solo e porosidade total em função do
sistema de manejo do solo. Eng Agríc. [internet]. 2012;12:909-19. Available at:
http://www.scielo.br/scielo.php?script=sci_arttext&pid=S0100-69162012000500010&lng=en&nrm=iso.
http://www.scielo.br/scielo.php?script=s...
).
Studies comparing no-tillage and conventional tillage indicate that the main effects
of management are an increase in soil bulk density in the top 0.20 m and a decrease
in total porosity, especially in relation to the decrease in soil macroporosity and
the increase in soil resistance to penetration in no-tillage systems (Tormena et al., 1999aTormena CA, Silva AP, Gonçalves ACA, Folegatti MV. Intervalo ótimo
de potencial da água no solo: Um conceito para avaliação da qualidade física do
solo e manejo da água na agricultura irrigada. R Bras Eng Agric Amb.
1999a;3:286-92.; Stone and Silveira, 2001Stone LF, Silveira PM. Efeitos do sistema de preparo e da rotação de
culturas na porosidade e densidade do solo. R Bras Ci Solo.
2001;25:395-401.; Tormena et al., 2004Tormena CA, Vidigal Filho OS, Gonçalves ACA, Araújo MA, Pinto JC.
Influência de diferentes sistemas de preparo do solo nas propriedades físicas de
um Latossolo Vermelho distroférico. R Bras Eng Agric Amb.
2004;8:65-71.; Falleiro et al.,
2003Falleiro RM, Souza CM, Silva CSW, Sediyama CS, Silva AA, Fagundes
JL. Influência dos sistemas de preparo nas propriedades químicas e físicas do
solo. R Bras Ci Solo. 2003;7:1097-104.; Sepaskhah et al., 2005Sepaskhah AR, Ahmadi SH, Nikbakht Shahbazi AR. Geostatistical
analysis of sortivity for a soil under tilled and no-tilled conditions. Soil
Till Res. 2005;83:237-45.).
Regarding weed occurrence, the systems are also influential, mainly in terms of the
higher weed density and biomass in conventional tillage. In no-tillage, the
influence is verified in the larger diversity of the infesting community, with lower
biomass (Schaffrath et al., 2007Schaffrath VR, Tormena CA, Gonçalves ACA, Oliveira Junior RS.
Variabilidade espacial de plantas daninhas em dois sistemas de manejo de solos.
R Bras Eng Agric Amb. 2007;11: 53-60.). Therefore,
weeds behave similarly to crop plants, which tend to have a lower yield in more
compacted soils (Freddi et al., 2008Freddi OS, Ferraudo AS, Centurion JF. Análise multivariada na
compactação de um Latossolo Vermelho cultivado com milho. R Bras Ci Solo.
2008;32:953-61.).
Weed mapping from soil properties was proposed by Heisel et al. (1999)Heisel T, Ersbøll AK, Andreasen C. Weed mapping with co-kriging using soil properties. Prec Agric. 1999;1:39-52. since these properties are more easily measurable than plant density. It was observed that the soil silt content correlated well with the density of Lamium spp. Nordmeyer and Dunker (1999)Nordmeyer H, Dunker M. Variable weed densities and soil properties in a weed-mapping concept for patchy weed control. In: Proceedings of 2nd European Conference on Precision Agriculture; 1999; Odense. Odense: Sheffield Academic Press; 1999. p.453-62. also demonstrated a significant spatial correlation between physical and chemical soil properties and the density of different weed species. Alopecurus myosuroides and Viola arvensis were significantly positively correlated with plant-available magnesium. In contrast, the increase in density in Poa annua correlated with a decrease in the clay amount, available Mg and K content, in total N, and organic C. Walter et al. (2002)Walter AM, Christensen S, Simmelsgaard SE. Spatial correlation between weed species densities and soil properties. Weed Res. 2002;42:26-38. studied the spatial correlation between six soil variables and the density of some weed species, verifying that Poa annua and Verônica spp correlated negatively with soil pH and that Viola arvensis correlated negatively with clay content and positively with organic matter content. Other researchers investigated spatial correlations between soil and vegetation variables (Maestre and Cortina, 2002Maestre FT, Cortina J. Spatial patterns of surface soil properties and vegetation in a Mediterranean semi-arid steppe. Plant Soil. 2002;241:279-91.; Holmes et al., 2005Holmes KW, Kyriakidis PC, Chadwick OA, Soares JV, Roberts DA. Multi-scale variability in tropical soil nutrients following land-cover change. Biogeochemistry. 2005;74:173-203.; Maestre et al., 2005Maestre FT, Rodríguez F, Bautista S, Cortina J, Bellot J. Spatial association and pattern of perennial vegetation in a semi-arid steppe: A multivariate geostatistics approach. Plant Ecol. 2005;179:133-47.) and of soil variables with crop yield and soil management over time (Vieira and Dechen, 2010Vieira SR, Dechen SCF. Spatial variability studies in São Paulo, Brazil along the last twenty five years. Bragantia. 2010;69:53-66.).
Regarding weeds, there is a lack of correlation studies between these and soil physical properties, especially studies which take different soil management systems into consideration. Specifically in Brazil, there is no information in the literature dealing with the possible relationships between soil physical properties and weed species. From these considerations, the hypothesis of this study is that soil physical properties and weed variables are correlated in space and that they can be mapped from one another using co-kriging. To test this hypothesis, cross-variograms between the physical properties of the soil and weeds were established from mathematical models which explain the existing variance structure of these variables. The aim of this study was to evaluate the spatial correlation between soil physical properties and weeds in no-tillage (NT) and conventional tillage (CT) in an Oxisol.
MATERIAL AND METHODS
This study was conducted in an area of the Agro-industrial Cooperative Experimental Farm of Campo Mourão, located in the municipality of Campo Mourão, Northwestern region of Paraná (latitude 23º 17’ 09’’ S, longitude 51º 55’ 17’’ W, 620 m asl). The regional climate is humid subtropical mesothermal, with hot summers, rare frosts and a tendency to rain concentration in the summer months, with no defined dry season. The average temperature in the warmer months is higher than 22 ºC and lower than 18 ºC in the colder months, with an average annual temperature between 20 and 21 ºC (IAPAR, 1978Instituto Agronômico do Paraná - IAPAR. Cartas climáticas básicas do estado do Paraná. Londrina; 1978.). The pluviometric index for the trial area is higher than 1,800 mm per year. The soil classification is Rhodic Hapludox, moderate horizon A, very clayey texture, with average values of 870, 92 and 38 g kg-1 of clay, silt and sand, respectively, according to Tormena et al. (2007)Tormena CA, Araújo MA, Fidalski J, Costa JM. Variação temporal do intervalo hídrico ótimo de um Latossolo Vermelho distroférrico sob sistemas de plantio. R Bras Ci Solo. 2007;31:211-9..
The samplings were carried out in two contiguous areas: one in no-tillage (NT), and the other in a conventional tillage (CT) system, tilled with a disk plough and harrowing at a depth of 0.25 m. The NT area had been used for the previous five years for a crop rotation system with soybean, black oat, field pea and corn. The seeder used in NT was equipped with flat disks for straw chopping, fertilizer applied by a furrower and seeds with a double-disk furrower. In the area under CT, a wheat/soybean crop succession was planted. Fertilization was applied according to technical recommendations based on soil analyses. In the NT system, weeds were managed using the herbicides glifosate + chlorimuron or glifosate + flumioxazin, one week before crop planting. In CT, when infestation was high, this procedure was also applied prior to conventional tillage. After planting, weeds were controlled by herbicides applied after crop emergence, using a mixture of 500 mL fomesafen + 500 mL imazethapyr + 60 g oxasulfuron per hectare, in commercial formulations, both in NT and CT.
Initially, the trial area was surrounded with stakes and a 21 × 65 m rectangle was outlined. The central points were aligned and marked with tape, in order to obtain a regular grid of 3 × 5 m, except in two central columns where the spacing was 3 × 2.5 m, duly referenced as x and y coordinates. The total area per management system was 1,365 m2, 21 m on the y and 65 m on the x axis, with a total of 128 sampling points per system. Data collection was conducted one month after the 2003/2004 soybean harvest. Undisturbed soil samples were collected by a sampler and rings with a volume of approximately 100 cm3, from the center of the 0.00-0.15 m layer. Samplings were carried out on April 30, 2004 for NT and May 09, 2004 for CT, at the cross point of the x,y coordinates.
In order to determine the soil physical properties, undisturbed samples were saturated for a period of 48 h in a tray with water to a height of ⅔ of the ring. After saturation, the samples were drained at -60 hPa soil water potential, using a tension table adapted from Kiehl (1979)Kiehl EJ. Manual de edafologia: Relação solo-água-planta. São Paulo: Ceres; 1979.. To drain the soil samples at -100hPa tension, an extraction membrane from Richards, as described by Klute (1986)Klute A. Water retention: Laboratory methods. In: Klute A, editor. Methods of soil analysis: Physical and mineralogical methods. Madison: American Society of Agronomy; 1986. p.635-60. was used. Next, the samples were dried in a forced air oven for 48 h at a temperature of 110 ºC. The physical properties quantified in the undisturbed samples were soil bulk density (Bd), total porosity (Tp), macropore volume (Mac) defined as pores drained at -60 hPa and micropore volume (Mic), defined as water content at -60 hPa. The following indicators were also estimated: aeration capacity of soil matrix (CAMS), an indicator of soil aeration as described by Reynolds et al. (2002)Reynolds WD, Bowman BT, Drury CF, Tan CS, Lu X. Indicators of good soil physical quality: Density and storage parameters. Geoderma. 2002;110:131-46., which is defined as the volume of pores drained between saturation and -100 hPa tension; soil water content at 100 hPa was used to estimate field capacity (CC), according to Reichardt (1987)Reichardt K. A água em sistemas agrícolas. São Paulo: Manole; 1987.. Soil bulk density was determined according to Blake and Hartge (1986)Blake GR, Hartge KH. Bulk density. In: Klute A, editor. Methods of soil analysis; physical and mineralogical methods. Madison: American Society of Agronomy; 1986. p.363-75..
Weeds were collected using a wooden square with an area of 1.0 m2. The quantified variables were: total plant shoot biomass (biomass) present in the sampled area; weed density (Dpe) or the total number of plants per m2; density of Commelina benghalensis (commelina) and density of Bidens pilosa (bidens), determining the number of these plants per m2. In order to determine biomass, weeds were cut close to the ground, packaged in paper bags and dried in a forced ventilation oven at 65 ºC to stable dry mass.
The measured variable data were subjected to exploratory analysis from which the mean and median were obtained as the central tendency measurements and the variance, standard deviation, and coefficient of variation as dispersion measurements. The total range and quartiles were evaluated to analyze the data distribution, and the skewness and kurtosis coefficients to verify data positioning in relation to normal distribution. These analyses were conducted with the Statistic software (Statsoft, 2000Statsoft Inc. Statistica for Windows [Computer program manual] Tulsa: Statsoft Inc.; 2000.). The data were subjected to the Kolmogorov-Smirnov test for finding the approximation to normal distribution, according to Campos (1983)Campos H. Estatística experimental não-paramétrica. 4a ed. Piracicaba: Escola Superior de Agricultura Luiz de Queiroz; 1983..
Some of the variables presented a deterministic component or dependence in relation to the x or y directions, or both, which was identified by linear regression analysis using statistical software SAS (SAS, 1999Statistical Analysis System - SAS. SAS User’s guide statistics. 5th ed. Cary, Statistical Analysis System Institute; 1999.). The deterministic component was removed by subtracting the value obtained with the adjusted linear regression model from the measured value, resulting in trend-free residuals, according to Vieira (2000)Vieira SR. Geoestatística em estudo de variabilidade espacial do solo. In: Novais RF, Alvarez V VH, Schaeffer CEGR, editores. Tópicos em ciência do solo. Viçosa, MG: Sociedade Brasileira de Ciência do Solo; 2000. v.1, p.1-54. and Gonçalves et al. (2001)Gonçalves ACA, Folegatti MV, Da Mata JDV. Análises exploratória e geoestatística da variabilidade de propriedades físicas de um Argissolo Vermelho. Acta Sci. 2001;23:1149-57.. The resulting residuals of these variables were analyzed to evaluate their normal distribution and those which did not approximate this distribution were transformed, using the natural logarithm function. An outlier candidate analysis was also performed in which only the values which effectively affected distribution, distancing it from normal distribution, and which presented a spatial position different from the other neighboring values were considered discrepant, according to Libardi et al. (1996)Libardi PL, Manfron PA, Moraes SO, Tuon RL. Variabilidade da umidade gravimétrica de um solo hidromórfico. R Bras Ci Solo. 1996;20:1-12.. The data found to be discrepant were excluded from the variographic analysis and from cross validation, although maintained in the kriging interpolation process.
The spatial analysis consisted in the construction and interpretation of the cross variograms and in the adjustment of mathematical models to explain the combined variance structure of the data. Variographic analysis was performed with software VarioWin 2.2 (Pannatier, 1996Pannatier Y. VARIOWIN: Software for spatial data analysis in 2D. New York: Springer; 1996.).
In this study, it was assumed that the data fulfill second order stationarity which occurs when the expectation (E) of Z(s) is constant, μ(s) = μ and the variance (VAR) of the increment between Z(s) and Z(s + h) is finite and independent of the spatial position, depending only on the separation vector h, as shown in equation 1.

for any si (sample point) within the area of influence (Gonçalves, 1997Gonçalves ACA. Variabilidade espacial de propriedades físicas de solo para fins de manejo da irrigação [tese]. Piracicaba: Escola Superior de Agricultura Luiz de Queiroz; 1997.; Vieira, 2000Vieira SR. Geoestatística em estudo de variabilidade espacial do solo. In: Novais RF, Alvarez V VH, Schaeffer CEGR, editores. Tópicos em ciência do solo. Viçosa, MG: Sociedade Brasileira de Ciência do Solo; 2000. v.1, p.1-54.). The crossed covariance is defined by equation 2;

While the spatial correlation can be described using equation 3;

Cross semivariance, defined using equation 4;

with i and j being the two spatially dependent variables (Webster, 1985Webster R. Quantitative spatial analysis of soil in the field. Adv Soil Sci. 1985;3:1-70.).
The spatial correlation estimate between two variables was performed with all possible combinations according to Holmes (2005)Holmes KW, Kyriakidis PC, Chadwick OA, Soares JV, Roberts DA. Multi-scale variability in tropical soil nutrients following land-cover change. Biogeochemistry. 2005;74:173-203., by constructing the cross variogram expressed by equation 5.

in which N(h) is the number of measured value pairs Z1(si), Z1(si+h) and Z2(si), Z2(si+h) for the variables Z1 and Z2, separated by a distance corresponding to the module of separation vector h (Vieira, 2000Vieira SR. Geoestatística em estudo de variabilidade espacial do solo. In: Novais RF, Alvarez V VH, Schaeffer CEGR, editores. Tópicos em ciência do solo. Viçosa, MG: Sociedade Brasileira de Ciência do Solo; 2000. v.1, p.1-54.; Walter et al., 2002Walter AM, Christensen S, Simmelsgaard SE. Spatial correlation between weed species densities and soil properties. Weed Res. 2002;42:26-38.).
The authorized mathematical functions, according to McBratney and Webster (1986)McBratney AB, Webster R. Choosing functions for semi-variograms of soil properties and fitting them to sampling estimates. J Soil Sci. 1986;37:617-39., which were used in this study, are described in equations 6, 7, and 8:
-
Spherical model

-
Exponential model

-
Gaussian model

In these equations, the coefficients of the model adjusted to the variogram are: Co - Nugget effect, which is the value of γ(h) when h = 0; Co + C = Sill is the value of γ(h) when the variogram stabilizes; C = structural variance or the difference between the nugget effect and the sill and a = Range is the distance to the point where the variogram reaches the sill and represents the range of spatial dependency, distance from which the pairs of values taken by the variable are independent (Gonçalves, 1997Gonçalves ACA. Variabilidade espacial de propriedades físicas de solo para fins de manejo da irrigação [tese]. Piracicaba: Escola Superior de Agricultura Luiz de Queiroz; 1997.; Grego and Vieira, 2005Grego CR, Vieira SR. Variabilidade espacial de propriedades físicas de solo em uma parcela experimental. R Bras Ci Solo. 2005;29:69-177.).
When one of the variables is sampled at a lower intensity than another, co-kriging may be used to estimate the values of non-sampled locations, from the coefficients of the models adjusted to the direct and cross variograms, according to Vauclin et al. (1983)Vauclin S, Vieira SR, Vachaud G, Nielsen DR. The use of co-kriging with limited field soil observations. Soil Sci Soc Am J. 1983;47:175-84. and Trangmar et al. (1985)Trangmar BB, Yost RS, Uehara G. Application of geostatistics to spatial studies of soil properties. Adv Agron. 1985;38:45-94.. The fitting of the cross variogram between the variables, regardless of order, will generate the same structure of combined variation in space (Trangmar et al., 1985Trangmar BB, Yost RS, Uehara G. Application of geostatistics to spatial studies of soil properties. Adv Agron. 1985;38:45-94.; Webster, 1985Webster R. Quantitative spatial analysis of soil in the field. Adv Soil Sci. 1985;3:1-70.). This way, when the cross variogram is presented between two variables, the discussion is valid for both variables involved, regardless of the order used to construct the cross variogram.
RESULTS AND DISCUSSION
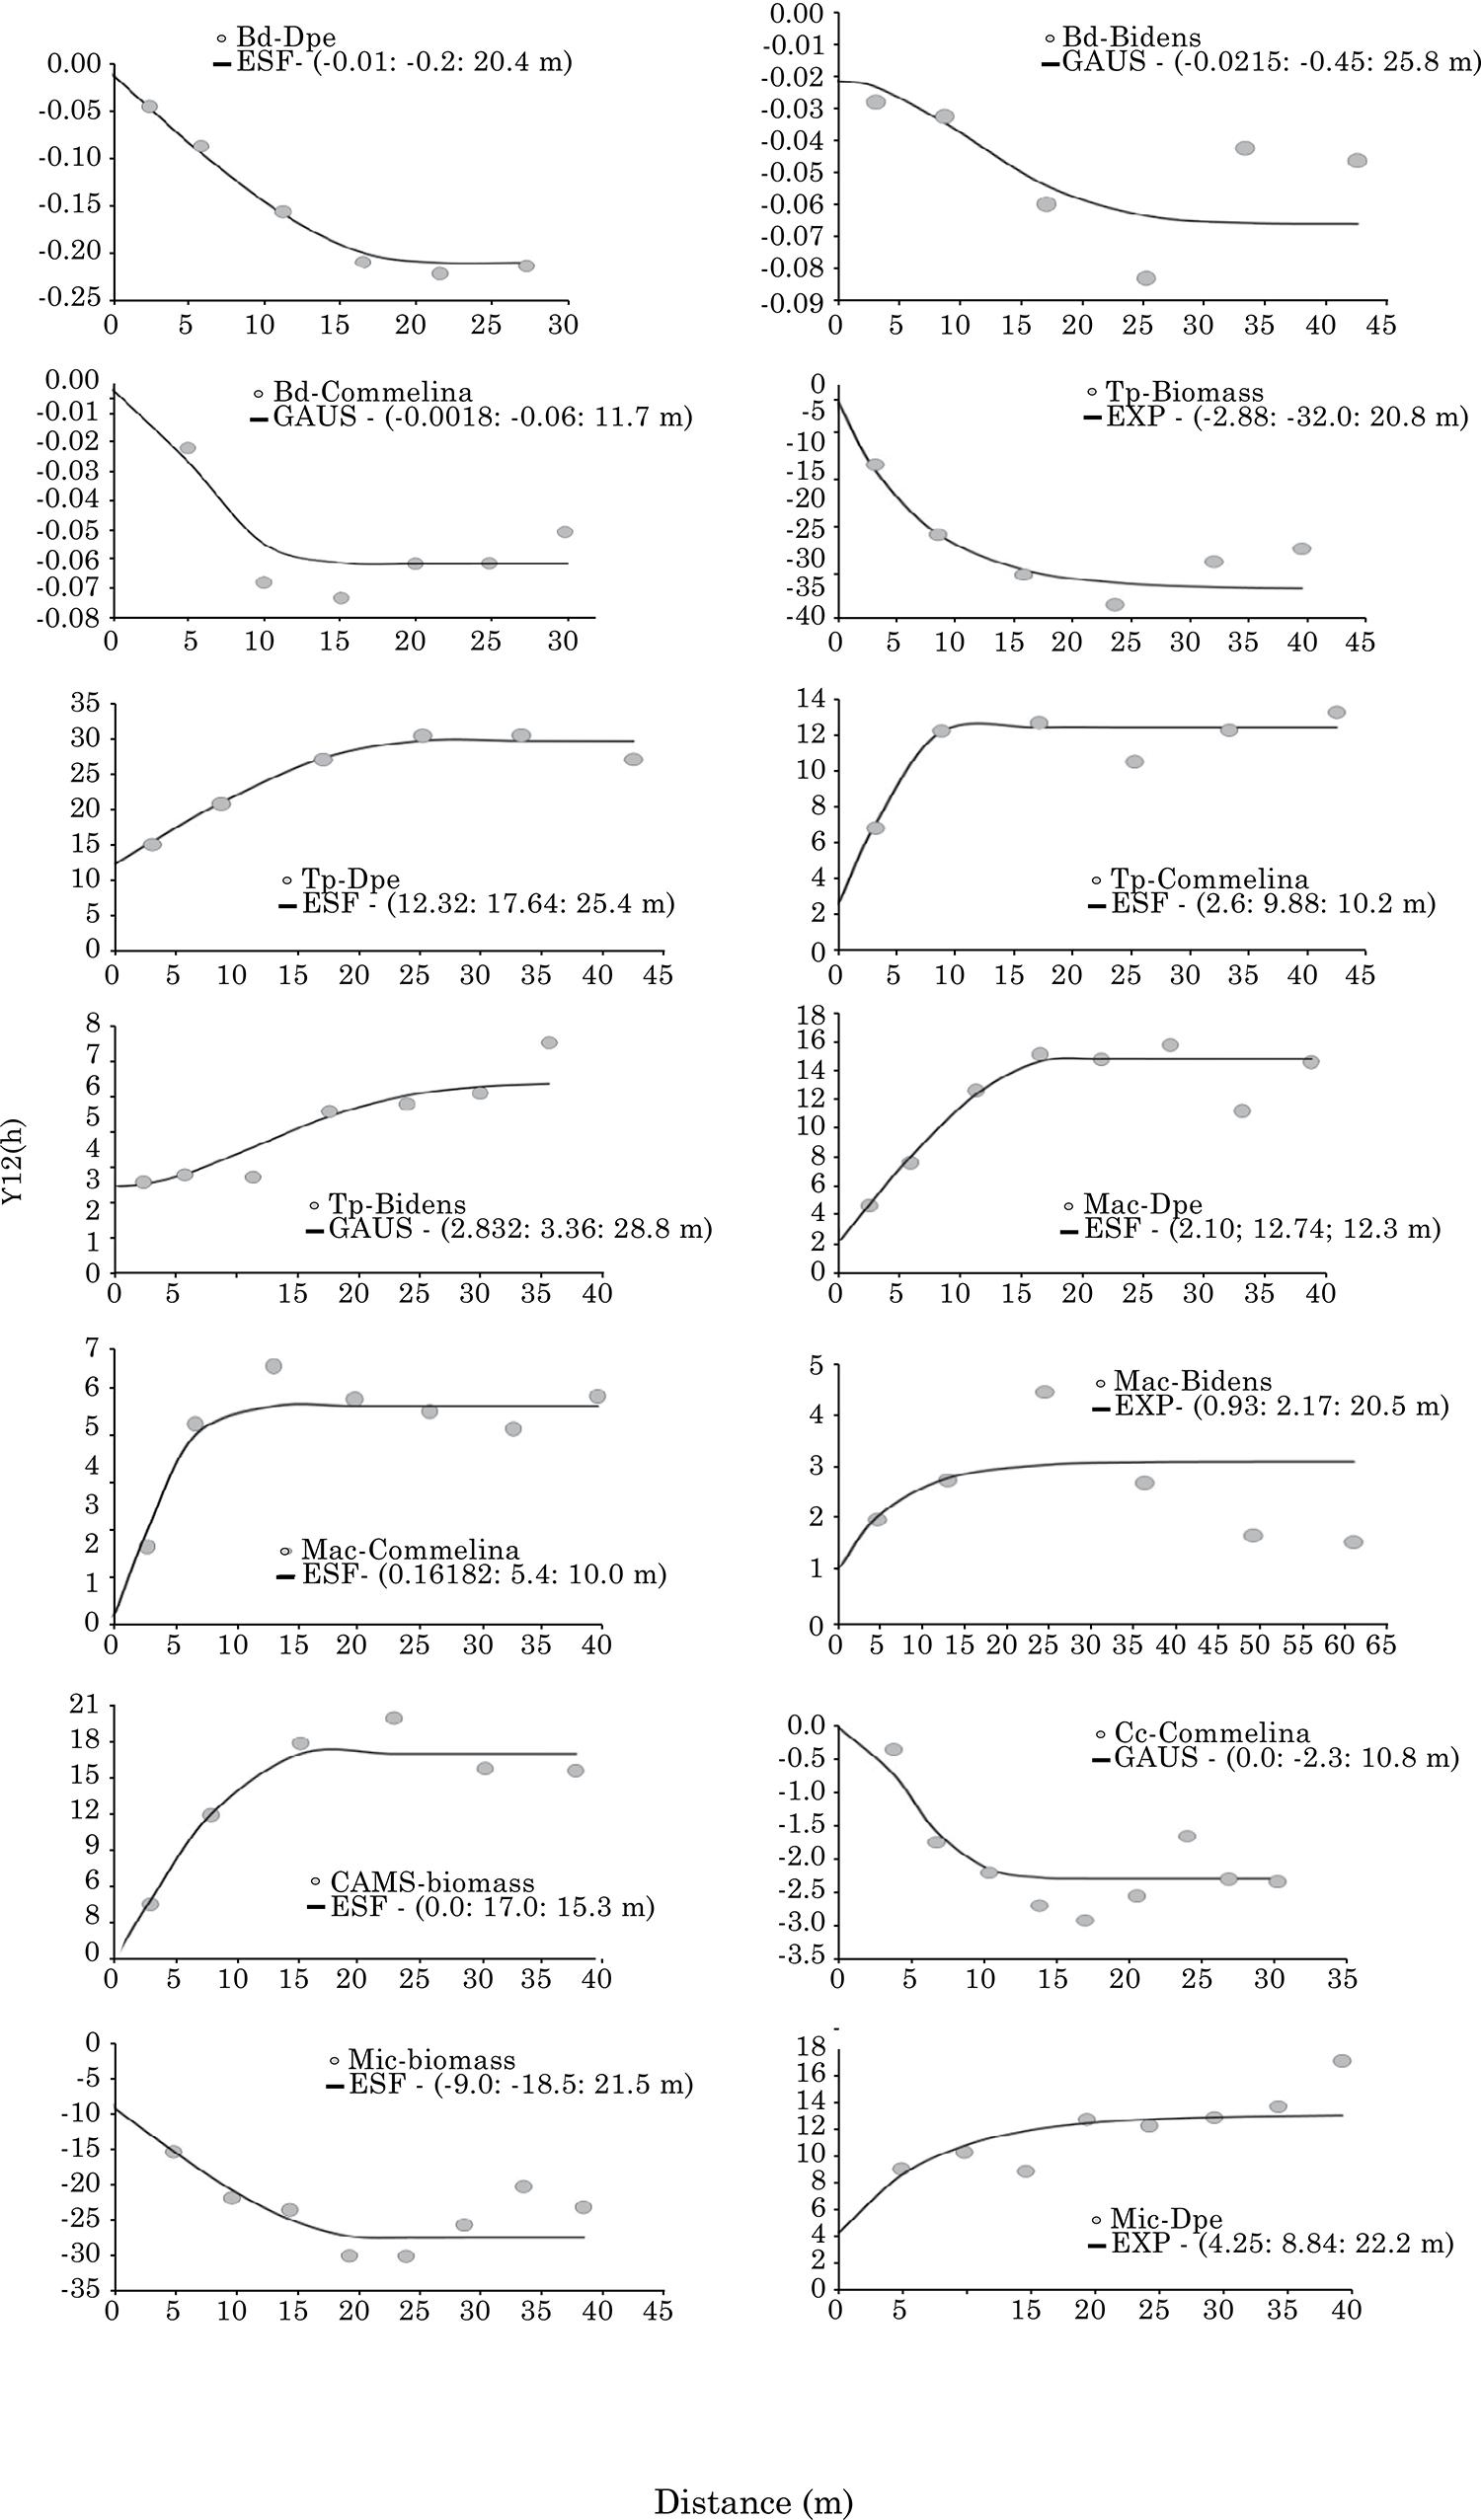
The values concerning the descriptive statistics of the soil properties evaluated for the two studied management systems are presented in table 1. Figures 1 and 2 show the cross variograms for all directions and respective fitted models for the soil physical and weed properties in NT and CT, respectively. Fourteen cross variograms were fitted in NT and nine cross variograms in CT, in a total of 24 possible combinations involving the paired variables.
Cross variograms and mathematical models adjusted to weed variables and physical properties of the soil in no-tollage system. Bd: soil bulk density (kg dm-3); Tp: total porosity (m3 m-3); Mac: macropores equivalent to the pores drained at -60 hPa tension (m3 m-3); Micro: microporosity (m3 m-3); CAMS: pores drained at -100 hPa tension (m3 m-3); CC: estimated water content at -100 hPa tension (m3 m-3); Dpe: weed density (plants m-2); biomass: dry matter of weed shoots (g m-2); commelina: density of Commelina benghalensis plants (plants m-2); bidens: density of Bidens pilosa plants (plants m-2).
Cross variograms and mathematical models adjusted to weed variables and soil physical properties in conventional tillage. Bd: soil bulk density (kg dm-3); Tp: total porosity (m3 m-3); Mac: macroporosity or equivalent of pores drained at -60 hPa tension (m3 m-3); Mic: microporosity (m3 m-3); CAMS: pores drained at -100 hPa tension (m3 m-3); CC: estimated water content at -100 hPa tension (m3 m-3); Dpe: weed density (plants m-2); biomass: dry matter of weed shoots (g m-2).
Table 2 shows the spatial correlations established and their directions using the cross variograms in the two soil management systems. A negative spatial correlation was verified between the total Dpe (commelina and bidens) with Bd, and no correlation between biomass and Bd was found in NT. The direction of spatial correlation shows that, as Bd increases, there is a decrease in Dpe. Therefore, while weeds have a higher capability of adapting to adverse environments, in this soil management system they behave similarly to crop plants, with reduced growth and development in more compacted soil.
In CT, the Dpe correlated positively with Bd (Figure 2). These results reveal the effects of soil management on these relationships, as in NT there was no correlation between biomass and Bd and the correlation between Dpe and Bd was negative, while in CT the correlation was positive. A change in the direction of the correlation was verified: in CT, the increase in Bd promotes an increase in species diversity and a reduction in total biomass. This behavior may evidence the existence of tenuous correlations that will not persist over time, as discussed by Walter et al. (2002)Walter AM, Christensen S, Simmelsgaard SE. Spatial correlation between weed species densities and soil properties. Weed Res. 2002;42:26-38., because soil tillage constantly modifies the soil structure. This induces different correlations, even within the same soil, as stated by Walter et al. (2002)Walter AM, Christensen S, Simmelsgaard SE. Spatial correlation between weed species densities and soil properties. Weed Res. 2002;42:26-38. and Maestre et al. (2005)Maestre FT, Rodríguez F, Bautista S, Cortina J, Bellot J. Spatial association and pattern of perennial vegetation in a semi-arid steppe: A multivariate geostatistics approach. Plant Ecol. 2005;179:133-47., but influenced by the management system. These results agree with those of Walter et al. (2002)Walter AM, Christensen S, Simmelsgaard SE. Spatial correlation between weed species densities and soil properties. Weed Res. 2002;42:26-38. who found a negative correlation between the density of Viola arvensis and soil clay contents, although Heisel et al. (1999)Heisel T, Ersbøll AK, Andreasen C. Weed mapping with co-kriging using soil properties. Prec Agric. 1999;1:39-52. detected no significant correlation between total Dpe and soil properties.
All weed variables were spatially correlated with Tp in the NT system (Figure 1). A negative correlation was verified between biomass and Tp, and a positive one between Dpe and the density of commelina and bidens with Tp. These results suggest that the weeds take advantage of conditions of higher soil porosity, establishing a larger diversity of species. The positive correlation between Dpe and Pt, in spite of maintaining a lower total biomass, is an indicator of this relationship in NT. The larger diversity is an indicator of larger environmental stability, as suggested by Odum (1988)Odum EP. Ecologia. Rio de Janeiro: Guanabara; 1988..
In CT, the weed biomass correlated negatively with Tp, with a variogram range of 42 m. The direction of the correlation was similar to the NT system, however, with a wider range in CT, pointing to a larger spatial dependency in this system. While there was no significant correlation between Tp and Dpe in this management system, it can be said that there is a decrease in total biomass with an increase in Tp (Table 1). The higher Tp in NT showed a larger species diversity, indicated by the positive correlation between Tp and Dpe (Figure 1). This effect was not repeated in CT, possibly due to the lower structural stability of the soil in this system, with lower soil porosity, as well as to the physical effect of periodical soil tillage. Heisel et al. (1999)Heisel T, Ersbøll AK, Andreasen C. Weed mapping with co-kriging using soil properties. Prec Agric. 1999;1:39-52. and Walter et al. (2002)Walter AM, Christensen S, Simmelsgaard SE. Spatial correlation between weed species densities and soil properties. Weed Res. 2002;42:26-38. presented different results for correlations of the same studied variables, evidencing their specificity.
The Dpe variables correlated positively with macroporosity (Mac) in the NT system (Figure 1). The larger range of spatial dependency between bidens and Mac, of 20.5 m, may be related with the dispersal mechanism of this species, which allows the seeds to be taken across larger distances when compared to commelina, with a range of 10.5 m. The larger quantity of macropores in the soil indicates that good drainage after soil saturation, allowing a faster diffusion of oxygen to the roots of the weeds, according to Tormena et al. (1999aTormena CA, Silva AP, Gonçalves ACA, Folegatti MV. Intervalo ótimo de potencial da água no solo: Um conceito para avaliação da qualidade física do solo e manejo da água na agricultura irrigada. R Bras Eng Agric Amb. 1999a;3:286-92.,bTormena CA, Silva AP, Libardi PL. Soil physical quality of a Brazilian Oxisoil under two tillage systems using the least limiting water range approach. Soil Till Res. 1999b;52:223-32.). The positive correlation between total density and plant species with Tp and Mac indicates that this soil condition is a favorable for plant development, which is used by weeds in their establishment and development.
The biomass was negatively correlated with Mac and positively with Dpe in CT (Figure 2). As Mac increases, there is a positive effect on the increase in diversity of weed species, which is a good indicator of the greater stability of agro-ecosystems under no-tillage. This decrease in total biomass is possibly due to the interspecific competition between the shoot and the root system, as established by Rizzardi et al. (2001)Rizzardi MA, Fleck NG, Vidal RA, Merotto Jr A, Agostinetto D. Competição por recursos do solo entre ervas daninhas e culturas. Ci Rural. 2001;31:707-14.. The variable biomass of weeds correlated positively with CAMS and no correlations were verified between these and the other variables in the NT system, while CAMS was negatively correlated with Dpe in CT. The variable Dpe correlated negatively with CC in CT. There is a contradiction between the behaviors of these two variables in relation to CAMS, since when CAMS increases the water content at field capacity decreases. Therefore, the expected direction of the correlation would be the inverse between the Dpe and CAMS and CC. In the NT system, there was no significant correlation between these variables, and it can be inferred that these correlations in CT are weak correlations, which will not persist over time, as pointed out by Walter et al. (2002)Walter AM, Christensen S, Simmelsgaard SE. Spatial correlation between weed species densities and soil properties. Weed Res. 2002;42:26-38..
In the NT system, commelina density correlated negatively with the water content at field capacity (Figure 1). Analyzing the positive correlations of this species with Tp and Mac and the negative correlation with Bd and water content at field capacity, it can be inferred that this plant has a better development in well drained, uncompacted soils, in agreement with its dispersal system, with airborne and subterranean seeds and rhyzomes, as described by Walker and Evenson (1985a,b). Although crop plants develop better under the same conditions and can hamper the development of this species, it is able to establish during the crop cycle even under shaded conditions and starts growing abundantly immediately after harvest (Schaffrath and Miller, 2000Schaffrath VR, Miller PRM. Consórcio de mandioca com crotalária - Efeito sobre plantas espontâneas. Agroecol Desenv Rural Sust. 2000;1:19-24.).
A negative and positive correlation was verified between biomass and Dpe, respectively, with microporosity (Mic) the NT system. The negative correlation of weed biomass with Tp and soil Mic, as shown in table 1, may indicate a close relationship between weed diversity and biomass production of these plants with these variables. Generally, it can be said that, based on the correlations observed between Tp and weed variables, increases in Tp result in increases in Dpe and in the density of the species studied, although biomass decreases. This effect, expanding the number of species present but reducing the total biomass, may be the result of an interspecific competition between weeds, i.e., species diversity is larger but with a lower production of total biomass, as suggested by Maestre et al. (2005)Maestre FT, Rodríguez F, Bautista S, Cortina J, Bellot J. Spatial association and pattern of perennial vegetation in a semi-arid steppe: A multivariate geostatistics approach. Plant Ecol. 2005;179:133-47.. It can also be inferred that the effect of the increase in Tp is beneficial in agronomic terms, as a lower weed biomass production may indicate a decrease in competition between weeds and crop plants (Rizzardi et al., 2001Rizzardi MA, Fleck NG, Vidal RA, Merotto Jr A, Agostinetto D. Competição por recursos do solo entre ervas daninhas e culturas. Ci Rural. 2001;31:707-14.).
A larger diversity of species is an indicator of greater environmental stability, a crucial condition for establishing agro-ecosystems managed sustainably. In CT, Mic was positively correlated with biomass and negatively with Dpe. These correlations occur in the reverse direction than the correlation of Pt with biomass and Mac with biomass. These relationships indicate that correlations in CT tend to be unstable over time, or short term correlations, requiring, for that reason, a longer evaluation period to verify the persistence of these correlations, as suggested by Walter et al. (2002)Walter AM, Christensen S, Simmelsgaard SE. Spatial correlation between weed species densities and soil properties. Weed Res. 2002;42:26-38..
CONCLUSIONS
About half the variables analyzed were spatially correlated, mainly in the NT system. In these cases, co-kriging may be used to map one variable from another.
The soil management system influenced the spatial correlations.
A larger diversity of weeds was observed in the no-tillage system, and a larger weed biomass in conventional tillage.
The spatially correlated variables can be used to draw conclusions from one another in the studied management systems.
ACKNOWLEDGEMENT
The authors would like to thank the Fundação para a Ciência e a Tecnologia (FCT) of Portugal (pest-OE/CTE/UI4028/2014 project) for the partial financing of the editing costs of this paper.
REFERENCES
- Andreasen C, Streibig JC, Haas H. Soil properties affecting the distribution of 37 weed species in Danish soil. Weed Res. 1991;31:181-7.
- Blake GR, Hartge KH. Bulk density. In: Klute A, editor. Methods of soil analysis; physical and mineralogical methods. Madison: American Society of Agronomy; 1986. p.363-75.
- Bonham CD, Reich RM, Leader KK. Spatial cross-correlation of Bouteloua gracilis with site factors. Grass Sci. 1995;41:196-201.
- Campos H. Estatística experimental não-paramétrica. 4a ed. Piracicaba: Escola Superior de Agricultura Luiz de Queiroz; 1983.
- Dieleman JA, Mortensen DA, Buhler DD, Cambardella CA, Moorman TH. Identifying associations among site properties and weed species abundance. I. Multivariate analysis. Weed Sci. 2000;48:567-75.
- Falleiro RM, Souza CM, Silva CSW, Sediyama CS, Silva AA, Fagundes JL. Influência dos sistemas de preparo nas propriedades químicas e físicas do solo. R Bras Ci Solo. 2003;7:1097-104.
- Freddi OS, Ferraudo AS, Centurion JF. Análise multivariada na compactação de um Latossolo Vermelho cultivado com milho. R Bras Ci Solo. 2008;32:953-61.
- Gonçalves ACA. Variabilidade espacial de propriedades físicas de solo para fins de manejo da irrigação [tese]. Piracicaba: Escola Superior de Agricultura Luiz de Queiroz; 1997.
- Gonçalves ACA, Folegatti MV, Da Mata JDV. Análises exploratória e geoestatística da variabilidade de propriedades físicas de um Argissolo Vermelho. Acta Sci. 2001;23:1149-57.
- Grego CR, Vieira SR. Variabilidade espacial de propriedades físicas de solo em uma parcela experimental. R Bras Ci Solo. 2005;29:69-177.
- Heisel T, Ersbøll AK, Andreasen C. Weed mapping with co-kriging using soil properties. Prec Agric. 1999;1:39-52.
- Holmes KW, Kyriakidis PC, Chadwick OA, Soares JV, Roberts DA. Multi-scale variability in tropical soil nutrients following land-cover change. Biogeochemistry. 2005;74:173-203.
- Instituto Agronômico do Paraná - IAPAR. Cartas climáticas básicas do estado do Paraná. Londrina; 1978.
- Kiehl EJ. Manual de edafologia: Relação solo-água-planta. São Paulo: Ceres; 1979.
- Klute A. Water retention: Laboratory methods. In: Klute A, editor. Methods of soil analysis: Physical and mineralogical methods. Madison: American Society of Agronomy; 1986. p.635-60.
- Libardi PL, Manfron PA, Moraes SO, Tuon RL. Variabilidade da umidade gravimétrica de um solo hidromórfico. R Bras Ci Solo. 1996;20:1-12.
- Maestre FT, Cortina J. Spatial patterns of surface soil properties and vegetation in a Mediterranean semi-arid steppe. Plant Soil. 2002;241:279-91.
- Maestre FT, Rodríguez F, Bautista S, Cortina J, Bellot J. Spatial association and pattern of perennial vegetation in a semi-arid steppe: A multivariate geostatistics approach. Plant Ecol. 2005;179:133-47.
- McBratney AB, Webster R. Choosing functions for semi-variograms of soil properties and fitting them to sampling estimates. J Soil Sci. 1986;37:617-39.
- Nordmeyer H, Dunker M. Variable weed densities and soil properties in a weed-mapping concept for patchy weed control. In: Proceedings of 2nd European Conference on Precision Agriculture; 1999; Odense. Odense: Sheffield Academic Press; 1999. p.453-62.
- Odum EP. Ecologia. Rio de Janeiro: Guanabara; 1988.
- Pannatier Y. VARIOWIN: Software for spatial data analysis in 2D. New York: Springer; 1996.
- Reichardt K. A água em sistemas agrícolas. São Paulo: Manole; 1987.
- Reynolds WD, Bowman BT, Drury CF, Tan CS, Lu X. Indicators of good soil physical quality: Density and storage parameters. Geoderma. 2002;110:131-46.
- Rizzardi MA, Fleck NG, Vidal RA, Merotto Jr A, Agostinetto D. Competição por recursos do solo entre ervas daninhas e culturas. Ci Rural. 2001;31:707-14.
- Statistical Analysis System - SAS. SAS User’s guide statistics. 5th ed. Cary, Statistical Analysis System Institute; 1999.
- Schaffrath VR, Miller PRM. Consórcio de mandioca com crotalária - Efeito sobre plantas espontâneas. Agroecol Desenv Rural Sust. 2000;1:19-24.
- Schaffrath VR, Tormena CA, Gonçalves ACA, Fidalski J. Variabilidade e correlação espacial de propriedades físicas de solo sob plantio direto e preparo convencional. R Bras Ci Solo. 2008;32:1369-77.
- Schaffrath VR, Tormena CA, Gonçalves ACA, Oliveira Junior RS. Variabilidade espacial de plantas daninhas em dois sistemas de manejo de solos. R Bras Eng Agric Amb. 2007;11: 53-60.
- Sepaskhah AR, Ahmadi SH, Nikbakht Shahbazi AR. Geostatistical analysis of sortivity for a soil under tilled and no-tilled conditions. Soil Till Res. 2005;83:237-45.
- Statsoft Inc. Statistica for Windows [Computer program manual] Tulsa: Statsoft Inc.; 2000.
- Stone LF, Silveira PM. Efeitos do sistema de preparo e da rotação de culturas na porosidade e densidade do solo. R Bras Ci Solo. 2001;25:395-401.
- Tormena CA, Silva AP, Gonçalves ACA, Folegatti MV. Intervalo ótimo de potencial da água no solo: Um conceito para avaliação da qualidade física do solo e manejo da água na agricultura irrigada. R Bras Eng Agric Amb. 1999a;3:286-92.
- Tormena CA, Silva AP, Libardi PL. Soil physical quality of a Brazilian Oxisoil under two tillage systems using the least limiting water range approach. Soil Till Res. 1999b;52:223-32.
- Tormena CA, Vidigal Filho OS, Gonçalves ACA, Araújo MA, Pinto JC. Influência de diferentes sistemas de preparo do solo nas propriedades físicas de um Latossolo Vermelho distroférico. R Bras Eng Agric Amb. 2004;8:65-71.
- Tormena CA, Araújo MA, Fidalski J, Costa JM. Variação temporal do intervalo hídrico ótimo de um Latossolo Vermelho distroférrico sob sistemas de plantio. R Bras Ci Solo. 2007;31:211-9.
- Trangmar BB, Yost RS, Uehara G. Application of geostatistics to spatial studies of soil properties. Adv Agron. 1985;38:45-94.
- Vauclin S, Vieira SR, Vachaud G, Nielsen DR. The use of co-kriging with limited field soil observations. Soil Sci Soc Am J. 1983;47:175-84.
- Vieira SR. Geoestatística em estudo de variabilidade espacial do solo. In: Novais RF, Alvarez V VH, Schaeffer CEGR, editores. Tópicos em ciência do solo. Viçosa, MG: Sociedade Brasileira de Ciência do Solo; 2000. v.1, p.1-54.
- Vieira SR, Dechen SCF. Spatial variability studies in São Paulo, Brazil along the last twenty five years. Bragantia. 2010;69:53-66.
- Vitória EL, Fernandes HC, Teixeira MM, Cecon PR, Lacerda EG. Correlação linear e espacial entre produtividade de Brachiaria brizantha, densidade do solo e porosidade total em função do sistema de manejo do solo. Eng Agríc. [internet]. 2012;12:909-19. Available at: http://www.scielo.br/scielo.php?script=sci_arttext&pid=S0100-69162012000500010&lng=en&nrm=iso.
» http://www.scielo.br/scielo.php?script=sci_arttext&pid=S0100-69162012000500010&lng=en&nrm=iso - Walker SR, Evenson JP. Biology of Commelina benghalensis L. in south-eastern Queensland. 2. Seed dormancy, germination and emergence. Weed Res. 1985a;25:245-50.
- Walker SR, Evenson JP. Biology of Commelina benghalensis L. in south-eastern Queensland. 1. Growth, development and seed production. Weed Res. 1985b;25:239-44.
- Walter AM, Christensen S, Simmelsgaard SE. Spatial correlation between weed species densities and soil properties. Weed Res. 2002;42:26-38.
- Webster R. Quantitative spatial analysis of soil in the field. Adv Soil Sci. 1985;3:1-70.
Publication Dates
-
Publication in this collection
Jan-Feb 2015
History
-
Received
13 Sept 2013 -
Accepted
28 Aug 2014