ABSTRACT
Swine production systems contribute to emission of greenhouse gases (CO2, N2O, and CH4) and ammonia (NH3) into the atmosphere. Therefore, the objective of this study was to evaluate methods for determining the emissions of ammonia and greenhouse gases (GHG) in a commercial swine production unit with natural ventilation during the finishing phase. The concentrations of gases in the air were measured using a gas analyzer (INNOVA 1412), and the flow emission was calculated by considering the ventilation rate and the differences in gas concentration between the interior and exterior of the installation. The results showed that the emission flow obtained via the simplified method in [g per swine h-1] was 2.689, 0.30, 4.39, 13.55, and 3.273 for CO2, N2O, CH4, NH3, and water vapor, respectively. The flow obtained using the continuous method in [g per swine h-1] was 574, 0.67, 19.50, 5.84, and 7.2 for CO2, N2O, CH4, NH3, and water vapor, respectively. The proposed simplified method was highly accurate for estimating GHG emissions from swine production systems with natural ventilation.
Key words:
swine farm; methane; ammonia; environment; global warming
RESUMO
Os sistemas de produção de suínos contribuem com emissões de gases de efeito estufa (dióxido de carbono - CO2, óxido nitroso - N2O e metano - CH4) e amônia - NH3 para a atmosfera. Portanto, o objetivo deste estudo foi avaliar metodologias para determinação das emissões de amônia e gases de efeito estufa em uma unidade de produção comercial de suínos durante a fase de terminação, que possui ventilação natural. Foram medidas as concentrações de gases no ar pelo analisador de gases (INNOVA 1412) e foi calculada a vazão de emissões considerando a taxa de ventilação e as diferenças de concentração de gases entre o interior e o exterior da instalação. Os resultados mostraram que a vazão de emissão obtida pela metodologia simplificada em [g suíno por hora] foi: 2,689 para CO2, 0,30 para N2O, 4,39 para CH4, 13,55 para NH3 e 3,273 para vapor d’água. A vazão obtida para a metodologia contínua em [g suíno por hora] foi de 574 para CO2, 0,67 para N2O, 19,50 para CH4, 5,84 para NH3 e 7,2 para vapor d’água. A metodologia simplificada foi altamente precisa para estimar as emissões de GEE em sistemas de produção de suínos com ventilação natural.
Palavras-chave:
granja de suínos; metano; amônia; meio ambiente; aquecimento global
HIGHLIGHTS:
The emission of greenhouse gases in swine farms contributes to global warming.
The method used for quantification of greenhouse gas emissions from swine farming must be accurate and adapted to Brazil.
The simplified method is reliable and can replace the conventional continuous method.
Introduction
The world population is estimated to reach nine billion by 2050. Therefore, the demand for subsistence resources, mainly for food of animal origin, will increase. The consumption of pork meat is an alternative, causing an increase in the production of number of animals, which in turn increases the amount of waste produced, in addition to the emission of greenhouse gases (GHGs) into the environment.
Increasing concentrations of greenhouse gases in the atmosphere are a cause of global warming. The gases primarily responsible for this effect are carbon dioxide (CO2), methane (CH4), and nitrous oxide (N2O). Greenhouse gas emissions from livestock activities account for approximately 18% of the total emissions. Of this total, 13% resulted from swine farming (Philippe & Nicks, 2015Philippe, F. X.; Nicks, B. Review on greenhouse gas emissions from swine houses: Production of carbon dioxide. methane and nitrous oxide by animals and manure. Agriculture, Ecosystems & Environment, v.199, p.10-25, 2015. https://doi.org/10.1016/j.agee.2014.08.015
https://doi.org/10.1016/j.agee.2014.08.0...
). The ONU environment has pointed out numerous environmental losses related to unsustainable agricultural practices (Gelinski Neto et al., 2019Gelinski Neto, F.; Gelinski, C.; Gelinski Júnior, E. A contribuição catarinense para a redução de gases de efeito estufa: Lei do Biogás. Revista Catarinense de Economia, v.3, p.56-73, 2019. https://doi.org/10.54805/RCE.2527-1180.v3.n1.60
https://doi.org/10.54805/RCE.2527-1180.v...
).
Several estimates of GHG emissions from swine production systems have been made on the European and North American continents, where buildings and climate differ from Brazil (Samer et al., 2012Samer, M.; Ammon, C.; Loebsin, C.; Fiedler, M.; Berg, W.; Sanftleben, P.; Brunsch, R. Moisture balance and tracer gas technique for ventilation rates measurement and greenhouse gases and ammonia emissions quantification in naturally ventilated buildings. Building and Environment, v.50, p.10-20, 2012. https://doi.org/10.1016/j.buildenv.2011.10.008
https://doi.org/10.1016/j.buildenv.2011....
). Global warming and the increase in atmospheric concentrations of GHGs have resulted in environmental concerns, which necessitates the evaluation of the contribution of swine farming activities to these emission rates (Dortzbach et al., 2021Dortzbach, D.; Vieira, V. F.; Trabaquini, K.; Blainski, E.; Fronza, E.; Loss, A. Estimativa das emissões de gases de efeito estufa do setor agropecuário de Santa Catarina, Brasil. Agroindustrial Science, v.11, p.305-313, 2021. https://doi.org/10.17268/agroind.sci.2021.03.08
https://doi.org/10.17268/agroind.sci.202...
).
Current methods used to quantify gaseous emissions based on continuous measurements are expensive and difficult to apply on a large scale (Haeussermann et al., 2008Haeussermann, A.; Costa, A.; Aerts, J. M.; Hartung, E.; Jungbluth, T.; Guarino, M.; Berckmans, D. Development of a dynamic model to predict PM10 emissions from swine houses. Journal of Environmental Quality, v.37, p.557-564, 2008. https://doi.org/10.2134/jeq2006.0416
https://doi.org/10.2134/jeq2006.0416...
). Therefore, it is necessary to simplify the current methods to multiply the acquired data to estimate the emissions of the main GHGs generated in a swine production system. Moreover, the error in the calculated emissions should be controlled to be less than 30%.
The objective of this study was to evaluate methodologies for determining the emissions of ammonia and GHGs in a commercial swine production unit during the finishing phase, which has natural ventilation.
Material and Methods
Data were collected from a commercial swine finishing farm located in the municipality of Alto Bela Vista, SC, Brazil (27° 18’ 34” S and 51° 59’ 30” W, altitude of 548 m) with predominant southeast (SE) and northeast (NE) winds. The climate is subtropical humid mesothermal Cfa with hot summers (average annual air temperature of 18-19 °C and average annual precipitation of 1700-1900 mm) according to the Köppen classification. Air temperature, relative air humidity, and rain data were collected from the farm using an automatic station.
The experimental building is oriented east-west and is 24.0 m long, 8.5 m wide and 2.60 m high. Its roof is a fiber cement tile with a lining made of plastic canvas and it has a threshold of 0.90 m. In addition, the rest of the sides are open, totaling a side opening area of approximately 81.6 m2. A total of 144 commercial hybrid swine from selected lines for lean meat deposition (Landrace and Large White), females, and castrated males were randomly housed in 12 pens during the finishing phase.
The continuous methodology is considered the standard and allows a better characterization of emissions throughout the seasons and presents more robust data in relation to the real emission of gases; thus, it serves as a model for comparison with new methodologies (Haeussermann et al., 2008Haeussermann, A.; Costa, A.; Aerts, J. M.; Hartung, E.; Jungbluth, T.; Guarino, M.; Berckmans, D. Development of a dynamic model to predict PM10 emissions from swine houses. Journal of Environmental Quality, v.37, p.557-564, 2008. https://doi.org/10.2134/jeq2006.0416
https://doi.org/10.2134/jeq2006.0416...
).
The simplified method consists of air collection in the internal and external environments of the building to determine the concentration gradient of the gases, validated through the carbon and nitrogen mass balance. The simplified methodology developed by Robin et al. (2013Robin, P.; Amand, G.; Aubert, C.; Babela, N.; Brachet, A.; Berckmans, D.; Burton, C.; Canart, B.; Cellier, P.; Dollé, J. B.; Dong, H. M.; Durif, M.; Ehrlancher, A.; Eren Ozecan, S.; Espagnol, S.; Gautier, F.; Guingand, N.; Guiziou, F.; Hartung, E.; Hassouna, M.; Landrain, P.; Lee, I. M.; Leleu, C.; Li, Y. S.; Liao, X. D.; Loubet, B.; Loyon, L.; Luth; Nicks, B.; Oliveira, P. A. V. de; Ponchant, P.; Powers, W.; Ramonet, Y.; Sommer, S. G.; Thiard, J.; Wang, K. W.; Xin, H.; Youssef, A. Reference procedures for the measurement of gaseous emissions from livestock houses and storages of animal manure. Emissions of Gas and Dust from Livestock, p.355-358, 2013. Available on: <Available on: https://ainfo.cnptia.embrapa.br/digital/bitstream/item/122431/1/final7486.pdf >. Accessed on: Dec. 2021.
https://ainfo.cnptia.embrapa.br/digital/...
) was used to evaluate the emissions of gases generated inside and outside the building. This simplified method calculates the amount of CO2 (carbon dioxide), CH4 (methane), N2O (nitrous oxide) and NH3 (ammonia) generated in a swine production system. According to Robin et al. (2013), this method allows the calculation of annual emissions from a swine production system while ensuring that the errors lie in the 20-30% range.
Data were collected for three months in the production unit, and the concentration (ppm) of gases in the air was collected in bags, inside and outside the farm for 45 min, three times a week on alternate days during the finishing phase. For greater representativeness of the samples, the air collected inside the building was throughout its length in the corridor and over the bays. By contrast, the air collected outside was sampled along its entire length, considering its sides, and this air was collected 3 m from the building for 45 min.
Collection was performed using an ELITE® suction pump with a flow rate of 3.3 × 10⁻⁶ m3 s-1 connected to a TEDLAR collection bag (SKC®) with a volume of 10 L. The contents of the collectors were analyzed using infrared photoacoustic analyzer equipment (INNOVA1412®) to measure the concentrations of CO2, CH4, NH3, and H2O vapor.
Two air sampling points were installed for continuous gas measurements: one 1.2 m above the floor in a central span and the other 15 m away from the building, positioned at a height of 1.2 m from the ground. These two points were connected to an analyzer (INNOVA 1412), which suctioned air using two thin Teflon tubes (4 mm in diameter).
The air temperature and relative air humidity values were stored using a TESTO model 174H data-logger, installed inside and outside the building, totaling four pieces of equipment, two inside, installed at a height of 1.60 m from the floor and the other two outside 2.50 m from the ground. This equipment recorded the air temperature and relative air humidity measurements every 30 min.
The air velocity data were collected longitudinally at five distinct points in the building, three in its interior, and two in the exterior. At each point, according to the recommendations of Robin et al. (2013Robin, P.; Amand, G.; Aubert, C.; Babela, N.; Brachet, A.; Berckmans, D.; Burton, C.; Canart, B.; Cellier, P.; Dollé, J. B.; Dong, H. M.; Durif, M.; Ehrlancher, A.; Eren Ozecan, S.; Espagnol, S.; Gautier, F.; Guingand, N.; Guiziou, F.; Hartung, E.; Hassouna, M.; Landrain, P.; Lee, I. M.; Leleu, C.; Li, Y. S.; Liao, X. D.; Loubet, B.; Loyon, L.; Luth; Nicks, B.; Oliveira, P. A. V. de; Ponchant, P.; Powers, W.; Ramonet, Y.; Sommer, S. G.; Thiard, J.; Wang, K. W.; Xin, H.; Youssef, A. Reference procedures for the measurement of gaseous emissions from livestock houses and storages of animal manure. Emissions of Gas and Dust from Livestock, p.355-358, 2013. Available on: <Available on: https://ainfo.cnptia.embrapa.br/digital/bitstream/item/122431/1/final7486.pdf >. Accessed on: Dec. 2021.
https://ainfo.cnptia.embrapa.br/digital/...
), 10 air velocity readings were performed to obtain the average velocity at the time of the gas emission measurement, inside and outside the building.
To calculate the gas flows generated in the building, it was considered the airflow coming out of the installation, the characteristics of the volumetric mass of the air, and the difference in gas concentration between the interior and exterior of the building expressed in terms of the mass concentration for both nitrogen (N) and carbon (C), as recommended by Robin et al. (2013Robin, P.; Amand, G.; Aubert, C.; Babela, N.; Brachet, A.; Berckmans, D.; Burton, C.; Canart, B.; Cellier, P.; Dollé, J. B.; Dong, H. M.; Durif, M.; Ehrlancher, A.; Eren Ozecan, S.; Espagnol, S.; Gautier, F.; Guingand, N.; Guiziou, F.; Hartung, E.; Hassouna, M.; Landrain, P.; Lee, I. M.; Leleu, C.; Li, Y. S.; Liao, X. D.; Loubet, B.; Loyon, L.; Luth; Nicks, B.; Oliveira, P. A. V. de; Ponchant, P.; Powers, W.; Ramonet, Y.; Sommer, S. G.; Thiard, J.; Wang, K. W.; Xin, H.; Youssef, A. Reference procedures for the measurement of gaseous emissions from livestock houses and storages of animal manure. Emissions of Gas and Dust from Livestock, p.355-358, 2013. Available on: <Available on: https://ainfo.cnptia.embrapa.br/digital/bitstream/item/122431/1/final7486.pdf >. Accessed on: Dec. 2021.
https://ainfo.cnptia.embrapa.br/digital/...
). This is expressed in Eq. 1.
where:
φ - emission of gas (mg h-1 per animal) dry air, estimated from the airflow, concentration of gases, and volumetric mass of dry air;
Qair - airflow coming out from the building (m³ h-1), calculated from total heat, latent, and wind speed production (m³ s-1);
Cm i - mass gas concentration inside the building (g kg-1 dry air);
Cm e - mass gas concentration outside the building (g kg-1 of dry air); and,
ρi - conversion factor of the volume of airflow passing through the installation in m3 h-1 to the mass flow in kilograms of dry air per hour. This allows the application of the laws of conservation of mass and energy.
The use of these methods of airflow estimation by heat production aims to validate the data from the anemometer. In open buildings, the airflow rate varies significantly. To calculate, Eq. 2 was used.
where:
ρ - volumetric mass of air inside the installation (kg m-3);
Grav - acceleration of gravity (9.81 m s-2);
47.1 and 29.27 - perfect gas constants for water vapor and dry air, respectively;
Tref - temperature of the critical point of water (273.15 K) (°C);
Ti - internal building temperature (°C);
PVap - partial pressure of water vapor in the air, also known as the mixing ratio (mmHg); and,
Patm - atmospheric pressure (Pa).
The law of ideal gases was used considering the ambient air temperature at the time of gas collection for gas conversion. This is expressed in Eq. 3.
where:
Ci m - equivalent concentrations of C and N in gases (mg m-3), measured at an instant (C-CH4, C-CO2, N-NH3, N-N2O);
Ci v - measured concentration of gas (ppm);
Mm - equivalent molar mass of C and N in the gas being considered (CO2 = 12, CH4 = 12, NH3 = 14, N2O = 28 g mol-1);
Mmol - molar mass of gas (CO2 = 44, CH4 = 16, NH3 = 17, and N2O = 44 (g mol-1)); and,
Vm - molar volume corresponding to the molecular mass of the gas under local temperature and pressure conditions (L mol-1).
Using the observed gas concentration data and the internal and external psychometric characteristics of the air, the gas flow inside the studied building was determined to obtain this productive variable in grams of gas generated by the swine daily as a function of the weight gain of these animals.
Waste and feed samples were collected weekly for physicochemical analyses. Mass balance was performed on the inputs and outputs of the system carbon (C) and nitrogen (N). The entries were calculated based on the amount of N and C retained in the carcasses of the swine that entered the building, as well as the food consumed by the animals, using the equations proposed by CORPEN (2003CORPEN - Comité d’orientation pour des pratiques agricoles respectueuses de l’environnement, 2003. 44p. Available on: <Available on: http://agriculture.gouv.fr >. Accessed on: Feb. 2022.
http://agriculture.gouv.fr...
). The outputs of elements C and N corresponded to those contained in the waste and carcasses of slaughtered animals.
The differences in the masses of C and N were considered as losses of these elements in the form of gases and the measured emissions of C-CH4, C-CO2, N-NH3 and N-N2O, were considered, which represent the amounts of C and N in each gas, respectively.
The experimental design consisted of only one factor that corresponded to the method applied to determine the emission of gases, with two levels: a simplified method and the continuous method. As mentioned earlier, 144 animals were randomly distributed in 12 pens. Moreover, the evaluation time was considered as the number of replicates per treatment. A total of with 36 evaluation times (repetitions) were considered as the four gases as response variables (CO2, CH4, N2O, and NH3).
The results thus obtained were subject to a preliminary analysis through the application of the Microsoft Excel© Software to eliminate the discrepant values and possible errors. To present the results, descriptive statistical analysis was performed to explore the data. Graphical elaboration of the results was performed using SigmaPlot® software. To evaluate the results obtained for the methodologies, the data were submitted to variance analysis using the PROC MIXED procedure of the SAS® statistical package. The comparison between continuous and simplified methodologies was performed using the Tukey’s test for dependent samples, while Pearson’s correlation test and α were used to verify the associations and agreement between parameters. In all cases, the significance level was set at p ≤ 0.05.
Results and Discussion
To produce one kilogram of pork produced under the given conditions, the average GHG and ammonia emissions are 2.2, 0.0002, 0.004 and 0.012 kg of CO2, N2O, CH4 and NH3, respectively. These data were similar to those obtained by Ponchant et al. (2008Ponchant, P.; Hassouna, M.; Ehrlacher, A.; Leleu, C.; Amand, G.; Leleu, C.; Robin, P. Application et validation d’une méthode de mesures simplifiées des émissions gazeuses dans les bâtiments d’élevage á ventilation naturelle. TeMA - Techniques et Marches Avicoles, v.6, p.4-10, 2008. ) and Robin et al. (2013Robin, P.; Amand, G.; Aubert, C.; Babela, N.; Brachet, A.; Berckmans, D.; Burton, C.; Canart, B.; Cellier, P.; Dollé, J. B.; Dong, H. M.; Durif, M.; Ehrlancher, A.; Eren Ozecan, S.; Espagnol, S.; Gautier, F.; Guingand, N.; Guiziou, F.; Hartung, E.; Hassouna, M.; Landrain, P.; Lee, I. M.; Leleu, C.; Li, Y. S.; Liao, X. D.; Loubet, B.; Loyon, L.; Luth; Nicks, B.; Oliveira, P. A. V. de; Ponchant, P.; Powers, W.; Ramonet, Y.; Sommer, S. G.; Thiard, J.; Wang, K. W.; Xin, H.; Youssef, A. Reference procedures for the measurement of gaseous emissions from livestock houses and storages of animal manure. Emissions of Gas and Dust from Livestock, p.355-358, 2013. Available on: <Available on: https://ainfo.cnptia.embrapa.br/digital/bitstream/item/122431/1/final7486.pdf >. Accessed on: Dec. 2021.
https://ainfo.cnptia.embrapa.br/digital/...
).
Several methods are available for determining the GHG emissions in swine farming. These methods include continuous and simplified methods discussed earlier. The advantage of the continuous method is the possibility of better characterization of emissions throughout the seasons, and it serves as a model for comparison with new methods, as it is considered the standard method. However, it has the disadvantage of high cost (Robin et al., 2013Robin, P.; Amand, G.; Aubert, C.; Babela, N.; Brachet, A.; Berckmans, D.; Burton, C.; Canart, B.; Cellier, P.; Dollé, J. B.; Dong, H. M.; Durif, M.; Ehrlancher, A.; Eren Ozecan, S.; Espagnol, S.; Gautier, F.; Guingand, N.; Guiziou, F.; Hartung, E.; Hassouna, M.; Landrain, P.; Lee, I. M.; Leleu, C.; Li, Y. S.; Liao, X. D.; Loubet, B.; Loyon, L.; Luth; Nicks, B.; Oliveira, P. A. V. de; Ponchant, P.; Powers, W.; Ramonet, Y.; Sommer, S. G.; Thiard, J.; Wang, K. W.; Xin, H.; Youssef, A. Reference procedures for the measurement of gaseous emissions from livestock houses and storages of animal manure. Emissions of Gas and Dust from Livestock, p.355-358, 2013. Available on: <Available on: https://ainfo.cnptia.embrapa.br/digital/bitstream/item/122431/1/final7486.pdf >. Accessed on: Dec. 2021.
https://ainfo.cnptia.embrapa.br/digital/...
). The simplified method is more economical and requires less time to obtain the results. Its disadvantages include variable characteristics according to time, climate, food, handling, as well as building characteristics, as most of them have natural ventilation, which makes it difficult to correctly determine the air flow, and consequently, the emission of gases (Guingand et al., 2011Guingand, N.; Lagadec, S.; Robin, P.; Hassouna, M. Mise ao point d`une méthode de mesure simplifée des émissions d`ammoniac et des gaz à effect de serre des bâtiments d`élevage de porcs em engraissement. Jouneés Recherche Porcine, v.43, p.199-203, 2011. ).
During the experiment, the minimum and maximum average values of air temperature, relative air humidity, and air velocity inside and outside the building were 26.8 ± 3.4 and 27 ± 2.5 °C, 70 and 80%, and 0.59 and 0.77 m s-1, respectively. These results indicate that the air temperatures observed were above the comfort range of the animals in the finishing phase, which can affect weight gain and feed conversion, as animals with heat stress spend more time lying down and consume less food. The ideal comfort temperature range for swine in terms of growth and termination rate for animals weighing over 25 kg is between 18 and 24 °C (Philippe & Nicks, 2015Philippe, F. X.; Nicks, B. Review on greenhouse gas emissions from swine houses: Production of carbon dioxide. methane and nitrous oxide by animals and manure. Agriculture, Ecosystems & Environment, v.199, p.10-25, 2015. https://doi.org/10.1016/j.agee.2014.08.015
https://doi.org/10.1016/j.agee.2014.08.0...
). Air temperatures above this range affect the zootechnical indices, such as weight gain and feed conversion; the higher the feed conversion, the lower the excretion, and consequently, the lower the emission of gases (Lima et al., 2022Lima, A. V. de; Medeiros, C. J. de; Pandorfi, H.; Holanda, M. C. R. de; Holanda, M. A. C. de. Desempenho zootécnico de suínos em terminação submetidos a diferentes programas de iluminação em ambientes climatizados. Research Society and Development, v.11, p.1-6, 2022. https://doi.org/10.33448/rsd-v11i3.25699
https://doi.org/10.33448/rsd-v11i3.25699...
).
The data in Table 1 demonstrate the average data of gaseous emissions in (g per swine per day), obtained using simplified and continuous methods. A significant difference (p ≤ 0.05) was observed between these methods for all gases observed. According to Guingand et al. (2011Guingand, N.; Lagadec, S.; Robin, P.; Hassouna, M. Mise ao point d`une méthode de mesure simplifée des émissions d`ammoniac et des gaz à effect de serre des bâtiments d`élevage de porcs em engraissement. Jouneés Recherche Porcine, v.43, p.199-203, 2011. ), the simplified method can be used as a reliable and accurate method for measuring ammonia and greenhouse gases in finishing swine farms. There were differences of up to 80% between the values obtained from these two methods, and the simplified methodology quantified higher values than the continuous methodology for CO2, C-CO2, NH3, and N-NH3, mainly due to the variables of climate, wind, and temperature. These differences were greater than those obtained by Guingand et al. (2011) and Robin et al. (2013Robin, P.; Amand, G.; Aubert, C.; Babela, N.; Brachet, A.; Berckmans, D.; Burton, C.; Canart, B.; Cellier, P.; Dollé, J. B.; Dong, H. M.; Durif, M.; Ehrlancher, A.; Eren Ozecan, S.; Espagnol, S.; Gautier, F.; Guingand, N.; Guiziou, F.; Hartung, E.; Hassouna, M.; Landrain, P.; Lee, I. M.; Leleu, C.; Li, Y. S.; Liao, X. D.; Loubet, B.; Loyon, L.; Luth; Nicks, B.; Oliveira, P. A. V. de; Ponchant, P.; Powers, W.; Ramonet, Y.; Sommer, S. G.; Thiard, J.; Wang, K. W.; Xin, H.; Youssef, A. Reference procedures for the measurement of gaseous emissions from livestock houses and storages of animal manure. Emissions of Gas and Dust from Livestock, p.355-358, 2013. Available on: <Available on: https://ainfo.cnptia.embrapa.br/digital/bitstream/item/122431/1/final7486.pdf >. Accessed on: Dec. 2021.
https://ainfo.cnptia.embrapa.br/digital/...
).
CO2 values are important for calculating the minimum ventilation rates on a farm. The result obtained using the continuous method was 637.0 g per swine per day, which is lower than that obtained by Guingand et al. (2011Guingand, N.; Lagadec, S.; Robin, P.; Hassouna, M. Mise ao point d`une méthode de mesure simplifée des émissions d`ammoniac et des gaz à effect de serre des bâtiments d`élevage de porcs em engraissement. Jouneés Recherche Porcine, v.43, p.199-203, 2011. ), which is 676.0 g per swine per day However, the result obtained by Tavares et al. (2014Tavares, J. M. R.; Belli Filho, P.; Coldebella, A.; Oliveira, P. A. V. O desaparecimento da água e a produção de esterco em granjas comerciais de suinocultura. Livestock Science, v.169, p.146-154, 2014. https://doi.org/10.1016/j.livsci.2014.09.006
https://doi.org/10.1016/j.livsci.2014.09...
) for the same is 456.23 g per swine per day, which is lower than that obtained using the simplified method. However, the difference between the values was lower in this case.
The N-NH3 emission values obtained using the continuous and simplified methods were 4.81 and 11.76 g per swine per day, respectively. These values are higher than that found by Tavares et al. (2014Tavares, J. M. R.; Belli Filho, P.; Coldebella, A.; Oliveira, P. A. V. O desaparecimento da água e a produção de esterco em granjas comerciais de suinocultura. Livestock Science, v.169, p.146-154, 2014. https://doi.org/10.1016/j.livsci.2014.09.006
https://doi.org/10.1016/j.livsci.2014.09...
), which was 3.04 g per swine per day. Whereas the values obtained by Guingand et al. (2011Guingand, N.; Lagadec, S.; Robin, P.; Hassouna, M. Mise ao point d`une méthode de mesure simplifée des émissions d`ammoniac et des gaz à effect de serre des bâtiments d`élevage de porcs em engraissement. Jouneés Recherche Porcine, v.43, p.199-203, 2011. ) for continuous and simplified methods are 8.9 and 10.8 g per swine per day. Compared to our results, these values are higher and lower in the case of continuous and simplified methods, respectively. This difference in the values may be due to the type of building and ventilation used because, in Brazil, most buildings are open and have natural ventilation; whereas in France, buildings are usually closed and with mechanical ventilation. Therefore, the NH3 values can be justified because the farm has natural ventilation. The N-N2O emissions found by Tavares et al. (2014) were 0.24 g per swine per day, which is higher than those obtained using the simplified method and lower than that obtained using the continuous method. It is noteworthy that the obtained values showed less deviation in the case of simplified method than in the case of continuous method.
The values of C-CH4 found by Guingand et al. (2011Guingand, N.; Lagadec, S.; Robin, P.; Hassouna, M. Mise ao point d`une méthode de mesure simplifée des émissions d`ammoniac et des gaz à effect de serre des bâtiments d`élevage de porcs em engraissement. Jouneés Recherche Porcine, v.43, p.199-203, 2011. ) using simplified and continuous methods were 7.4 and 10.1 g per swine per day; compared to the results of this research, these values are higher in the case of simplified method and lower in the case of continuous method. Moreover, both of these are lower than the result obtained by Tavares et al. (2014Tavares, J. M. R.; Belli Filho, P.; Coldebella, A.; Oliveira, P. A. V. O desaparecimento da água e a produção de esterco em granjas comerciais de suinocultura. Livestock Science, v.169, p.146-154, 2014. https://doi.org/10.1016/j.livsci.2014.09.006
https://doi.org/10.1016/j.livsci.2014.09...
), which was 33.69 g per swine per day. C-CH4 emissions were higher when compared to European results, which can be justified by the Brazilian temperature being higher and the experiment taking place in the summer period, with average temperatures ranging from 23.2 to 31.1 °C. Monitoring of gas emissions from swine farming is performed more frequently in Europe and North America. According to the European Environment Agency, swine production represents approximately 25% of emissions among other livestock activities (EEA, 2020EEA. European Environment Agency, 2020. Available on: < Available on: https://www.eea.europa.eu/ >. Accessed on: Ago. 2022.
https://www.eea.europa.eu/...
).
Regarding the values obtained by the two methodologies studied, it is noted that there was a similar arrangement of the data as a function of time.
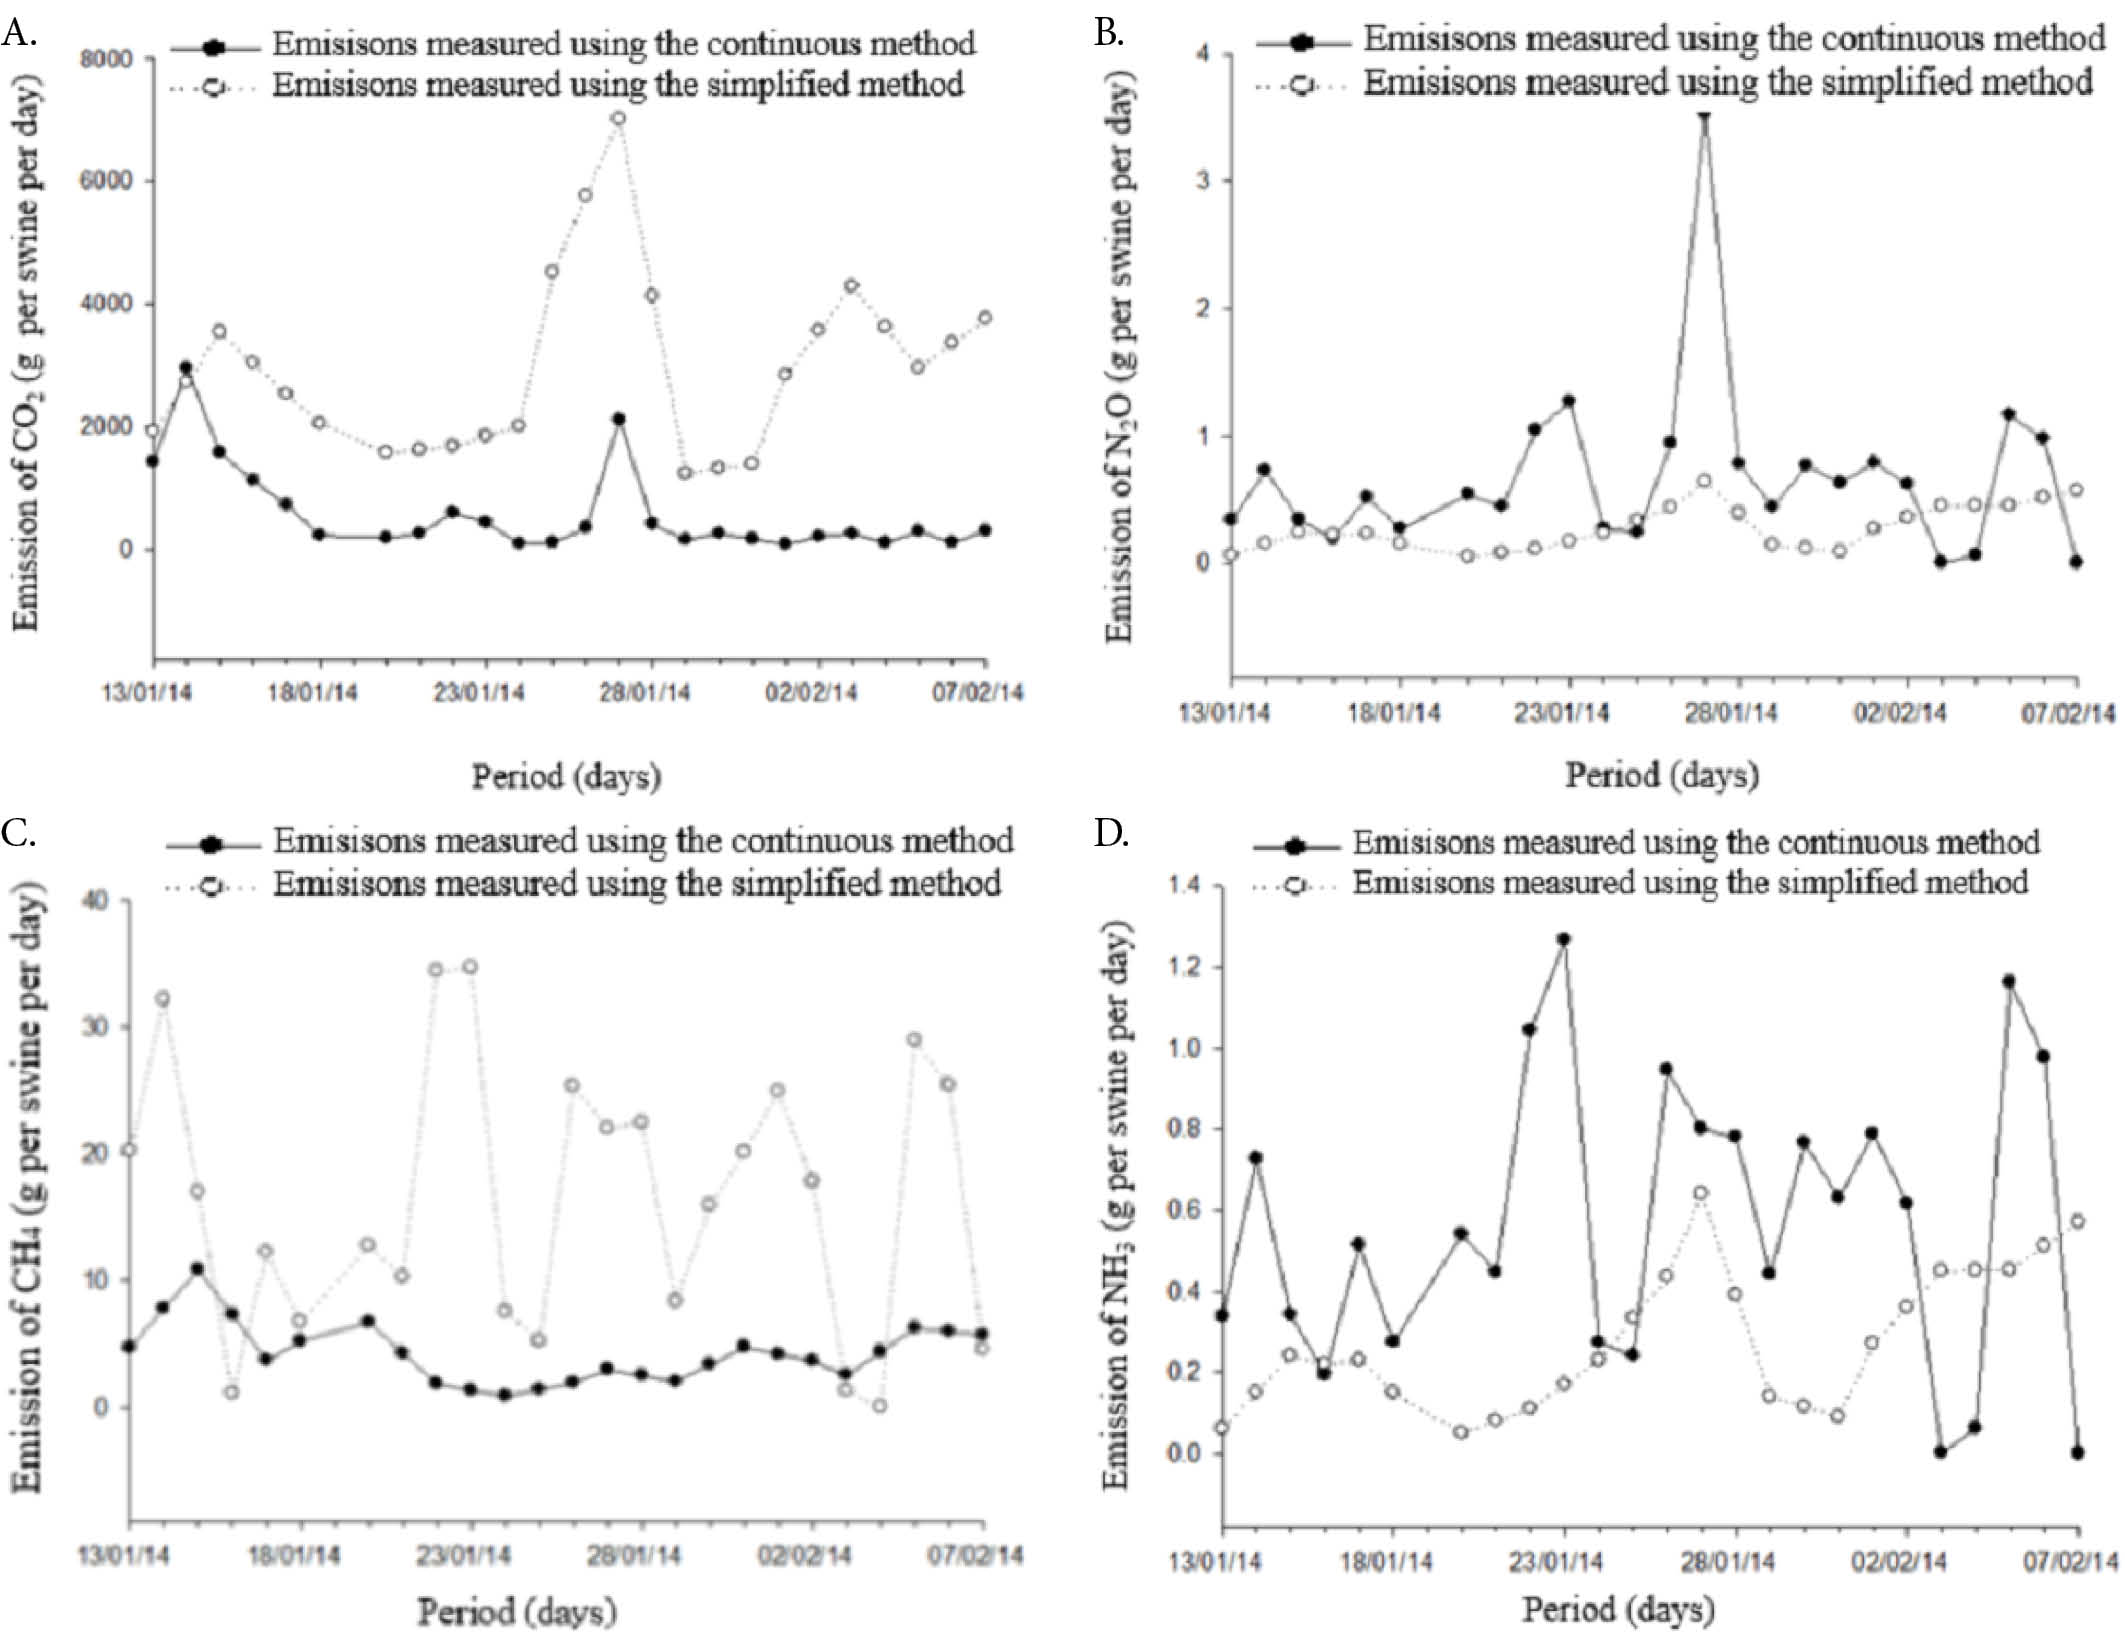
Peak CO2 emissions occurred when the animals were fed (Figure 1A). However, in these periods, it was observed that the animals presented high agitation and competition to obtain food, which caused the activation of metabolism and, which consequently increased the release of CO2 by respiration into the atmosphere. Su et al. (2019Su, B.; Ang, B. W.; Li, Y. Structural path and decomposition analysis of aggregate embodied energy and emission intensities. Energy Economics, v.83, p.345-360, 2019. https://doi.org/10.1016/j.eneco.2022.105875
https://doi.org/10.1016/j.eneco.2022.105...
) conducted a study and found direct relationships on the level of animal activities and CO2 emissions and added that gas emissions have been used to measure environmental pollution from a production viewpoint.

Comparison of gaseous emissions obtained by continuous (MC) and simplified (MS) methods, for (A) carbon dioxide (CO2), (B) nitrous oxide (N2O), methane (CH4) (C) methane (CH4), and (D) ammonia (NH3), during the finishing phase
The differences in N2O (nitrous oxide) emissions were significant between the two methods; however, the percentage difference was between 30 and 50% (Figure 1B). According to Robin et al. (2013Robin, P.; Amand, G.; Aubert, C.; Babela, N.; Brachet, A.; Berckmans, D.; Burton, C.; Canart, B.; Cellier, P.; Dollé, J. B.; Dong, H. M.; Durif, M.; Ehrlancher, A.; Eren Ozecan, S.; Espagnol, S.; Gautier, F.; Guingand, N.; Guiziou, F.; Hartung, E.; Hassouna, M.; Landrain, P.; Lee, I. M.; Leleu, C.; Li, Y. S.; Liao, X. D.; Loubet, B.; Loyon, L.; Luth; Nicks, B.; Oliveira, P. A. V. de; Ponchant, P.; Powers, W.; Ramonet, Y.; Sommer, S. G.; Thiard, J.; Wang, K. W.; Xin, H.; Youssef, A. Reference procedures for the measurement of gaseous emissions from livestock houses and storages of animal manure. Emissions of Gas and Dust from Livestock, p.355-358, 2013. Available on: <Available on: https://ainfo.cnptia.embrapa.br/digital/bitstream/item/122431/1/final7486.pdf >. Accessed on: Dec. 2021.
https://ainfo.cnptia.embrapa.br/digital/...
), the acceptable difference between the methodologies is 30%. Thus, this simplified methodology can replace the continuous quantification of N2O emissions, which showed a peak in gas production. Microbial development is normally a function of the carbon and energy available in a medium, temperature, humidity, and pH, and the interactions between these factors regulate the nitrification activity. Thus, the peak N2O production was observed during feeding periods, and the formation of nitrous oxide occurred during nitrification and denitrification in the manure present on the floor of the pens.
The data in Figure 1 demonstrate the gaseous emissions obtained using the simplified and continuous methods. For N2O (Figure 1B), there was a smaller variation between the data obtained by the two methodologies during the observation period. The mean emission for N2O was 0.30 and 0.67 g per swine per day in the case of simplified and continuous methods, respectively. In systems with slatted floors, nitrous oxide values ranged from 0.17 to 2.26 g per swine per day (Rigolot et al., 2010Rigolot, C.; Espagnol, S.; Robin, P.; Hassouna, M.; Beline, F.; Paillat, J. M.; Dourmad, J. Y. Modelling of manure production by swine and NH3, N2O and CH4 emissions. Part II: effect of animal housing. manure storage and treatment practices. Animal, v.4, p.1413-1424, 2010. https://doi.org/10.1017/S1751731110000509
https://doi.org/10.1017/S175173111000050...
).
For CH4, a significant variation was observed between the values obtained using the continuous method (Figure 1C). There was a significant difference (p ≤ 0.05) between the analyzed methods, and the percentage differences were considerable. The obtained CH4 concentrations indicated that there was a statistical difference (p ≤ 0.05) between the results obtained from different methods, as shown in Table 1.
A high correlation (p ≤ 0.05) was observed between methane and nitrous oxide using the continuous method. This relationship may be a consequence of the organic decomposition present in the waste flow channels. It was observed that there was a large amount of waste accumulated at the site. According to Bernabé et al. (2020Bernabé, J. M. C.; Pandorfi, H.; Gomes, N. F.; Holanda, M. A. C.; Holanda, M. C. R.; Carvalho Filho, J. L. S. Performance of growing swine subjected to lighting programs in climate-controlled environments. Revista Brasileira de Engenharia Agrícola e Ambiental, v.24, p.616-621, 2020. https://doi.org/10.1590/1807-1929/agriambi.v24n9p616-621
https://doi.org/10.1590/1807-1929/agriam...
), even though the animals were housed in pens with forced ventilation and consumed a greater amount of feed, their nutritional content was consumed by their body to dissipate heat and maintain homeothermy, which resulted in a lower weight of the animals. Statistical analysis revealed significant differences (p ≤ 0.05), and the differences in percentage were considerable.
The NH3 concentrations obtained indicate that there is a statistical difference (p ≤ 0.05) between the results obtained from these methods (Figure 1D), with the results of NH3 content measurement performed using the continuous method being higher than those obtained using the simplified method. This occurs because in liquid waste (urine and feces), the nitrogen present in the urine is quickly converted to ammonia nitrogen (Philippe & Nicks, 2015Philippe, F. X.; Nicks, B. Review on greenhouse gas emissions from swine houses: Production of carbon dioxide. methane and nitrous oxide by animals and manure. Agriculture, Ecosystems & Environment, v.199, p.10-25, 2015. https://doi.org/10.1016/j.agee.2014.08.015
https://doi.org/10.1016/j.agee.2014.08.0...
) and, as waste accumulates inside the facility, it is expected that ammonia concentrations are higher than in the external environment. The results obtained for NH3 by Cao et al. (2020Cao, Y.; Bai, Z.; Misselbrook, T.; Wang, X.; Ma, L. Ammonia emissions from different pig production scales and their temporal variations in the North China Plain. Journal of the Air & Waste Management Association, v.71, p.23-33, 2020. https://doi.org/10.1080/10962247.2020.1815895
https://doi.org/10.1080/10962247.2020.18...
) for the summer phase were similar to those obtained in this study.
To verify the possible relationships between the amounts of emitted gases, correlation analysis was performed. The data in Table 2 present the Pearson correlation coefficients (p) between the gas emission values measured using the continuous and simplified methods.
Pearson correlation coefficient between mean emissions of ammonia (NH3), nitrous oxide (N2O), methane (CH4), carbon dioxide (CO2), and water vapor (H2O) during the finishing phase, left: continuous method, and right: simplified method
This result indicates that, in the simplified and continuous methods, ammonia emissions increased with the increase in carbon dioxide emissions (Table 2). A high correlation (p ≤ 0.05) was observed. According to Oliveira et al. (2019Oliveira, Z. B. de; Bottega, E. L.; Oliveira, M. B. de; Silva, C. M. da; Link, T. T. Análise do conforto térmico no estado do Rio Grande do Sul utilizando técnicas geoestatísticas e dados das normais climatológicas. Revista Engenharia na Agricultura, v.27, p.195-203, 2019. https://doi.org/10.13083/reveng.v27i3.935
https://doi.org/10.13083/reveng.v27i3.93...
), this high correlation may occur due to the increased respiratory rate of the animal when exhaling excess ammonia present in the environment.
The data in Table 3 demonstrate the total carbon and nitrogen emissions measured using the continuous and simplified methods compared with the mass balance. The total carbon emissions obtained by the simplified method corresponded to 2.919 kg, referring to the total experimental period, as well as the batch of animals. When compared to the total carbon obtained by mass balance (617.59 kg), a difference of approximately 2% was found, which indicates sufficiently accurate measurement of carbon emissions in swine production systems, and the simplified methodology proved to be more efficient (Ponchant et al., 2008Ponchant, P.; Hassouna, M.; Ehrlacher, A.; Leleu, C.; Amand, G.; Leleu, C.; Robin, P. Application et validation d’une méthode de mesures simplifiées des émissions gazeuses dans les bâtiments d’élevage á ventilation naturelle. TeMA - Techniques et Marches Avicoles, v.6, p.4-10, 2008. ; Robin et al., 2013Robin, P.; Amand, G.; Aubert, C.; Babela, N.; Brachet, A.; Berckmans, D.; Burton, C.; Canart, B.; Cellier, P.; Dollé, J. B.; Dong, H. M.; Durif, M.; Ehrlancher, A.; Eren Ozecan, S.; Espagnol, S.; Gautier, F.; Guingand, N.; Guiziou, F.; Hartung, E.; Hassouna, M.; Landrain, P.; Lee, I. M.; Leleu, C.; Li, Y. S.; Liao, X. D.; Loubet, B.; Loyon, L.; Luth; Nicks, B.; Oliveira, P. A. V. de; Ponchant, P.; Powers, W.; Ramonet, Y.; Sommer, S. G.; Thiard, J.; Wang, K. W.; Xin, H.; Youssef, A. Reference procedures for the measurement of gaseous emissions from livestock houses and storages of animal manure. Emissions of Gas and Dust from Livestock, p.355-358, 2013. Available on: <Available on: https://ainfo.cnptia.embrapa.br/digital/bitstream/item/122431/1/final7486.pdf >. Accessed on: Dec. 2021.
https://ainfo.cnptia.embrapa.br/digital/...
).
The value obtained by the nitrogen mass balance also considers molecular nitrogen (N2). This form of nitrogen goes undetected when using sensors of the INNOVA gas analyzer. According to Ponchant et al. (2008Ponchant, P.; Hassouna, M.; Ehrlacher, A.; Leleu, C.; Amand, G.; Leleu, C.; Robin, P. Application et validation d’une méthode de mesures simplifiées des émissions gazeuses dans les bâtiments d’élevage á ventilation naturelle. TeMA - Techniques et Marches Avicoles, v.6, p.4-10, 2008. ), molecular nitrogen can correspond 30 to 60% of volatilized nitrogen.
The total nitrogen emissions obtained by the simplified method corresponded to 45.72 kg for the breeding period. When compared to the values obtained by mass balance, it was found that the difference was approximately 14%, which is considered acceptable by Ponchant et al. (2008Ponchant, P.; Hassouna, M.; Ehrlacher, A.; Leleu, C.; Amand, G.; Leleu, C.; Robin, P. Application et validation d’une méthode de mesures simplifiées des émissions gazeuses dans les bâtiments d’élevage á ventilation naturelle. TeMA - Techniques et Marches Avicoles, v.6, p.4-10, 2008. ) and Guingand et al. (2011Guingand, N.; Lagadec, S.; Robin, P.; Hassouna, M. Mise ao point d`une méthode de mesure simplifée des émissions d`ammoniac et des gaz à effect de serre des bâtiments d`élevage de porcs em engraissement. Jouneés Recherche Porcine, v.43, p.199-203, 2011. ). The data obtained using the continuous method was found to differ significantly from that of the mass balance method; the differences were greater than 80%, which is above the acceptable limit (Ponchant et al., 2008; Robin et al., 2013Robin, P.; Amand, G.; Aubert, C.; Babela, N.; Brachet, A.; Berckmans, D.; Burton, C.; Canart, B.; Cellier, P.; Dollé, J. B.; Dong, H. M.; Durif, M.; Ehrlancher, A.; Eren Ozecan, S.; Espagnol, S.; Gautier, F.; Guingand, N.; Guiziou, F.; Hartung, E.; Hassouna, M.; Landrain, P.; Lee, I. M.; Leleu, C.; Li, Y. S.; Liao, X. D.; Loubet, B.; Loyon, L.; Luth; Nicks, B.; Oliveira, P. A. V. de; Ponchant, P.; Powers, W.; Ramonet, Y.; Sommer, S. G.; Thiard, J.; Wang, K. W.; Xin, H.; Youssef, A. Reference procedures for the measurement of gaseous emissions from livestock houses and storages of animal manure. Emissions of Gas and Dust from Livestock, p.355-358, 2013. Available on: <Available on: https://ainfo.cnptia.embrapa.br/digital/bitstream/item/122431/1/final7486.pdf >. Accessed on: Dec. 2021.
https://ainfo.cnptia.embrapa.br/digital/...
).
The data in Table 4 show the emissions of CO2, N2O, CH4, and NH3, referring to the production of a swine with an average weight of 115 kg, and the relationship between pork production and gas emissions per kg of carcass.
Statistical analysis revealed significant differences (p ≤ 0.05). As shown in Table 4, it can be noted that production of a swine with an average weight of 115 kg results in average emissions of 252.8, 0.030, 0.413 and 1.3 kg of CO2, N2O, CH4 and NH3, respectively. However, considering the gaseous emission in relation to meat production, it can be said that to produce a kilogram of pork, a certain volume of polluting gases is sent to the atmosphere. Production of one kilogram of pork under these conditions, results in average emissions of 2.2, 0.0002, 0.004, and 0.012 kg of CO2, N2O, CH4, and NH3, respectively. These results are similar to those obtained by Ponchant et al. (2008Ponchant, P.; Hassouna, M.; Ehrlacher, A.; Leleu, C.; Amand, G.; Leleu, C.; Robin, P. Application et validation d’une méthode de mesures simplifiées des émissions gazeuses dans les bâtiments d’élevage á ventilation naturelle. TeMA - Techniques et Marches Avicoles, v.6, p.4-10, 2008. ) and Robin et al. (2013Robin, P.; Amand, G.; Aubert, C.; Babela, N.; Brachet, A.; Berckmans, D.; Burton, C.; Canart, B.; Cellier, P.; Dollé, J. B.; Dong, H. M.; Durif, M.; Ehrlancher, A.; Eren Ozecan, S.; Espagnol, S.; Gautier, F.; Guingand, N.; Guiziou, F.; Hartung, E.; Hassouna, M.; Landrain, P.; Lee, I. M.; Leleu, C.; Li, Y. S.; Liao, X. D.; Loubet, B.; Loyon, L.; Luth; Nicks, B.; Oliveira, P. A. V. de; Ponchant, P.; Powers, W.; Ramonet, Y.; Sommer, S. G.; Thiard, J.; Wang, K. W.; Xin, H.; Youssef, A. Reference procedures for the measurement of gaseous emissions from livestock houses and storages of animal manure. Emissions of Gas and Dust from Livestock, p.355-358, 2013. Available on: <Available on: https://ainfo.cnptia.embrapa.br/digital/bitstream/item/122431/1/final7486.pdf >. Accessed on: Dec. 2021.
https://ainfo.cnptia.embrapa.br/digital/...
).
Conclusions
-
The emission flow obtained using the simplified method in [g per swine h-1] was of 2.689 for carbon dioxide (CO2), 0.30 for nitrous oxide (N2O), 4.39 for methane (CH4), 13.55 for ammonia (NH3), and 3.273 for water vapor, whereas that obtained using the continuous method in [g per swine h-1] was of 574 for CO2, 0.67 for N2O, 19.50 for CH4, 5.84 for NH3, and 7.2 for water vapor.
-
The simplified method developed in this study is more effective for estimating GHG emissions in swine farming systems with natural ventilation compared to the continuous method. Moreover, it was verified based on mass balance.
Acknowledgments
FAPESP for the scholarship, and the EMBRAPA Swine and Poultry unit for the support and granting of the study area.
Literature Cited
- Bernabé, J. M. C.; Pandorfi, H.; Gomes, N. F.; Holanda, M. A. C.; Holanda, M. C. R.; Carvalho Filho, J. L. S. Performance of growing swine subjected to lighting programs in climate-controlled environments. Revista Brasileira de Engenharia Agrícola e Ambiental, v.24, p.616-621, 2020. https://doi.org/10.1590/1807-1929/agriambi.v24n9p616-621
» https://doi.org/10.1590/1807-1929/agriambi.v24n9p616-621 - Cao, Y.; Bai, Z.; Misselbrook, T.; Wang, X.; Ma, L. Ammonia emissions from different pig production scales and their temporal variations in the North China Plain. Journal of the Air & Waste Management Association, v.71, p.23-33, 2020. https://doi.org/10.1080/10962247.2020.1815895
» https://doi.org/10.1080/10962247.2020.1815895 - CORPEN - Comité d’orientation pour des pratiques agricoles respectueuses de l’environnement, 2003. 44p. Available on: <Available on: http://agriculture.gouv.fr >. Accessed on: Feb. 2022.
» http://agriculture.gouv.fr - Dortzbach, D.; Vieira, V. F.; Trabaquini, K.; Blainski, E.; Fronza, E.; Loss, A. Estimativa das emissões de gases de efeito estufa do setor agropecuário de Santa Catarina, Brasil. Agroindustrial Science, v.11, p.305-313, 2021. https://doi.org/10.17268/agroind.sci.2021.03.08
» https://doi.org/10.17268/agroind.sci.2021.03.08 - EEA. European Environment Agency, 2020. Available on: < Available on: https://www.eea.europa.eu/ >. Accessed on: Ago. 2022.
» https://www.eea.europa.eu/ - Gelinski Neto, F.; Gelinski, C.; Gelinski Júnior, E. A contribuição catarinense para a redução de gases de efeito estufa: Lei do Biogás. Revista Catarinense de Economia, v.3, p.56-73, 2019. https://doi.org/10.54805/RCE.2527-1180.v3.n1.60
» https://doi.org/10.54805/RCE.2527-1180.v3.n1.60 - Guingand, N.; Lagadec, S.; Robin, P.; Hassouna, M. Mise ao point d`une méthode de mesure simplifée des émissions d`ammoniac et des gaz à effect de serre des bâtiments d`élevage de porcs em engraissement. Jouneés Recherche Porcine, v.43, p.199-203, 2011.
- Haeussermann, A.; Costa, A.; Aerts, J. M.; Hartung, E.; Jungbluth, T.; Guarino, M.; Berckmans, D. Development of a dynamic model to predict PM10 emissions from swine houses. Journal of Environmental Quality, v.37, p.557-564, 2008. https://doi.org/10.2134/jeq2006.0416
» https://doi.org/10.2134/jeq2006.0416 - Lima, A. V. de; Medeiros, C. J. de; Pandorfi, H.; Holanda, M. C. R. de; Holanda, M. A. C. de. Desempenho zootécnico de suínos em terminação submetidos a diferentes programas de iluminação em ambientes climatizados. Research Society and Development, v.11, p.1-6, 2022. https://doi.org/10.33448/rsd-v11i3.25699
» https://doi.org/10.33448/rsd-v11i3.25699 - Oliveira, Z. B. de; Bottega, E. L.; Oliveira, M. B. de; Silva, C. M. da; Link, T. T. Análise do conforto térmico no estado do Rio Grande do Sul utilizando técnicas geoestatísticas e dados das normais climatológicas. Revista Engenharia na Agricultura, v.27, p.195-203, 2019. https://doi.org/10.13083/reveng.v27i3.935
» https://doi.org/10.13083/reveng.v27i3.935 - Philippe, F. X.; Nicks, B. Review on greenhouse gas emissions from swine houses: Production of carbon dioxide. methane and nitrous oxide by animals and manure. Agriculture, Ecosystems & Environment, v.199, p.10-25, 2015. https://doi.org/10.1016/j.agee.2014.08.015
» https://doi.org/10.1016/j.agee.2014.08.015 - Ponchant, P.; Hassouna, M.; Ehrlacher, A.; Leleu, C.; Amand, G.; Leleu, C.; Robin, P. Application et validation d’une méthode de mesures simplifiées des émissions gazeuses dans les bâtiments d’élevage á ventilation naturelle. TeMA - Techniques et Marches Avicoles, v.6, p.4-10, 2008.
- Rigolot, C.; Espagnol, S.; Robin, P.; Hassouna, M.; Beline, F.; Paillat, J. M.; Dourmad, J. Y. Modelling of manure production by swine and NH3, N2O and CH4 emissions. Part II: effect of animal housing. manure storage and treatment practices. Animal, v.4, p.1413-1424, 2010. https://doi.org/10.1017/S1751731110000509
» https://doi.org/10.1017/S1751731110000509 - Robin, P.; Amand, G.; Aubert, C.; Babela, N.; Brachet, A.; Berckmans, D.; Burton, C.; Canart, B.; Cellier, P.; Dollé, J. B.; Dong, H. M.; Durif, M.; Ehrlancher, A.; Eren Ozecan, S.; Espagnol, S.; Gautier, F.; Guingand, N.; Guiziou, F.; Hartung, E.; Hassouna, M.; Landrain, P.; Lee, I. M.; Leleu, C.; Li, Y. S.; Liao, X. D.; Loubet, B.; Loyon, L.; Luth; Nicks, B.; Oliveira, P. A. V. de; Ponchant, P.; Powers, W.; Ramonet, Y.; Sommer, S. G.; Thiard, J.; Wang, K. W.; Xin, H.; Youssef, A. Reference procedures for the measurement of gaseous emissions from livestock houses and storages of animal manure. Emissions of Gas and Dust from Livestock, p.355-358, 2013. Available on: <Available on: https://ainfo.cnptia.embrapa.br/digital/bitstream/item/122431/1/final7486.pdf >. Accessed on: Dec. 2021.
» https://ainfo.cnptia.embrapa.br/digital/bitstream/item/122431/1/final7486.pdf - Samer, M.; Ammon, C.; Loebsin, C.; Fiedler, M.; Berg, W.; Sanftleben, P.; Brunsch, R. Moisture balance and tracer gas technique for ventilation rates measurement and greenhouse gases and ammonia emissions quantification in naturally ventilated buildings. Building and Environment, v.50, p.10-20, 2012. https://doi.org/10.1016/j.buildenv.2011.10.008
» https://doi.org/10.1016/j.buildenv.2011.10.008 - Su, B.; Ang, B. W.; Li, Y. Structural path and decomposition analysis of aggregate embodied energy and emission intensities. Energy Economics, v.83, p.345-360, 2019. https://doi.org/10.1016/j.eneco.2022.105875
» https://doi.org/10.1016/j.eneco.2022.105875 - Tavares, J. M. R.; Belli Filho, P.; Coldebella, A.; Oliveira, P. A. V. O desaparecimento da água e a produção de esterco em granjas comerciais de suinocultura. Livestock Science, v.169, p.146-154, 2014. https://doi.org/10.1016/j.livsci.2014.09.006
» https://doi.org/10.1016/j.livsci.2014.09.006
-
1 Research developed at EMBRAPA Suínos e Aves, Concórdia, SC, Brazil
Edited by
Publication Dates
-
Publication in this collection
21 Nov 2022 -
Date of issue
Mar 2023
History
-
Received
18 May 2022 -
Accepted
01 Oct 2022 -
Published
19 Oct 2022