Abstract
This work aimed to subsidize experimental planning for the evaluation of phenotypic characters in banana. The experiment consisted of a uniformity trial with Tropical cultivar spaced of 3 m x 2 m, in a useful area with nine rows of 40 plants. Vegetative and yield aspects were evaluated in two production cycles. Plants and basic units (UB) were combined to form various plot sizes, from which the variation coefficient and the soil heterogeneity index were estimated. To define the experimental design, the Hatheway method was used. Variability, resulting from the soil anisotropy and other factors such as desuckering cultural practice increases between mother plant and daughter plant cycles, with effects on experimental design. The variation coefficient and number of replicates are the factors that most influenced the experimental design. For the same precision level required, the combination that maximizes efficient in the use of experimental area can be adopted, that is, smaller plot size and higher number of replicates or larger plot size and fewer replicates. Estimates of plot size and number of replicates are subsides for the design of experiments for the evaluation of phenotypic descriptors in banana.
Index terms
plot size; experimental precision; Musa spp.; agricultural characters
Resumo
Objetivou-se com o presente trabalho subsidiar o planejamento de experimentos para avaliação de caracteres fenotípicos em bananeira. Consistiu em ensaio de uniformidade com a cultivar Tropical, no espaçamento de 3 m x 2 m, área útil com nove fileiras de 40 plantas. Avaliaram-se caracteres vegetativos e de rendimentos em dois ciclos de produção. As plantas, unidades básicas (ub), foram combinadas para formar diferentes tamanhos de parcelas, a partir dos quais se calcularam o coeficiente de variação e o índice de heterogeneidade do solo. Para definição do plano experimental, utilizou-se a metodologia de Hatheway. A variabilidade, resultante da anisotropia do solo e da prática cultural o desbaste aumenta entre os ciclos da planta-mãe e da filha, com reflexos no planejamento experimental. O coeficiente de variação e o número de repetições são os fatores que mais influenciam no planejamento experimental. Para um mesmo nível de precisão requerido, pode-se adotar a combinação que maximize a eficiência de uso da área experimental, parcelas menores e maior número de repetições ou parcelas maiores e menor número de repetições. As estimativas de tamanho de parcela e do número de repetições apresentadas constituem subsídio para planejamento de experimentos de avaliação de descritores fenotípicos em bananeira.
Termos para indexação
tamanho de parcela; precisão experimental; Musa spp.; caracteres agronômicos
Introduction
The low genetic variability of an agricultural crop poses an imminent risk, either due to the lack of new cultivars or to its decimation by pests, as occurred with export Latin American banana farming based solely on Gros Michel cultivar susceptible to Panama disease (PLOETZ, 2015 PLOETZ, R. C. Fusarium wilt of banana. The American Phytopathological Society, St Paul, v.105, n.12, p.1512-1521, 2015. ). Currently, the same banana crop experiences similar risk, because it is based only on the Cavendish subgroup (SILVA et al., 2016 SILVA, M.J.R.; JESUS, P.R.R.; ANJOS, J.M.C.; MACHADO, M.; RIBEIRO, V.G.R. Caracterização agronômica e pós-colheita das bananeiras 'Maravilha' e 'Preciosa' no Submédio do Vale São Francisco. Revista Ceres, Viçosa, MG, v.63, p.46-53, 2016. ; PLOETZ, 2015 PLOETZ, R. C. Fusarium wilt of banana. The American Phytopathological Society, St Paul, v.105, n.12, p.1512-1521, 2015. ).
In Brazil, despite the greater diversity of cultivars in use such as ‘Prata’, ‘Nanica’, ‘Maçã’ and ‘Terra’ (LÉDO et al., 2018 LÉDO, A.S.; SILVA, T.N.; MARTINS, C.R.; SILVA, A.V.C.; LÉDO, C.A.S.; AMORIM, E.P. Caracterização físico-química de frutos de bananeira por procedimentos uni e multivariados. Bioscience Journal, Uberlândia, v.34, n.1, p.24-33, 2018. ), a similar fact occurs to Maçã and Prata-Anã cultivars due to their susceptibility to Panama disease.
As a result, several genetic breeding programs of banana trees emerged (MARTIN et al., 2016 MARTIN, G.; BAURENS, F.C.; DROC, G.; ROUARD, M.; CENCI, A.; KILIAN, A.; HASTIE, A.; DOLEŽEL, J.; AURY, J.J.M.; ALBERTI, A.; CARREEL, F.; D’HONT, A. Improvement of the banana “Musa acuminata” reference sequence using NGS data and semi-automated bioinformatics methods. BMC GENOMICS, London, v.1, n.1, p.2-12, 2016. ), among them, the Brazilian Program of Genetic Breeding of Banana Tree, coordinated by Embrapa Cassava and Fruits in 1976, directed to the development of Prata and Maçã cultivars, which studies the behavior of banana trees resistant to the main crop diseases (WEBER et al., 2017 WEBER, O.B.; GARRUTI, D.S.; NORÕES, N.P.; SILVA, S.O. Performance of banana genotypes with resistance to black leaf streak disease in Northeastern Brazil. Pesquisa Agropecuária Brasileira, Brasília, DF, v.52, n.3, p.161-169, 2017. ).
As a result of this program, different cultivars were made available to farmers (WEBER et al., 2017 WEBER, O.B.; GARRUTI, D.S.; NORÕES, N.P.; SILVA, S.O. Performance of banana genotypes with resistance to black leaf streak disease in Northeastern Brazil. Pesquisa Agropecuária Brasileira, Brasília, DF, v.52, n.3, p.161-169, 2017. ; CASTRICINI et al., 2017 CASTRICINI, A.; DIAS, M.S.C.; RODRIGUES, M.G.V.; OLIVEIRA, P.M. Quality of organic banana produced in the semiarid region of Minas Gerais, Brazil. Revista Brasileira de Fruticultura, Jaboticabal, v.39, n.2, p.1-7, 2017. ).
Despite the advances obtained, the function of the genetic breeding must be continuous in the reach of the varietal ideotype, and for that, the final stage of evaluation of cultivars in field experiments demands precision (MATEI et al., 2017 MATEI, G.; BENIN, G.; STORCK, L.; MILIOLI, A.S.; BOZI, A.H.; DALLÓ, S.C.; LUCION, R.A. Methods of analysis and number of replicates for trials with large numbers of soybean genotypes. Ciência Rural, Santa Maria, v.47, n.4, p.1-77, 2017. ). In this stage, expressive phenotypic characters are usually evaluated for the identification and selection of superior individuals and according to Martin et al. (2016) MARTIN, G.; BAURENS, F.C.; DROC, G.; ROUARD, M.; CENCI, A.; KILIAN, A.; HASTIE, A.; DOLEŽEL, J.; AURY, J.J.M.; ALBERTI, A.; CARREEL, F.; D’HONT, A. Improvement of the banana “Musa acuminata” reference sequence using NGS data and semi-automated bioinformatics methods. BMC GENOMICS, London, v.1, n.1, p.2-12, 2016. , subject to both natural and artificial selection, in addition to suffering great environmental influence.
Improved germplasm tests (JIAA et al., 2017 JIAA, J.; LIA, H.; ZHANGA, X.; LIB, Z.; QIUA, L. Genomics-based plant germplasm research (GPGR). The Crop Journal, Amsterdam, v.5, n.2, p.166-174, 2017. ) and / or agronomic practices to increase productivity (MELO et al., 2016 MELO, D.M.; COELHO, E.F.; BORGES, A.L.; PEREIRA, B.L.S.; CAMPOS, M.S. Agronomic performance and soil chemical attributes in a banana tree orchard fertigated with humic substances. Pesquisa Agropecuária Tropical, Goiânia, v.46, n.4, p.421-428, 2016. ) require accuracy and precision (ORTIZ, 1995 ORTIZ, R. Plot techniques for assessment of bunch weight in banana trials under two systems of crop management. Agronomy Journal, Madison, v.87, n.1, p.63-69, 1995. ; SRIPATHI et al., 2017 SRIPATHI, R.; CONAGHAN, P.; GROGAN D.; CASLER, M.D. Field design factors affecting the precision of ryegrass forage yield estimation. American Society of Agronomy, New Brunswick, v.109, n.3, p.858-869, 2017. ), and regardless of objectives, they try to detect significant differences among treatments. This is of increasingly importance, as technological advances make the identification of these differences difficult, in addition to the fierce dispute over resources and experimental areas. Therefore, estimates of size and shape of experimental units and number of replicates involving specific combinations of sites, cultures, evaluated characteristics and methods are determinant for improving experimental accuracy in order to ensure extrapolation of results. The reliability of these extrapolations is limited to the similarities of experimental conditions.
Cargnelutti Filho et al. (2014) CARGNELUTTI FILHO, A.; TOEBE, M.; BURIN, C.; CASAROTTO, G.; ALVES, B.M. Planejamentos experimentais em nabo forrageiro semeado a lanço e em linha. Bioscience Journal, Uberlândia, v.30, n.3, p.677-686, 2014. , Schmildt et al. (2016) SCHMILDT, E.R.; SCHMILDT, O.; CRUZ, C.D.; CATTANEO, L.F.; FERREGUETTI, G.A. Optimum plot size and number of replications in papaya field experiment. Revista Brasileira de Fruticultura, Jaboticabal, v.38, n.2, p 1-9, 2016. , Souza et al. (2016) SOUSA, R.P.; SILVA, P.S.L.; ASSIS, J.P. Tamanho e forma de parcelas para experimentos com girassol. Revista Ciência Agronômica, Fortaleza, v.47, n.4, p.683-690, 2016. and Lavezo et al. (2017) LAVEZO, A.; CARGNELUTTI FILHO, A.; BEM, C.M.D.; BURIN, C.; KLEINPAUL, J.A.; PEZZINI, R.V. Plot size and number of replications to evaluate the grain yield in oat cultivars. Bragantia, Campinas, v. 76, n. 4, p.512-520, 2017. used the Hatheway method (1961) HATHEWAY, W.H. Convenient plot size. Agronomy Journal, Madison, v.53, n.4, p.279-280, 1961. and found that the use of smaller plots with greater number of replicates results in greater experimental precision and area use efficiency.
These results reflect the significant effect of the greater number of replicates on experimental precision, classic in literature. It turns out that the adoption of this relationship in order to minimize the experimental error, in some cases, depending on the number of treatments, plot design and size, can lead to experiments of impractical sizes.
Schwertner et al. (2015) SCHWERTNER, D.V.; LÚCIO, A.D.; CARGNELUTTI FILHO, A. Uniformity trial size in estimates of plot size in restrict áreas. Revista Ciência Agronômica, Fortaleza, v.46, n.3, p.597-606, 2015. argued that for the intensive use of experimental areas, it is important to plan smaller and more efficient experiments regarding accuracy and costs.
For statistical purposes, it is important to increase precision and experimental accuracy in order to obtain results that allow detecting significant differences among tested treatments (CARGNELUTTI FILHO et al., 2014 CARGNELUTTI FILHO, A.; TOEBE, M.; BURIN, C.; CASAROTTO, G.; ALVES, B.M. Planejamentos experimentais em nabo forrageiro semeado a lanço e em linha. Bioscience Journal, Uberlândia, v.30, n.3, p.677-686, 2014. ).
Additionally, for the researcher in experiments planned within statistical principles, the maximum extraction of useful information from the system under study is relevant.
In this sense, alternatives are: to increase the number of experimental plots due to the increase in the number of repetitions and / or inclusion of treatments; increase the plot size; refinement of the experimental technique and use of less variable experimental material. In this way, this work aimed to determine the combinations in the experimental planning to optimize the area use with precision required to subsidize the planning of experiments of evaluation of phenotypic characteristics in banana.
Material and methods
The experiment was conducted between September 2004 and September 2006 in a typical Dystrophic Red- Yellow Latosol of medium texture, hypoxerophilic caatinga phase, smooth to undulating relief in the experimental area of the Federal Institute of Bahia - Campus of Guanambi, municipality of Guanambi, southwestern state of Bahia. The local latitude is 14°13’30’’ S and longitude 42°46’53’’W and 525 m a.s.l, with average annual rainfall 680 mm and average temperature of 26°C.
The experiment consisted of a uniformity trial with Tropical cultivar (YB42-21), tetraploid hybrid (AAAB), derived from Yangambi number 02, generated by Embrapa Cassava and Fruits (DONATO et al., 2008 DONATO, S.L.R.; SIQUEIRA, D.L.; SILVA, S.O.; CECON, P.R.; SILVA, J.A.; SALOMÃO, L.C.C. Estimativas de tamanho de parcelas para avaliação de descritores fenotípicos em bananeira. Pesquisa Agropecuária Brasileira, Brasília, DF, v.43, n.8, p.957-969, 2008. ).
The experimental area consisted of nine rows of 40 plants each, spaced 3 m x 2 m, totaling 360 plants and 2,160 m².
Micropropagated seedlings of 20 cm in height were used in the experiment, provided by Embrapa Cassava and Fruits, multiplied by the Center of Biotechnology of Cruz das Almas, BA, acclimatized in tubes and transported to the experimental site packed in a roll-type package, where they were directly transplanted in the field.
The implementation and cultural and phytosanitary treatments adopted in the crop were based on technical recommendations (RODRIGUES et al., 2015 RODRIGUES, M.G.V.; DONATO, S.L.R.; LICHTEMBERG, L.A.; DIAS, M.S.C. Implantação e manejo do bananal. Informe Agropecuário. Belo Horizonte, v.36, n.288, p.27-44, 2015. ) and fertilizations in soil and leaf analyses according to Silva (2015) SILVA, J.T.A. da. Solo, adubação e nutrição para bananeira. Informe Agropecuário, Belo Horizonte, v.36, n.288, p.74-83, 2015. . New soil and leaf analyses were carried out at the time of flowering to monitor the nutritional status of plants and fertilization reorientation (SILVA, 2015 SILVA, J.T.A. da. Solo, adubação e nutrição para bananeira. Informe Agropecuário, Belo Horizonte, v.36, n.288, p.74-83, 2015. ).
In the evaluations of all the phenotypic descriptors performed in the first and second production cycles, each plant was properly identified in the row and column as a basic unit (bu) with area of 6 m², making up 360 basic units. Basic units were grouped into 23 distinct ways considering only the clusters that originated plot size capable of using 100% of the experimental area.
Evaluations were carried out during phases of flowering and harvesting of bunches in the production cycles of the mother plant and daughter plant. Vegetative phenotypic descriptors (plant height corresponding to the pseudostem length, pseudostem perimeter, number of live leaves at flowering and number emitted suckers) and yield (bunch mass, number of hands, fruit length and diameter) .
The soil heterogeneity index (b) of Smith (1938) SMITH, H.F. An empirical law describing heterogeneity in the yields of agricultural crops. Journal of Agricultural Science, Cambridge, v.28, n.1, p.1-23, 1938. was determined. For the calculation of the b index and the variation coefficient, the evaluated characteristics of adjacent basic units were combined to form different plot types. The calculations of variation coefficients, variances and other determinations necessary for the estimation of the experimental planning parameters were performed with routines developed by the author in spreadsheet-type computational tool, Microsoft Excel format (DONATO et al., 2008 DONATO, S.L.R.; SIQUEIRA, D.L.; SILVA, S.O.; CECON, P.R.; SILVA, J.A.; SALOMÃO, L.C.C. Estimativas de tamanho de parcelas para avaliação de descritores fenotípicos em bananeira. Pesquisa Agropecuária Brasileira, Brasília, DF, v.43, n.8, p.957-969, 2008. ).
The soil heterogeneity index is based on an empirical relationship between the plot size and its variance, establishing a negative relation between them.
The procedure adopted to estimate this index was the adjustment of a linear regression equation between the logarithm of the variance of each characteristic evaluated in the two banana production cycles for each preestablished plot size and the logarithm of the respective plot size, expressed in basic units,
obtained the linearization of the Smith’s equation (1938) SMITH, H.F. An empirical law describing heterogeneity in the yields of agricultural crops. Journal of Agricultural Science, Cambridge, v.28, n.1, p.1-23, 1938. ,where: Vx is the variance among plots of x basic units; V1 is the variance among parcels of size equal to one basic unit; b is the soil heterogeneity index, is the angular coefficient of the regression equation (regression coefficient); and x is the plot size in basic units.To estimate the plot sizes and define the experimental plan, the Hatheway method (1961) HATHEWAY, W.H. Convenient plot size. Agronomy Journal, Madison, v.53, n.4, p.279-280, 1961. was used, similarly to Souza et al. (2016) SOUSA, R.P.; SILVA, P.S.L.; ASSIS, J.P. Tamanho e forma de parcelas para experimentos com girassol. Revista Ciência Agronômica, Fortaleza, v.47, n.4, p.683-690, 2016. . For the use of the Hatheway method (1961) HATHEWAY, W.H. Convenient plot size. Agronomy Journal, Madison, v.53, n.4, p.279-280, 1961. , Smith’s “b” index (1938) SMITH, H.F. An empirical law describing heterogeneity in the yields of agricultural crops. Journal of Agricultural Science, Cambridge, v.28, n.1, p.1-23, 1938. and the variation coefficient for each variable evaluated in both banana production cycles were previously estimated. The other conditions were pre-defined for experiments designed in randomized blocks. Precision levels α1 = 5.0% and α2 = 2 (1- P) with P = 0.80 (80% probability) were adopted for four, five and six replicates, 5, 10, 15 and 20 treatments, and differences to be detected among treatment averages, d, equal to 10, 15, 20 and 25%.
From the above conditions, the following formula was used:
where: X, plot size for a given number of basic units; VC², square of the variation coefficient (%) of plots of a basic size unit; b, Smith’s heterogeneity coefficient or index; t1, critical value of the Student distribution at α1 probability level; t2, critical value of the Student distribution at α2 = 2 (1-P) probability level, where P is the selected probability of obtaining a significant result; r, number of replicates; d, difference to be detected measured as a percentage of the mean.
The Hatheway equation (1961) HATHEWAY, W.H. Convenient plot size. Agronomy Journal, Madison, v.53, n.4, p.279-280, 1961. was also used to estimate the detectable difference among treatment averages (d),
.The estimation of the true detectable difference among treatment averages by this method consisted in using the variation coefficient and the “b” index determined for each variable evaluated in both banana production cycles for plot sizes varying from 1 to 24 basic units (6 to 144 m²), sizes considered practical (DONATO et al., 2008 DONATO, S.L.R.; SIQUEIRA, D.L.; SILVA, S.O.; CECON, P.R.; SILVA, J.A.; SALOMÃO, L.C.C. Estimativas de tamanho de parcelas para avaliação de descritores fenotípicos em bananeira. Pesquisa Agropecuária Brasileira, Brasília, DF, v.43, n.8, p.957-969, 2008. ) for randomized block experiments with 10 treatments and 3, 4 and 5 replicates and precision levels used to estimate plot size by the Hatheway method (1961) HATHEWAY, W.H. Convenient plot size. Agronomy Journal, Madison, v.53, n.4, p.279-280, 1961. , added of (d) level of 5%.
In addition, graphical representations of the values of d estimates were carried out in order to translate relevant information on the relationships between plot size, experimental precision and number of replicates, expressed by the efficiency in the use of the experimental area, similarly to Sousa et al. (2016) SOUSA, R.P.; SILVA, P.S.L.; ASSIS, J.P. Tamanho e forma de parcelas para experimentos com girassol. Revista Ciência Agronômica, Fortaleza, v.47, n.4, p.683-690, 2016. .
Results and discussion
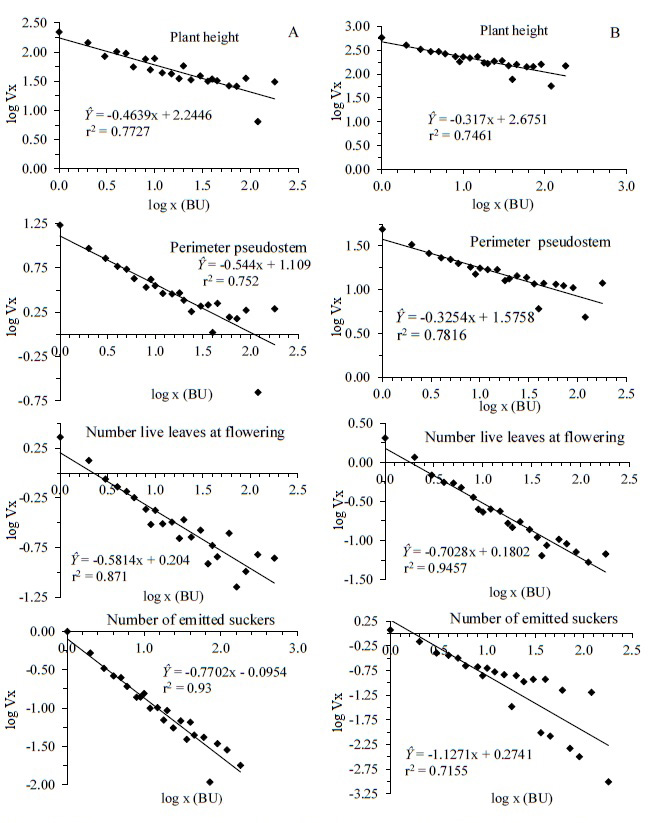
The soil heterogeneity index values (b) of vegetative characteristics evaluated in both production cycles ranged from 0.31 for plant height to 0.70 for number of live leaves at flowering, both in the second cycle Figure 3, intermediate variability (0.30 < b ≤ 0.70). Exception occurred for number emitted suckers, with values above this range, 0.77 (Figure 1A) and 1.12 (Figure 1B), for first and second cycles, respectively, demonstrating high variability and no correlation among adjacent units.
For yield characteristics evaluated in the first cycle, the b index values were higher than 0.70 (Figure 2A), demonstrating high variability (little correlation among adjacent units). In the second cycle (Figure 2B), the b index values for bunch mass and fruit diameter and for number of hands and fruit length were lower and higher than 0.70, respectively. The soil heterogeneity index in this work varied with the evaluated characteristic and with the production cycle.
Cargnelutti Filho et al. (2016) CARGNELUTTI FILHO, A.; ALVES, B.M.; TOEBE, M.; FACCO, G. Tamanhos de unidades experimentais básicas e de parcelas em tremoço branco. Ciência Rural, Santa Maria, v.46, n.4, p.610-618, 2016. concluded that for high soil heterogeneity index and / or genetic variability values, it is recommended, for a given fixed area, to use larger plots and fewer replicates than smaller plots and greater number of replicates. According to the same authors, it is accepted in literature that if b ≤ 0.2, increment in replicates is more effective to improve experimental precision. If b ≥ 0.7, increase in plot size is more effective for precision gains. If 0.2 < b < 0.7 changes in plot size and repetitions concurrently increase experimental accuracy.
Although the b index is considered a measure of soil heterogeneity, it is indirectly estimated based on crop production, assuming that its variability reflects soil behavior (CARGNELUTTI FILHO et al., 2014 CARGNELUTTI FILHO, A.; TOEBE, M.; BURIN, C.; CASAROTTO, G.; ALVES, B.M. Planejamentos experimentais em nabo forrageiro semeado a lanço e em linha. Bioscience Journal, Uberlândia, v.30, n.3, p.677-686, 2014. ). This may be questionable, since the variability inherent of the crop itself is also an important source of error in the productivity of plots, particularly in cross-fertilization plants, and may significantly contribute to the b index value.
In autogamous crops, and more markedly, in asexual propagation plants such as banana, genetic variability is minimal, although somaclonal variation at high level may occur (LOPES et al., 2014 LOPES, O.P.; MAIA, V.M.; XAVIER, A.A.; COSTA, M.R.; RODRIGUES, M.G.V. Diversidade genética, crescimento e produção de genótipos de bananeira ‘prata-anã’ em área com mal do panamá. Revista Brasileira de Fruticultura, Jaboticabal, v.36, n.4, p.924-939, 2014. ), probably due to mitotic instability and / or mutation (GUAPACHA et al., 2017 GUAPACHA, S.E.; SALAZAR, M.S.; AGUILLÓN, J.; Y LANDÁZURI, P. Similaridad cariotípica entre diversas variedades de musa spp del Quindío-Colombia. Cultivos Tropicales, San José de lãs Lajas, v.38, n.4, p.119-126, 2017. ), which are not exclusive to tissue culture, but also observed in the field, but at lower frequencies. In this work, index b is a consequence of soil anisotropy and other factors affecting the degree of experimental heterogeneity, such as errors from planting techniques, cultural practices, harvesting and measurements, as well as interferences and variations of climatic factors. This argument is evidenced by the higher b index values recorded for the characteristic number emitted suckers, which reflects the desuckering cultural practice, particularly in the second cycle, more subject to management conditions (DONATO et al., 2008 DONATO, S.L.R.; SIQUEIRA, D.L.; SILVA, S.O.; CECON, P.R.; SILVA, J.A.; SALOMÃO, L.C.C. Estimativas de tamanho de parcelas para avaliação de descritores fenotípicos em bananeira. Pesquisa Agropecuária Brasileira, Brasília, DF, v.43, n.8, p.957-969, 2008. ).
The b index values usually range from 0 to 1, being possible the occurrence of estimates above the unit (SOUSA et al., 2016 SOUSA, R.P.; SILVA, P.S.L.; ASSIS, J.P. Tamanho e forma de parcelas para experimentos com girassol. Revista Ciência Agronômica, Fortaleza, v.47, n.4, p.683-690, 2016. ), which is a fact for the characteristic number emitted suckers in the second production cycle (Figure 1B) (b = 1.1271) and in Ortiz’s studies (1995) ORTIZ, R. Plot techniques for assessment of bunch weight in banana trials under two systems of crop management. Agronomy Journal, Madison, v.87, n.1, p.63-69, 1995. for bunch mass in a consorted banana tree (b = 1.0513), which is justified because, according to Bakke (1988) BAKKE, O.A. Tamanho e forma ótimos de parcelas em delineamento experimentais. 1988. 142f. Dissertação (Mestrado em Estatística e Experimentação Agronômica) – Escola Superior de Agricultura Luiz de Queiroz, Universidade de São Paulo, Piracicaba, 1988. , the method for estimating the b index and the correlation coefficient r admits value higher than the unit and negative, respectively, since theoretically, 0 < b < +∞ and -1 < r < +1.
The Hatheway method (1961) HATHEWAY, W.H. Convenient plot size. Agronomy Journal, Madison, v.53, n.4, p.279-280, 1961. is suitable for experimental planning, since it allows verifying the ideal combination between treatments, repetitions and plot size capable of minimizing the experimental area with the required precision. This can be seen in Figures 3 and 4 for vegetative and yield characteristics evaluated repectively in two production cycles to detect, at 5% probability, differences between treatment means for randomized block experiment.
The variation coefficients values oscillated with the evaluated characteristic and with the production cycle Figures 3 and 4), similarly to Ortiz (1995) ORTIZ, R. Plot techniques for assessment of bunch weight in banana trials under two systems of crop management. Agronomy Journal, Madison, v.87, n.1, p.63-69, 1995. and Lopes et al. (2014) LOPES, O.P.; MAIA, V.M.; XAVIER, A.A.; COSTA, M.R.; RODRIGUES, M.G.V. Diversidade genética, crescimento e produção de genótipos de bananeira ‘prata-anã’ em área com mal do panamá. Revista Brasileira de Fruticultura, Jaboticabal, v.36, n.4, p.924-939, 2014. as expected, since the first cycle is less subject to environmental and management conditions compared to the following cycle.
The variation coefficient was the factor that showed the greatest influence on plot size, since increases in plot size with increase in VC value were observed when d, t and r were fixed. In general, VC values lower than 10% (plant height, pseudostem perimeter, fruit diameter and length) and VC values higher than 10% (number of live leaves at flowering, number of emitted suckers, bunch mass and number of hands) resulted in small and large plots, respectively.
The influence of VC on plot size is visible when results concerning evaluated variables are compared with very different VC values and close heterogeneity index, such as the vegetative characteristics of number of emitted suckers (VC = 22.92%, b = 0.7702), and yield, fruit diameter (VC = 5.71% and b = 0.7748). The plot size estimated for a given combination of factors, for example, d = 15, t = 5, r = 4, was much larger for the number of emitted suckers, 22.14 basic units Figure 3, than for fruit diameter, 0.60 basic units (Figure 4).
This trend continues in the second production cycle.
The analysis of characteristics with very distinct VC values and high and relatively close b indexes, number of emitted suckers (VC = 30.09% and b = 1.1271) and fruit length (VC = 10.54% and b = 0.9411) shows that the plot size estimated for a certain combination of factors such as, d = 15, t = 5, r = 4, is much larger for the number of emitted suckers, 13.46 basic units Figure 3, compared to fruit length, 2.43 (Figure 4). This behavior between VC and plot size is expected because it expresses an inverse relationship between plot size and its variance (SMITH, 1938 SMITH, H.F. An empirical law describing heterogeneity in the yields of agricultural crops. Journal of Agricultural Science, Cambridge, v.28, n.1, p.1-23, 1938. ; HATHEWAY, 1961 HATHEWAY, W.H. Convenient plot size. Agronomy Journal, Madison, v.53, n.4, p.279-280, 1961. ) and resembles the results of other studies (ORTIZ, 1995 ORTIZ, R. Plot techniques for assessment of bunch weight in banana trials under two systems of crop management. Agronomy Journal, Madison, v.87, n.1, p.63-69, 1995. ; CARGNELUTTI FILHO et al., 2014 CARGNELUTTI FILHO, A.; TOEBE, M.; BURIN, C.; CASAROTTO, G.; ALVES, B.M. Planejamentos experimentais em nabo forrageiro semeado a lanço e em linha. Bioscience Journal, Uberlândia, v.30, n.3, p.677-686, 2014. ; CARGNELUTTI FILHO et,2016 CARGNELUTTI FILHO, A.; ALVES, B.M.; TOEBE, M.; FACCO, G. Tamanhos de unidades experimentais básicas e de parcelas em tremoço branco. Ciência Rural, Santa Maria, v.46, n.4, p.610-618, 2016. ; SCHMILDT et al., 2016 SCHMILDT, E.R.; SCHMILDT, O.; CRUZ, C.D.; CATTANEO, L.F.; FERREGUETTI, G.A. Optimum plot size and number of replications in papaya field experiment. Revista Brasileira de Fruticultura, Jaboticabal, v.38, n.2, p 1-9, 2016. ; SOUSA et al., 2016 SOUSA, R.P.; SILVA, P.S.L.; ASSIS, J.P. Tamanho e forma de parcelas para experimentos com girassol. Revista Ciência Agronômica, Fortaleza, v.47, n.4, p.683-690, 2016. ; LAVEZO et al., 2017 LAVEZO, A.; CARGNELUTTI FILHO, A.; BEM, C.M.D.; BURIN, C.; KLEINPAUL, J.A.; PEZZINI, R.V. Plot size and number of replications to evaluate the grain yield in oat cultivars. Bragantia, Campinas, v. 76, n. 4, p.512-520, 2017. ).
The number of replicates also had a marked influence on plot size, while the number of treatments showed little effect. Increasing the number of treatments from five to 15 or 20 did not significantly reduce the plot size. However, the use of four, five or six replicates significantly modified the plot size for the characteristics evaluated. This is clear when characteristics number of emitted suckers Figure 3 and fruit diameter are compared (Figure 4) for the same situation previously described; however, increasing the number of replicates from four to six, in which changes in the estimated size of plots to 11.93 basic units are observed (number of emitted suckers) and 0.33 basic units (fruit diameter), which corresponds to reductions of approximately 50% in plot size.
Data from the second cycle also corroborate the influence of increasing the number of replicates in the improvement of the experimental precision, which a classic relation in literature, and proven by several authors (CARGNELUTTI FILHO et al., 2014 CARGNELUTTI FILHO, A.; TOEBE, M.; BURIN, C.; CASAROTTO, G.; ALVES, B.M. Planejamentos experimentais em nabo forrageiro semeado a lanço e em linha. Bioscience Journal, Uberlândia, v.30, n.3, p.677-686, 2014. ; CARGNELUTTI FILHO et al.,2016 CARGNELUTTI FILHO, A.; ALVES, B.M.; TOEBE, M.; FACCO, G. Tamanhos de unidades experimentais básicas e de parcelas em tremoço branco. Ciência Rural, Santa Maria, v.46, n.4, p.610-618, 2016. ; SCHWERTNER et al. 2015 SCHWERTNER, D.V.; LÚCIO, A.D.; CARGNELUTTI FILHO, A. Uniformity trial size in estimates of plot size in restrict áreas. Revista Ciência Agronômica, Fortaleza, v.46, n.3, p.597-606, 2015. ; SCHMILDT et al., 2016 SCHMILDT, E.R.; SCHMILDT, O.; CRUZ, C.D.; CATTANEO, L.F.; FERREGUETTI, G.A. Optimum plot size and number of replications in papaya field experiment. Revista Brasileira de Fruticultura, Jaboticabal, v.38, n.2, p 1-9, 2016. ; SOUSA et al., 2016 SOUSA, R.P.; SILVA, P.S.L.; ASSIS, J.P. Tamanho e forma de parcelas para experimentos com girassol. Revista Ciência Agronômica, Fortaleza, v.47, n.4, p.683-690, 2016. ; LAVEZO et al., 2017 LAVEZO, A.; CARGNELUTTI FILHO, A.; BEM, C.M.D.; BURIN, C.; KLEINPAUL, J.A.; PEZZINI, R.V. Plot size and number of replications to evaluate the grain yield in oat cultivars. Bragantia, Campinas, v. 76, n. 4, p.512-520, 2017. ). The use of six replicates instead of four for the number of emitted suckers Figure 3 and fruit length (Figure 4) for the same situation previously described, reduced the estimated plot size to 8.83 basic units (number of emitted suckers) and 1.46 basic units (fruit length).
Significant decreases in plot size were also observed when the d values increased (lower experimental accuracy).
In this work, different plot sizes were estimated by the Hatheway method (1961) HATHEWAY, W.H. Convenient plot size. Agronomy Journal, Madison, v.53, n.4, p.279-280, 1961. , many of them of applicable size for experiments to evaluate banana cultivars.
For some characteristics evaluated as a function of the pre-established experimental conditions, extremely small or large values were obtained, thus reflecting impractical plot sizes. Plots with up to 25 plants, for being used in experiments to evaluate banana cultivars, are considered as plots of practical size; however, there may be an inadequate application, mainly due to the evaluated characteristic and, therefore, costs are maximized due to the greater area and experimental material used, without essential increases in experimental precision (DONATO et al., 2008 DONATO, S.L.R.; SIQUEIRA, D.L.; SILVA, S.O.; CECON, P.R.; SILVA, J.A.; SALOMÃO, L.C.C. Estimativas de tamanho de parcelas para avaliação de descritores fenotípicos em bananeira. Pesquisa Agropecuária Brasileira, Brasília, DF, v.43, n.8, p.957-969, 2008. ), since plots with six basic units allow evaluating of phenotypic characteristics with precision.
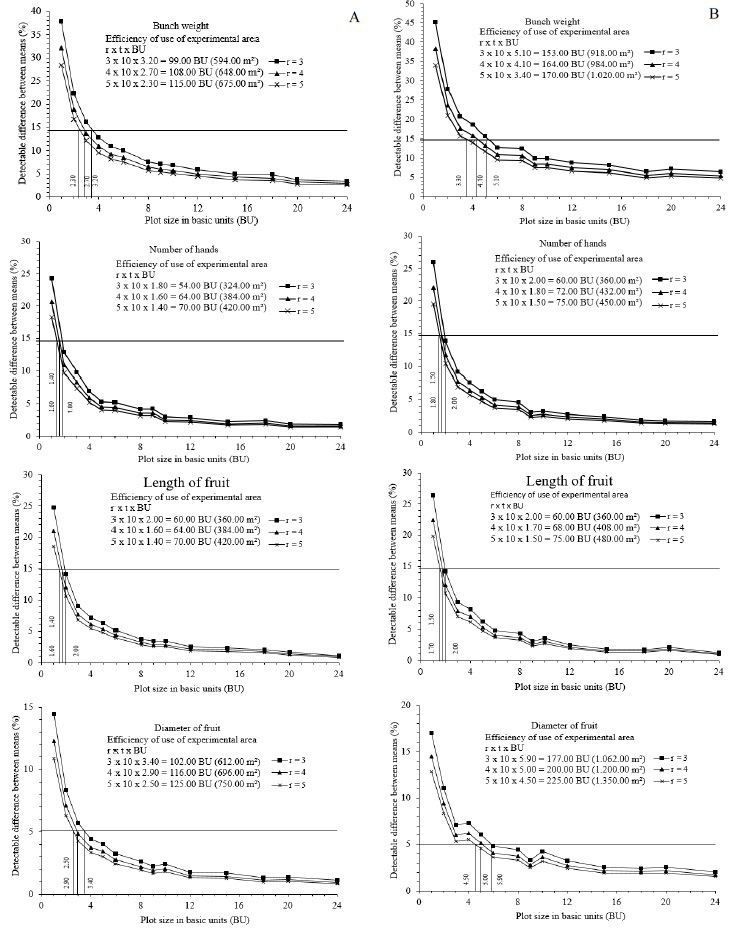
This can be seen in Figures 5 and 6 for 10 treatments and three to five replications, including for the characteristic and cycle of higher variability, as the number of emitted suckers in the second production cycle (Figure 5B). It could be observed that differences of 15% among treatment averages can be detected with five basic units and differences of 12% with six basic units, and from this point, there is a small reduction in the d values with increments in plot size. It could be inferred that little is gained in precision with the use of plots larger than six basic units, because the precision gain by increasing plot size or the decrease in variation decreases when the plot becomes very large.
It was observed that for plant height, pseudostem perimeter (Figure 5A) and fruit diameter (Figure 6A) in the first production cycle, it is possible to detect differences of up to five percent among treatment averages with plots not larger than six and four basic units, respectively. In the second cycle, for plant height and pseudostem perimeter (Figure 5B), plots with four basic units allow identifying differences of 10% and for fruit diameter (Figure 6B), plots of six basic units allow the detection of 5% among treatment averages.
Figures 3 and 4 and Figures 5 and 6 show the most appropriate combination between plot size and number of replicates, which will allow obtaining the precision level required. The decision regarding the combination to be adopted is a function of the plot size considered practical and valid in terms of sampling, area, available resources and number of experimental units that meet the requirements of number of degrees of freedom (BAKKE, 1988 BAKKE, O.A. Tamanho e forma ótimos de parcelas em delineamento experimentais. 1988. 142f. Dissertação (Mestrado em Estatística e Experimentação Agronômica) – Escola Superior de Agricultura Luiz de Queiroz, Universidade de São Paulo, Piracicaba, 1988. ), with minimum of 10 for the residue (PIMENTELGOMES, 2000 PIMENTEL-GOMES, F. Curso de estatística experimental. 14.ed. Piracicaba: ESALQ/USP, 2000. 477p. ).
In addition, Figures 5 and 6 show information relevant to experimental planning, expressed by the efficiency in use of the experimental area. This was estimated for all variables evaluated in both production cycles. In the first cycle, the plot size and number of replicates were considered for the detection of difference (d) of five percent of the average plant height, pseudostem perimeter and fruit diameter, and 15% of the average of the others characteristics. In the second cycle, five percent for the average fruit diameter, 10% for plant height and pseudostem perimeter and 15% for the other characteristics evaluated. It is noteworthy that the difference to be detected among treatment averages will be significant when its value is higher than the VC inherent to the evaluated characteristics (PIMENTEL-GOMES, 2000 PIMENTEL-GOMES, F. Curso de estatística experimental. 14.ed. Piracicaba: ESALQ/USP, 2000. 477p. ).
For the same precision required, the researcher may choose to use smaller plots and greater number of replicates or larger plots and fewer replicates, depending on the evaluated characteristics. The decision is a function of the combination that presents greater efficiency in the use of the experimental area, that is, requiring smaller area.
It is believed, therefore, that the results obtained in this work can be used as guide for researchers in order to better combine the different and important factors in the experimental planning to increase precision in experiments aimed at evaluating banana cultivars.

Regression equations between logarithm of variance and logarithm of plot size in basic units, for vegetative characteristics evaluated in the first (A) and second (B) production cycle in banana cv. Tropical.

Regression equations between logarithm of variance and logarithm of plot size in basic units, for yield characteristics evaluated in the first (A) and second (B) production cycle in banana cv. Tropical.

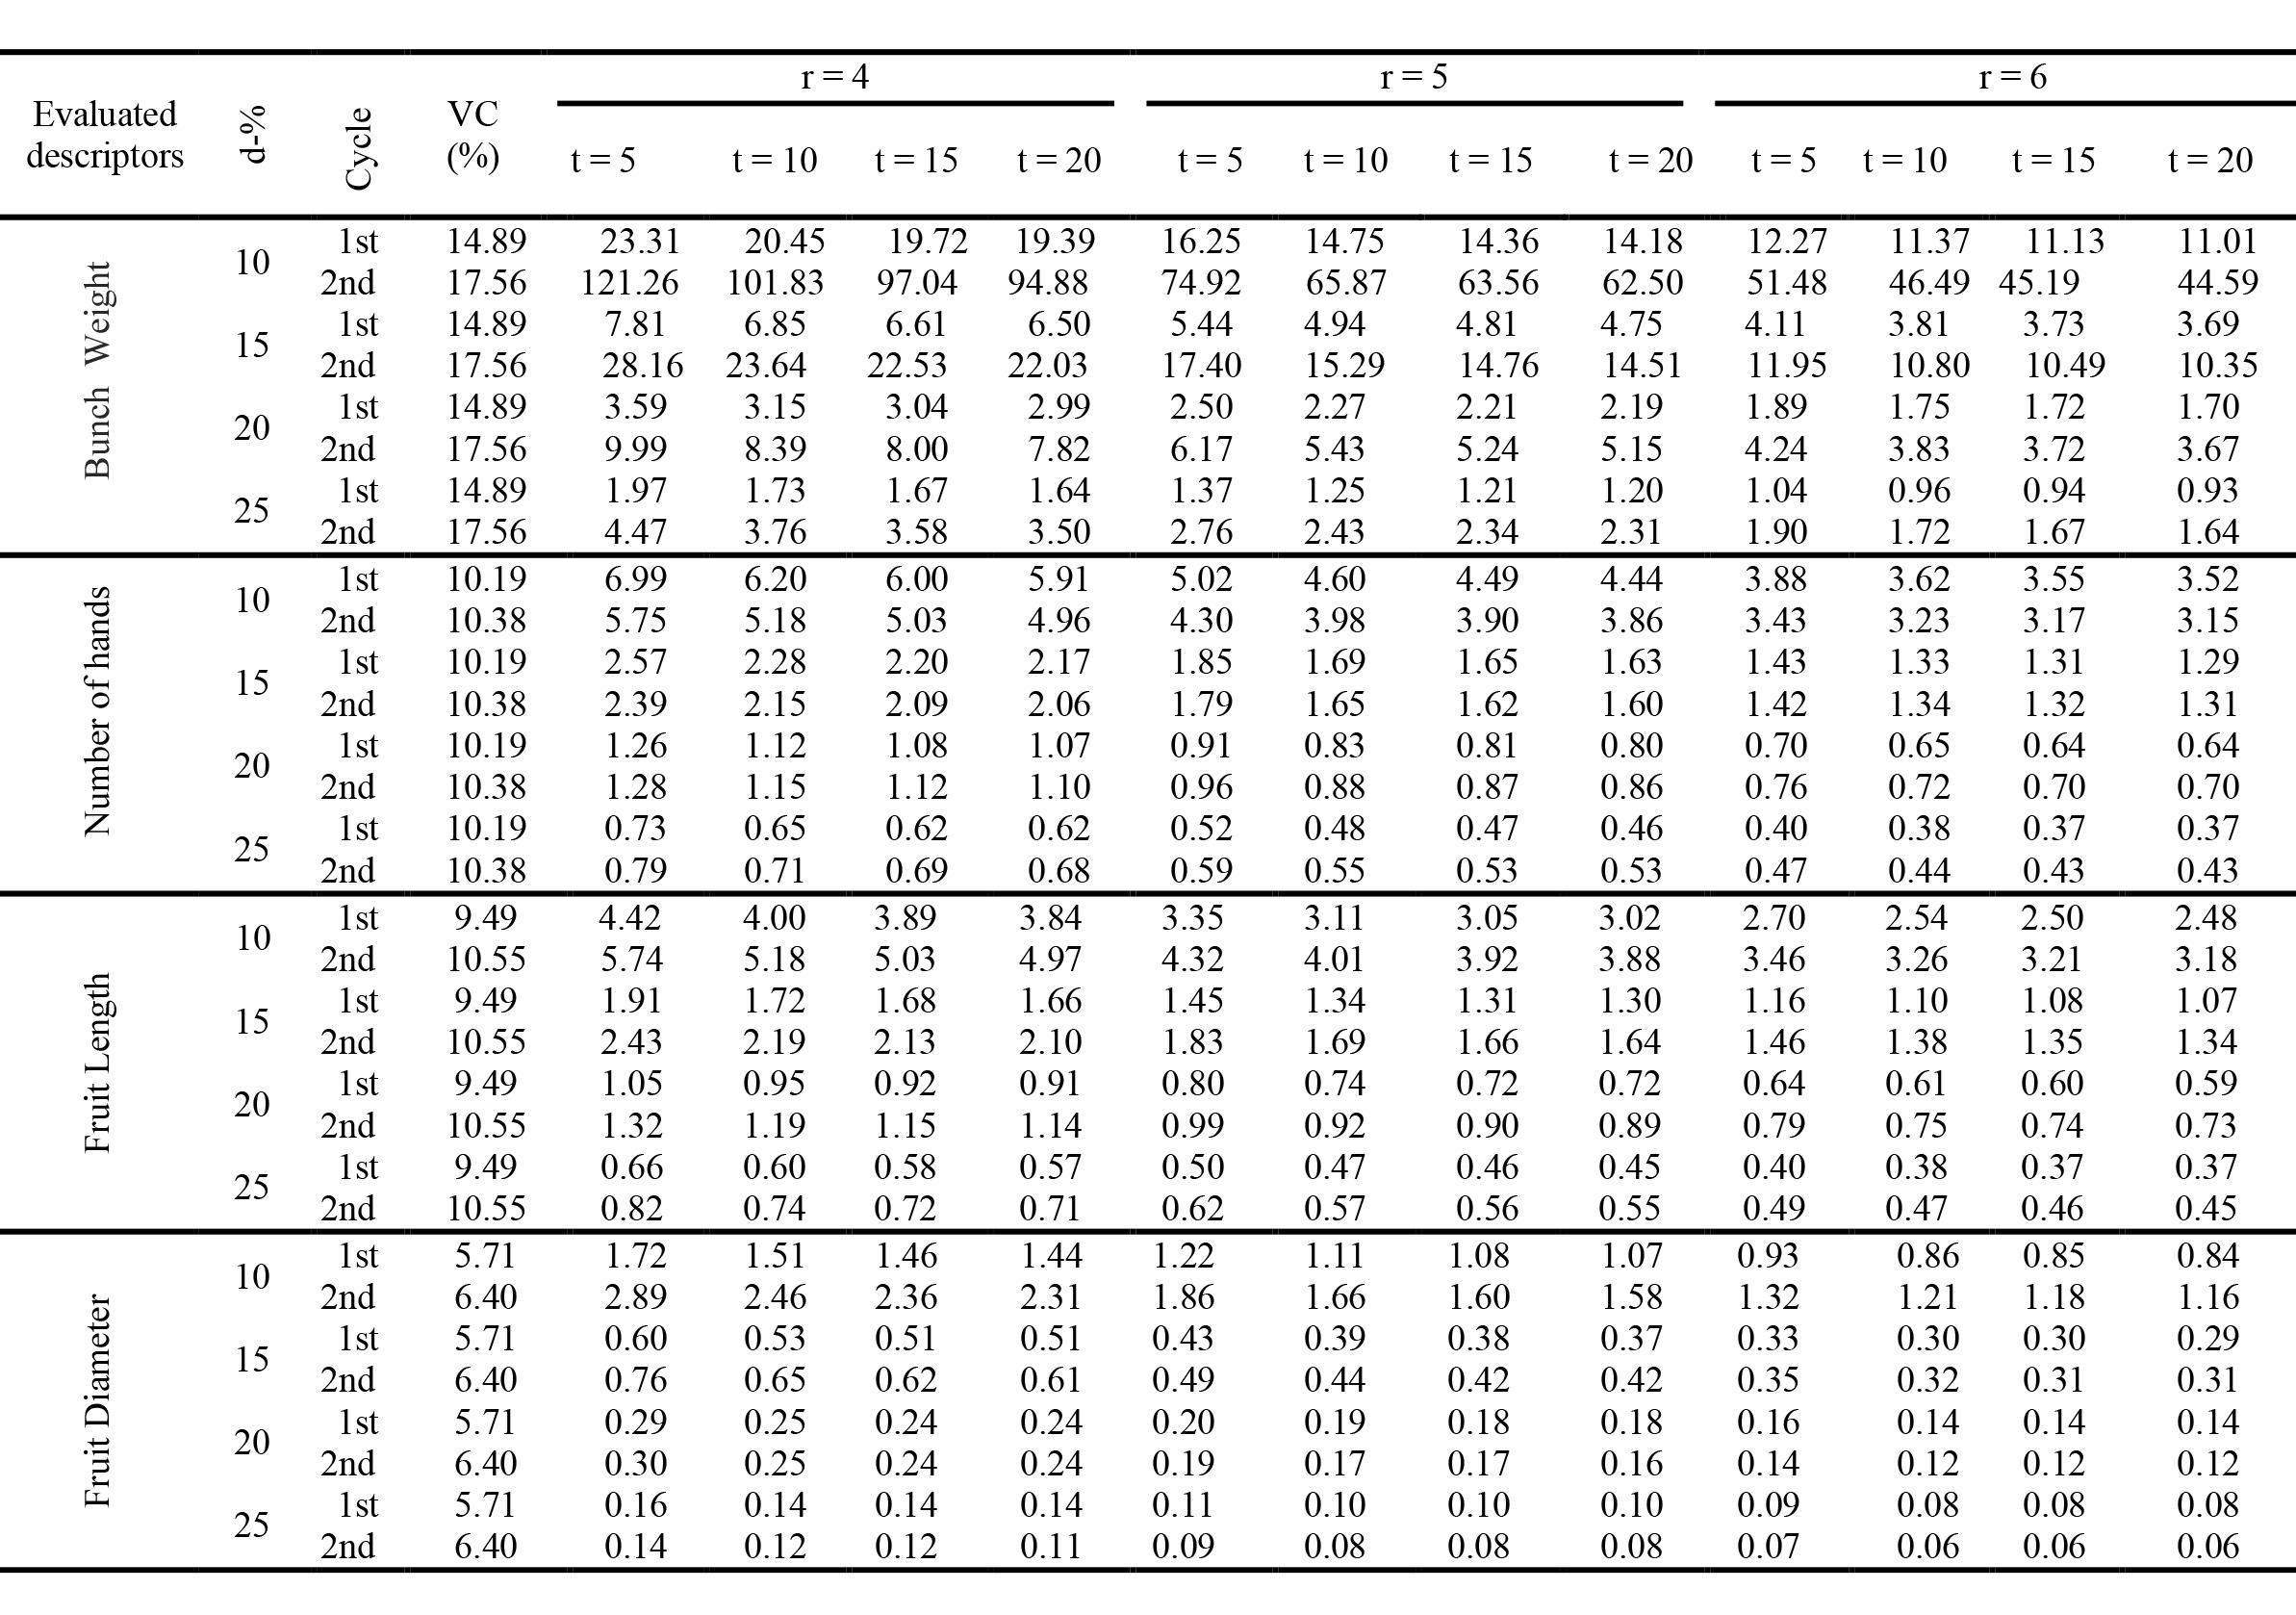
Estimates of plot size, in basic units, for vegetative characteristics evaluated in two production cycles in banana Tropical cultivar for various combinations of number of replicates (r), treatments (t), percentage difference of the mean to be detected (d) and variation coefficient values (VC).

Estimates of plot size, in basic units, for yield characteristics evaluated in two production cycles in banana tropical cultivar for various combinations of number of replicates (r), treatments (t), percentage difference of the mean to be detected (d) and variation coefficient values (VC).

Relationship between plot size and detectable difference (% of mean) between two treatments, with three replicate options and ten treatments, for vegetative characteristics evaluated in the first (A) and second (B) production cycle in banana Tropical cultivar.

Relationship between plot size and detectable difference (% of mean) between two treatments, with three replicate options and ten treatments, for yield characteristics evaluated in the first (A) and second (B) production cycle in banana Tropical cultivar.
Conclusions
For the same accuracy level required, the combination of plot size and number of replicates can be used to maximize the efficiency in the use of the experimental area.
Plots with four basic units and five replicates, or five basic units and three replicates ensure greater experimental precision considering the variables and cycles evaluated.
Useful plots with six basic units are considered efficient for banana experiments.
- BAKKE, O.A. Tamanho e forma ótimos de parcelas em delineamento experimentais. 1988. 142f. Dissertação (Mestrado em Estatística e Experimentação Agronômica) – Escola Superior de Agricultura Luiz de Queiroz, Universidade de São Paulo, Piracicaba, 1988.
- CARGNELUTTI FILHO, A.; ALVES, B.M.; TOEBE, M.; FACCO, G. Tamanhos de unidades experimentais básicas e de parcelas em tremoço branco. Ciência Rural, Santa Maria, v.46, n.4, p.610-618, 2016.
- CARGNELUTTI FILHO, A.; TOEBE, M.; BURIN, C.; CASAROTTO, G.; ALVES, B.M. Planejamentos experimentais em nabo forrageiro semeado a lanço e em linha. Bioscience Journal, Uberlândia, v.30, n.3, p.677-686, 2014.
- CASTRICINI, A.; DIAS, M.S.C.; RODRIGUES, M.G.V.; OLIVEIRA, P.M. Quality of organic banana produced in the semiarid region of Minas Gerais, Brazil. Revista Brasileira de Fruticultura, Jaboticabal, v.39, n.2, p.1-7, 2017.
- DONATO, S.L.R.; SIQUEIRA, D.L.; SILVA, S.O.; CECON, P.R.; SILVA, J.A.; SALOMÃO, L.C.C. Estimativas de tamanho de parcelas para avaliação de descritores fenotípicos em bananeira. Pesquisa Agropecuária Brasileira, Brasília, DF, v.43, n.8, p.957-969, 2008.
- GUAPACHA, S.E.; SALAZAR, M.S.; AGUILLÓN, J.; Y LANDÁZURI, P. Similaridad cariotípica entre diversas variedades de musa spp del Quindío-Colombia. Cultivos Tropicales, San José de lãs Lajas, v.38, n.4, p.119-126, 2017.
- HATHEWAY, W.H. Convenient plot size. Agronomy Journal, Madison, v.53, n.4, p.279-280, 1961.
- JIAA, J.; LIA, H.; ZHANGA, X.; LIB, Z.; QIUA, L. Genomics-based plant germplasm research (GPGR). The Crop Journal, Amsterdam, v.5, n.2, p.166-174, 2017.
- LAVEZO, A.; CARGNELUTTI FILHO, A.; BEM, C.M.D.; BURIN, C.; KLEINPAUL, J.A.; PEZZINI, R.V. Plot size and number of replications to evaluate the grain yield in oat cultivars. Bragantia, Campinas, v. 76, n. 4, p.512-520, 2017.
- LÉDO, A.S.; SILVA, T.N.; MARTINS, C.R.; SILVA, A.V.C.; LÉDO, C.A.S.; AMORIM, E.P. Caracterização físico-química de frutos de bananeira por procedimentos uni e multivariados. Bioscience Journal, Uberlândia, v.34, n.1, p.24-33, 2018.
- LOPES, O.P.; MAIA, V.M.; XAVIER, A.A.; COSTA, M.R.; RODRIGUES, M.G.V. Diversidade genética, crescimento e produção de genótipos de bananeira ‘prata-anã’ em área com mal do panamá. Revista Brasileira de Fruticultura, Jaboticabal, v.36, n.4, p.924-939, 2014.
- MARTIN, G.; BAURENS, F.C.; DROC, G.; ROUARD, M.; CENCI, A.; KILIAN, A.; HASTIE, A.; DOLEŽEL, J.; AURY, J.J.M.; ALBERTI, A.; CARREEL, F.; D’HONT, A. Improvement of the banana “Musa acuminata” reference sequence using NGS data and semi-automated bioinformatics methods. BMC GENOMICS, London, v.1, n.1, p.2-12, 2016.
- MATEI, G.; BENIN, G.; STORCK, L.; MILIOLI, A.S.; BOZI, A.H.; DALLÓ, S.C.; LUCION, R.A. Methods of analysis and number of replicates for trials with large numbers of soybean genotypes. Ciência Rural, Santa Maria, v.47, n.4, p.1-77, 2017.
- MELO, D.M.; COELHO, E.F.; BORGES, A.L.; PEREIRA, B.L.S.; CAMPOS, M.S. Agronomic performance and soil chemical attributes in a banana tree orchard fertigated with humic substances. Pesquisa Agropecuária Tropical, Goiânia, v.46, n.4, p.421-428, 2016.
- ORTIZ, R. Plot techniques for assessment of bunch weight in banana trials under two systems of crop management. Agronomy Journal, Madison, v.87, n.1, p.63-69, 1995.
- PIMENTEL-GOMES, F. Curso de estatística experimental. 14.ed. Piracicaba: ESALQ/USP, 2000. 477p.
- PLOETZ, R. C. Fusarium wilt of banana. The American Phytopathological Society, St Paul, v.105, n.12, p.1512-1521, 2015.
- RODRIGUES, M.G.V.; DONATO, S.L.R.; LICHTEMBERG, L.A.; DIAS, M.S.C. Implantação e manejo do bananal. Informe Agropecuário Belo Horizonte, v.36, n.288, p.27-44, 2015.
- SCHMILDT, E.R.; SCHMILDT, O.; CRUZ, C.D.; CATTANEO, L.F.; FERREGUETTI, G.A. Optimum plot size and number of replications in papaya field experiment. Revista Brasileira de Fruticultura, Jaboticabal, v.38, n.2, p 1-9, 2016.
- SCHWERTNER, D.V.; LÚCIO, A.D.; CARGNELUTTI FILHO, A. Uniformity trial size in estimates of plot size in restrict áreas. Revista Ciência Agronômica, Fortaleza, v.46, n.3, p.597-606, 2015.
- SILVA, J.T.A. da. Solo, adubação e nutrição para bananeira. Informe Agropecuário, Belo Horizonte, v.36, n.288, p.74-83, 2015.
- SILVA, M.J.R.; JESUS, P.R.R.; ANJOS, J.M.C.; MACHADO, M.; RIBEIRO, V.G.R. Caracterização agronômica e pós-colheita das bananeiras 'Maravilha' e 'Preciosa' no Submédio do Vale São Francisco. Revista Ceres, Viçosa, MG, v.63, p.46-53, 2016.
- SMITH, H.F. An empirical law describing heterogeneity in the yields of agricultural crops. Journal of Agricultural Science, Cambridge, v.28, n.1, p.1-23, 1938.
- SOUSA, R.P.; SILVA, P.S.L.; ASSIS, J.P. Tamanho e forma de parcelas para experimentos com girassol. Revista Ciência Agronômica, Fortaleza, v.47, n.4, p.683-690, 2016.
- SRIPATHI, R.; CONAGHAN, P.; GROGAN D.; CASLER, M.D. Field design factors affecting the precision of ryegrass forage yield estimation. American Society of Agronomy, New Brunswick, v.109, n.3, p.858-869, 2017.
- WEBER, O.B.; GARRUTI, D.S.; NORÕES, N.P.; SILVA, S.O. Performance of banana genotypes with resistance to black leaf streak disease in Northeastern Brazil. Pesquisa Agropecuária Brasileira, Brasília, DF, v.52, n.3, p.161-169, 2017.
Publication Dates
-
Publication in this collection
2018
History
-
Received
17 Nov 2017 -
Accepted
15 Feb 2018