Abstract
Nutritional standards based on long-term data improve the nutritional diagnosis of the crop, as they make norms more precise and establish more refined criteria. This study aimed to evaluate the nutritional status of the mango crop using the DRIS methodology to identify nutritional limitations and validate norms. A da-tabase of 202 commercial plots was used, whose leaves were collected in the floral induction period between 2011 and 2018 in the Brazilian semiarid region. The productivity of 'Keitt' mango under the Brazilian semiarid conditions was not related to NBI-DRIS. Nutrient concentration presents positive and significant relationship with the respective DRIS indices, enabling the determination of the balance point, establishing a nutritional standard and enabling the use of foliar diagnosis for the variety. The order of nutrients with the highest frequency of limitations due to lack, in decreasing order, was: Zn > Al > Na > Cu > S > B > Mn > P = K > Fe > Ca > N > Mg, and limitation due to excess, in decreasing order was: Fe > Na > Mg > Al > Cu > B = N > S > Ca > P = K > Zn > Mn.
Index terms
Nutritional diagnosis; Floral induction; Mangifera indica
Resumo
Padrões nutricionais com base em dados de longo prazo melhoram o diagnóstico nutricional da cultura, pois tornam as normas mais precisas e estabelecem critérios mais refinados. Objetivou-se avaliar o estado nutricional da cultura da manga utilizando a meto-dologia DRIS para identificar as limitações nutricionais e para validar as normas. Foi utilizado banco de dados de 202 talhões comerciais, cujas folhas foram coletadas no período de in-dução floral, entre 2011 e 2018, no Semiárido brasileiro. A produtividade da manga ‘Keitt’, nas condições do Semiárido brasileiro, não foi relacionada com o IBN do DRIS. A concentra-ção dos nutrientes apresenta relação positiva e significativa com os respectivos índices DRIS, possibilitando a determinação do ponto de equilíbrio, estabelecendo um padrão nutricional e viabilizando a utilização da diagnose foliar para a variedade. A ordem de nutrientes com maior frequência de limitações por falta, em ordem decrescente, foi: Zn > Al > Na > Cu > S > B > Mn > P = K > Fe > Ca > N > Mg, e limitantes por excesso, em ordem decrescente, foi: Fe > Na > Mg > Al > Cu > B = N > S > Ca > P = K > Zn > Mn.
Termos para indexação
Diagnose Nutricional; Indução floral; Mangifera indica
Introduction
Productivity variability in perennial crops is mainly affected by plant management and soil fertility conditions. It is necessary to de-termine the levels of nutrients by diagnostic methods in nutritional composition studies.
Establishing standard reference values for the nutritional status of a crop requires stud-ies that involve variation in soil and climate conditions, so they can be constantly reas-sessed,generating new information that can be added to the existingdata set (PARENT, 2011 PARENT, L.E. Diagnosis of the nutrient compositional space of fruit crops. Revista Brasileira de Fruticultura, Jaboticabal, v.33, n.1, p.321-334, 2011. ). Thus, assessing the nutritional status of fruit trees requires better reference stand-ards to be reliable (ROZANE; PRADO, 2020 ROZANE, D.E.; PRADO, R. de M. Fruit crops: diagnosis and management of nutrient constraints. Amsterdam: Elsevier. 2020. Disponível em: https://books.google.com.br/books?id=1RbBDwAAQBAJepg=PA143elpg=PA143edq=diagnose+da+composi%C3%A7%C3%A3o+nutricional+da+mangaesource=bleots=cmlSFfEW4Tesig=ACfU3U12UOXRbsG7juIyPCFNkRw1dZEt4Aehl=ptBResa=X#v=onepageeqef=false. Acesso em: 03 abr 2020.
https://books.google.com.br/books?id=1Rb...
).
Among methods cited in literature, critical level (CL) (ULRICH, 1952 ULRICH, A. Physiological bases for assessing the nutritional requirements of plants. Annual Review of Plant Physiology, Palo Alto, v 3, p.207–228.1952. ), sufficiency range (SR), which uses univariate relationships (DOW; ROBERTS, 1982 DOW, A.I.; ROBERTS, S. Proposal: critical nutrient ranges for crop diagnosis. Agronomy Journal, Madison, v.74, p.401–403.1982. ), diagnosis and rec-ommendation integrated system (DRIS), which uses bivariate relationships(BEAUFILS, 1973 BEAUFILS, E.R. Diagnosis and recommendation integrated system (DRIS). A general scheme for experimentation and calibration based on principles developed from research in plant nutrition. Soil Science Bulletin, Pietermararitzburg, v 1, p.132, 1973. ) and compositional nutrient diagnosis (CND), which uses multivariate relationships (PARENT; DAFIR, 1992 PARENT, L.E.; DAFIR, M. A theoretical concept of compositional nutrient diagnosis. Journal of the American Society for Horticultural Science, Alexandria, v.117, p.239-242, 1992. ) are widely discussed and applied in different crops.
In mango, Rozane et al. (2007) ROZANE, D.E.; NATALE, W.; PRADO, R.DE.M.; BARBOSA, J.C. Amostragem para diagnose do estado nutricional de mangueiras. Revista Brasileira de Fruticultura, Jaboticabal, v.29, n.2, p.371-376, 2007. emphasize that leaf chemical analysis helps in nutri-tional knowledge and evaluates the result of fertilization based on soil chemical analysis.Wadt and Silva (2020) WADT, P.G.S.; SILVA, D.J. Normas multivariadas para avaliação do estado nutricional de mangueiras cultivar Tommy Atkins, pelo método da composição da diagnose nutricional. Rondônia: EMBRAPA, 2020. (Comunicado Técnico, 412) evaluated the nutri-tional status of Tommy mangoes using the CND method and reported that it enabled a more efficient fertilization management in commercial orchards.
For this reason, it is necessary to establish nu-tritional references in specific crops and vari-eties using tools and methods that compare the results of the foliar contents of samples with adequate nutritional standards obtained in the high-yieldpopulation of the crop to be analyzed (FRANCO-HERMIDA et al, 2020 FRANCO-HERMIDA, J.J.; QUINTERO-CASTELLANOS, M.F.; GUZMÁN, A.I.; GUZMÁN, M.; CABRERA, R.I. Validating integrative nutrient diagnostic norms for greenhouse cut-roses. Scientia Horticulturae, New York, v.264, n.109094, 2020. ).
Thus, with data from the leaf analysis of 'Keitt' mango from commercial plots, the aim was to evaluate the nutritional status of the crop using the DRIS methodology to identify nutritional limitations and validate norms.
Material and Methods
A database of 202 plots was used, whose leaf samples were collected in the floral induction period between 2011 and 2018 from commercial areas in the Brazilian semiarid region, state of Pernambuco. The 'Keitt' mango variety was selected, and leafsam-ples were collected during the floral induc-tion period. The establishment of the DRIS norms involved the total leaf nutrient con-tents in g.kg-1 for N, P, K,Ca, Mg and S, and in mg.kg-1 for B, Cu, Fe, Mn, Zn, Na and Al and crop yield (Mg.ha-1).
For the division of the database in reference population or high yield and low yield, Serra et al. (2013) SERRA, A.P.; MARCHETTI, M.E.; ROJAS, E.P.; MORAIS, H.S.de.; CONRAD, V.D.A.; GUIMARÃES, F.C.N. Estabelecimento de normas DRIS para o algodoeiro com diferentes critérios de seleção da população de referência. Pesquisa Agropecuária Brasileira, Brasília, DF, v.48, p.1472-1480, 2013. reported that there are several criteria, and in the present study, the yield criterion superior to the average value ob-tained was established. In order to minimize the flattening effect of data, providing the kurtosis effect, the functions of nutrient ra-tios were calculated through the logarithm transformation, proposed by Beverly (1987) BEVERLY, R.B. Comparison of DRIS and alternative nutrient diagnostic methods for soybean. Journal of Plant Nutrition, Abingdon, v.10, p.901-920, 1987. .
The methodology applied to calculate the DRIS indices was the one proposed by Beau-fils (1973), which uses all ratios (N/P and P/N):
Where Y is the nutrient and n is the number of DRIS functions analyzed. To calculate the nutrient balance index - NBI, the sum in modulus of the indices of each nutrient was used:
To calculate the average NBI, the criterion proposed by Wadt et al. (1998) WADT, P.G.S.; NOVAIS, R.F.; ALVAREZ, V.H.; FONSECA, S.; BARROS, N.F.; DIAS, L.E. Três métodos de cálculo do DRIS para avaliar o potencial de resposta à adubação de árvores de eucalipto. Revista Brasileira de Ciência do Solo, Viçosa, MG, v.22, p.661-666, 1998. was adopted,which uses the sum in modulus of the indices of each nutrient divided by the number of nutrients involved (n):
In order to interpret the NBI, the potential fertilization response (PFR) was used, as es-tablished by Wadt (2005) WADT, P.G.S. Relationships between soil class and nutritional status of coffee plantations. Revista Brasileira de Ciência do Solo, Viçosa, MG, v.29, p.227-234, 2005. , which was defined in 5 classes: (p) positive, (pz) positive or null, (z) null, (nz) negative or null and (n) negative.
To facilitate interpretation, classes were grouped according to criteria proposed by Silva et al. (2005) SILVA, G.G.C., NEVES, J.C.L.; ALVAREZ, V.H. Avaliação da universalidade das normas DRIS, M- DRIS e CND. Revista Brasileira de Ciência do Solo, MG, Viçosa, v.29, p.755-761, 2005. in: (LL) limiting by lack (= p+pz), (NL) non-limiting (= z) and (LE) limit-ing by excess (= nz+n).
The adherence of PFR classes was calculated by the chi-square test (5%), where its validity is verified if there is total significance be-tween rows and columns, with observed (OF) and expected (EF) frequencies, established according to Urano et al. al. (2006 URANO, EM.O.; KURIHARA, C.H.; MAEDA, S.; VITORINO, A.C.T.; GONÇALVES, M.C.; MARCHETTI, M.C. Avaliação do estado nutricional da soja. Pesquisa Agropecuária Brasileira, Brasília, DF, v.41, p.1421-1428, 2006. ):
To determine the ranges of adequate levels of nutrients, regressions between the levels of each nutrient and their respective DRIS in-dices were obtained. To establish the critical level, sufficiency ranges were established considering deviationsfrom the zero index plus or minus 2/3 of the standard deviation value obtained for each nutrient, as pro-posed by Serra et al. (2012) SERRA, A.P.; MARCHETTI, M.E.; ROJAS, E.P.; VITORINO, A.C.T. Beaufils ranges to assess the cotton nutrient status in the southern region Mato Grosso. Revista Brasileira de Ciência do Solo, Viçosa, MG, v.36, p.171-181, 2012. .
In order to validate the DRIS diagnostic method, the graphical method of the Cate- Nelson procedure was applied, which princi-ple is the division of the scatterplot into four quadrants, thus maximizing the number of points in the positive quadrants while mini-mizing the number of negative quadrants (NELSON; ANDERSON, 1977 NELSON, L.A.; ANDERSON, R.L. Partitioning of soil test-crop response probability. In: PECK T.R.; COPE-JUNIOR, J.T.; WHITNEY, D.A. (ed.). Soil testing: correlating and interpreting the analytical results. Madison: American Society of Agronomy, Crop Science Society of America, 1977. ). Eachquadrant represents a class of response to the use of the input and means, as mentioned by Parent etal. (2013) PARENT, S.E.; PARENT, L.E.; ROZANE, D.E.; NATALE, W. Plant ionome diagnosis using sound balances: case study with mango (Mangifera indica). Frontiers in Plant Science, Lausanne, v.4, n.39, p.1-10, 2013. :
True Negative (TN): adequate nutri-tional status, as the high-yield population was correctly identified as balanced.
False Positive (FP): nutrient consump-tion by the plant or exceptionally high ef-ficiency of nutrient use, as the high-yield population was incorrectly identified as unbalanced.
False Negative (FN): nutritional imbal-ance caused by at least one nutrient, as the low-yield population was correctly identified as unbalanced.
True Positive (TP): impact of other lim-iting factors on crop performance, as the low-yield population was incorrectly identified as balanced.
According to Parent et al. (2013) PARENT, S.E.; PARENT, L.E.; ROZANE, D.E.; NATALE, W. Plant ionome diagnosis using sound balances: case study with mango (Mangifera indica). Frontiers in Plant Science, Lausanne, v.4, n.39, p.1-10, 2013. , the inter-pretation of the procedure should be per-formed as follows:
Negative Predictive Value (NPV): probability of a balanced diagnosis returning to high performance, calculated as TN / (TN + FN)
Positive Predictive Value (PPV): proba-bility of an imbalance diagnosis returning to low performance, calculated as TP / (TP + FP)
Accuracy (Ac.): probability of an observation being correctly identified as bal-anced or unbalanced, calculated as (TN + VP) / (TN + FN + TP + FP)
Specificity (Sp.): probability of a high-yield observation being balanced, calcu-lated as TN / (TN + FP)
Sensitivity (Sens.): probability of a low-performance observation to be unbalanced, calculated as TP / (TP + FN).
Results and Discussion
Analyzing the total of 202 plots, 82 were classified as high-yield or reference subpopula-tion, totaling 40.6% of the population, and the rest (59.4%) as low-yield subpopulation.
Table 1 shows the mean values, standard de-viation and coefficient of variation of the DRIS norm found, using all Beaufils ratios (N/P and P/N) (1973).
Mean, standard deviation and coefficient of variation of logarithms of nutrient ratios of the reference population.
Table 2 shows the result of the potential fertilization response, in which it is evident that the highest frequency of positive response (p) was presented by Zn and Al, followed by Cu and S; however, nutrients P and B pre-sented values very closeto the others and should not be included in this class. The nutrients that presented low fertilization re-sponse (n), that is, found in excess, are: Fe, Cu and Na, respectively.
The chi-square test for nutrient frequencies showed significant effect, indicating that the method was efficient in diagnosing the pos-itive effect of the fertilization response (TABLE 3). Similar results were found by Politi et al. (2013) POLITI, L.S.; FLORES, R.A.; SILVA, J.A.S.; WADT, P.G.S.; PINTO, P.A.C.; PRADO, R.M. Estado nutricional de mangueiras determinado pelos métodos DRIS e CND. Revista Brasileira de Engenharia Agrícola e Ambiental, Campina Grande, v.17, p.11-18, 2013. , applying the test in the mango experiment.
The analysis of nutritional class found the following nutrients limiting due to lack, in decreasing order of frequency: Zn > Al > Na > Cu > S > B > Mn > P = K > Fe > Ca > N > Mg, and limiting due to excess, in decreasing order: Fe > Na > Mg > Al > Cu > B = N > S > Ca > P = K > Zn > Mn (TABLE 4). Fe excess result corroborates findings by Silva et al. (2004) SILVA, D.R.; PEREIRA, R.; MOUCO, M.A.; ALBUQUERQUE, A.S. de.; RAIJ, B.; SILVA, C.A. Nutrição mineral e adubação da mangueira em condições irrigadas. Petrolina: Embrapa Semiárido, 2004. 13 p. (Circular Técnica, 77). in 'Tommy Atkins' mango. Similarly, Raj and Rao (2006) RAJ.G.B.; RAO.A.P. Identificação de nutrientes limitadores de rendimento em manga através de índices DRIS. Communications in Soil Science and Plant Analysis, Basingstoke, v.37, p.1761-1774, 2006. , in a long-term experiment with mango, found that the most limitingnutrientsby the DRIS method were Fe and Zn.
Figure 1 shows the graph of the relationship between average NBI and yield, showing lin-ear equation, significant at 1%, with determination coefficient equal to 5% (R2=0.059). Similar result (R2=0.003) was found by Santos (2016) SANTOS, E.M.H dos. Diagnose da composição nutricional (CND) para a cultura da Atemoia. 2016. Dissertação (Mestrado em Ciência do Solo) - Universidade Federal do Paraná, Curitiba, 2016. for atemoya crop,whereas Souza et al. (2013) SOUZA, H.A.; ROZANE, D.E.; AMORIM, D.A de.; NATELE, W. Normas preliminares DRIS e faixas de suficiência para goiabeira ‘Paluma’. Revista Brasileira de Fruticultura, Jaboticabal, v.35, n.1, p.282-291, 2013. obtained determination coeffi-cient of42% for guava crop.

Relationship between average NBI mean values and yield of 'Keitt' mango orchards in the Brazilian semiarid region.
In view of the above, it is clear that the aver-age NBI mean did not provide the necessary information to determine whether crop production is significantly associated with the nutritional balance index calculated by the DRIS method. Even if plots are managed in a uniform way, as they belong to a single com-pany, there was variation according to the years under analysis.
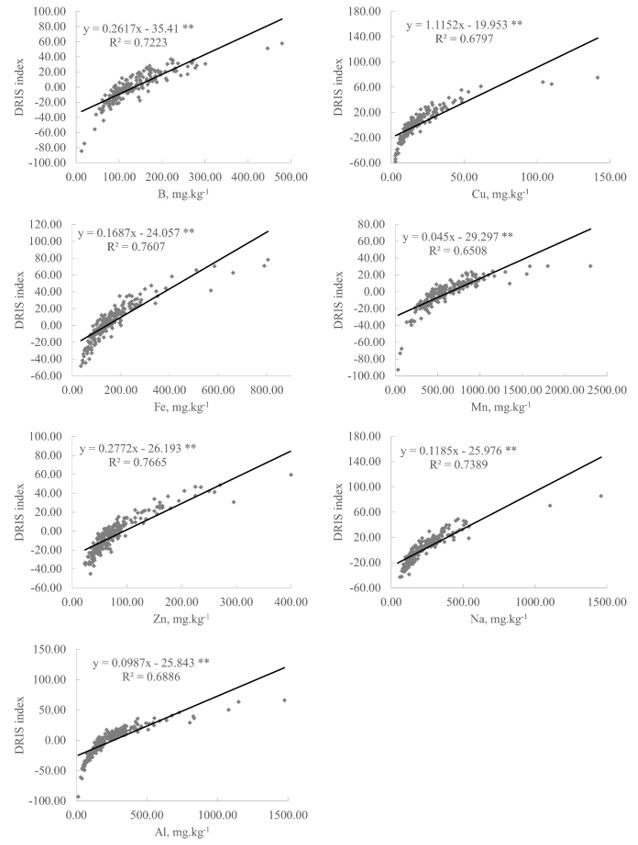
However, when relating the DRIS index with the concentrations of the respective nutrients, determination coefficients above 53% for macronutrients were observed, being 76% for S (FIGURE 2) and above 65% for micronutrients, being 76% for Zn and Fe(FIGURE 3).

Relationship between DRIS indices and the concentration of macronutrients in 'Keitt' mango leaves.

Relationship between DRIS indices and the concentration of micronutrients in 'Keitt' mango leaves.
Considering that the plant is in nutritional balance when the DRIS index value approaches zero (WALWORTH; SUMMER, 1987 WALWORTH, J.L.; SUMNER, M.E. The diagnosis and recommendation integrated system (DRIS). Advances in Soil Science, New York, v.6, p.150-188, 1987. ), a DRIS nutritional balance point was determined, equating the graph equation to zero (TABLE 5).
The sufficiency range and adequate content of DRIS results were compared with literature data, and it was observed that there was a difference in amplitudes (TABLE 6). The results show smaller amplitude of the DRIS suf-ficiency range for K, Ca,Mg, Cu, and Zn when compared to literature. Analyzing the appro-priate content, only Mn, B and K, DRIS had its highest values, the others being very close to those of literature.
Data referring to Al and Na are not reported in diagnostic studies, although Al is considered a toxic element for plants, some biochemical mechanisms can give plants the ability to inactivate or store aluminum in leaves in non-toxic forms (SILVAet al., 1984 SILVA, J.B.C.; NOVAIS, R.F.; SEDIYAMA, C.S. Identificação de genótipos de sorgo tolerantes a toxicidade de alumínio. Revista Brasileira de Ciência do Solo, Viçosa, MG, v.8, p.77-83, 1984. ).
In regions such as the semiarid, Na is frequently analyzed in order to detect the occurrence of the soil salinization process. The excess of salts severely limits agricultural production, especially in arid and semiarid regions, where about 25% of the irrigated area is salinized (FAO, 2011 FAO - Food and Agriculture Organization of the United Nations. The state of the world’s land and water resources for food and agriculture. Roma, 2011. ).
In Figure 4, the result of the application of the Cate-Nelson procedure is presented, where the general nutritional balance indices are related to the entire sample set of the 'Keitt' mango crop yield.

Cate-Nelson partitioning for the relationship between NBI and yield for the 202 ‘Keitt’ mango plots. NPV = Negative Predictive Value; PPV = Positive Predictive Value; TN = True Negative; FP = False Positive; TP = True Positive; FN = False Negative; Ac. = Accuracy; Esp. = Specificity; Sens. = Sensitivity.
Accuracy, which represents the probability level of the observation being correctly iden-tified as balanced or unbalanced, presented value of 44% (FIGURE 4). Parent et al. (2013) PARENT, S.E.; PARENT, L.E.; ROZANE, D.E.; NATALE, W. Plant ionome diagnosis using sound balances: case study with mango (Mangifera indica). Frontiers in Plant Science, Lausanne, v.4, n.39, p.1-10, 2013. found values of 92% for mango crop using CND. In literature, idealvalues above 50% (BEVERLY; HALLMARK, 1992 BEVERLY, R.B.; HALLMARK, W.B. Prescient diagnostic analysis: a proposed new approach to evaluating plant nutrient diagnostic methods. Communications in Soil Science and Plant Analysis, Basingstoke, v.23, p.2633-2640, 1992. ) or above 68% (WADT; LEMOS, 2010 WADT, P.G.S.; LEMOS, C.O. Medidas de acurácia para diagnósticos nutricionais e seu impacto no manejo das adubações. In: PRADO, R. de M.; CECÍLIO FILHO, A.B.; CORREIA, M.A.R.; PUGA, A.P. (ed.). Nutrição de plantas: diagnose foliar em hortaliças. Jaboticabal: Funep, 2010. p.213-236. ) are reported.
As for specificity and sensitivity, the values obtained were 57 and 34%, respectively (FIGURE 4). In the work developed by Meneses et al. (2017) MENESES, N.B. Diagnóstico do estado nutricional do milho-doce. 2017. Tese (Doutorado em Agronomia) - Faculdade de Ciências Agrárias e Veterinárias, Universidade Estadual Paulista, Jaboticabal, 2017. with sweet corn crop, specificity of 95% and sensitivity of 45% were obtained.
For the high-yield population (82 plots), 47 were correctly identified with adequate nutritional status (TN) and 35 were incorrectly identified (FP). As for the low-yield population (121 stands), 41 were correctly identified as unbalanced (TP),where at least one nutrient is affecting yield, while 79 were impacted by other factors limiting crop performance, not nutritional (FN) (FIGURE 4).
Conclusions
The yield of 'Keitt' mango under the Brazilian semiarid conditions was not related to NBI-DRIS.
Nutrient concentration has positive and sig-nificant relationship with the respective DRIS indices, enabling the determination of the balance point, establishing a nutritional standard and enabling the use of foliar diag-nosis for the variety.
The order of nutrients with the highest fre-quency of limitations due to lack, in decreas-ing order was: Zn > Al > Na > Cu > S > B > Mn > P = K > Fe > Ca > N > Mg, and due to excess in decreasing order was: Fe > Na > Mg > Al > Cu > B = N > S > Ca > = K > Zn > Mn.
- ARAÚJO, J.J.de. Avaliação do estado nutricional da mangueira Tommy Atkins irrigada no Vale do Açu em diferentes épocas de amostragem foliar. 2010. (Mestrado em Irrigação e Drenagem) - Universidade Federal Rural do Semi-Árido, Mossoró, 2010.
- BEAUFILS, E.R. Diagnosis and recommendation integrated system (DRIS). A general scheme for experimentation and calibration based on principles developed from research in plant nutrition. Soil Science Bulletin, Pietermararitzburg, v 1, p.132, 1973.
- BEVERLY, R.B. Comparison of DRIS and alternative nutrient diagnostic methods for soybean. Journal of Plant Nutrition, Abingdon, v.10, p.901-920, 1987.
- BEVERLY, R.B.; HALLMARK, W.B. Prescient diagnostic analysis: a proposed new approach to evaluating plant nutrient diagnostic methods. Communications in Soil Science and Plant Analysis, Basingstoke, v.23, p.2633-2640, 1992.
- DOW, A.I.; ROBERTS, S. Proposal: critical nutrient ranges for crop diagnosis. Agronomy Journal, Madison, v.74, p.401–403.1982.
- FAO - Food and Agriculture Organization of the United Nations. The state of the world’s land and water resources for food and agriculture. Roma, 2011.
- FRANCO-HERMIDA, J.J.; QUINTERO-CASTELLANOS, M.F.; GUZMÁN, A.I.; GUZMÁN, M.; CABRERA, R.I. Validating integrative nutrient diagnostic norms for greenhouse cut-roses. Scientia Horticulturae, New York, v.264, n.109094, 2020.
- MEDEIROS, A.A; AMORIM, J.R.A.de; SILVA, D.J; GUEDES, F.X; GUERRA, A.G; DANTAS, J.A. Composição mineral de folhas e exportação de nutrientes pelos frutos de mangueira, em cultivo irrigado, no Rio Grande do Norte. Natal: Emparn, 2005. 13 p.(Boletim de Pesquisa e Desenvolvimento, 30).
- MENESES, N.B. Diagnóstico do estado nutricional do milho-doce. 2017. Tese (Doutorado em Agronomia) - Faculdade de Ciências Agrárias e Veterinárias, Universidade Estadual Paulista, Jaboticabal, 2017.
- NELSON, L.A.; ANDERSON, R.L. Partitioning of soil test-crop response probability. In: PECK T.R.; COPE-JUNIOR, J.T.; WHITNEY, D.A. (ed.). Soil testing: correlating and interpreting the analytical results. Madison: American Society of Agronomy, Crop Science Society of America, 1977.
- PARENT, L.E. Diagnosis of the nutrient compositional space of fruit crops. Revista Brasileira de Fruticultura, Jaboticabal, v.33, n.1, p.321-334, 2011.
- PARENT, S.E.; PARENT, L.E.; ROZANE, D.E.; NATALE, W. Plant ionome diagnosis using sound balances: case study with mango (Mangifera indica). Frontiers in Plant Science, Lausanne, v.4, n.39, p.1-10, 2013.
- PARENT, L.E.; DAFIR, M. A theoretical concept of compositional nutrient diagnosis. Journal of the American Society for Horticultural Science, Alexandria, v.117, p.239-242, 1992.
- POLITI, L.S.; FLORES, R.A.; SILVA, J.A.S.; WADT, P.G.S.; PINTO, P.A.C.; PRADO, R.M. Estado nutricional de mangueiras determinado pelos métodos DRIS e CND. Revista Brasileira de Engenharia Agrícola e Ambiental, Campina Grande, v.17, p.11-18, 2013.
- QUAGGIO, J.A.Adubação e calagem para a mangueira e qualidade dos frutos. In: SÃO JOSÉ, A.R.; SOUZA, I.V.B.; MARTINS FILHO, J.; MORAIS, O.M. (ed.) Manga: tecnologia de produção e mercado.Vitória da Conquista: UESB, 1996. p.106-135
- RAJ.G.B.; RAO.A.P. Identificação de nutrientes limitadores de rendimento em manga através de índices DRIS. Communications in Soil Science and Plant Analysis, Basingstoke, v.37, p.1761-1774, 2006.
- ROZANE, D.E.; NATALE, W.; PRADO, R.DE.M.; BARBOSA, J.C. Amostragem para diagnose do estado nutricional de mangueiras. Revista Brasileira de Fruticultura, Jaboticabal, v.29, n.2, p.371-376, 2007.
- ROZANE, D.E.; PRADO, R. de M. Fruit crops: diagnosis and management of nutrient constraints. Amsterdam: Elsevier. 2020. Disponível em: https://books.google.com.br/books?id=1RbBDwAAQBAJepg=PA143elpg=PA143edq=diagnose+da+composi%C3%A7%C3%A3o+nutricional+da+mangaesource=bleots=cmlSFfEW4Tesig=ACfU3U12UOXRbsG7juIyPCFNkRw1dZEt4Aehl=ptBResa=X#v=onepageeqef=false. Acesso em: 03 abr 2020.
» https://books.google.com.br/books?id=1RbBDwAAQBAJepg=PA143elpg=PA143edq=diagnose+da+composi%C3%A7%C3%A3o+nutricional+da+mangaesource=bleots=cmlSFfEW4Tesig=ACfU3U12UOXRbsG7juIyPCFNkRw1dZEt4Aehl=ptBResa=X#v=onepageeqef=false. - SANTOS, E.M.H dos. Diagnose da composição nutricional (CND) para a cultura da Atemoia. 2016. Dissertação (Mestrado em Ciência do Solo) - Universidade Federal do Paraná, Curitiba, 2016.
- SERRA, A.P.; MARCHETTI, M.E.; ROJAS, E.P.; VITORINO, A.C.T. Beaufils ranges to assess the cotton nutrient status in the southern region Mato Grosso. Revista Brasileira de Ciência do Solo, Viçosa, MG, v.36, p.171-181, 2012.
- SERRA, A.P.; MARCHETTI, M.E.; ROJAS, E.P.; MORAIS, H.S.de.; CONRAD, V.D.A.; GUIMARÃES, F.C.N. Estabelecimento de normas DRIS para o algodoeiro com diferentes critérios de seleção da população de referência. Pesquisa Agropecuária Brasileira, Brasília, DF, v.48, p.1472-1480, 2013.
- SILVA, D.R.; PEREIRA, R.; MOUCO, M.A.; ALBUQUERQUE, A.S. de.; RAIJ, B.; SILVA, C.A. Nutrição mineral e adubação da mangueira em condições irrigadas. Petrolina: Embrapa Semiárido, 2004. 13 p. (Circular Técnica, 77).
- SILVA, G.G.C., NEVES, J.C.L.; ALVAREZ, V.H. Avaliação da universalidade das normas DRIS, M- DRIS e CND. Revista Brasileira de Ciência do Solo, MG, Viçosa, v.29, p.755-761, 2005.
- SILVA, J.B.C.; NOVAIS, R.F.; SEDIYAMA, C.S. Identificação de genótipos de sorgo tolerantes a toxicidade de alumínio. Revista Brasileira de Ciência do Solo, Viçosa, MG, v.8, p.77-83, 1984.
- SOUZA, H.A.; ROZANE, D.E.; AMORIM, D.A de.; NATELE, W. Normas preliminares DRIS e faixas de suficiência para goiabeira ‘Paluma’. Revista Brasileira de Fruticultura, Jaboticabal, v.35, n.1, p.282-291, 2013.
- ULRICH, A. Physiological bases for assessing the nutritional requirements of plants. Annual Review of Plant Physiology, Palo Alto, v 3, p.207–228.1952.
- URANO, EM.O.; KURIHARA, C.H.; MAEDA, S.; VITORINO, A.C.T.; GONÇALVES, M.C.; MARCHETTI, M.C. Avaliação do estado nutricional da soja. Pesquisa Agropecuária Brasileira, Brasília, DF, v.41, p.1421-1428, 2006.
- WADT, P.G.S.; NOVAIS, R.F.; ALVAREZ, V.H.; FONSECA, S.; BARROS, N.F.; DIAS, L.E. Três métodos de cálculo do DRIS para avaliar o potencial de resposta à adubação de árvores de eucalipto. Revista Brasileira de Ciência do Solo, Viçosa, MG, v.22, p.661-666, 1998.
- WADT, P.G.S. Relationships between soil class and nutritional status of coffee plantations. Revista Brasileira de Ciência do Solo, Viçosa, MG, v.29, p.227-234, 2005.
- WADT, P.G.S.; LEMOS, C.O. Medidas de acurácia para diagnósticos nutricionais e seu impacto no manejo das adubações. In: PRADO, R. de M.; CECÍLIO FILHO, A.B.; CORREIA, M.A.R.; PUGA, A.P. (ed.). Nutrição de plantas: diagnose foliar em hortaliças. Jaboticabal: Funep, 2010. p.213-236.
- WADT, P.G.S.; SILVA, D.J. Normas multivariadas para avaliação do estado nutricional de mangueiras cultivar Tommy Atkins, pelo método da composição da diagnose nutricional. Rondônia: EMBRAPA, 2020. (Comunicado Técnico, 412)
- WALWORTH, J.L.; SUMNER, M.E. The diagnosis and recommendation integrated system (DRIS). Advances in Soil Science, New York, v.6, p.150-188, 1987.
Publication Dates
-
Publication in this collection
07 Nov 2022 -
Date of issue
2022
History
-
Received
01 Dec 2021 -
Accepted
22 July 2022