 Analysis of Meteorological Factors That Start Operação Comboio in the Anchieta-Imigrantes System in Brazil: Fog Case Study
Abstract
Anchieta-Imigrantes System (AIS) is one of Brazil's primary highways, connecting São Paulo to the Port of Santos. In AIS, Operação Comboio (OC) is activated when visibility drops below 100 m. This study investigated the meteorological factors that initiated OC in AIS during 2015 using a comprehensive array of data sources, for example, meteorological stations and synoptic charts. In 2015, OC was triggered on 106 days, predominantly in spring, mostly on the Anchieta Highway, and often in the afternoon. Meteorological systems triggering OC were classified as orographic, confined to the Serra do Mar, or non-orographic, involving broader cloudiness or precipitation detected by satellite or radar. Data from Itutinga Meteorological Station helped differentiate between visibility reductions caused by fog or precipitation. Among the 87 OCs studied in 2015, sea breeze (SB) contributed to 38% of cases. Generally, moisture was provided by advection by the SB or the Post-frontal anticyclone, occasionally from precipitating systems associated with frontal passage or thermodynamic instability. Moisture influx combined with temperature drops, induced by SB, post-frontal air, or nocturnal radiation loss, triggered OC.
Keywords
fog; mist; sea breeze; weather conditions; Operação Comboio; mesoscale; synoptic; Anchieta-Imigrantes System
Resumo
O Sistema Anchieta-Imigrantes (SAI) é uma das principais rodovias do Brasil, conectando São Paulo ao Porto de Santos. A Operação Comboio (OC) é ativada quando a visibilidade cai abaixo de 100 m. Este estudo investigou os fatores meteorológicos que iniciaram a OC no SAI durante 2015, utilizando uma variedade de fontes de dados, como de estações meteorológicas e imagens de radar e satélite. Em 2015, a OC foi acionada em 106 dias, principalmente na primavera, predominantemente na Rodovia Anchieta e frequentemente à tarde. Os sistemas meteorológicos que desencadearam a OC foram classificados como orográficos (confinados à Serra do Mar) ou não orográficos (envolvendo maior nebulosidade ou precipitação detectada por satélite ou radar). Os dados da Estação Meteorológica de Itutinga ajudaram a diferenciar reduções de visibilidade causadas por nevoeiro ou precipitação. Entre as 87 OCs analisadas em 2015, a brisa marítima (BM) contribuiu para 38% dos casos. A umidade foi geralmente fornecida pela advecção da BM ou pela alta pós-frontal, e ocasionalmente de sistemas precipitantes associados à passagem de frente ou instabilidade termodinâmica. A OC foi iniciada pela combinação do aporte de umidade com a queda de temperatura, induzida pela BM, ar pós-frontal ou perda de radiação noturna.
Palavras-chave
nevoeiro; névoa úmida; brisa marítima; condições meteorológicas; Operação Comboio; mesoescala; sinótico; Sistema Anchieta-Imigrantes
1. Introduction
Mist and fog are atmospheric phenomena that form near or along the earth's surface and are made up of suspended water droplets or ice crystals in the atmosphere. These phenomena form when the air temperature and dew point temperature approach each other and water vapor condenses. The difference between mist and fog is related to the extent of horizontal visibility - defined as the farthest distance at which an object can be seen and identified (WMO, 2010). Both mist and fog reduce horizontal visibility, however, fog is denser than mist, reducing visibility to less than one kilometer, and can be considered as a Stratus (St) cloud type, whereas mist is less dense, and horizontal visibility is greater than one kilometer (WMO, 2010; CPTEC, 2018). In this work, the terms mist and fog will be used.
During the day, a factor that favors the formation and maintenance of fog is the lower heating of the surface, which can occur in the presence of low, medium, and high clouds that reduce the incident solar radiation on the ground, reducing turbulence in the mixed layer and maintaining higher relative humidity in the lower layers of fog (França, 2008).
There are several types of fog that are classified according to the geographic region in which they are established, the synoptic system that induces them, and their evolution processes (Croft et al., 1997). Advection fog occurs when a relatively warm and humid air mass moves over a colder surface. Thus, this air cools down by contact or by mixing with the colder air until it reaches the dew point temperature. In this case, a certain amount of turbulence is necessary for greater development of the fog, facilitating the cooling of a deeper layer of air, and taking the fog to higher altitudes (Willet, 1928). The manual of forecasting techniques of the Air Force of Nebraska (USA) reports that winds above 9 knots (4.6 m s-1) typically cause the dissipation of this fog (Reymann et al., 1998). Radiative fog occurs on nights with clear skies (with little or no cloudiness), weak or absent winds, and high relative humidity. This absence of cloudiness and calm winds favors the cooling of the air layer close to the surface due to the loss of long-wave radiation, which can be accompanied by a thermal inversion. In an atmosphere with sufficient humidity, this cooling leads to the saturation of the air, causing the water vapor present to begin to condense, forming fog (Willet, 1928). Orographic fog occurs when air is forced to rise over an elevated region, such as a mountain. As it rises, it expands and cools. If the air is moist enough and saturation occurs, fog may form.
Fogs are commonly observed throughout Brazil (except in the Northeast Region, where they are rare) (Da Silva, 2018). The formation of fog is associated with different synoptic situations. Generally, when São Paulo is under the dominance of a high pressure system (South Atlantic Subtropical High (SASH) or Post-frontal anticyclone (PFA)), there are favorable conditions for fog formation. In these synoptic conditions, mesoscale circulation of breezes (land-sea, and mountain-valley) also occurs. Frontal systems, on the other hand, contribute to favorable conditions for rainfall, which increases the availability of moisture and, associated with cooling due to the entry of cooler air, can also provide conditions for fog formation.
The occurrence of fog directly affects society. Its presence causes the closure of airports, ports, and roads, with the implementation of specific safety measures to prevent accidents, delays, and cancellations (Haeffelin et al., 2010). Accidents caused in conditions of intense fog and rain can cause material damage, be of great proportions, and even be fatal.
In view of the safety of its users, Ecovias implements the Operação Comboio (OC) whenever visibility is impaired by the incidence of fog, more specifically when the meteorological stations installed along the Anchieta-Imigrantes System (AIS) indicate a visibility of less than 100 m. According to the Ecovias website, there are on average about 550 “Operações Comboio” (OCs) per year (occurring more than once a day on some days, and on more than one highway), and many users often complain about this implementation due to traffic delays it causes. Thus, identifying meteorological situations that lead to the implementation of OC is crucial both to increase safety on associated highways and to reduce driver dissatisfaction. Therefore, this study aims to identify the meteorological systems associated with the formation of fog/mist that initiates these OCs in the Anchieta-Imigrantes System.
2. Data and Methods
2.1. Study area
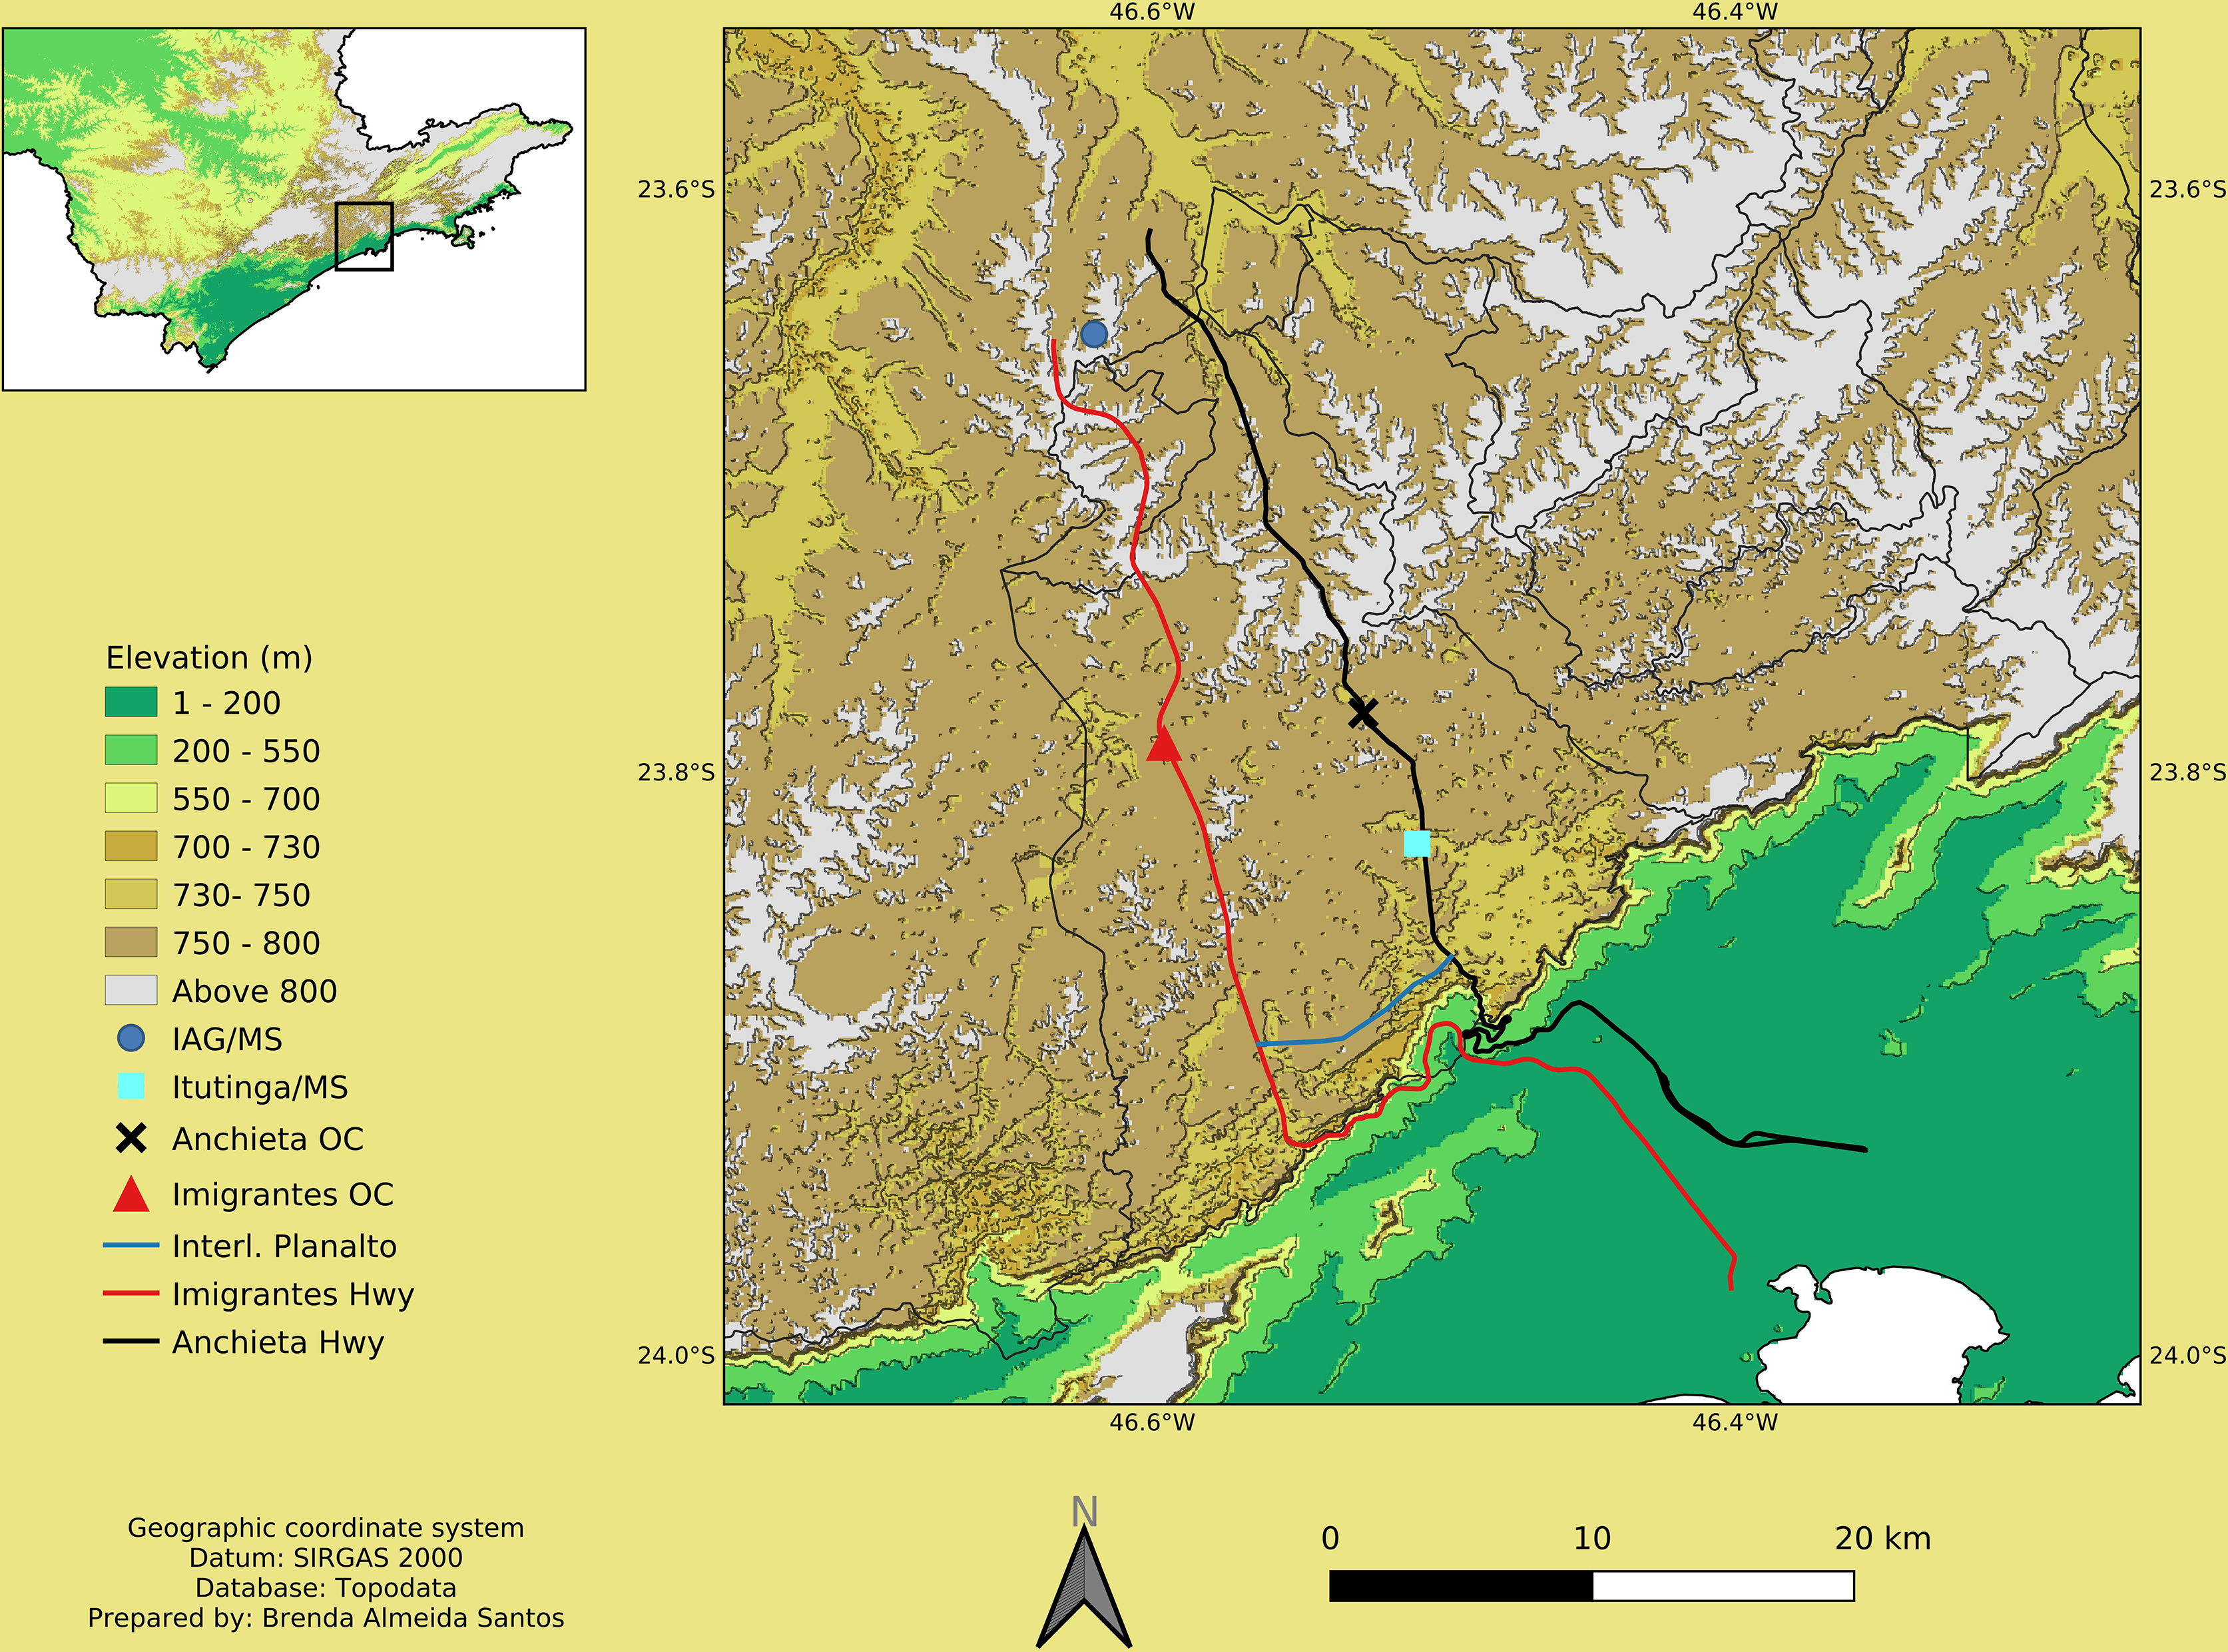
The Anchieta-Imigrantes System (AIS) is located in the Paulista Plateau and the Serra do Mar (Fig. 1). According to Almeida and Carneiro (1998), the Serra do Mar is a set of festooned scarps with about 1,000 km of extension, where the Atlantic Plateau ends in the stretch facing the Santos Basin. In São Paulo, it imposes itself as a typical plateau edge, often leveled at the top at altitudes of 800 to 1,200 m (Almeida and Carneiro, 1998). The Serra do Mar is composed of the Atlantic Forest vegetation, being characterized as Dense Ombrophilous Forest or Slope Forest, causing the internal environment to be shaded.
The AIS is the main connection between the São Paulo Metropolitan Region and the Port of Santos - the largest in Latin America -, the Cubatão Petrochemical Pole, the industries of ABCD, and the Baixada Santista. The Port of Santos is considered the Brazilian port with the greatest diversity in imports and exports, occupying the position of the largest port in the southern hemisphere (Port of Santos, 2019). Since 1998, the AIS has been managed by the company Ecovias dos Imigrantes together with the Government of São Paulo and regulated by the Regulatory Agency for Delegated Public Transport Services of the State of São Paulo - Artesp.
2.2. Operação Comboio (OC)
The Operação Comboio consists of guiding vehicles in convoys with Ecovias and Polícia Militar Rodoviária (Highway patrol) cars in the AIS whenever the horizontal visibility is less than 100 m.
The AIS uses strategically positioned weather stations to monitor visibility at critical points of fog occurrence. When visibility drops below 500 m, the protocol homologated by Artesp is activated, which includes communication to the concessionaire's operators and police activation to maintain prepared teams. When visibility drops below 200 m, the Interligação Planalto on-ramps are blocked, and vehicles are positioned for possible convoy formation (ABC do ABC, 2018). When visibility drops below 100 m on any stretch of the AIS, the OC is initiated on the affected highway, and the Interligação Planalto on-ramps are blocked for vehicles going up the mountain. However, they cannot be blocked for those going down as vehicles must change highways to descend the mountain via the Anchieta Highway. In this case, traffic is interrupted, and vehicles are organized into convoys (about 350/500 vehicles), guided by patrol cars, to a location with better visibility.
According to Douglas Albiero, Josimar L. de Macedo, Marcio R. Vono, and Roberto C. Lima, in an online meeting held on February 25, 2022 via Google Meet, in situations where the fog is dense only on the Interligação Planalto, but with good visibility on the Imigrantes Highway, vehicles destined for Anchieta Highway are held back at the beginning of the Interligação stretch (km 8), just after the Imigrantes on-ramp, at km 40. Thus, users with passenger vehicles intending to travel to the coast via Imigrantes continue their journey freely.
Once the convoy formation has begun, even if visibility conditions improve, the convoy must continue to a safe location to avoid potential accidents, such as those caused by drivers trying to make up for lost time.
Using Topodata data (Topodata - INPE), a hypsometric map of the study area was produced (Fig. 1), which shows that the area where the OC blockade is performed is at an altitude between 750-800 m. After passing through the Interligação Planalto, this altitude decreases to 200-550 m, reaching the coast.
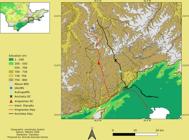
Hypsometric map of the study area with location of highways, OC blocking points (OC Anchieta; OC Imigrantes), IAG/MS, and Itutinga/MS.
2.3. Data
The data used in this study came from different sources. Regarding time, we chose to maintain it according to the original data from the meteorological stations: Local Time (i.e., Solar Time. If the data is provided in Brasilia Time, it is transformed into Local Time = UTC - 3).
2.3.1. Itutinga Meteorological Station (Itutinga/MS)
The Itutinga/MS is an automatic meteorological station installed and maintained by the Micrometeorology Laboratory of IAG-USP. It is located in the Itutinga-Pilões Park, near Anchieta Highway, at latitude 23.82472°S, longitude 046.50917°W, and altitude 747 m (Fig. 1 - hypsometric map). In order to analyze the meteorological conditions during the OC events, hourly data of precipitation (mm), specific humidity (g kg-1), relative humidity (%), temperature (°C), measured at 2 m height, wind direction (°), and wind speed (m s-1), measured at 10 m height, were analyzed for the year 2015. The data is provided in Local Time (LT).
2.3.2. Institute of Astronomy, Geophysics, and Atmospheric Sciences Meteorological Station (IAG/MS)
We utilized temperature (°C), relative humidity (%), wind speed (m s-1), precipitation (mm), and fog data from the IAG/MS in São Paulo, Brazil (Latitude: 23.651161° S, Longitude: 046.622399° W, Altitude: 800 m), registered with the World Meteorological Organization under number 83004, as supplementary information. Fog and mist were identified at this station based on specific criteria: horizontal visibility equal to or less than 3000 m (classified as mist, fog or dense fog) and relative humidity exceeding 70%. Observations at this station were made between 07:00 and 24:00 local time; events occurring during the early morning were not recorded. For instance, if fog began after 24:00 and dissipated before 07:00 local time, it was not logged, as noted by Armani et al. (2010).
2.3.3. Ecovias data
If the difference between the blocking end time and the next start time was less than two hours, it was considered as a single OC;
The start and end times of each OC were rounded to the nearest hour.
Early morning hours: 00:00 to 05:59 LT;
Morning: 06:00 to 11:59 LT;
Afternoon: 12:00 to 17:59 LT;
Night: 18:00 to 23:59 LT.
2.3.4. Data used in synoptic analyses
To analyze synoptic conditions, the atmospheric variables employed were sea level pressure, geopotential height, and the zonal and meridional components of wind, obtained from the ERA-Interim reanalysis (Dee et al., 2011), with a spatial resolution of 2.5°, at 9:00 AM local time at atmospheric levels of 1000, 850, 500, and 250 hPa. Surface synoptic charts analyzed by the Center for Weather Forecasting and Climate Studies (CPTEC - INPE) for the year 2015 were also used.
2.3.5. Data used in mesoscale analysis
Hourly temperature and dew point temperature data at 2 m and zonal and meridional wind components at 10 m from ERA5 reanalysis, the fifth generation of reanalysis from the European Centre for Medium-Range Weather Forecasts (ECMWF), which represents the state-of-the-art in reanalysis data (Hersbach et al., 2020), with a spatial resolution of 0.25° were used.
Using ERA5 data, temperature (°C), dew point temperature (°C), and wind (m s-1) fields were plotted, and surface wind divergence (*10-5 s-1) was calculated and plotted for each day of the year 2015, for each hour of the day, to evaluate the spatial distribution of these variables.
To better analyze the behavior of the variables near the OC region, the nearest grid point to the region was selected, and these variables were plotted on a graph for each day, marking the times when OC occurred and fog was recorded at IAG/MS.
In this way, the ERA5 fields and graphs were analyzed each day for the year 2015, as well as the surface synoptic chart to briefly identify the cause of the OC.
2.3.6. Radiosonde and METAR data
Radiosonde data from Campo de Marte Airport, collected by the Meteorology Network of the Brazilian Air Force (REDEMET), were obtained from the University of Wyoming. In addition, Meteorological Aerodrome Reports (METAR) from Congonhas Airport (SBSP), located approximately 4.9 (38) km from IAG/MS (OC), and from Santos Airport (SBST) were used.
2.3.7. Satellite and radar images
The visible and infrared channel images from the Geostationary Operational Environmental Satellite - 13 (GOES-13) satellite, available on the website of the Division of Satellites and Environmental Studies (INPE), as well as the São Roque radar images (located approximately 83 km away from the OC locations) provided by REDEMET were also evaluated in the OC case studies.
2.4. Criteria for identifying meteorological systems
2.4.1. Sea breeze (SB)
I. The temperature on the continent being higher than the air temperature above the ocean (the temperature at IAG/MS greater than approximately 23 °C) and the circulation associated with this system being visible on the temperature and wind maps of ERA5; together with
II. Wind rotation at Itutinga/MS to SE, accompanied by a drop in temperature and/or an increase in specific humidity or relative humidity between 09:00 and 17:00 LT.
2.4.2. Front
The identification of the front passage was initially done using synoptic charts from CPTEC and Era-Interim data through sea level pressure and temperature advection, but later, more locally, confirmed by ERA5 charts through the temperature gradient and wind variation together with data from meteorological stations. The time of front passage was defined through the wind shift to the SE, accompanied by a decrease in temperature, and this temperature should be lower or equal to the previous days. In addition, on ERA5 maps, SE winds should be associated with the PFA circulation, and the temperature on the continent could be colder than on the coast/ocean.
3 Results
3.1. Exploratory analysis
3.1.1. Operação Comboio (OC) in 2015
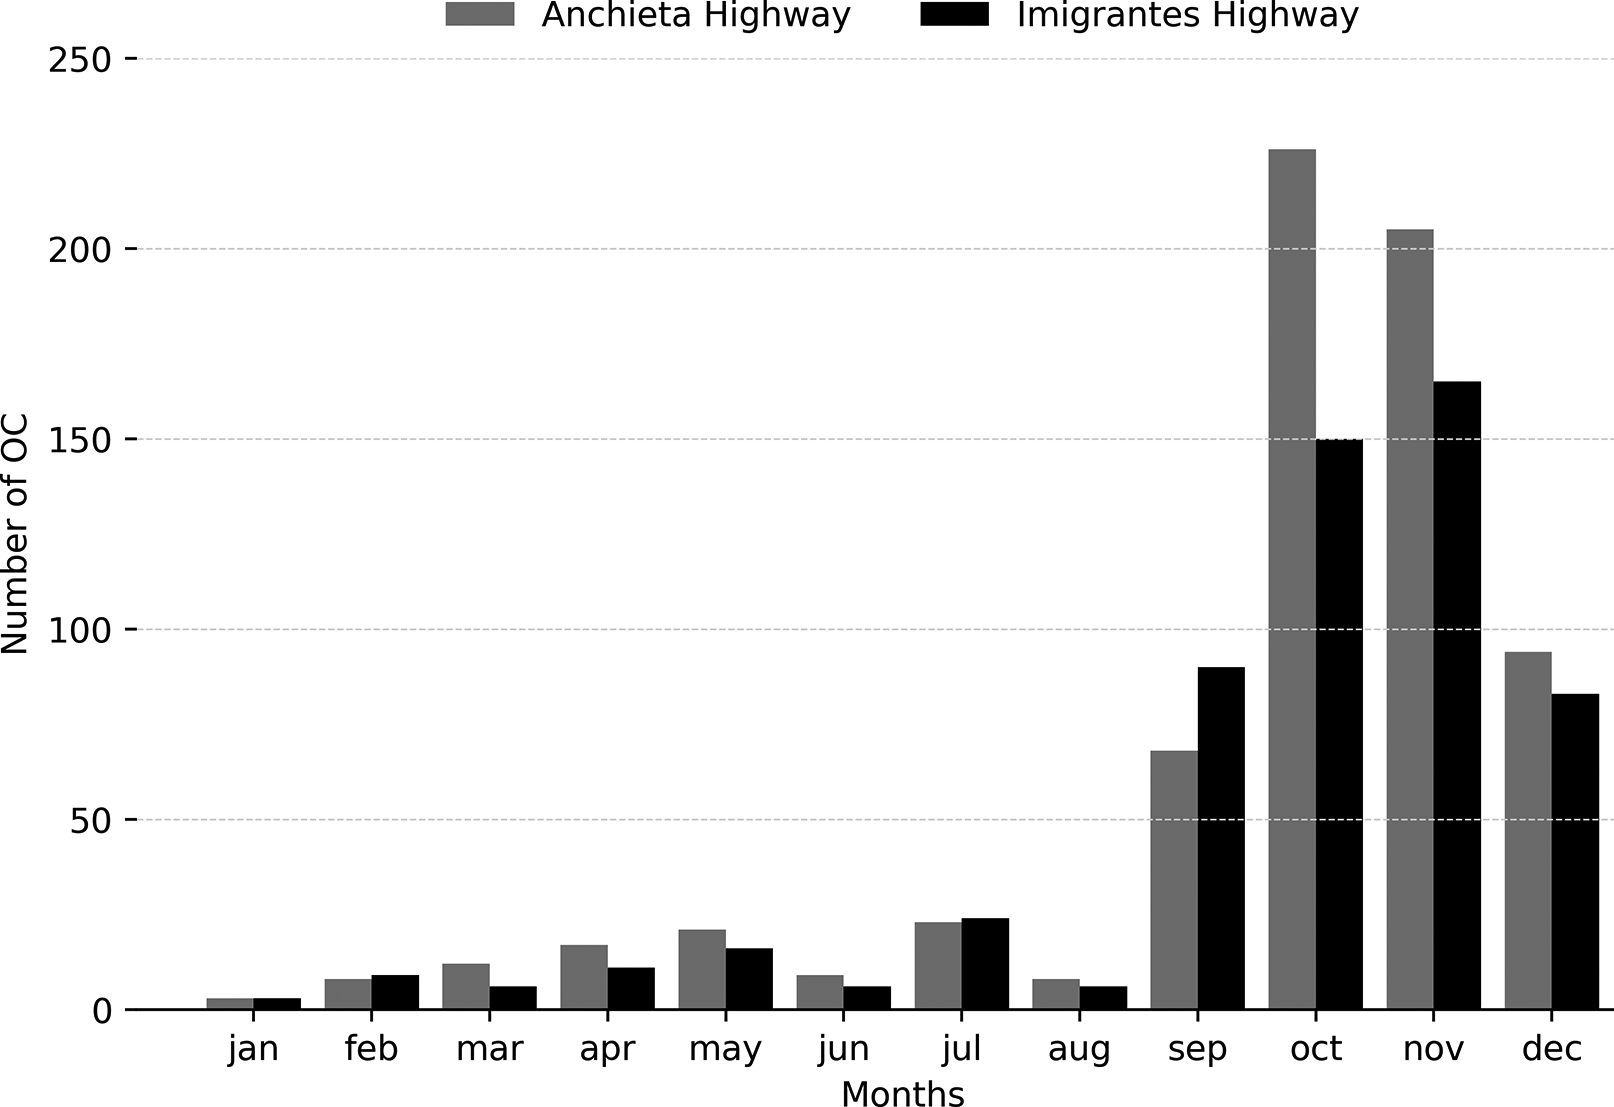
For the year 2015, the number of OCs was counted for each day on each highway. The monthly distribution of OC during that year is shown in Fig. 2, where the large number of cases at the end of the year from September to December stands out, reaching 226 (150) OCs in Anchieta Highway AH (Imigrantes Highway IH) in the month of October and 205 (165 in IH) in November. AH has higher accumulated OCs for most of the year, which is also due to the fact that the part of AH that is most affected by fog is in a valley region. There are cases, such as on September 14, where the difference between the number of OCs on the highways reached 15 operations (14 records - AH in 3 OCs and 29 records - IH in 1 OC).
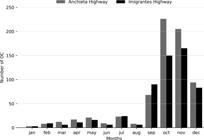
Monthly accumulation of OC in the year 2015 on the Anchieta Highway (gray) and Imigrantes Highway (black).
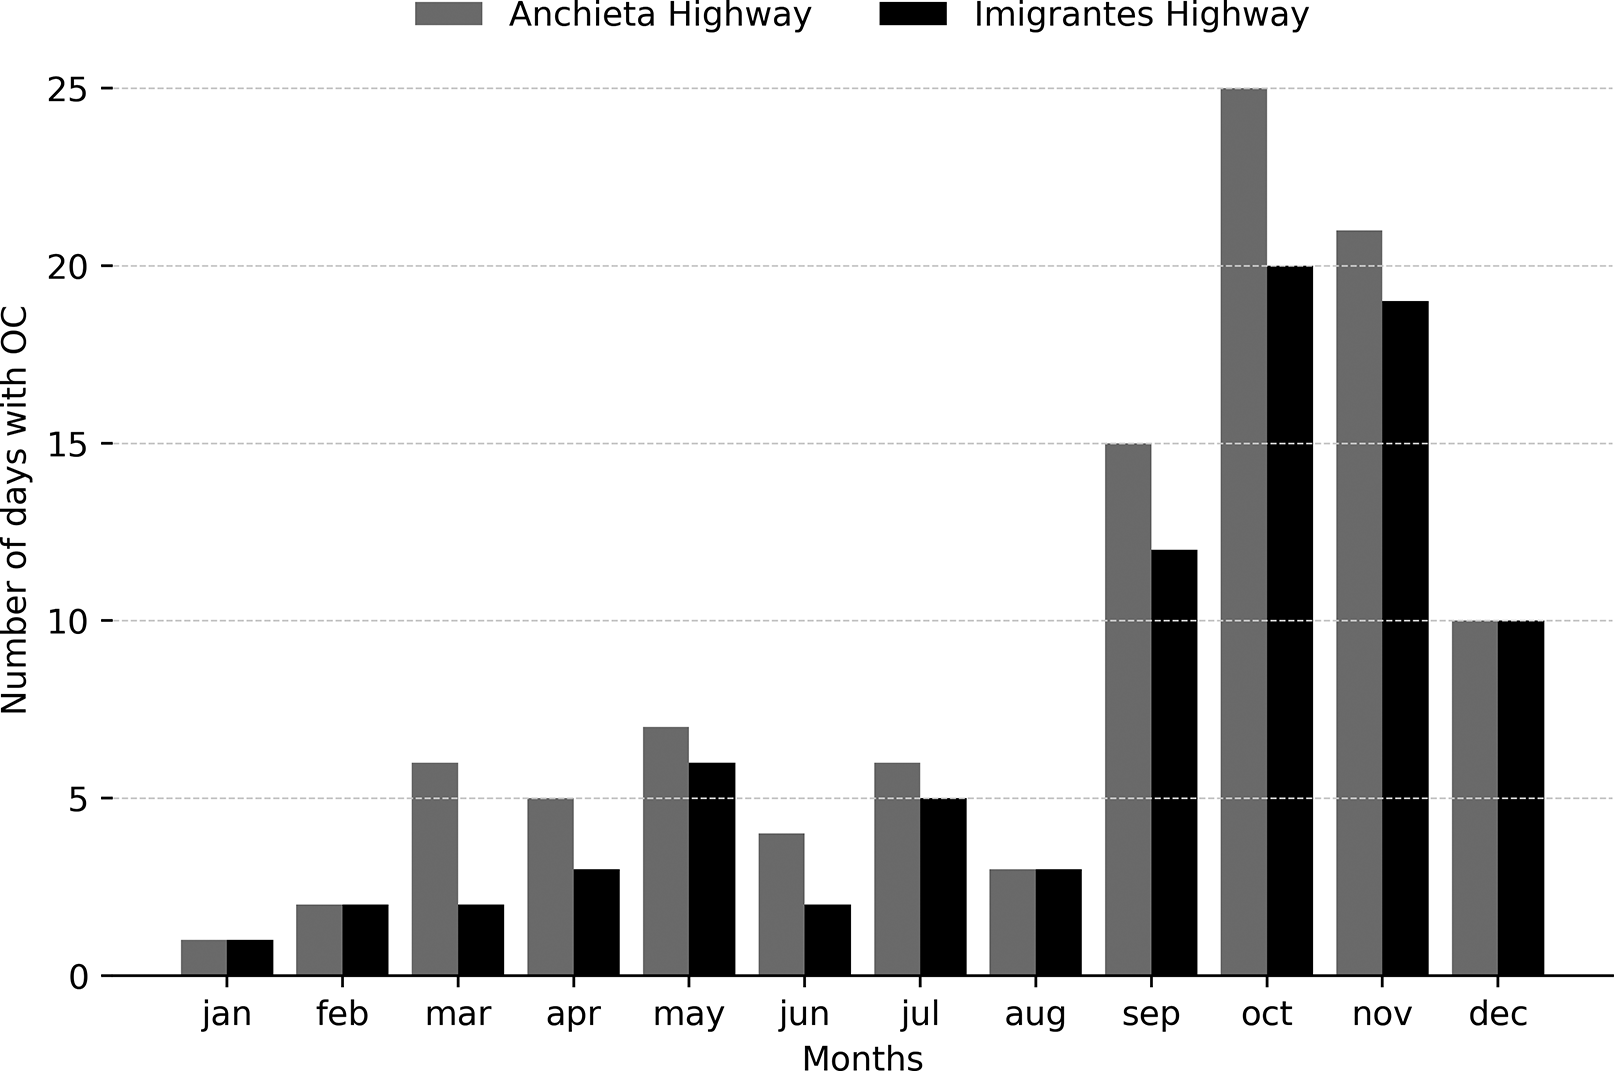
Note that on the same day, there may be several instances of OC. Fig. 3 presents the number of days with OCs for each month in 2015. It can be noted that the monthly distribution of days with OCs is similar to the accumulated number of OCs throughout the year.
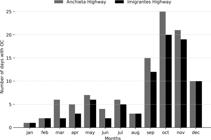
Monthly accumulation of days with OC on the Anchieta Highway (gray) and Imigrantes Highway (black) in the year 2015.
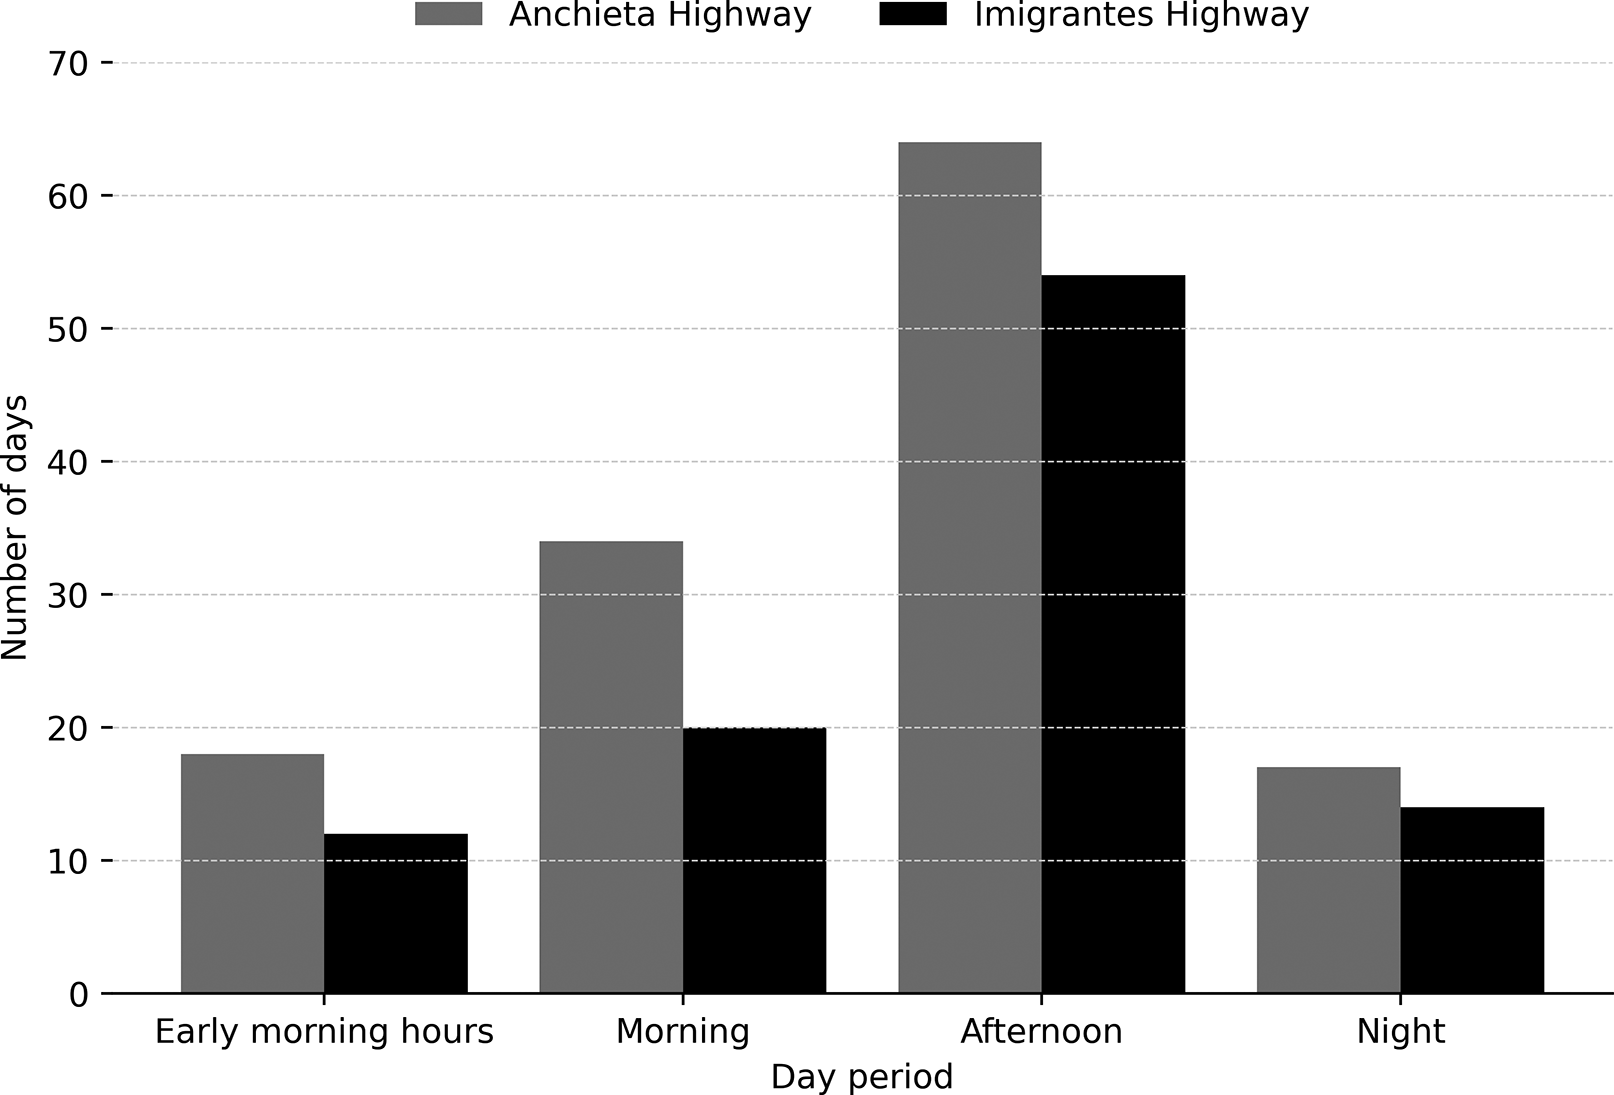
Using the OC data from ECOVIAS and observing the start and end times of the blockades, the continuous events of each day were separated by putting the initial and final hour for each event (Fig. 4). Thus, OCs were majorly found to start in the afternoon (64 in AH and 54 in IH), followed by the morning (34 in AH and 20 in IH), and during the early morning hours and night (between 12 and 17 OCs).
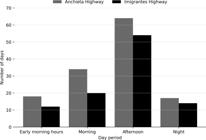
Number of days with OC starting in each time period of the day in 2015. Early morning hours: 00:00 to 05:59 LT; Morning: 06:00 to 11:59 LT; Afternoon: 12:00 to 17:59 LT and Night: 18:00 to 23:59 LT.
3.2. Detailed analysis
3.2.1. Meteorological systems associated with OC in AIS in 2015
Throughout 2015, approximately 130 OC were implemented on 106 days. For each OC, a synoptic and mesoscale analysis of meteorological data were performed, using satellite or radar images to identify the meteorological system associated with the start of the OC. Some OC that were implemented at different times but had the same cause were considered as a single event. OCs that were implemented only on one of the highways were discarded. After these considerations, 87 OC were considered for the year 2015.
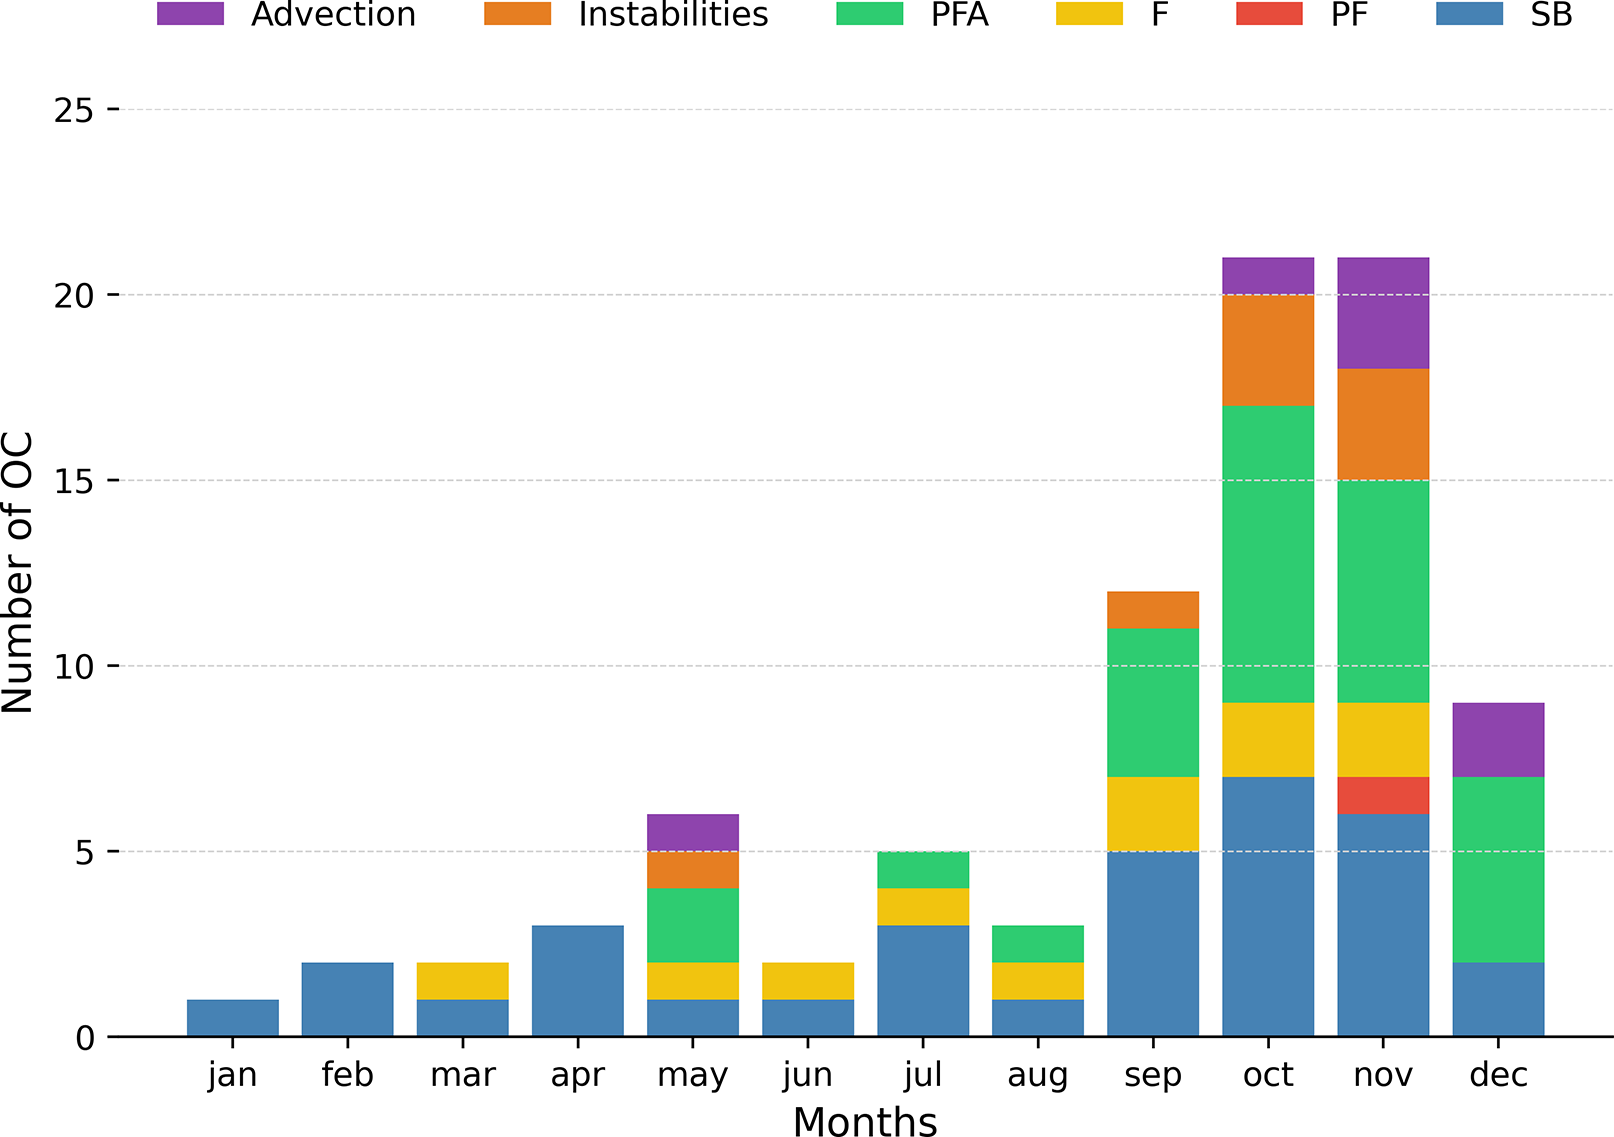
Analyzing synoptic and mesoscale maps, the following systems were identified (acronym from Fig. 5 and number of OC): Sea Breeze (SB, 33), Pre-frontal (PF, 1), Front (F, 11), Post-frontal anticyclone (PFA, 27), Instabilities associated with troughs, convective systems or convective rain (Instabilities, 8), Wind and moisture transport in an unidentified meteorologic system (Advection, 7). The SB influences throughout the year, appearing more frequently in the spring. This higher frequency of SB events in the spring can be attributed to the seasonal variability of the thermal gradient between the ocean and land. As described by Perez and Silva Dias (2017), the sea breeze tends to arrive earlier and exhibit a broader temporal distribution in the Austral Spring compared to other seasons, likely due to a stronger thermal gradient between the colder ocean (approximately 3.5 °C lower SST in spring than in summer) and the land. This enhanced thermal gradient strengthens the sea breeze circulation. The frontal system in its various stages (pre-frontal, front passage, and post-frontal) is the meteorological system that most appears associated with the OC, totaling 39 cases. In 2015, between April and December, between 4 and 5 cold fronts passed per month in the OC region (GREC, 2022). Its influence was greater from May, but its great participation, as well as SB, occurred in the spring.
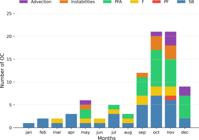
I. The entry of the SB occurs between 11:00 and 15:00 LT, but the OC only occurs after 1 to 3 h and generally lasts for 1 to 6 h (16 cases);
II. The entry of the SB occurs between 10:00 and 16:00 LT and the OC occurs shortly thereafter, lasting for a minimum of 5 h, reaching a maximum of 11 h (12 cases);
III. The entry of the SB occurs between 13:00 and 18:00 LT, but the OC only occurs after 9 pm, lasting between 3 and 6 h, with atmospheric saturation occurring due to both the moisture brought by the SB and nocturnal cooling.
I. The approach of the front (pre-frontal, 1 case) or the actual arrival of the front (10 cases) caused precipitation (up to 6.1 mm h-1 in Itutinga), which was the source of moisture for the generation of fog and, shortly thereafter, the implementation of the OC (duration between 3 to 13 h); 7 of them starting in the afternoon, the other 3 in the morning and the pre-frontal case, starting at early morning hours.
II. Southeast winds (from 0.4 to 1.6 m s-1) associated with the post-frontal situation, bringing moisture from the ocean to the Serra do Mar, added to the cooling of this synoptic situation, contributed to 26 cases of OC, lasting from 2 to 18 h. In most cases (25), precipitation was recorded in Itutinga during the OC (up to 3.8 mm h-1), and in 7 of these cases, rain was also recorded at IAG/MS. The onset period of the OC varied between early morning hours (4), morning (8), afternoon (10), and night (4).
In 7 cases of OC, it was not possible to identify any weather system, only a persistent moisture advection from the southern quadrant (1 from the South, 5 from the SE, and 1 from the SW), with winds between 0.7 and 1.3 m s-1 and precipitation recorded in Itutinga before the OC. Most of these OCs began in the morning period (05:00 to 09:00 LT), one started at 14:00 LT and another at 21:00 LT, with durations ranging from 3 to 17 h.
Finally, 8 cases of OC were associated with instabilities - convective storms associated with mid-level troughs (4) or mesoscale convective systems (4) that caused rain in the Serra do Mar or nearby, serving as a source of moisture for the fog. The onset times of the OC also varied, with 2 starting in the morning period, 3 in the afternoon, and 3 in the early morning hours.
Thus, it was not possible to separate the fogs into advective or radiative in the Serra do Mar. In most events, the importance of the Serra do Mar for the formation of orographic fog is noticeable; in others, the abundance of vegetation as a source of moisture is also noticeable, and finally, some fog events are more widespread, such as frontal fogs.
To understand the differences between the different classifications, case studies were carried out for the following days: July 21st (frontal fog), August 19th (orographic fog associated with the circulation of a front), September 14th (orographic fog associated with the circulation of an PFA), September 21st (orographic fog associated with the circulation of a SB), and November 23rd (orographic fog associated with instabilities) of 2015. This article details the case study of September 21st, initiated by the sea breeze - one of the most frequently observed systems. In topic 3 of the Detailed Analyses subsection of the Results, a summary of the other case studies’ conclusions is presented.
3.2.2. Case of September 21st: orographic fog + sea breeze (SB)
There were 7 (6) OCs in the AH (IH) in one period, from 14:00-20:00 LT on both highways, lasting six hours.
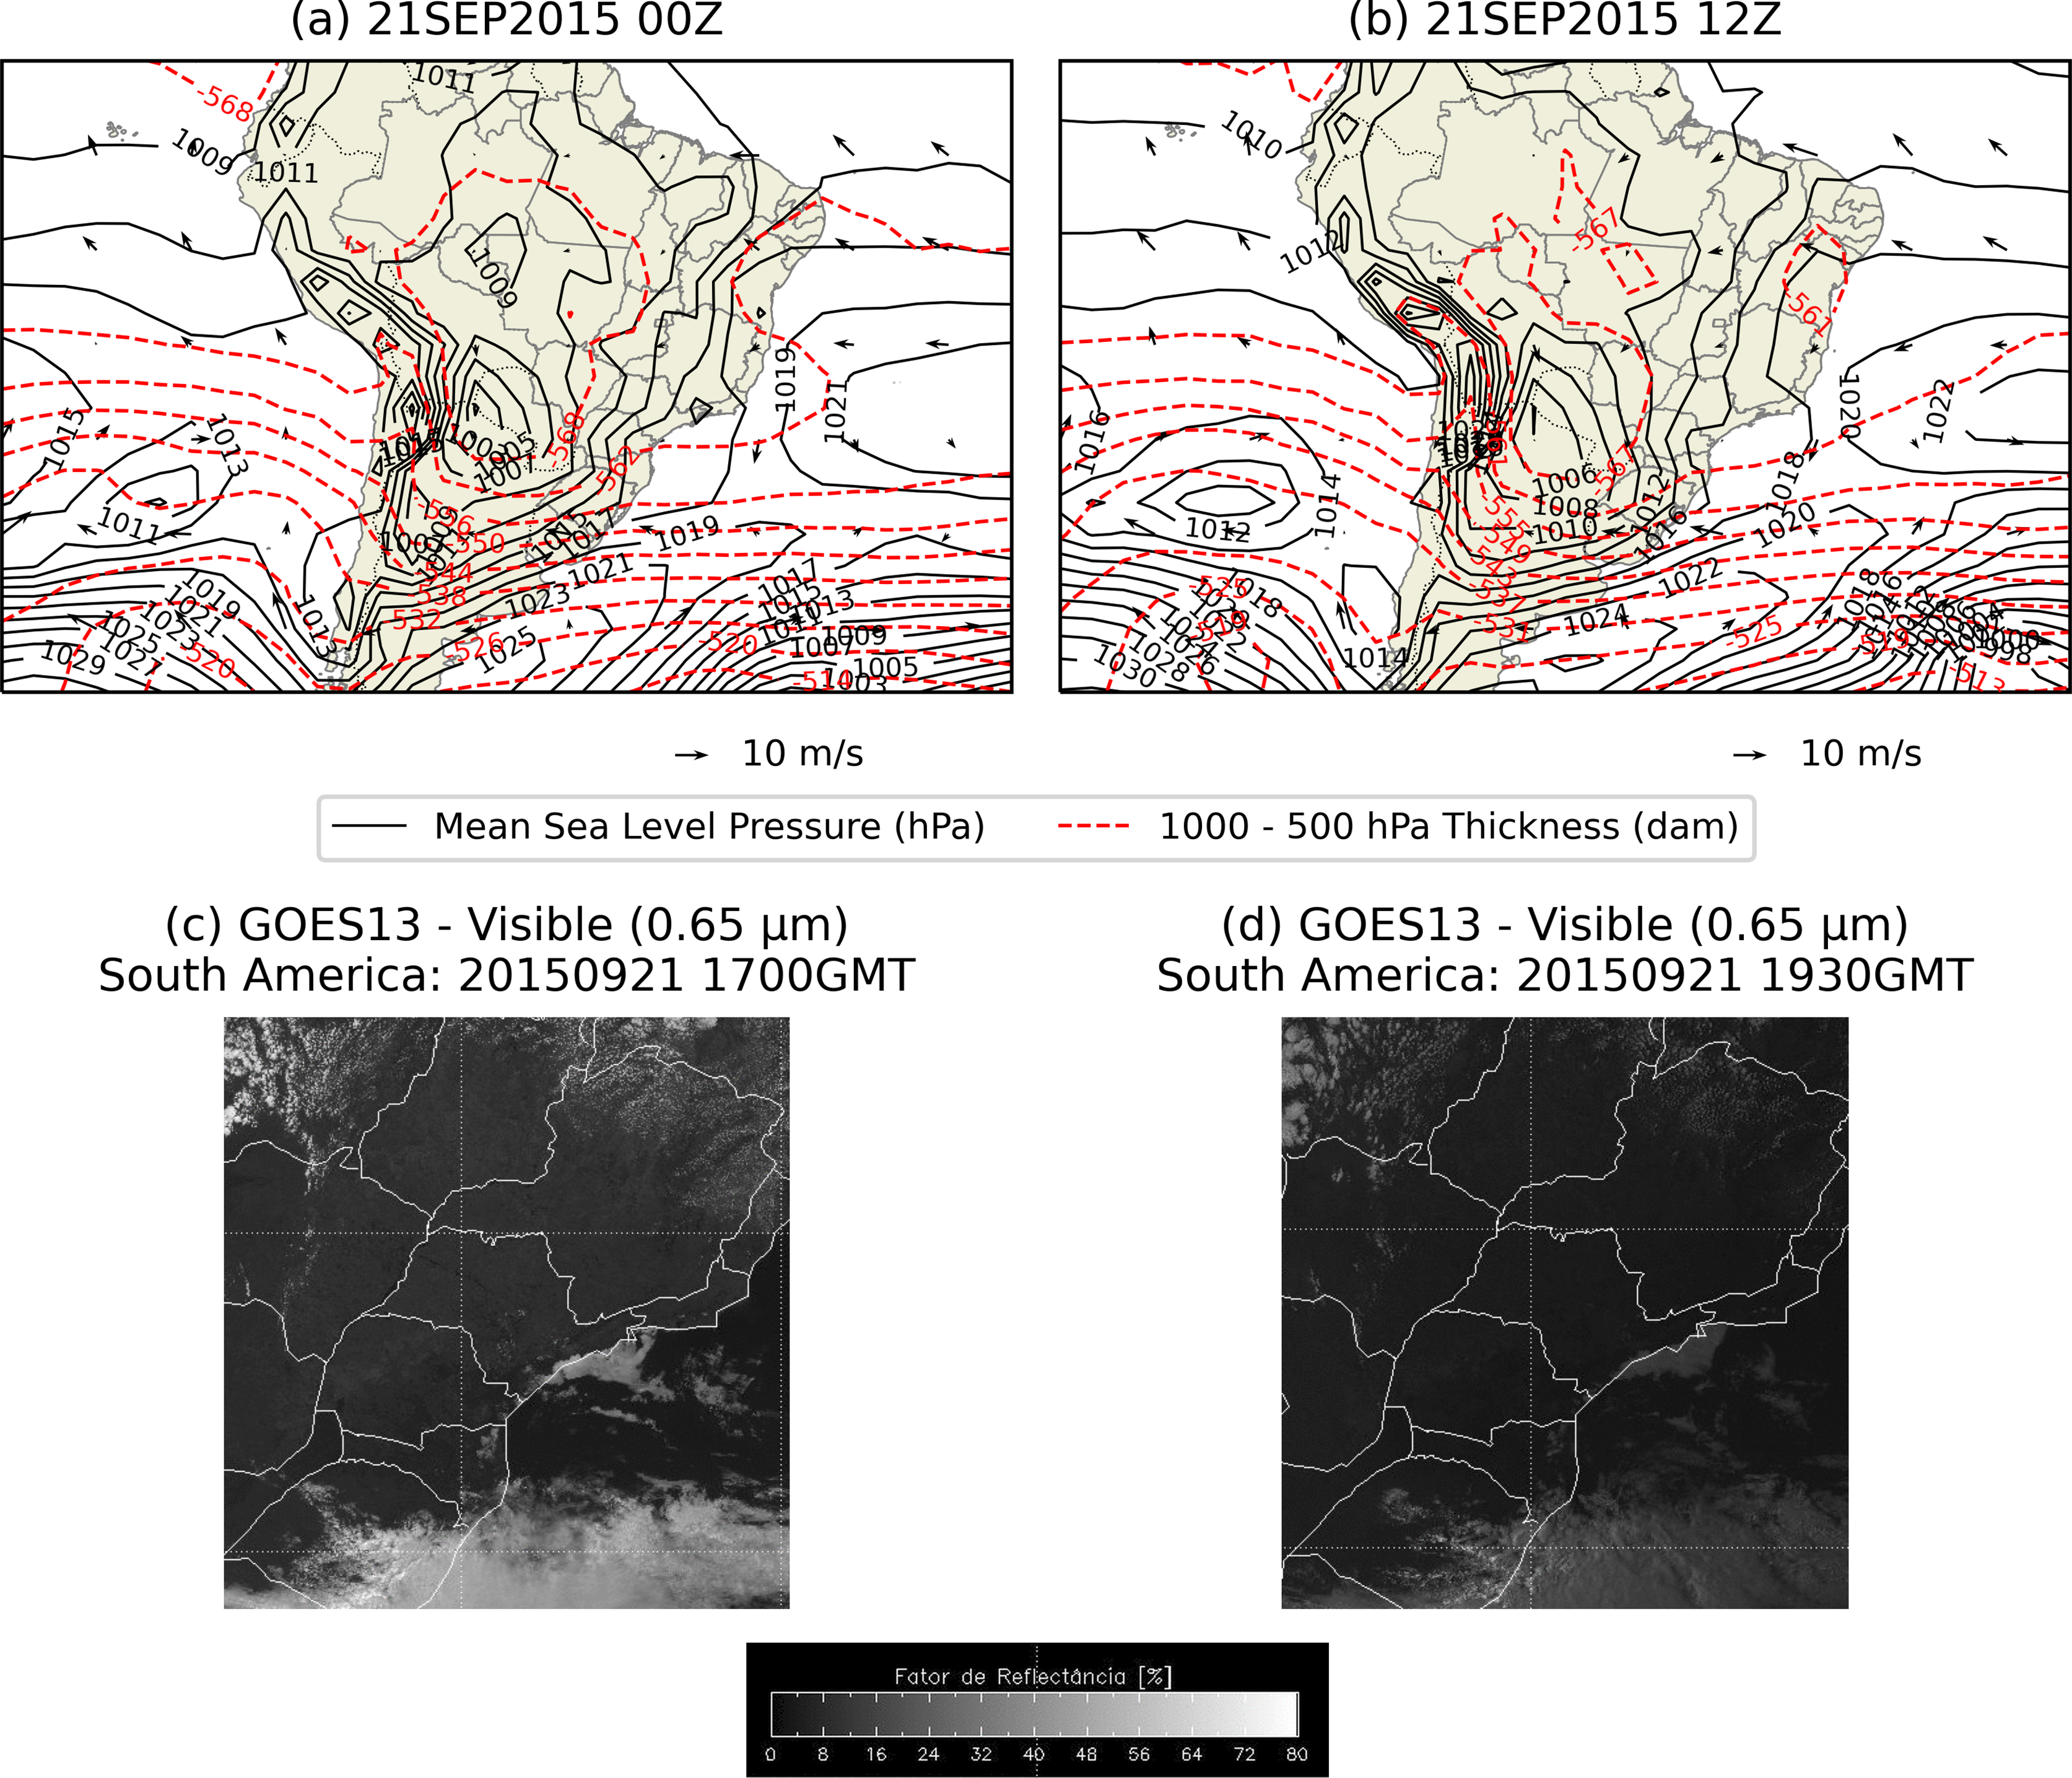
There is no synoptic system over the region on this day or the previous days, as shown by the synoptic chart (Fig. 6). In the visible channel satellite image, it is possible to see cloudiness on the coast and adjacent ocean of São Paulo with a smooth appearance and well-defined edges due to the topography (Fig. 6). In the radar images (not shown), the reflectivity is very weak at the beginning of the OC, indicating that there is no precipitation in the region.
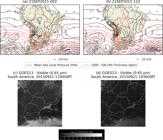
Surface synoptic charts for (a) September 19, 2015 at 21:00 LT and (b) September 20, 09:00 LT, and GOES-13 satellite visible channel images for (c) 14:00 LT and (d) 16:30 LT on September 21, 2015 (Adapted from CPTEC/INPE).
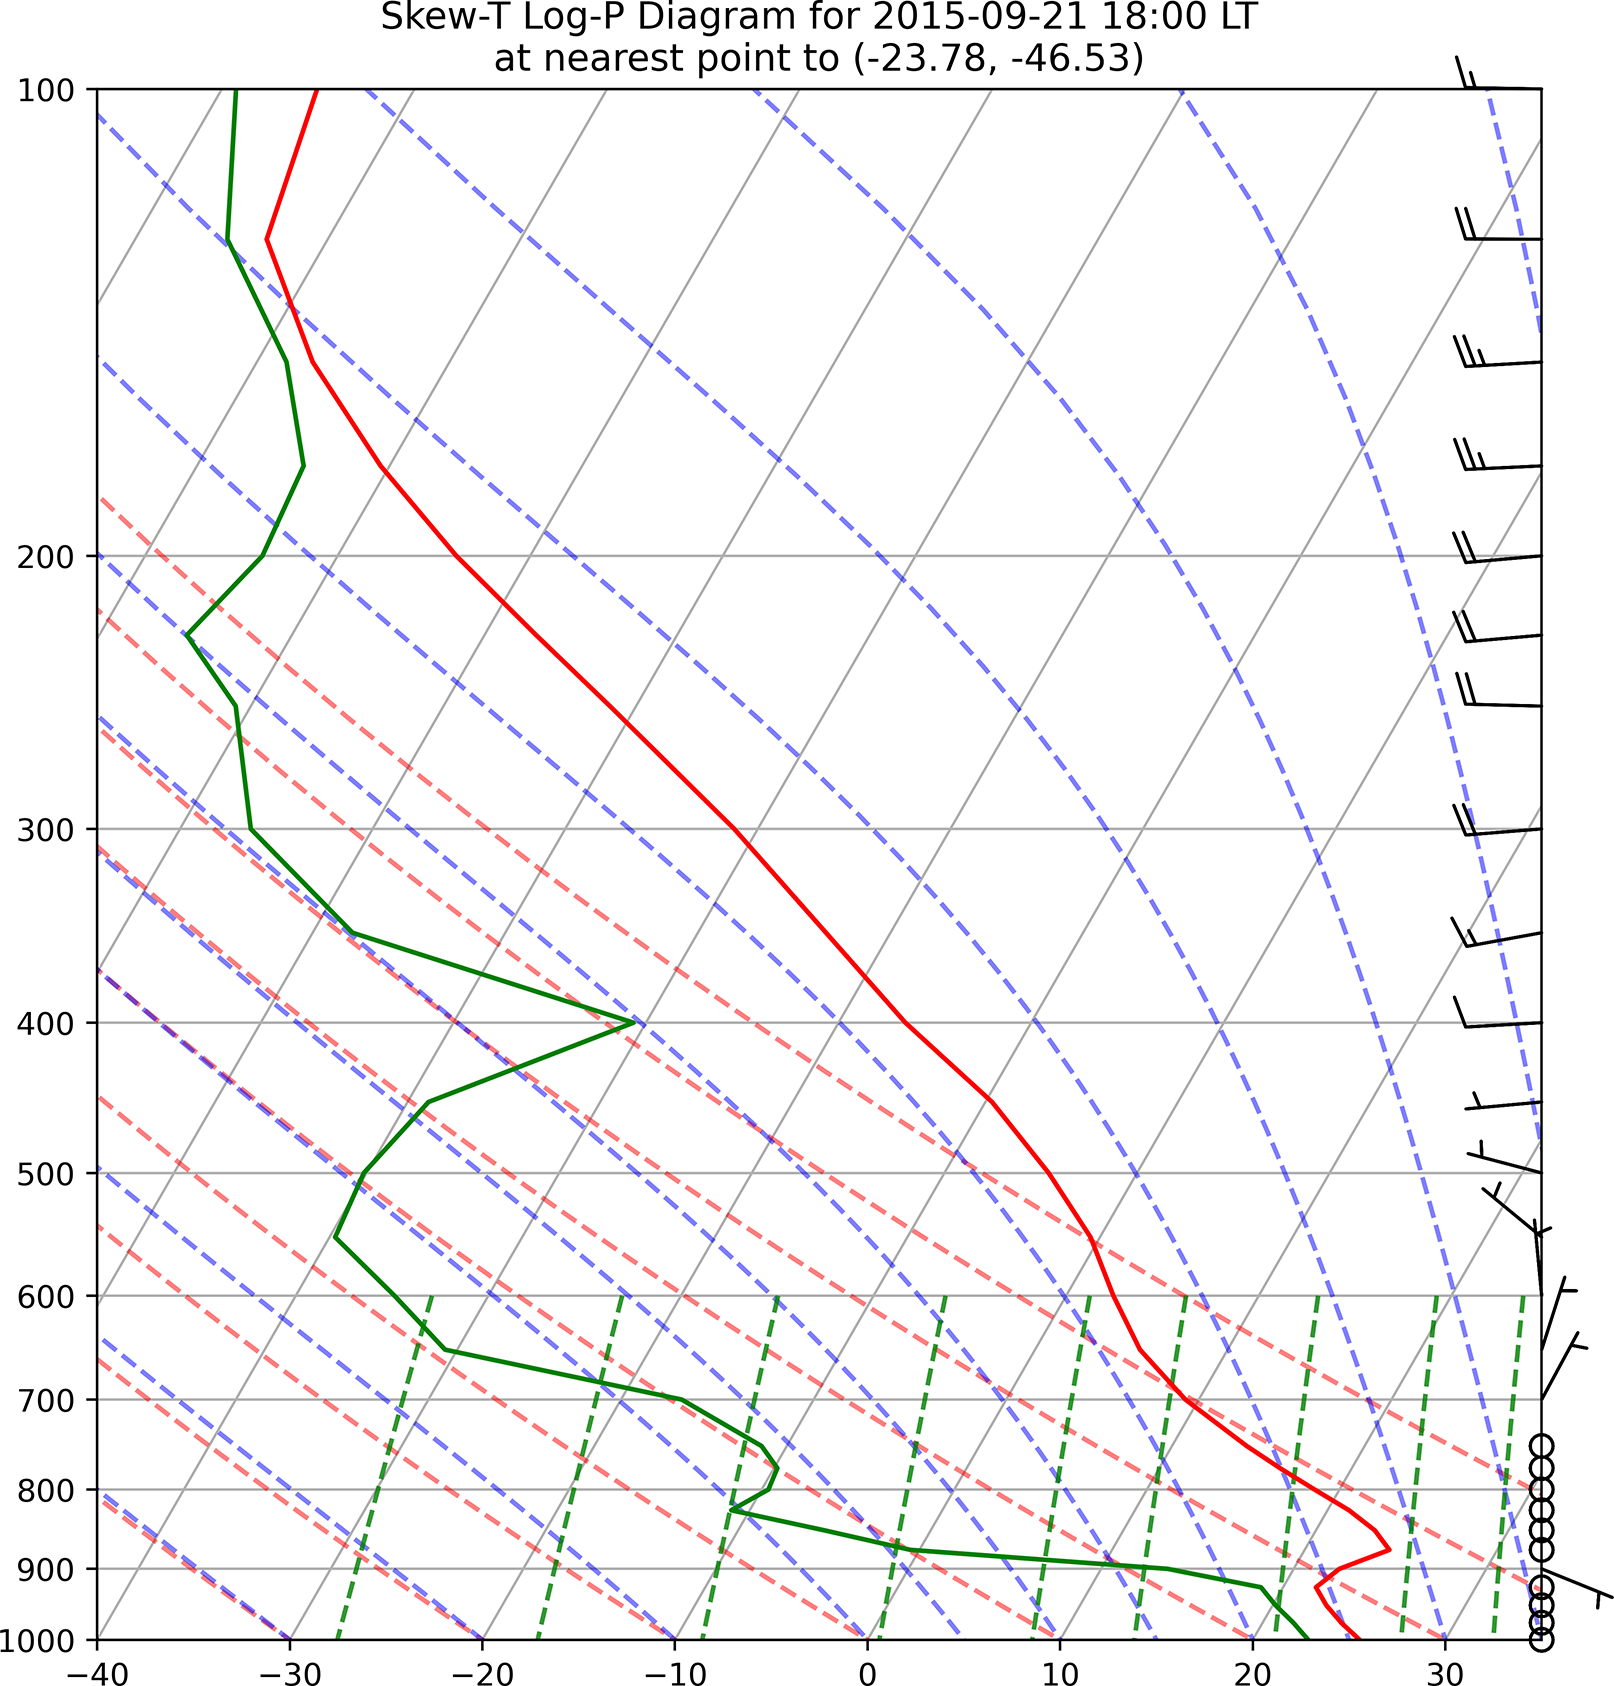
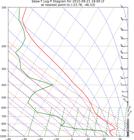
In the Skew-T Log-P diagrams derived from ERA5 data, favorable conditions for fog formation are indicated in the region of interest, situated at approximately 750 m altitude (925 hPa), between 14:00-20:00 LT on September 21, 2015. The analysis revealed an approximation of the temperature and dew point temperature lines, suggesting an increase in humidity from 16:00 LT, along with the presence of a temperature inversion above 925 hPa and a predominantly calm atmosphere between 1000-800 hPa (with weak winds of 2.5 ms-1 at 1000 and 900 hPa at 16:00 LT). This created a stable environment that traps moisture near the surface, which is essential for the development and maintenance of fog. From 19:00 LT, a wind of 2.5 ms-1 is observed between 900-800 hPa, indicating a slight dispersion of moisture and a potential dissipation of the fog. The Skew-T Log P thermodynamic diagram for 18:00 LT is presented in Fig. 7.
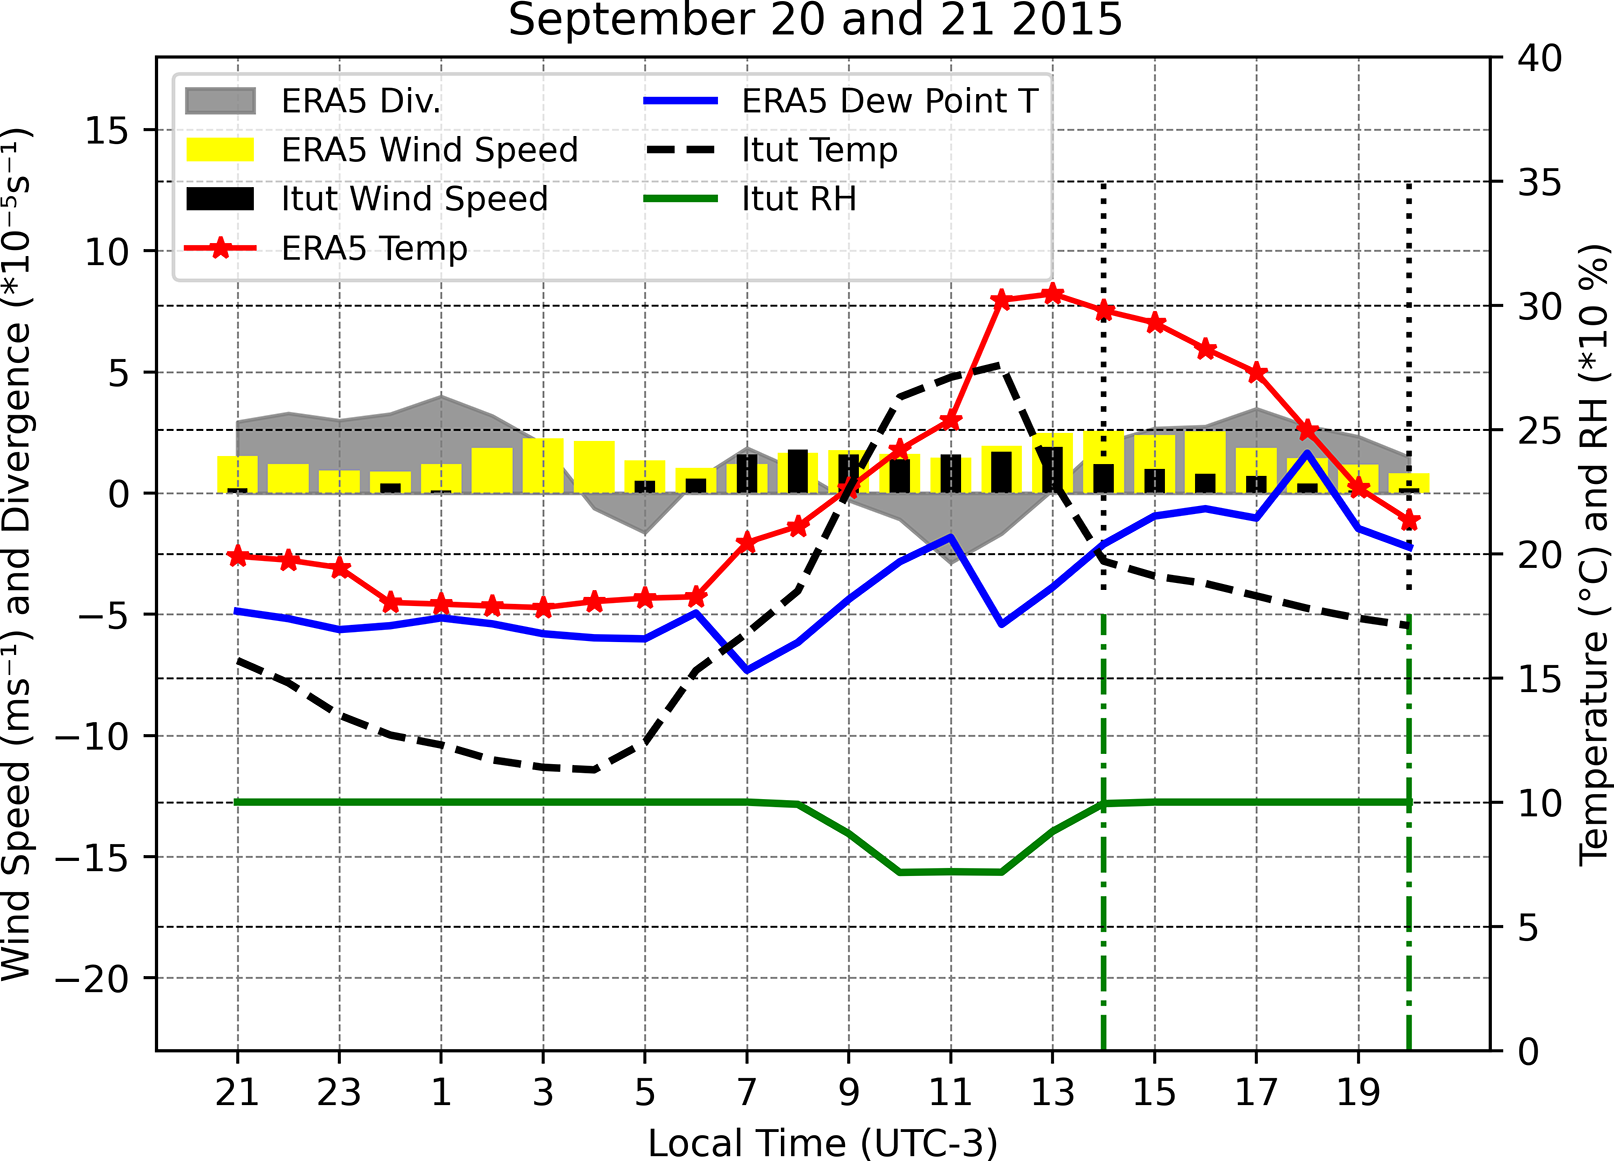
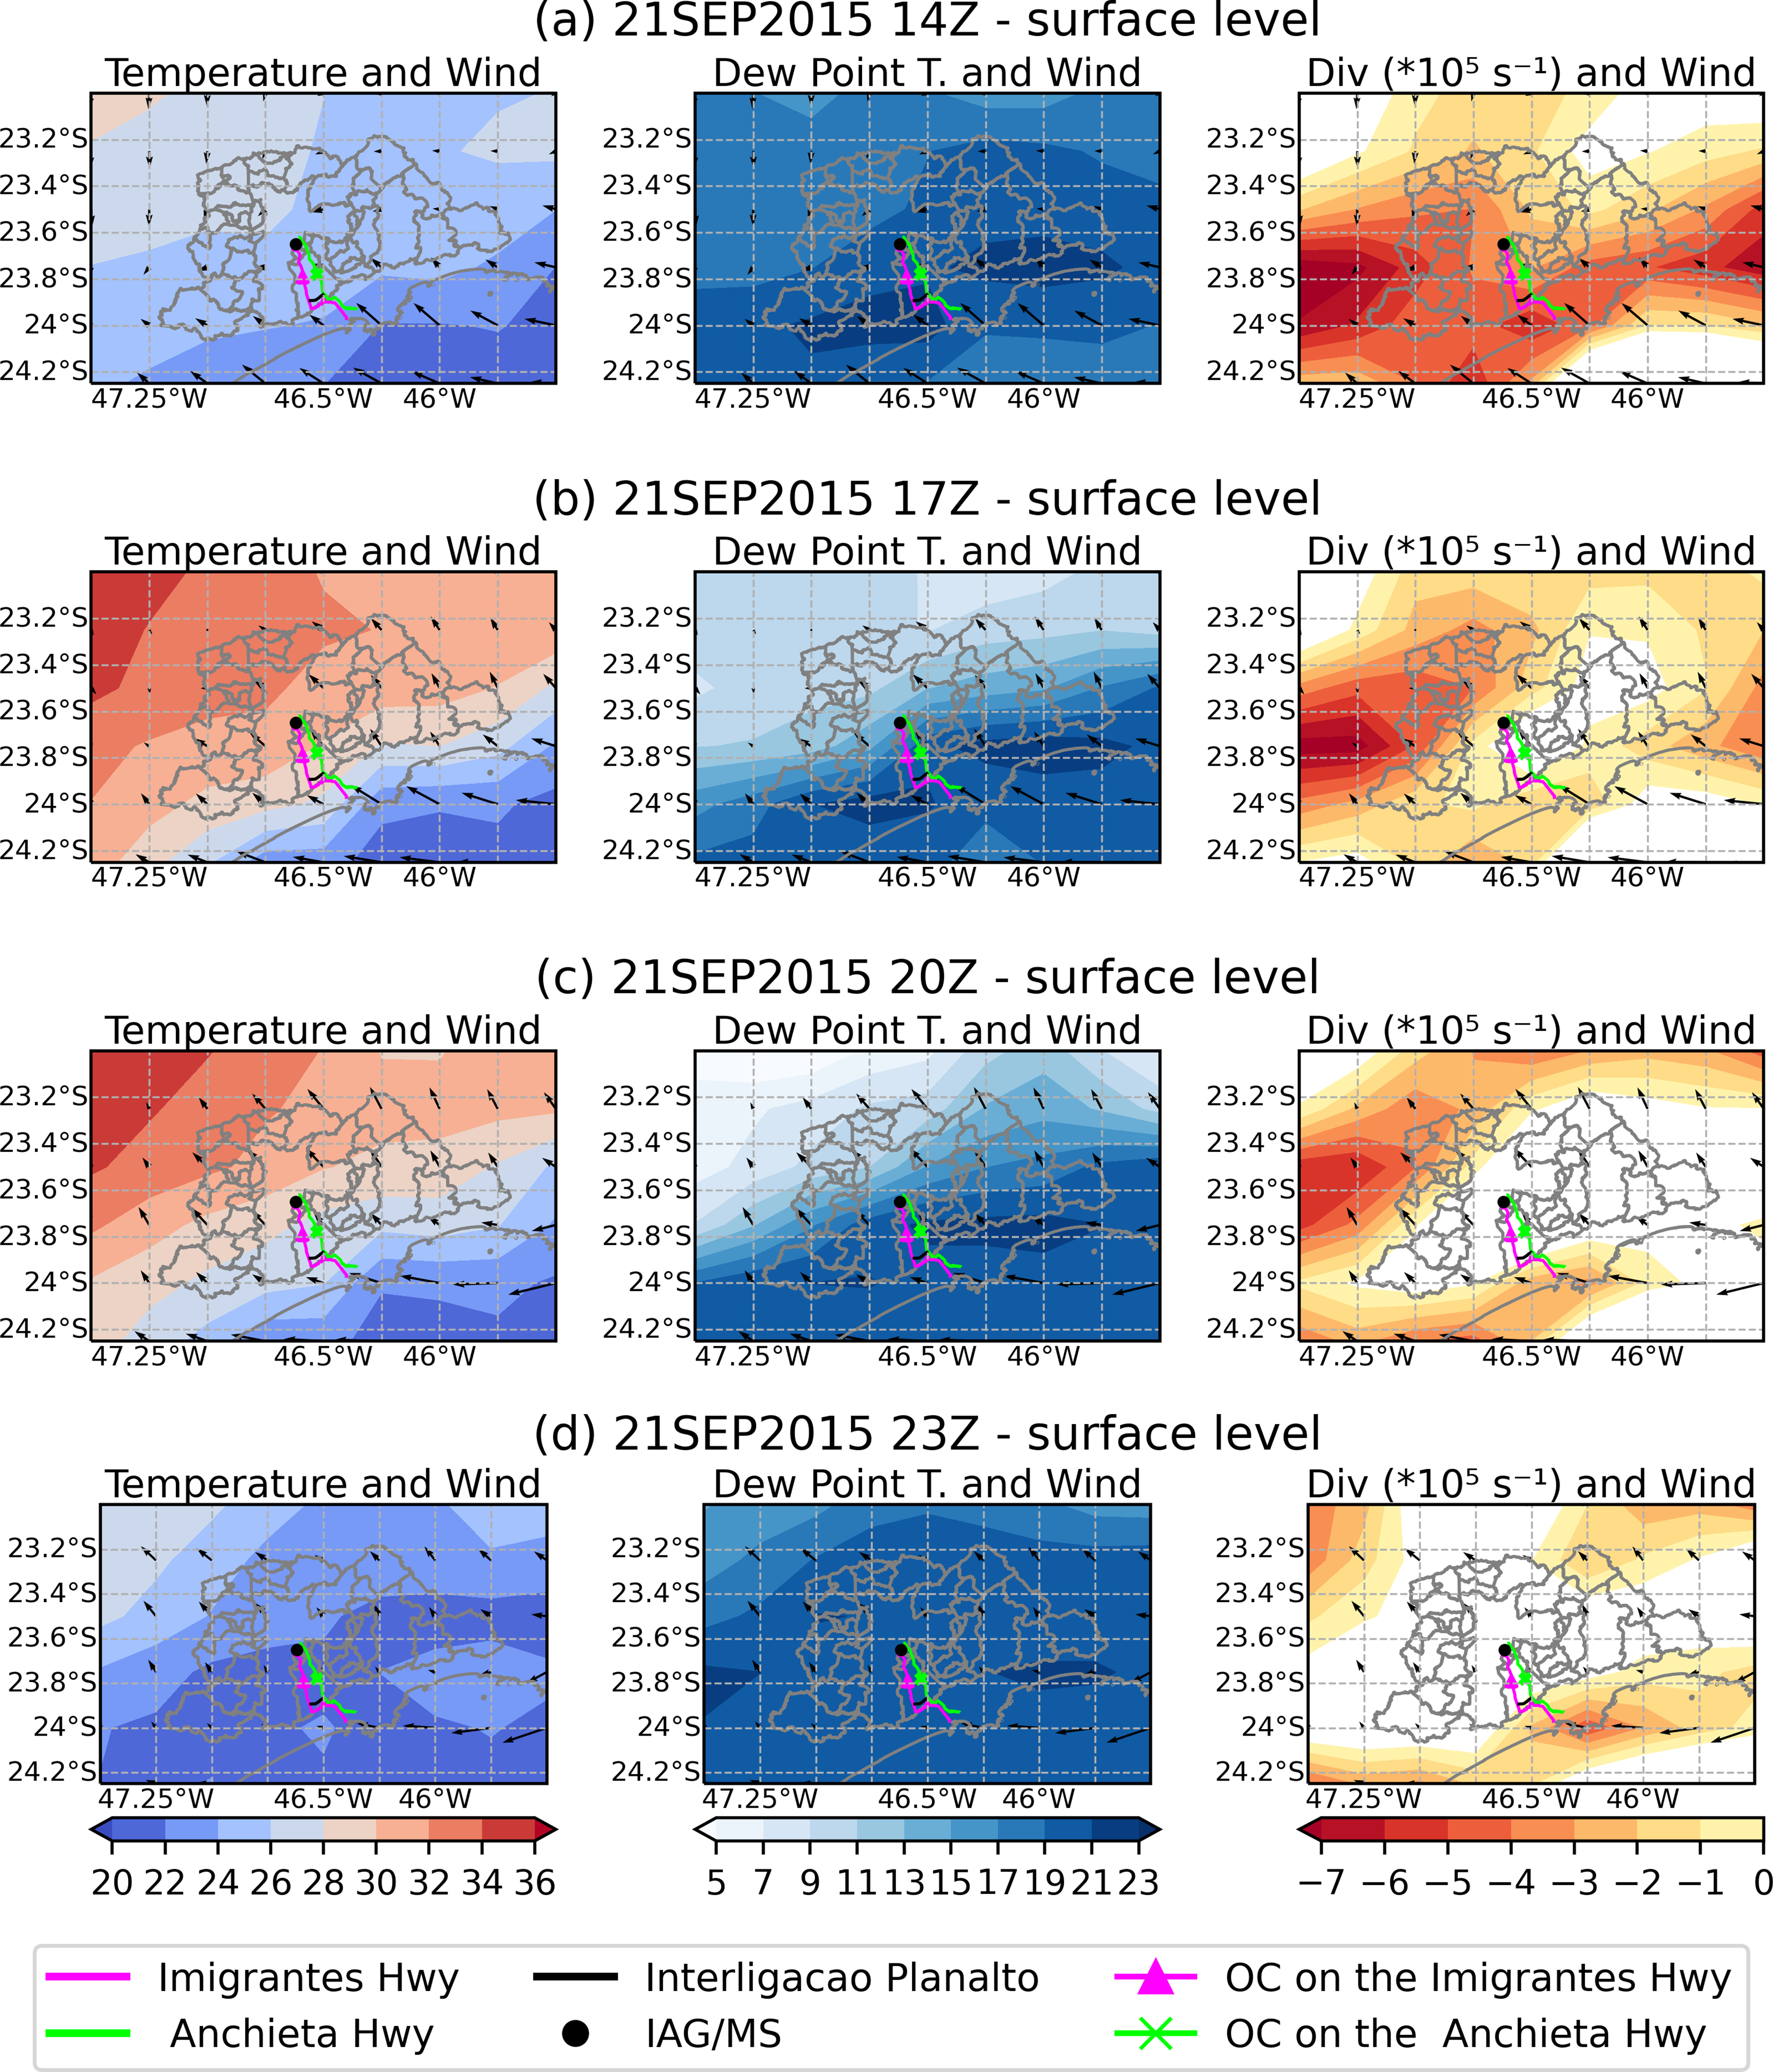
The data from the Itutinga/MS station (Table 1 and Fig. 8) show that the temperature increases from 8:30 LT until it reaches a maximum of 27.6 °C at 12:30 LT when the sea breeze passes through the station, turning and intensifying the wind from NE (during the morning period) to SE (from 12:30 LT onwards), a pattern already identified by Oliveira and Silva Dias (1982) as the entry of the sea breeze in São Paulo. The entry of maritime air is also noted by the increase in relative humidity, which reaches 99% at 14:30 LT, when the fog event begins. The winds weaken from 18:30 LT onwards, reducing the advection of moisture in the region, providing better visibility, and the end of the fog event at 20:00 LT. In METAR data, in Santos, there was a record of low cloudiness throughout the day. In Congonhas, the cloudiness was variable. However, the maximum temperature reached was 32 °C (with a dew point of 8 °C) at 15:00 LT. There was no precipitation recorded on this day, and therefore the OC was associated with reduced visibility caused by orographic fog, with the source of moisture being the SB. Many studies, such as Oliveira and Silva Dias (1982), have observed this same pattern in the characteristics of the entry of the sea breeze: an increase in wind intensity, a change in wind direction, a drop in temperature, and an increase in humidity.
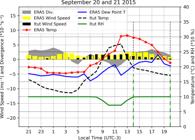
Temporal distribution of Temperature (°C) and wind speed (m s-1) variables from Itutinga/MS and ERA5 at 2 m, divergence (*10-5 s-1) and dew point temperature (°C) from ERA5, and relative humidity (%) from Itutinga/MS from September 20-21 LT to September 21-20 LT. The dashed black (green) line represents the start and end times of the OC event recorded on AH (IH).
The ERA5 maps (Fig. 9) corroborate the data in Itutinga/MS. The evolution of the fields of dew point temperature and wind between 09:00-18:00 LT is shown in Fig. 9 of ERA5. At 09:00 LT, winds are from the east throughout the region, with relatively high dew point temperatures. The entry of the SB in the OC region occurs from 12:00 LT, when it is also possible to notice the movement of moisture air into the continent. The OC is carried out before the descent of the Serra do Mar, a mountain range located near the coastal region, which causes the land-sea-breeze to combine with the valley/mountain circulation, intensifying the circulation associated with SB. In the afternoon, upslope winds assist the continental penetration of maritime air associated with SB. This, combined with the general flow towards the continent, sometimes results in the penetration of maritime air over a larger area (~100 km). This occurs along most of the eastern coast of Brazil and can be observed on the 15:00 and 18:00 LT charts. At the latter time, there is a decrease in winds closer to the coast, which should have also reduced moisture advection in the region and favored the end of OC at 20:00 LT.
Dew was recorded at IAG/MS at 20:00 LT on the 21st and at 07:00 LT on the 22nd (there is no start time due to the observer's work schedule).
Therefore, the decrease in visibility on this day was caused by orographic fog, with moisture advection due to SB.
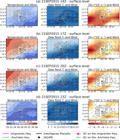
Temperature (°C, color), wind (m s-1, vector), dew point temperature (°C, color), wind (m s-1, vector), and divergence (*10-5 s-1, color), and wind (m s-1, vector) fields from ERA5 for (a) 11:00, (b) 14:00, (c) 17:00, and (d) 20:00 LT on September 21, 2015.
3.2.3. Conclusions of the 2015 case studies
The year 2015 was a strong El Niño year, and sea surface temperature (SST) in the Atlantic Ocean adjacent to the state of São Paulo was also anomalously warmer, with an average SST anomaly of +1 °C in 2015 relative to the 1981-2010 baseline period (NOAA, 2016). Consequently, the evaporation of ocean waters increases, elevating the amount of water vapor available in the air. In addition, the diurnal cycle of heating and cooling of the slopes of the Serra do Mar favors the formation of the mountain-valley breeze, and the temperature contrast between the ocean and the maximum temperature of the continent provides the configuration of the SB system (more intense and frequent in the second half of the year - spring and summer - Oliveira and Silva Dias 1982), which carries moisture into the continent. This SB reached the plateau in some OC cases, but it did not always reach Greater São Paulo, in the case of IAG/MS.
According to the 2015 annual climatological bulletin from IAG/MS, all months of 2015 presented monthly average air temperatures higher than normal, with January, July, August, September, October, November, and December standing out with values more than 10% above their monthly averages. The annual average temperature (20.4 °C) and the annual average minimum temperature (16.3 °C) were also the highest ever recorded since the beginning of OC at IAG/MS in 1933. In IAG/MS, absolute monthly records were broken on January 19th, 2015: 36.2 °C (the previous record was on January 3rd, 2014, 36.1 °C); August 31st, 2015: 33.2 °C (the previous record was on August 31st, 1963, 3.3,0 °C); and September 24th, 2015: 36.1 °C (the previous record was on September 27th, 1988, 35.3 °C). The highest temperature recorded in 2015 was 36.4 °C on October 15th, and the lowest temperature recorded was 8.2 °C on July 27th. Higher temperatures on the continent favor more SB events, which in turn, favor the formation of fog on the Serra do Mar.
In IAG/MS, 2015 was also a rainy year, with a total accumulated rainfall of 1829.4 mm, which is 30% above the climatological average from 1933 to 2015. The rainiest months in 2015 were January, February, March, July, September, and November, with more than double the respective climatological averages in July, September, and November. In November, 28 rainy days were recorded.
The passage of frontal systems was also relevant for the formation of fog in the Serra do Mar region. Climatology indicates that the frequency of these systems passing over the state of São Paulo is higher in the spring (Cavalcanti and Kousky, 2009), as well as OCs. Morais et al. (2010) counted the number of cold fronts passing through the Metropolitan Region of São Paulo: on average, 3 cold fronts per month, with higher frequency in the months of April, August, September, and October (3.5 cold fronts per month). In 2015, between April and December, between 4 and 5 cold fronts passed through the region of the Anchieta-Imigrantes System (GREC, 2022). This greater quantity of cold fronts throughout 2015 implies a higher number of situations where the PFA predominates in the region, which also favored the large number of implemented OCs in that year.
Further examination of additional OC cases across different years to capture variability and enhance predictive accuracy.
Investigating the correlation between pollution and fog in the Serra do Mar, elucidating the intricate interactions between atmospheric constituents and fog formation processes.
In-depth exploration of microphysical processes governing fog formation and evolution to unravel the underlying mechanisms driving these phenomena.
Detailed examination of wind circulation patterns and fog occurrence in the Serra do Mar, providing insights into the dynamic interplay between atmospheric dynamics and local topography.
Developing fog models specific to the unique characteristics of the Serra do Mar region, leveraging advances in modeling techniques and observational data.
Employing artificial intelligence for fog prediction in this area, harnessing the power of machine learning algorithms to improve forecasting accuracy and reliability.
By addressing these research avenues, it is possible to advance the understanding of the variables modulating fog in the Serra do Mar, thereby facilitating more effective mitigation strategies and enhancing societal resilience to fog-related disruptions.
The number of OCs to be carried out must take into account not only the meteorological systems that decrease visibility and therefore induce fog formation but also traffic, traffic volume - which increases significantly during holidays - accidents, road closures, among others.
4. Conclusions
In this work, analyses were made of the meteorological systems associated with the fog events that triggered the Operação Comboio in the Anchieta-Imigrantes System in 2015.
The OC (Operação Comboio) occurs more frequently in spring and is more common on the Anchieta Highway when compared to the Imigrantes Highway. From 2012, there were, on average, approximately 568 OCs on the Anchieta Highway and 423 on the Imigrantes Highway. According to AIS operators, there is a tendency for an increase in OCs in recent years, although the sample provided is small to make this type of statement. There are more OCs starting in the afternoon, followed by the night period. Of the 87 OCs studied for the year 2015, SB contributed in 38% of cases, followed by PFA, with 31%. Although it is possible to identify the meteorological system associated with the start of the OC, it is not always possible to determine what actually generated the fog. In general, moisture is supplied by advection of moisture from the SB or the PFA, and sometimes from some precipitating system resulting from the passage of a frontal system or some thermodynamic instability. This input of moisture is added to the temperature decrease caused by the entry of the SB, the post-frontal air, or even the loss of nighttime radiation. These aspects were all identified at the beginning and during the OCs. However, the same patterns were identified on other occasions when OCs were not implemented. São Paulo Metropolitan Area is known for its high air pollution episodes and, according to Shao et al. (2023), increased aerosol concentration can significantly influence the microphysical and radiative evolution of fog. This aerosol loading and fog evolution should be better studied in the future. This shows the complexity of fog formation and dissipation in the Serra do Mar, leaving predicting both the onset and the end of an OC as a real challenge.
The findings regarding the relationship between fog events and the implementation of Operação Comboio have crucial implications for road traffic management, especially during periods of increased occurrence, such as spring. Understanding the seasonal patterns and specific meteorological conditions that trigger these events allows for better resource allocation and strategic planning by the authorities responsible for traffic management. For instance, during spring, when the incidence of OC is more common, proactive measures can be taken, such as increasing personnel availability for monitoring and quick response to fog events, as well as implementing more effective communication strategies to inform drivers about road conditions, thereby reducing the need for prolonged traffic interruptions.
This deeper understanding underscores the need for a more sophisticated approach to forecasting and responding to these adverse weather events. The development of predictive models based on specific meteorological conditions can provide a valuable tool for traffic management, enabling a more proactive and effective response to the occurrence of dense fog.
In summary, the detailed analysis of specific meteorological conditions that trigger Operação Comboio not only improves road safety but also has the potential to optimize traffic management, reducing negative impacts on highway users and contributing to a more satisfactory experience.
Acknowledgments
We would like to express our gratitude to IAG/MS and LAbMicro for providing meteorological data, to Ecovias for sharing the data recorded at their stations and for hosting us at their headquarters to provide insights into the Operational Center (OC) and its logistics. We extend our thanks to the Brazilian Navy and CPTEC-INPE for the provided synoptic charts, to REDEMET for the METAR and radar data, to the University of Wyoming for the availability of atmospheric radiosonde results, and to ECMWF for the ERA-Interim and ERA5 reanalyses used in this study. Additionally, we appreciate the financial support from the Coordenação de Aperfeiçoamento de Pessoal de Nível Superior (CAPES), grant number 88887.334460/2019-00, which facilitated the development of this research.
References
-
ABC do ABC. Mudanças na Operação Comboio 2018. Available in https://abcdoabc.com.br/mudancas-na-operacao-comboio/, accessed 18/12/ 2023.
» https://abcdoabc.com.br/mudancas-na-operacao-comboio/ - ALMEIDA, F.F.M.; CARNEIRO, C.D.R. Origem e evolução da Serra do Mar. Rev. Bras. Geociênc., v. 28, n. 2, p. 135-150, 1998.
- ARMANI, G; FUNARI, F.L; HAEGELY, M.E. Frequência de Nevoeiro na Cidade de São Paulo. In: Anais do IX Simpósio Brasileiro de Climatologia Geográfica, Fortaleza, p. 1-15, 2010.
- CAVALCANTI, I.F.A.; KOUSKY V.E. Frentes frias sobre o Brasil. In: Tempo e Clima no Brasil São Paulo: Oficina de Texto, p. 135-148, 2009.
-
CPTEC - Centro de Previsão de Tempo e Estudos Climáticos. Glossários Available in https://www.cptec.inpe.br/glossario.shtml#n, accessed 18/3/2023.
» https://www.cptec.inpe.br/glossario.shtml#n -
CROFT, P.J.; PFOST, R.L.; MEDLIN, J.M.; JOHNSON, G.A. Fog forecasting for the southern region: A conceptual model approach. Wea. Forecasting, v. 12, n. 3, p. 545-556, 1997. doi
» https://doi.org/10.1175/1520-0434(1997)012<0545:FFFTSR>2.0.CO;2 - DA SILVA, O.A. Nevoeiro e Nuvem Estratos no Brasil: Observação, Sensoriamento Remoto e Simulação Numérica Ph.D. Thesis, Universidade de São Paulo, São Paulo, 2018.
-
DEE, D.P.; UPPALA, S.M.; SIMMONS, A.J.; BERRISFORD, P.; POLI, P.; et al. The ERA-Interim reanalysis: configuration and performance of the data Assimilation system. Quarterly J. Royal Meteor. Soc., v. 137, n. 656, p. 553-597, 2011. doi
» https://doi.org/10.1002/qj.828 - FRANçA, V.D.J. Avaliação da Metodologia de Previsão de Nevoeiro e Visibilidade Horizontal do Modelo Eta Ph.D. Thesis, Instituto Nacional de Pesquisas Espaciais, São José dos Campos, 2008.
-
GREC - Grupo de Estudos Climáticos. Monitoramento Climático - Frentes Frias Available in http://www.grec.iag.usp.br/data/frentes-frias_BRA.php, accessed 26/3/2022.
» http://www.grec.iag.usp.br/data/frentes-frias_BRA.php -
HAEFFELIN M.; BERGOT T.; ELIAS T.; TARDIF R.; CARRER D.; et al. PARISFOG: Shedding new light on fog physical processes. Bull. Amer. Meteor. Soc., v. 91, n. 6, p. 767-783, 2010. doi
» https://doi.org/10.1175/2009BAMS2671.1 -
HERSBACH, H.; BELL, B.; BERRISFORD, P.; HIRAHARA, S.; HORáNYI, A.; et al. The ERA5 global reanalysis. Quarterly J. Royal Meteor. Soc, v. 146, n. 730, p. 1999-2049, 2020. doi
» https://doi.org/10.1002/qj.3803 - MORAIS, M.A.; CASTRO, W.A.C.; TUNDISI, J.G. Climatologia de frentes frias sobre a Região Metropolitana de São Paulo (RMSP), e sua influência na limnologia dos reservatórios de abastecimento de água. Rev. Bras. Meteorol., v. 25, n. 2, p. 205-217, 2010.
-
NOAA - National Centers for Environmental Information. Monthly Global Climate Report for Annual 2015 Available in https://www.ncei.noaa.gov/access/monitoring/monthly-report/global/201513, accessed 25/10/2024.
» https://www.ncei.noaa.gov/access/monitoring/monthly-report/global/201513 - OLIVEIRA, A.P.; SILVA DIAS, L. Aspectos observacionais da brisa marítima em São Paulo, In: II Congresso Brasileiro Meteorologia, Pelotas, p. 129-161, 1982.
- PEREZ, G.M.P.; SILVA DIAS, M.A.F. Long‐term study of the occurrence and time of passage of sea breeze in São Paulo, 1960-2009. Int. J. Climatol. v. 37, p. 1210-1220, 2017.
-
PORTO DE SANTOS. Porto de Santos Completa 127 Anos 2019. Avaiable in https://www.portodesantos.com.br/2019/01/25/porto-de-santos-completa-127-anos/, accessed 18/12/2023.
» https://www.portodesantos.com.br/2019/01/25/porto-de-santos-completa-127-anos/ - REYMANN, M.; PIASECKI, J.; HOSEIN, F.; LARABEE, S.; WILLIAMS, G.; JIMENEZ, M.; CHAPDELAINE, D. Meteorological Techniques (AFWA/TN-98/002) Nebraska: Air Force Weather Agency/DNT, 1998.
- SANTOS, B.A. Situações Meteorológicas Associadas a Nevoeiro e Operação Comboio no Sistema Anchieta-Imigrantes M.S. Thesis, Universidade de São Paulo, São Paulo, 2022.
-
SHAO, N.; LU, C.; JIA, X.; WANG, Y.; LI, Y.; et al. Radiation fog properties in two consecutive events under polluted and clean conditions in the Yangtze River Delta, China: A simulation study. Atmos. Chem. Phys., v. 23, n. 17, p. 9873-9890, 2023. doi
» https://doi.org/10.5194/acp-23-9873-2023 -
TOPODATA - INPE. Banco de Dados Geomorfométricos do Brasil Available in http://www.dsr.inpe.br/topodata/acesso.php, accessed 18/12/2023
» http://www.dsr.inpe.br/topodata/acesso.php -
WILLETT H.C., Fog and haze, their causes, distribution and forecasting, Mon. Wea. Rev., v. 56, n. 11, p. 435-68, 1928. doi
» https://doi.org/10.1175/1520-0493(1928)56<435:FAHTCD>2.0.CO;2 -
WMO - World Meteorological Organization. Manual on the Global Observing System. Volume I: Global Aspects Geneva: Secretariat of the World Meteorological Organization, 2010. https://library.wmo.int/records/item/35699-guide-to-the-global-observing-system
» https://library.wmo.int/records/item/35699-guide-to-the-global-observing-system
Internet Resources
-
ERA-Interim reanalysis - https://www.ecmwf.int/en/research/climate-reanalysis/era-interim
» https://www.ecmwf.int/en/research/climate-reanalysis/era-interim -
University of Wyoming - http://weather.uwyo.edu/upperair/sounding.html
» http://weather.uwyo.edu/upperair/sounding.html -
Meteorology Network of the Brazilian Air Force (REDEMET) - https://www.redemet.aer.mil.br/
» https://www.redemet.aer.mil.br/ -
Division of Satellites and Environmental Studies (INPE) - https://satelite.cptec.inpe.br/home/index.jsp
» https://satelite.cptec.inpe.br/home/index.jsp -
Climatological bulletin of IAG/MS - http://www.estacao.iag.usp.br/Boletins/2015.pdf
» http://www.estacao.iag.usp.br/Boletins/2015.pdf