 Performance of the Forest-Based Stress Index (FBS) and Windy FBS (wFBS) as Wildfire Danger Metrics
Abstract
The increasing frequency and intensity of dry heatwaves have heightened wildfire danger in seasonally dry tropical regions such as the Brazilian Cerrado. This study evaluated, for Brasília in 2024, the relationships among the Forest-Based Stress Index (FBS), its wind-adjusted version (wFBS), the Vapor Pressure Deficit (VPD), and the Hot-Dry-Windy (HDW) index, with the aim of comparing their performance in predicting wildfire danger. Meteorological data from INMET were aggregated into weekly means for the most critical period of the day (3:00-9:00 p.m.) and analyzed using Spearman correlation, residual analysis, and percentile-based classification. The results showed strong and significant correlations among all indices (ρ > 0.9), with particularly high agreement between FBS and VPD. FBS and wFBS exhibited a preventive behavior by anticipating the onset of the extreme fire danger season, whereas VPD and HDW more directly reflected the intensification of dry atmospheric conditions. The inclusion of wind speed increased result variability, indicating its predominantly local influence. Overall, the integrated use of FBS and VPD provides a robust and operational approach for regional-scale wildfire danger monitoring and management, supporting preventive strategies and climate adaptation policies.
Keywords
vapour pressure deficit (VPD); hot-dry-windy index (HDW); wildfires
Resumo
O aumento da frequência e da intensidade de ondas de calor secas tem ampliado o perigo de incêndios florestais. Este estudo avaliou, para Brasília em 2024, as relações entre o índice de Estresse Florestal (FBS), sua versão ajustada pela velocidade do vento (wFBS), o Déficit de Pressão de Vapor (VPD) e o índice Hot-Dry-Windy (HDW), com o objetivo de comparar seu desempenho na predição do perigo de incêndios florestais. Foram utilizados dados do INMET, agregados semanalmente para o período mais crítico do dia (15 h-21 h), analisados por meio de correlação de Spearman, análise de resíduos e classificação por percentis. Houve correlações fortes e significativas entre todos os índices (ρ > 0,9), com destaque para a elevada concordância entre FBS e VPD. O FBS e o wFBS apresentaram comportamento preventivo, e anteciparam o início da estação de perigo extremo, enquanto o VPD e o HDW refletiram de forma direta a intensificação das condições atmosféricas secas. A inclusão da velocidade do vento aumentou a variabilidade dos resultados, sugerindo seu papel predominantemente local. Conclui-se que o uso integrado do FBS e do VPD oferece uma abordagem robusta e operacional para o monitoramento e a gestão do perigo de incêndios florestais em escala mesorregional, contribuindo para estratégias preventivas e para políticas de adaptação climática.
Palavras-chave
déficit de pressão de vapor; índice HDW; incêndios florestais
1. Introduction
The intensification of global warming has become one of the greatest challenges of the 21st century (IPCC, 2021). In regions subject to hot and dry climatic extremes, wildfires acquire an emergency character, as their impacts extend beyond the immediate destruction of vegetation and affect society. Among these consequences are the emission of large volumes of greenhouse gases and the loss of ecosystem services (FAO, 2020). Dry heatwaves emerge within this context and are characterized by prolonged periods of excessively high temperatures. Such events have become more frequent, more intense, and longer lasting across different regions of the globe (WMO, 2023).
Among the meteorological variables used in forecasting and environmental monitoring, vapor pressure deficit (VPD) has gained prominence because it directly reflects atmospheric demand for water vapor and the potential for foliar evapotranspiration. High VPD values indicate conditions of low relative humidity and strong evaporative demand, intensifying water loss in plants and the drying of fine fuels, thereby increasing vegetation stress and flammability (Sedano and Randerson, 2014; Eamus et al., 2013; Grossiord et al., 2020). Also known as the Penman-Monteith variable (Monteith, 1965), VPD is a robust predictor of the occurrence and severity of extreme events, in some cases outperforming traditional indices based solely on precipitation and air temperature (Williams et al., 2019; Yuan et al., 2019).
Extreme climatic events reinforce feedback processes such as reductions in soil moisture and increases in vegetation flammability (Bolan et al., 2025). Within the fire triangle framework, a wildfire ignites when three conditions are present: available fuel, an ignition source, and oxygen. Srock et al. (2018) incorporated wind speed into wildfire danger analysis through the Hot-Dry-Windy (HDW) index, which represents a variation of VPD that explicitly accounts for atmospheric circulation.
Castro-Faria (2021) proposed a dimensionless mathematical equation scaled from zero to ten points to analyze the effect of heatwave stress on native vegetation, termed the Forest-Based Stress Index (FBS). The hypothesis of the present study assumes that FBS exhibits a strong correlation with VPD and can be adapted to assess wildfire danger in a given region. It is further proposed that FBS may be contrasted with both HDW and VPD, adjusting its formulation through a methodology capable of accounting for wildfire danger as a function of wind speed.
Accordingly, the objectives of this study are: (i) to examine the correlation among the Forest-Based Stress Index (FBS), the modified FBS (wFBS), vapor pressure deficit (VPD), and the Hot-Dry-Windy (HDW) index under the meteorological and seasonal conditions of Brasília during 2024; and (ii) to comparatively evaluate the performance of these indices with respect to their ability to predict wildfire danger situations.
2. Materials and Methods
2.1. Study area
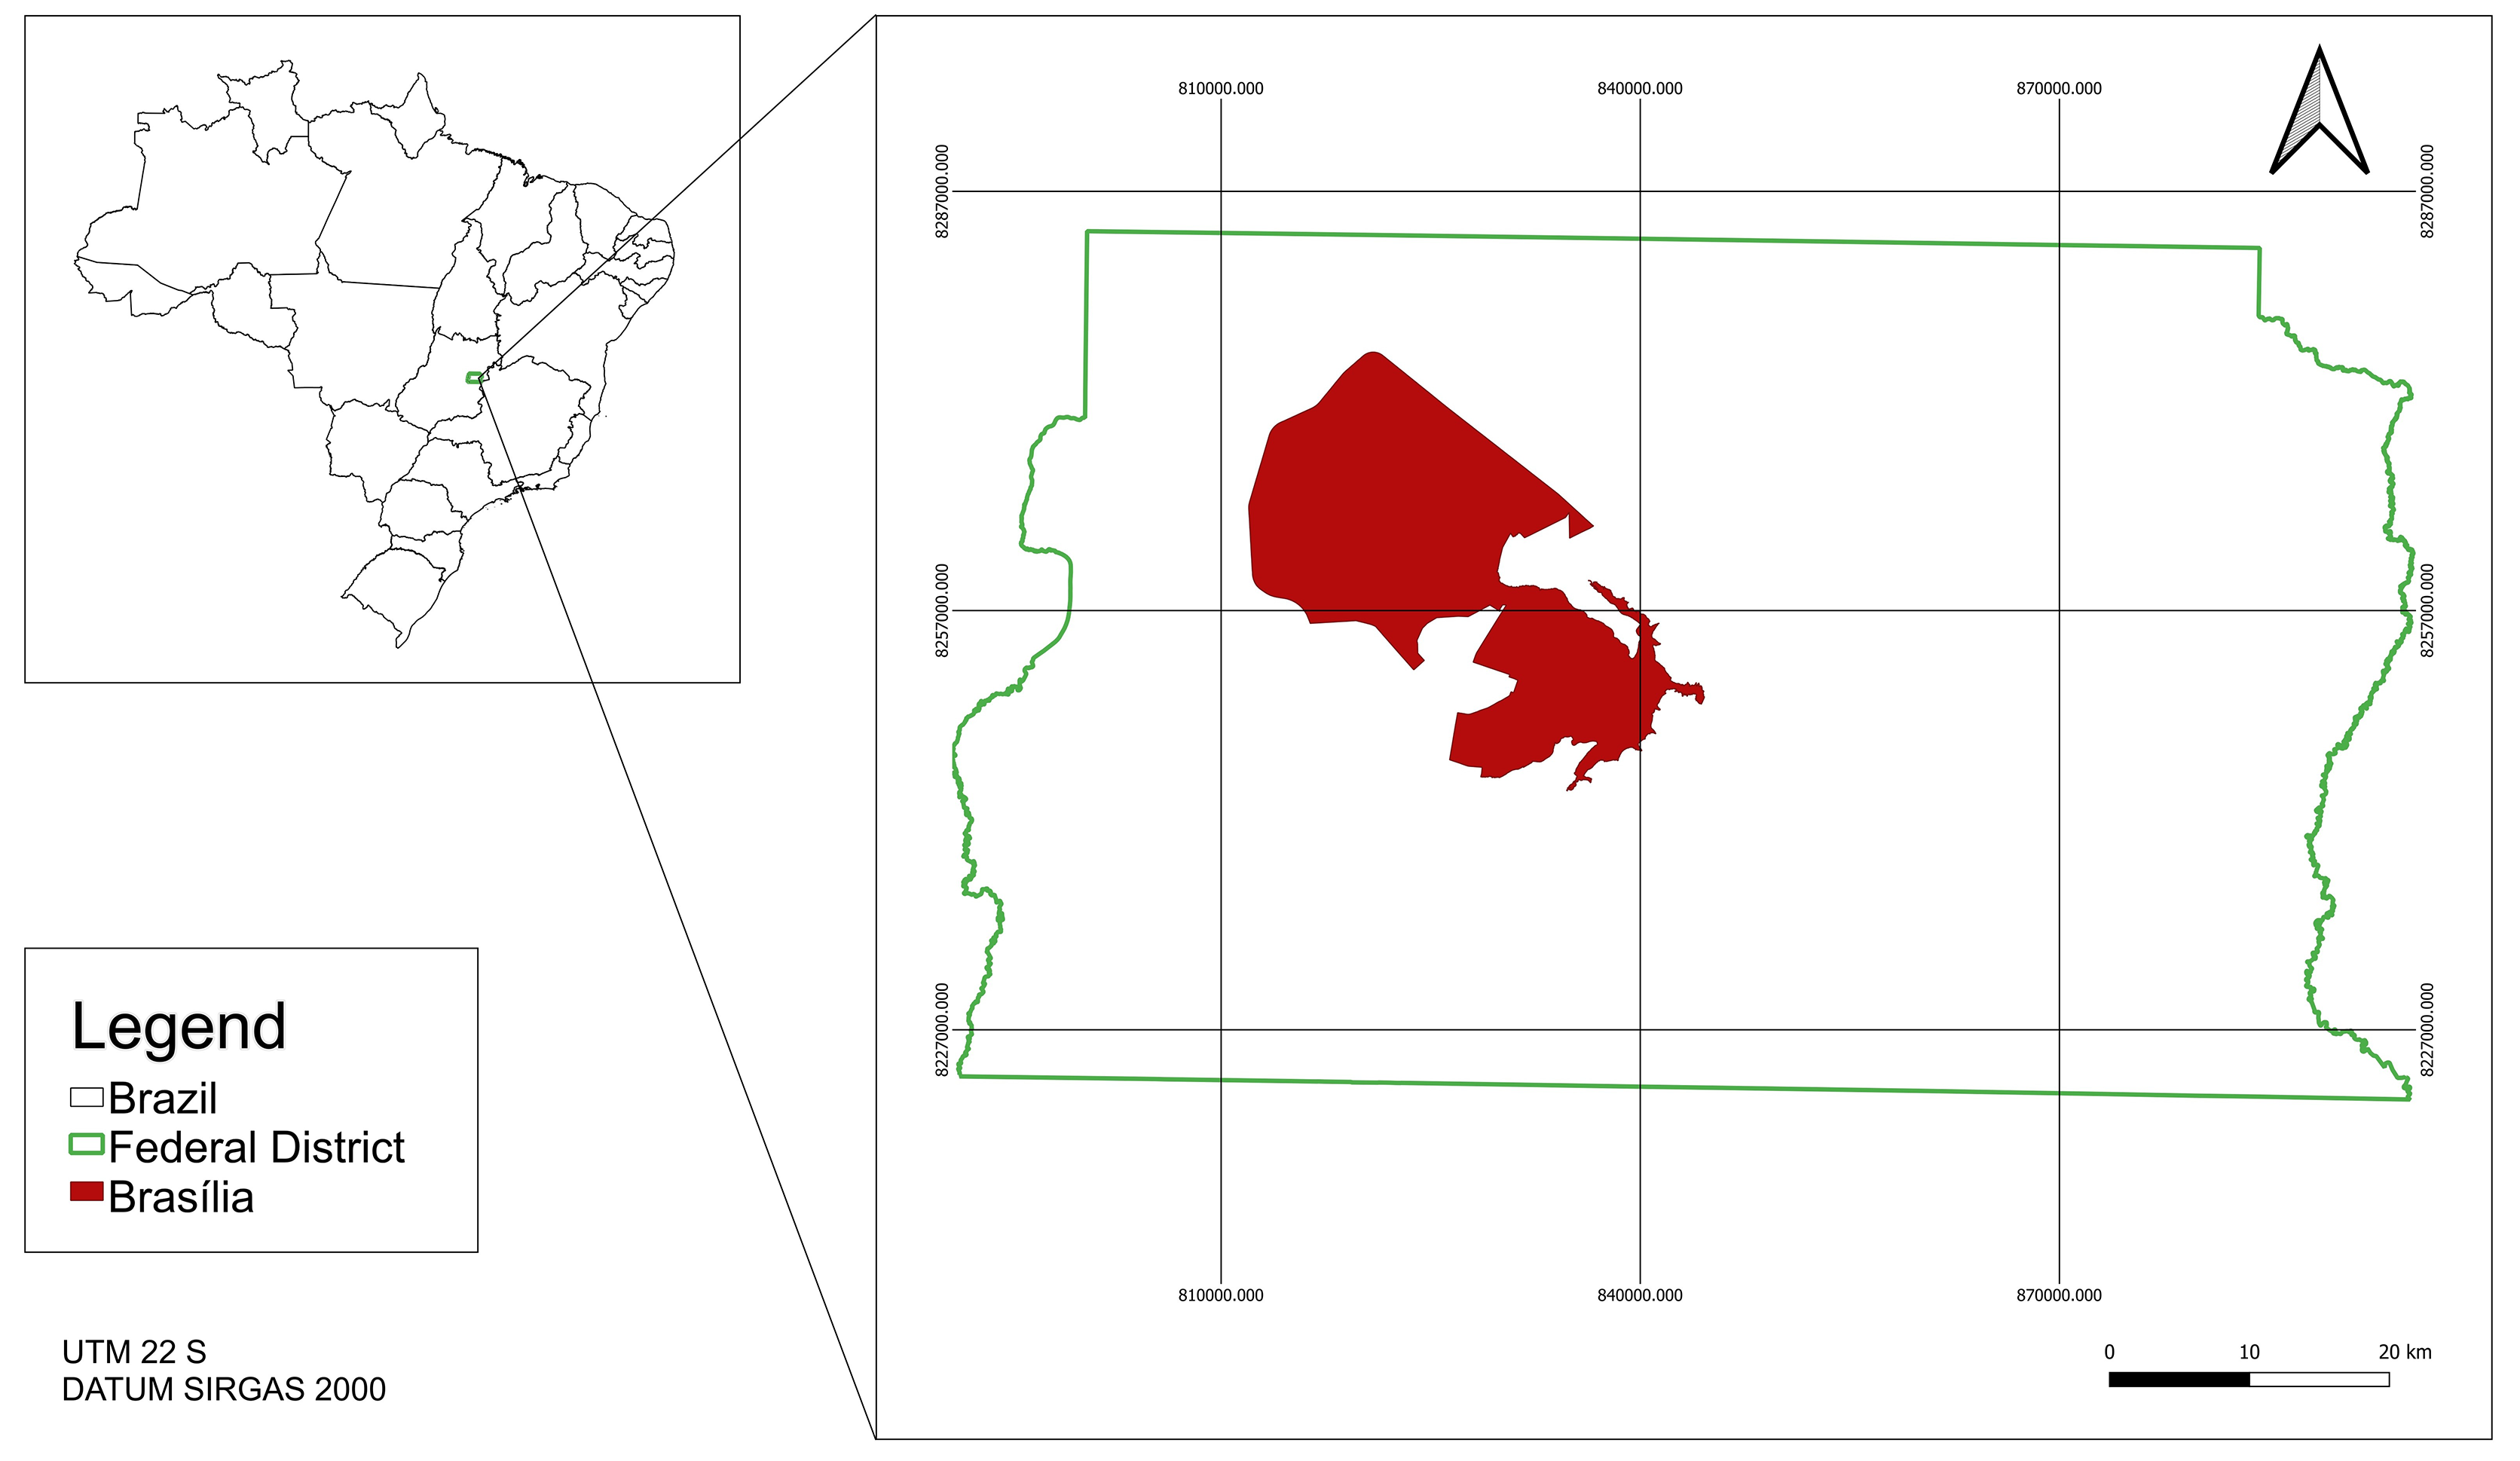
The municipality of Brasília, seat of the Federal Government and core of the Federal District, is located on the Brazilian Central Plateau. From a physical and climatic perspective, Brasília lies within the Cerrado biome and exhibits a seasonal tropical climate classified as Aw according to the Köppen system, with two well-defined seasons: a rainy period (spring-summer) and a dry period (autumn-winter). Annual mean air temperatures range from approximately 21 to 22 °C, with pronounced daily and seasonal thermal amplitudes that may produce hot afternoons and relatively cool nights within the same season (Alvares et al., 2013).
According to official remote sensing data from the BDQueimadas system maintained by the National Institute for Space Research (INPE), 105 fire hotspots were detected in the Federal District between January and July 2024. This represents a marked increase compared with the same period in 2023, when 47 hotspots were recorded, nearly doubling the number of occurrences observed in the previous year. During the same period in 2025, a total of 55 fire hotspots were detected, representing approximately half of the total recorded in 2024. This contrast highlights the atypical climatic conditions observed in 2024, characterized by unusually hot and dry conditions that likely favored both the occurrence and spread of wildfires in the region.
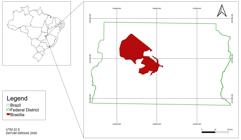
The winter of 2024 was identified by the National Institute of Meteorology (INMET) as one of the hottest in the historical record, characterizing conditions of low atmospheric humidity and an increased potential for wildfire risk and water stress in urban and peri-urban environments (Fig. 1).
2.2. Fire danger metrics
This study aimed to characterize the behavior of the main meteorological indices associated with wildfire danger in the Brasília region throughout 2024. The following variables were analyzed: the Forest-Based Stress Index (FBS), Vapor Pressure Deficit (VPD), the Hot-Dry-Windy Index (HDW), and the Windy FBS (wFBS). Publicly available metadata provided by INMET were used to represent both thermal and atmospheric conditions, as well as the potential for fire spread.
2.2.1. Forest-Based Stress index (FBS)
The FBS was proposed by Castro-Faria (2021) to characterize the occurrence of dry heatwaves associated with forest stress. It is a dimensionless and intuitive index whose input parameters are instantaneous air temperature (IAT) and instantaneous dew point temperature (IDP), defined as the temperature at which air, when cooled at constant pressure, reaches saturation.
The IDP expresses the effect of atmospheric water vapor on air temperature. When IDP equals IAT, the ratio between these parameters yields a unitary value (1.0), indicating air saturation (100 % relative humidity) and the absence of hydric stress due to transpiration. Under such conditions, plants do not lose water to the atmosphere, characterizing a state of thermal comfort favorable to maximizing solar energy absorption through photosynthesis. During periods without solar radiation (nighttime), the index indicates intensification of respiratory processes and, consequently, plant growth.
The non-logarithmic and logarithmic formulations of FBS are presented in Eqs. (1)-(2), respectively, with the logarithmic form being adopted in this study.
where FBS = vegetation stress index due to heatwaves (dimensionless); IDP = instantaneous dew point temperature (°C); IAT = instantaneous air temperature (°C). Equation (2) corresponds to the logarithmic model, yielding a minimum value of 1 and a maximum of 10.2.2.2. Vapor Pressure Deficit (VPD)
VPD is defined as the difference between the saturation vapor pressure of the air, which depends on temperature, and the actual vapor pressure, determined by the amount of water vapor present in the atmosphere. Expressed in kPa, VPD quantifies the drying power of the air: the higher its value, the faster fuels lose moisture. Elevated VPD values imply higher evaporation rates and a greater capacity of the atmosphere to intensify fire behavior.
Increases in VPD are associated with reduced moisture content in live fuels, thereby increasing their flammability. A robust calculation method is based on saturation vapor pressure equations (Allen et al., 1998), using air temperature (T, °C) and relative humidity (RH, %), as shown in Eq. (3).
where SVP = saturation vapor pressure; AVP = actual vapor pressure; RH = relative humidity.2.2.3. Hot-Dry-Windy index (HDW)
Wind plays a direct role in wildfire dynamics, as stronger winds promote fire spread and increase suppression difficulty. Srock et al. (2018) incorporated wind speed into wildfire danger monitoring through the Hot-Dry-Windy (HDW) index, which simultaneously considers vapor pressure deficit (VPD) and wind speed.
HDW is a continuous index expressed in kPa·m·s-1 and does not exhibit artificial weighting discontinuities. It is calculated as the product of wind speed (w) and VPD, as shown in Eq. (4).
2.2.4. Windy FBS (wFBS)
Wind speed results from the interaction between atmospheric pressure gradients, the rotation of the Earth, topography, and surface roughness. It is one of the main parameters analyzed in meteorology and is routinely monitored by surface meteorological stations, radar systems, and numerical atmospheric models.
Due to the strong influence of local physical factors, wind exhibits high sensitivity to immediate terrain conditions. Small variations in topography and land use and land cover may lead to significant changes in both the intensity and direction of air masses. Therefore, for analyses at the local scale, wind measurements should be obtained through dense and spatially well-distributed observational networks. Conversely, when analyzed at the regional scale, this parameter tends to reflect broader atmospheric patterns associated with synoptic systems, such as cold fronts, high and low-pressure centers, and the general circulation of the atmosphere.
The adaptation of FBS for wildfire danger assessment can be achieved by incorporating wind speed, analogously to its role in the HDW index. Accordingly, this study proposes weighting wind speed according to the Beaufort Scale within the FBS framework, resulting in the Windy FBS (wFBS), as presented in Table 1.
With this modification, the index is no longer strictly dimensionless, since wind speed is expressed in m·s-1. Table 1 therefore represents an auxiliary weighting scale designed to compensate for this externality and maintain index coherence. The mathematical formulation of wFBS is shown in Eq. (5).
As FBS has a maximum score of ten points, wind speed weighting was defined so that this limit is not exceeded.
2.3. Statistical analysis and presentation of results
Climatic data for the Federal District were obtained from the National Institute of Meteorology (INMET) beginning in 2000 and are publicly available through the Meteorological Database for Teaching and Research (BDMEP). The meteorological station used in this study is an automatic station located at latitude −15.7894 and longitude −47.9258, at an altitude of 1,160.96 m above sea level. Daily wildfire risk information is also provided by the same institutional portal.
The hourly meteorological variables monitored were: total precipitation (mm); instantaneous, maximum, and minimum atmospheric pressure (mB); global radiation (kJ m-2); dry-bulb air temperature (°C); instantaneous, maximum, and minimum dew point temperature in the previous hour (°C); maximum and minimum air temperature in the previous hour (°C); maximum, minimum, and instantaneous relative humidity (%); wind direction; maximum wind gust (m s-1); and wind speed (m s-1).
Meteorological conditions for 2024 were analyzed using data recorded by the Brasília meteorological station and provided by INMET. The variables considered included instantaneous air temperature (IAT), dew point temperature (IDP), and wind speed (w). These parameters were aggregated into weekly averages (seven-day intervals) for the period between 3:00 p.m. and 9:00 p.m., resulting in 52 observations for the year.
The dataset exhibited homogeneity, allowing the estimation of minimum and maximum confidence intervals at the 95 % probability level and ensuring an adequate number of degrees of freedom for subsequent analyses. Given the expectation of nonlinearity among indices, Spearman's rank correlation was applied to assess associations, resulting in a correlation matrix with significance evaluated at the 95% confidence level.
Residual analysis was conducted to complement correlation results, allowing the identification of bias, nonlinearity, heteroscedasticity, and structural discrepancies among indices. The Shapiro-Wilk normality test was applied using Microsoft Excel with the Real Statistics Resource Pack add-in.
When residuals exhibited homoscedasticity, quantile-quantile plots were constructed to assess their distribution relative to degrees of freedom. A standardized danger classification table was developed using percentile thresholds (-1, mean, +1, +2, +3), corresponding to low, moderate, high, very high, and extreme danger levels.
Complementary graphs illustrate weekly distributions throughout 2024, and a heat map was produced to represent the relative persistence of danger across models.
3. Results and Discussion
3.1. Correlation among the models
All coefficients exhibited a strong positive correlation (ρ > 0.9), indicating a clear association among the analyzed indices (Table 2). As one meteorological indicator increased, the others showed corresponding increases.
The analysis initially considered the hypothesis of nonlinearity in the residuals. All models consistently reflected conditions of atmospheric heat and dryness. The FBS and wFBS indices were virtually identical (ρ ≍ 0.99), displaying nearly parallel behavior (Table 2).
As expected, the association between VPD and HDW (ρ = 0.978) also indicated a high degree of correlation. When proposing the HDW index, Srock et al. (2018) emphasized that many of the meteorological conditions influencing the near-fire environment are governed by processes operating at spatial scales larger than approximately 200 km (synoptic and meso-alpha scales), which are more predictable in time and space. The authors further noted that at smaller spatial scales, deterministic forecasts of temperature, humidity, and wind variations affecting fire behavior are virtually impossible due to microscale nonlinearities (motions < 2 km) and imperfections in input data.
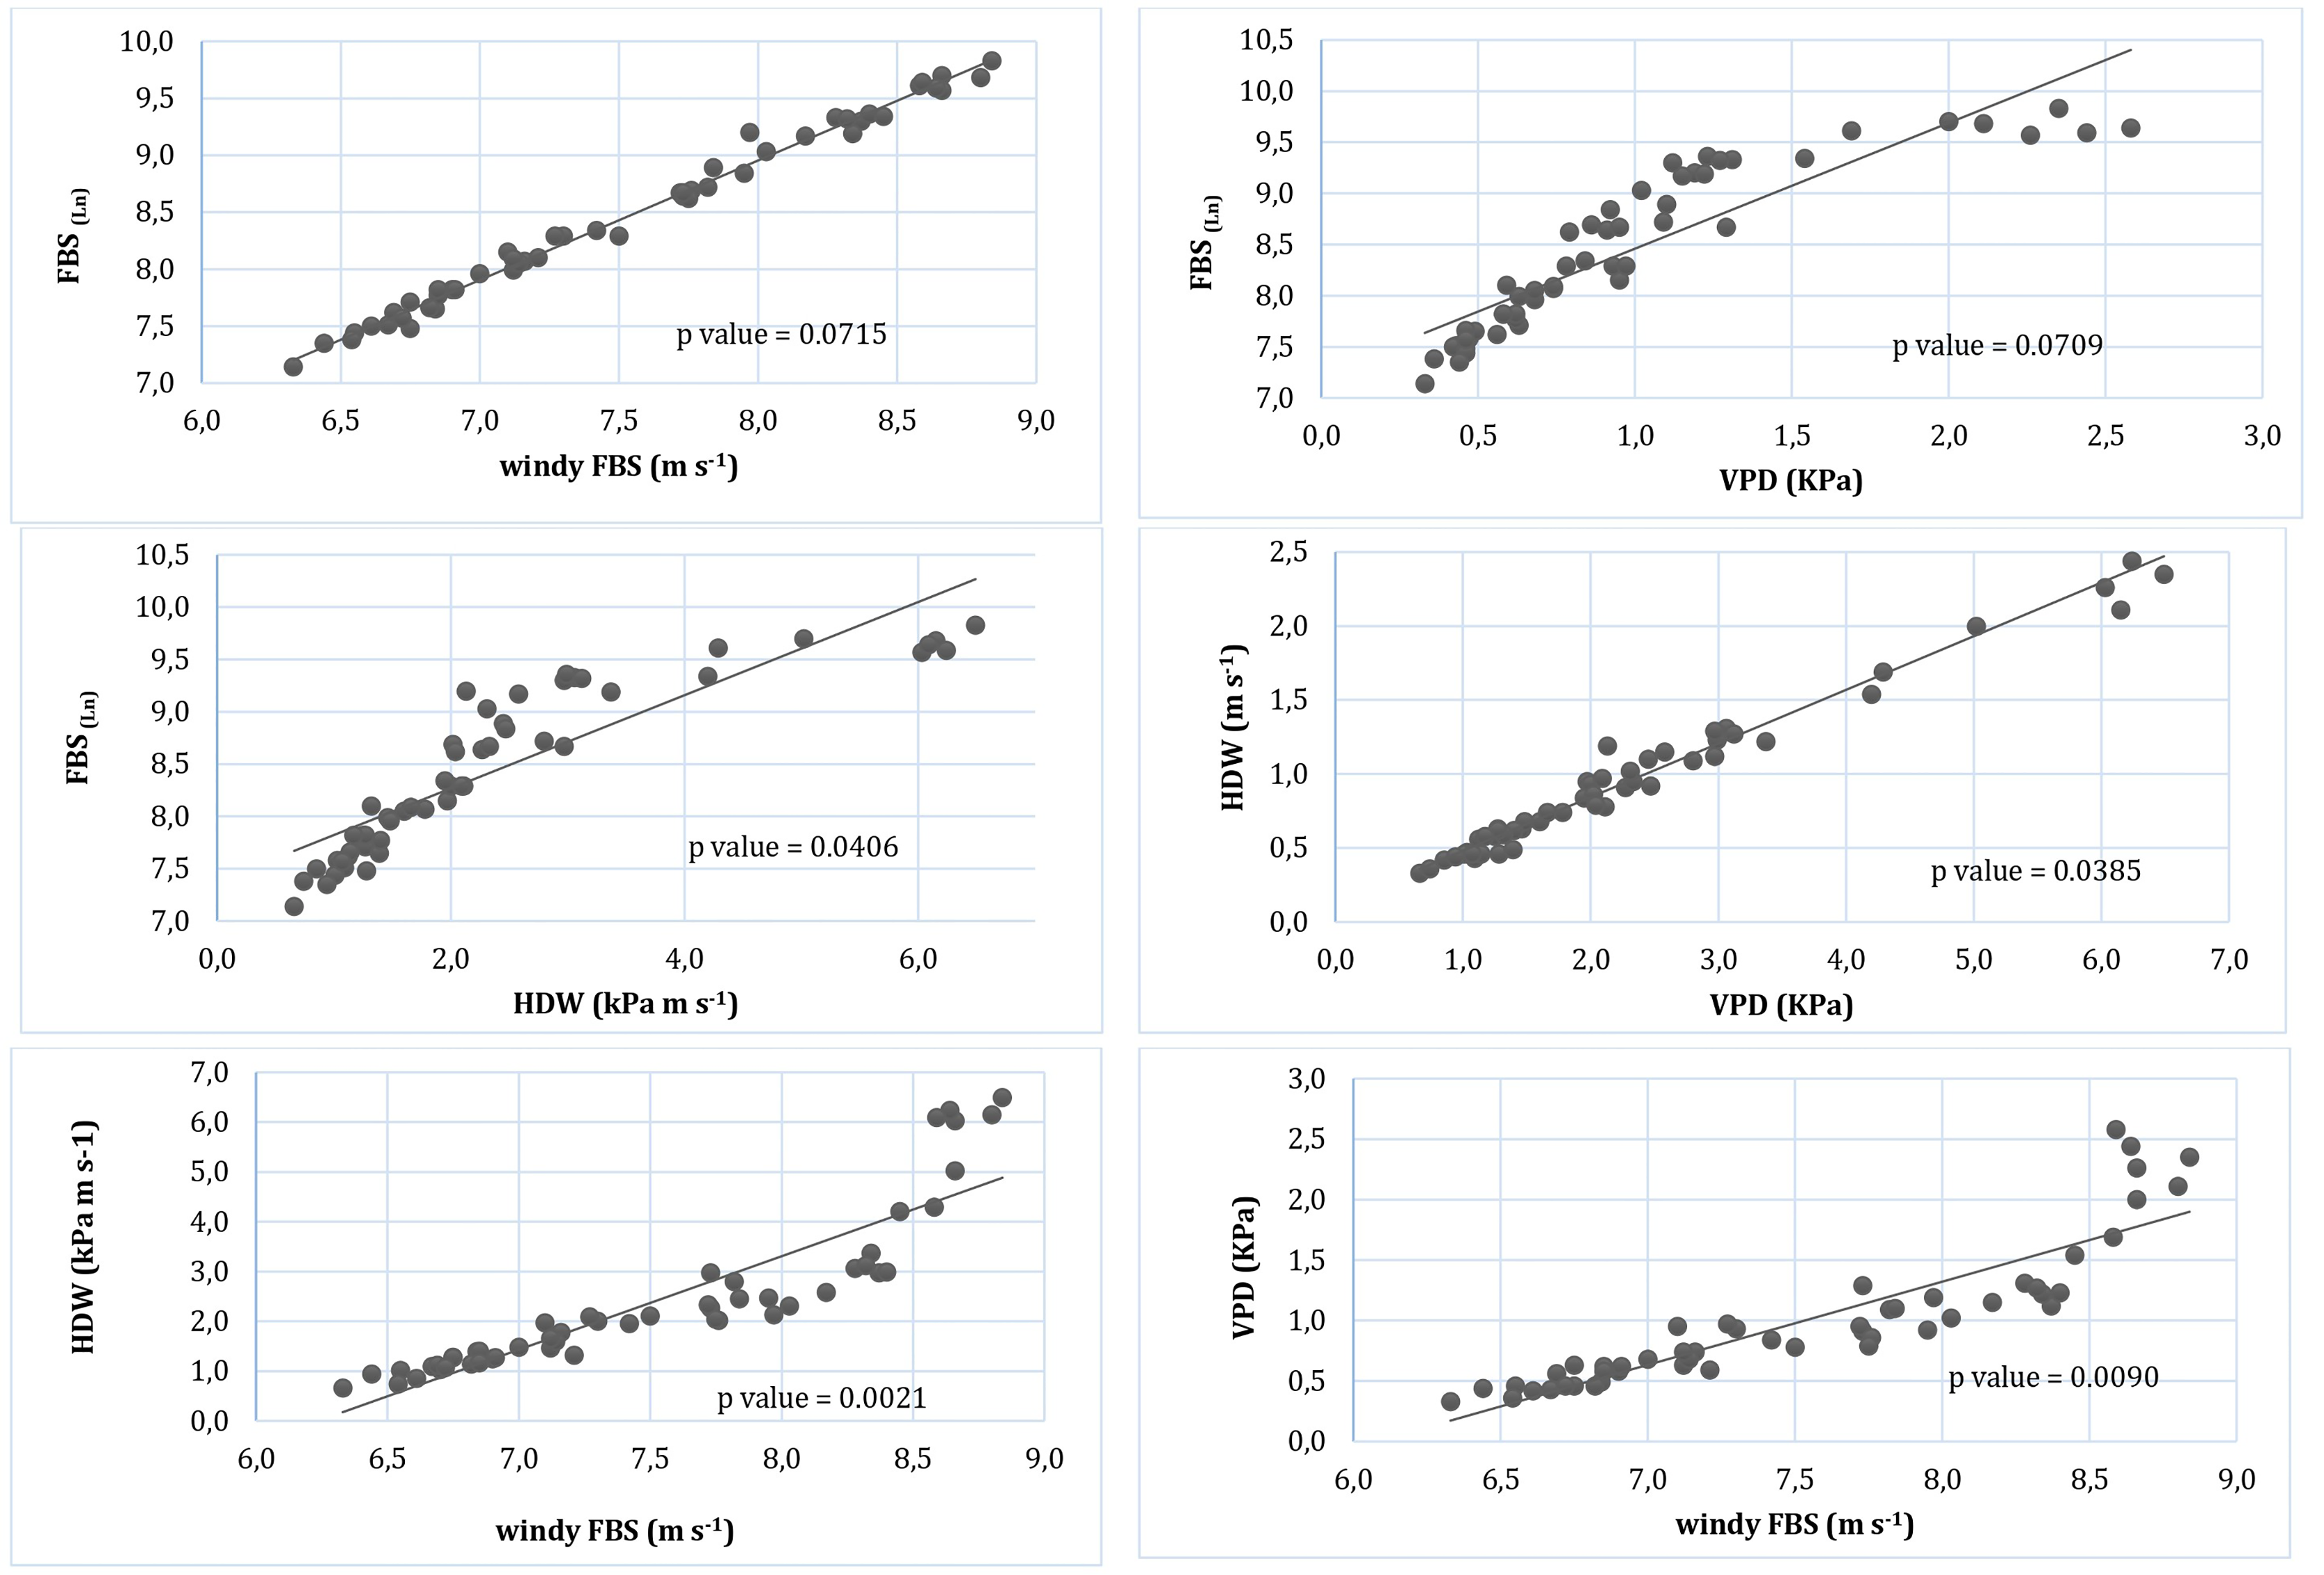
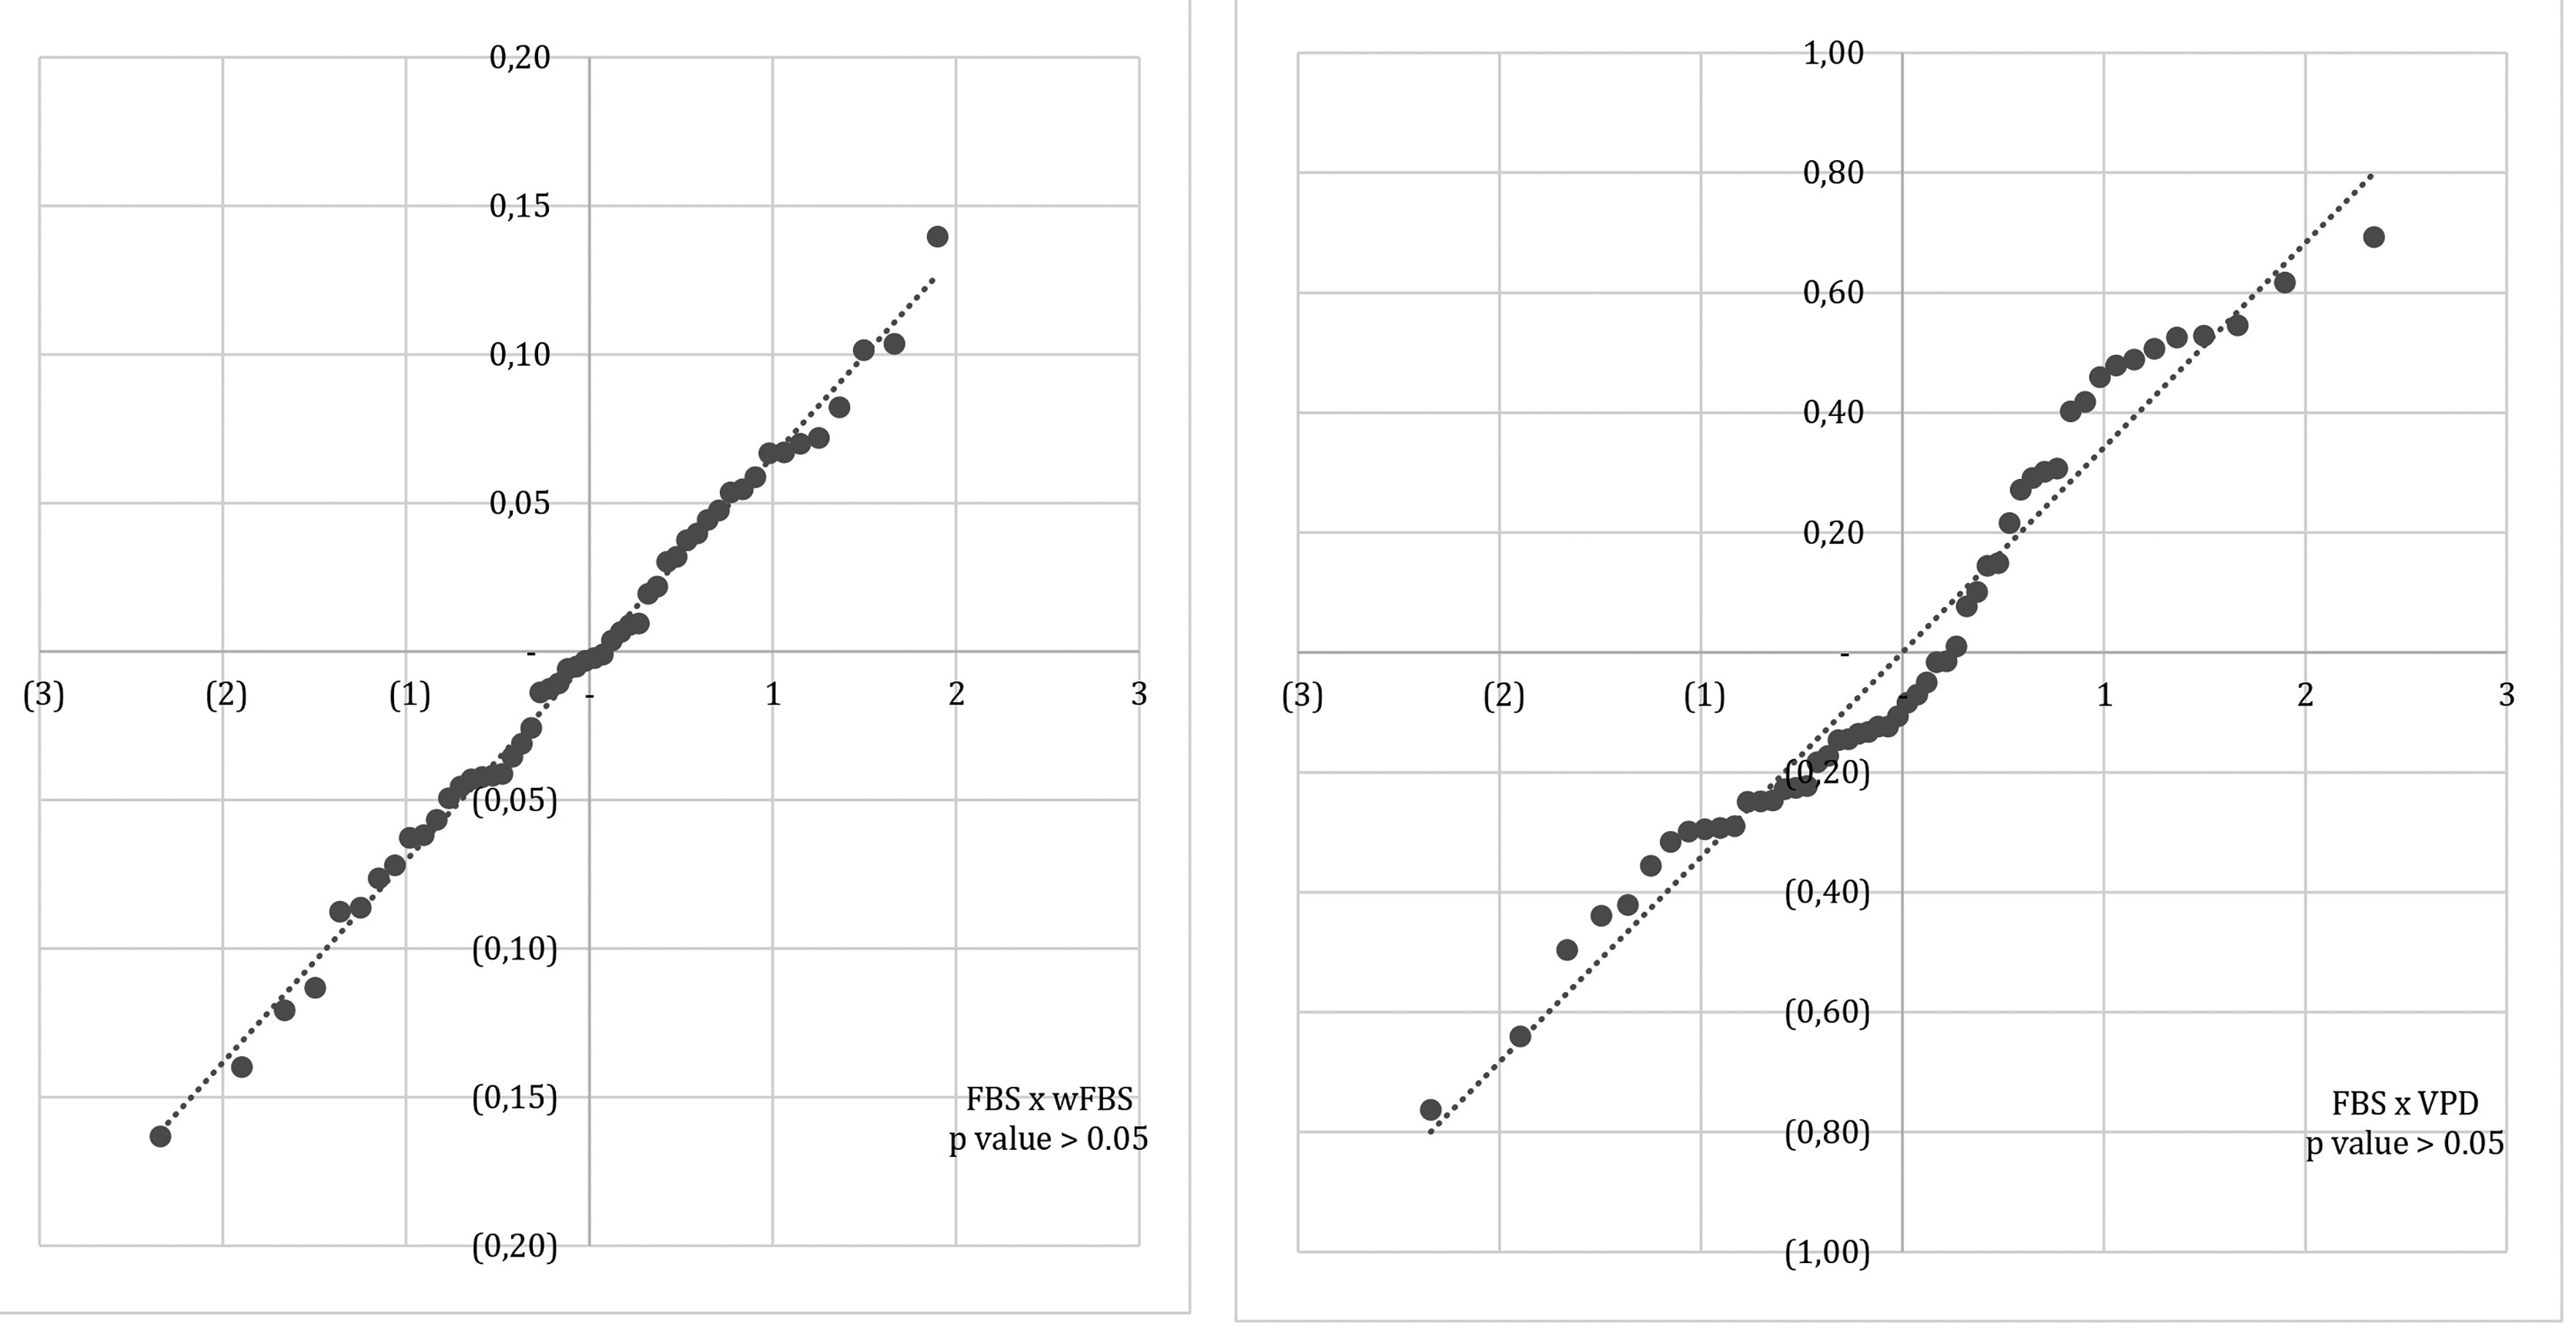
Figure 2 shows that, for the FBS × wFBS and FBS × VPD relationships, residuals followed a normal distribution, reinforcing the robustness of the correlations between these indices. In contrast, residual normality was heterogeneous for the FBS × HDW, HDW × VPD, HDW × wFBS, and VPD × wFBS relationships. Homoscedasticity was expected for the VPD × HDW relationship, since HDW represents an adaptation of VPD; however, this behavior was not observed in the present dataset. A plausible explanation is the increased variability introduced by the irregular temporal distribution of wind speed throughout 2024.
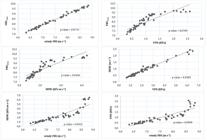
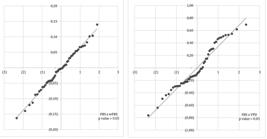
Figure 3 further highlights the strong relationships between FBS and wFBS and between FBS and VPD. The confidence bands display a linear distribution between the −3 and +3 percentiles of the degrees of freedom, confirming the consistency of residual correlations.
Based on the adjusted data, Table 3 was developed to define five wildfire danger classes for all models under the climatic conditions of Brasília. These classes were categorized as low, moderate, high, very high, and extreme danger. In non-critical years, the FBS results are expected to indicate low to moderate risk, with values ranging between 8.1 and 8.8; similarly, the wFBS is expected to present values between 7.2 and 7.8 (considering the variation associated with the first degree of freedom of the mean).
The range from 8.8 to 9.1 observed for FBS within the “very high” danger class was expected, as Castro-Faria (2021) identified a score of 9.0 at the +2 degree-of-freedom level when estimating persistent heatwaves lasting three or more days. The distinction in the present study lies in applying this scale specifically to characterize weekly wildfire danger classes.
The wFBS exhibited slightly lower values because it represents an adaptation of the FBS, whose original formulation does not allow values to exceed ten points. The incorporation of wind speed reduced the overall score range in this model. Consequently, the “very high” danger threshold for wFBS ranged from 7.8 to 8.1, emphasizing that the class intervals of FBS and wFBS are not directly comparable.
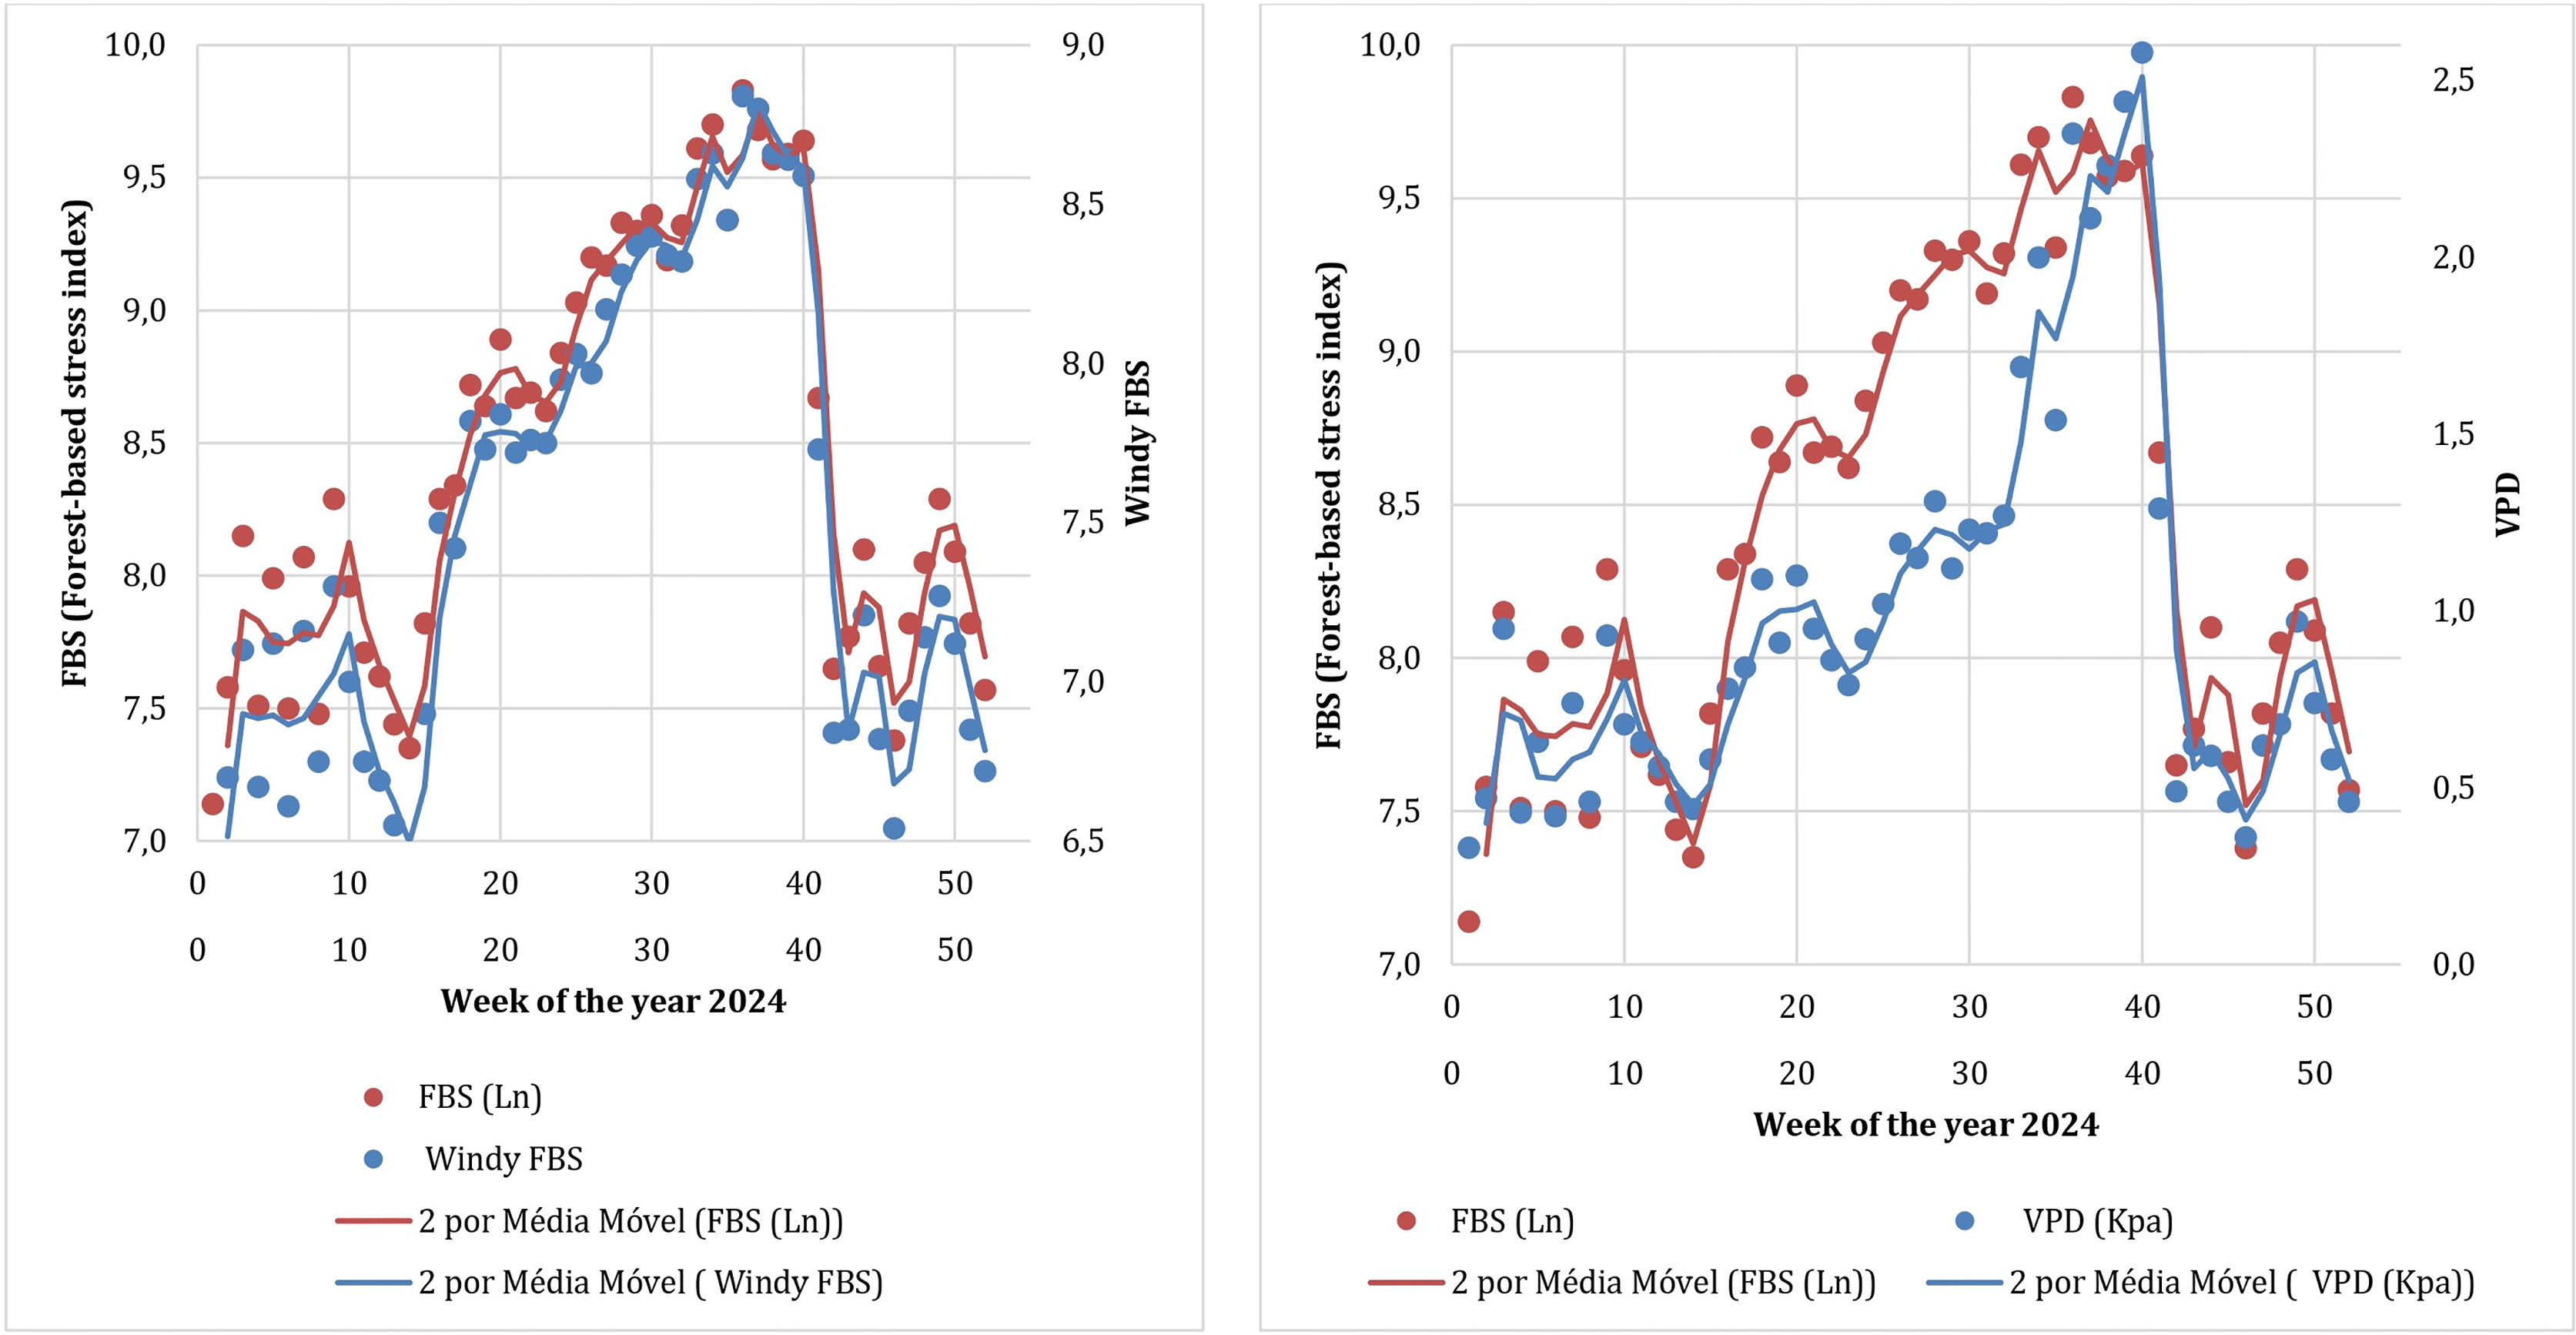
For the annual time series, the FBS model displayed a pronounced parabolic upward trend, anticipating the estimated onset of the extreme heat season (Fig. 4). This behavior suggests that FBS functions as a more precautionary indicator than VPD, which exhibited an exponential increase before both indices declined with the onset of rainfall. The wFBS followed the same temporal trend as FBS.

The extreme heat season began on the 25th week of 2024, corresponding to the first week of May, approximately one month before the onset of winter. Peak danger conditions persisted for several subsequent months, extending until the end of September, already in spring, during 40th week. Historically, wildfire occurrence in the Federal District has been concentrated between June and September, a period corresponding to an interval of approximately 16 weeks. However, the results obtained in this study indicate that, in 2024, extreme fire danger conditions began as early as May, advancing the onset of the critical period and adding four additional weeks at a high risk level. This extension represents a temporal increase of approximately 25% relative to the period historically expected for wildfire occurrence in the region. As October still recorded nearly half a month of extreme danger conditions, danger levels only began to decline in November.
A key finding from the comparative analysis was that the hourly assessment period (3:00 p.m.-9:00 p.m.) consistently produced higher average index values, confirming that the afternoon is the most critical period for fire spread in Brasília. In contrast, Srock et al. (2018) evaluated HDW at 12:00 p.m., 6:00 p.m., and midnight.
In this study, the data were analyzed using weekly aggregation, a procedure that enabled comparative statistical analyses among the different climatological indices. However, for wildfire danger monitoring at a more immediate temporal scale, data aggregation may be unnecessary, allowing daily fire danger estimates to be obtained. This approach enables a more accurate identification of critical episodes, preventing the underreporting of extreme peaks in fire danger.
Overall, all models provided a broadly consistent characterization of the extreme wildfire danger season. However, HDW showed weaker agreement with forest stress indices than VPD. Owing to its more holistic formulation, HDW has been adopted by Canadian and U.S. environmental agencies, where it is calculated using daily maximum VPD and wind speed measured at approximately 500 m above ground level. By contrast, the present analysis relied on data from INMET stations, which record meteorological variables at local surface elevation, approximately 1,000 m in Brasília. The persistence of wildfire danger indicated by each model is summarized in the heat maps presented in Table 4.
According to Andrade and Bugalho (2025), HDW is particularly sensitive to short-term atmospheric variability, especially during episodes of strong winds combined with high VPD values. These authors highlighted that indices incorporating local environmental conditions - such as the Forest Weather Index (FWI) - are complementary to indices representing climatic conditions at meso- and kilometer-scale spatial resolutions.
Although the present study did not aim to evaluate the performance of the FBS in comparison with the Canadian Forest Fire Weather Index (FWI), the results obtained suggest that the behavior of the FBS predominantly reflects wildfire danger levels at a regional scale. In contrast, the FWI incorporates meteorological parameters such as air temperature, relative humidity, wind speed, and precipitation, which feed a set of six sub-indices capable of representing the dryness of fuel materials, as well as the potential rate of fire spread and fire intensity. Consequently, it reflects fire danger conditions that are more sensitive to local-scale variability. In this context, both models may be considered methodologically complementary, as they capture distinct dimensions of wildfire risk dynamics. With regard to the wFBS, comparative investigations in relation to the FWI may still be conducted, particularly because the wind speed parameter incorporated into the wFBS considers wind conditions at the local scale, estimated based on the Beaufort scale, an empirical scale widely used to classify wind intensity.
Consistent with this perspective, VPD and FBS are recommended for wildfire danger analysis in contrast to HDW and wFBS, given that wind speed is predominantly a microscale variable. Adopting mesoregional-scale indices implies a different analytical paradigm, one that excludes locally representative parameters such as forest typology, litter characteristics, and fuel moisture, although these factors may still be incorporated in complementary risk assessments at the property or management-unit scale. While wind speed remains an important factor in wildfire behavior, it is strongly influenced by topography and local pressure gradients and therefore does not adequately represent danger at mesoregional or synoptic scales.
It is also essential to distinguish between two concepts often conflated in wildfire assessments for rural landholders. Local risk factors - such as land-use type, topography, availability of firefighting water sources, and human presence - should be evaluated independently of meteorological conditions. Atmospheric conditions, in turn, should be treated specifically as indicators of danger rather than risk. Seasonal analyses of danger conditions are therefore critical for optimizing prevention strategies and allocating firefighting resources while accounting for spatial patterns of risk and land-use zoning.
The FBS was originally developed to assess the occurrence of heatwaves, and several advantages of its application can be highlighted. Because it is dimensionless, FBS facilitates comparisons across different regions and time periods by integrating variables with different physical units - temperature and humidity (represented by dew point) - into a single score, thereby enabling intuitive interpretation and integrated analyses.
Moreover, simultaneous analysis of heat intensity and atmospheric dryness allows long-term trend detection and continuous monitoring of climatic stress without explicitly relying on relative humidity or precipitation-based weighting. Relative humidity may obscure the total evaporative demand at a given temperature and should therefore be avoided in wildfire danger assessments.
From an operational perspective, the establishment of danger classification thresholds based on both indices proved feasible. VPD values exceeding 1.5 kPa combined with FBS values above 8.8 indicate imminent wildfire danger, warranting intensified monitoring and prevention efforts. Likewise, coincident peaks in both indices during heatwave events can serve as early warning signals, enabling the proactive mobilization of firefighting brigades and public awareness campaigns.
Integrating these indices into regional climate monitoring systems can enhance wildfire risk management, particularly in protected areas within vulnerable biomes, such as conservation units dominated by native vegetation susceptible to atmospheric drought. In addition, the practical application of this framework can support climate change adaptation policies by providing scientific evidence to guide decision-making by environmental agencies and forest-based enterprises.
4. Conclusions
Applying the analyzed indices to Brasília enabled an integrated assessment of the influence of meteorological variables on potential wildfire danger throughout 2024. The results revealed a clear seasonal pattern, with elevated average values across all models coinciding with the peak of the dry season and the period of greatest wildfire risk. Although this study was conducted during a year characterized by high wildfire occurrence, the FBS and wFBS indices can be continuously monitored for any climatological time series. Consequently, these models have broad applicability and can be used across different analytical periods. In years with milder climatic conditions, lower fire danger values are expected, reflecting a reduced likelihood of wildfire occurrence. Therefore, no methodological constraints are identified for the application of these models under different climatic conditions.
Considering that the dew point temperature (IDP) is directly related to vapor pressure, and VPD is derived from temperature and humidity, FBS and VPD are not independent variables, and the high correlation (p > 0.9) was mathematically expected. High VPD and FBS values tended to occur simultaneously during episodes of high air temperature combined with low relative humidity. The statistically significant correlation between these indices indicates that both respond similarly to increased atmospheric evaporative demand. This convergence suggests that VPD, widely used in international studies as an indicator of vegetation flammability, aligns methodologically with FBS, an index specifically developed to assess stress conditions in Brazilian forest ecosystems. From an applied standpoint, these findings support the integrated use of both indices.
VPD provides a physically based measure of the difference between saturation and actual vapor pressure, expressed in kPa. Although the models yielded comparable results, the dimensionless and point-based structure of FBS represents a key advantage, as it facilitates interpretation and operational use. FBS demonstrated structural consistency with VPD under the analyzed conditions, allowing anticipation of periods when large-scale atmospheric conditions may constrain firefighting efforts under mesoscale regimes.
Wind speed emerged as a microscale variable that increased variability in correlations; nevertheless, wFBS maintained a strong homoscedastic relationship with FBS and may still be employed in wildfire danger assessments. Additional case studies are recommended to further evaluate the relationship between FBS and HDW under different climatic and geographic conditions.
By cross-referencing the fire danger data obtained in this study with the statistics reported in the monthly reports of the BDQueimadas system, maintained by the National Institute for Space Research (INPE), it can be observed that, in general, the months between June and September correspond to the period of highest wildfire risk in the Federal District. Within this interval, 304 fire hotspots were recorded in the region in 2024 alone, highlighting the intensification of events during the dry season. Considering these results, the FBS and wFBS indices have the potential to estimate fire danger even in the absence of in situ validation of fire occurrences. This finding reinforces the usefulness of these models as supporting tools for wildfire risk monitoring and management.
AI Usage Statement
The author declares that artificial intelligence (AI) was used for the grammatical revision of the manuscript.
-
Funding
This study was funded by the NAPI Climate Emergency Project of Fundação Araucária.
-
Data Availability Statement
Data avaiable upon request.
References
- ALLEN, R.G.; PEREIRA, L.S.; RAES, D.; SMITH, M. Crop Evapotranspiration - Guidelines for Computing Crop Water Requirements: Irrigation and Drainage Paper n. 56 Rome: FAO Irrigation and Drainage, 1998.
-
ALVARES, C.A.; STAPE, J.L.; SENTELHAS, P.C.; GONçALVES, J.L.M.; SPAROVEK, G. Köppen's climate classification map for Brazil. Meteorologische Zeitschrift, v. 22, p. 711-728, 2013. doi
» https://doi.org/10.1127/0941-2948/2013/0507 -
ANDRADE, C.; BUGALHO, L. Fire danger climatology using the Hot-Dry-Windy index: case studies from Portugal. Forests, v. 16, n. 9, p. 1417, 2025. doi
» https://doi.org/10.3390/f16091417 -
BOLAN, S.; SHARMA, S.; MUKHERJEE, S.; GOMEZ ISAZA, D.F.; RODGERS, E.M.; et al. Wildfires under changing climate, and their environmental and health impacts. Journal of Soils and Sediments, v. 25, n. 11, p. 3173-3197, 2025. doi
» https://doi.org/10.1007/s11368-025-04020-y -
CASTRO-FARIA, á.B. Monitoring air temperature for the thermal comfort and conservation of forests. Revista de Ciências Agroveternárias, v. 20, n. 1, p. 32-40, 2021. doi
» https://doi.org/10.5965/223811712012021032 -
EAMUS, D.; BOULAIN, N.; CLEVERLY, J.; BRESHEARS, D.D. Global change-type drought-induced tree mortality: vapor pressure deficit is more important than temperature per se in causing decline in tree health. Ecology and Evolution, v. 3, n. 8, p. 2711-2729, 2013. doi
» https://doi.org/10.1002/ece3.664 -
FOOD AND AGRICULTURE ORGANIZATION (FAO). Global Forest Resources Assessment 2020 - Key Findings Rome: Food and Agriculture Organization of the United Nations, 2020. doi
» https://doi.org/10.4060/ca8753en -
GROSSIORD, C.; BUCKLEY, T.N.; CERNUSAK, L.A.; NOVICK, K.A.; POULTER, B.; et al. Plant responses to rising vapor pressure deficit. New Phytologist, v. 226, n. 6, p. 1550-1566, 2020. doi
» https://doi.org/10.1111/nph.16485 -
INTERGOVERNMENTAL PANEL ON CLIMATE CHANGE (IPCC). Climate Change 2021 the Physical Science Basis: Contribution of Working Group I to the Sixth Assessment Report of the Intergovernmental Panel on Climate Change Cambridge, New York: Cambridge University Press, 2021. doi
» https://doi.org/10.1017/9781009157896 - MONTEITH, J.L. Evaporation and environment. In: 19 Symposia of the Society for Experimental Biology Copenhagen, p. 205-234. 1965.
-
SEDANO, F.; RANDERSON, J.T. Multi-scale influence of vapor pressure deficit on fire ignition and spread in boreal forest ecosystems. Biogeosciences, v. 11, n. 14, p. 3739-3755, 2014. doi
» https://doi.org/10.5194/bg-11-3739-2014 -
SROCK, A.F. The hot-dry-windy index: a new fire weather index. Atmosphere, v. 9, n. 7, 279, 2018. doi
» https://doi.org/10.3390/atmos9070279 -
WILLIAMS, A.P.; ABATZOGLOU, J.T.; GERSHUNOV, A.; GUZMANMORALES, J.; BISHOP, D.A.; et al. Observed impacts of anthropogenic climate change on wildfire in California. Earth's Future, v. 7, n. 8, p. 892-910, 2019. doi
» https://doi.org/10.1029/2019EF001210 - WORLD METEOROLOGICAL ORGANIZATION (WMO). State of the Global Climate 2022 Geneve: World Meteorological Organization, 2023.
-
YUAN, W.; ZHENG, Y.; PIAO, S.; CIAIS, P.; LOMBARDOZZI, D.; et al. Increased atmospheric vapor pressure deficit reduces global vegetation growth. Science Advances, v. 5, n. 8, p. 1-10, 2019. doi
» https://doi.org/10.1126/sciadv.aax1396
Internet Resources
-
Meteorological Database for Teaching and Research (BDMEP), https://bdmep.inmet.gov.br/
» https://bdmep.inmet.gov.br/ -
Daily wildfire risk information provided by INPE, https://portal.inmet.gov.br/paginas/incendio
» https://portal.inmet.gov.br/paginas/incendio
Edited by
-
Editor Científico
Carlos Frederico Raupp https://orcid.org/0000-0001-7225-864X
Data avaiable upon request.