 Performance of Daily Reference Evapotranspiration Estimation by Different Methods Across Brazilian Climates
Abstract
Reference evapotranspiration (ETo) has a wide application in agriculture and the Penman-Monteith FAO-56 (PM) method is considered standard to calculate it, but this model requires several meteorological data, which are not always readily available. As an alternative, other models that require less data and according to the climatic characteristics of the region are chosen. Thus, the objective of this work was to carry out a comparative study of 12 methods of daily ETo with the PM standard method for 584 automatic weather stations grouped by climate types in Brazil and to evaluate the performance of the different methods according to the climate. To evaluate the performance of the models, the coefficient of determination (R2), the root mean square error (RMSE, mm dia−1), the Kling-Gupta efficiency index (KGE) and percent bias (PBIAS) were used. Overall, the Turc method had the best performance in relation to the other methods, followed by the Penman FAO-24, Makkink, Priestley-Taylor, Hargreaves-Samani and Tanner-Pelton methods. In addition, it is concluded that for the most appropriate choice of a model it is necessary to consider the climatic characteristics of the studied region and the availability of meteorological data.
Keywords
Brazilian climates; Penman-Monteith FAO-56; empirical models; climate classification
Resumo
A evapotranspiração de referência (ETo) tem diversas aplicações na agricultura, sendo o método Penman-Monteith FAO-56 (PM) considerado padrão para calculá-la. Contudo, o método de PM-FAO56 requer diversos dados meteorológicos, os quais nem sempre estão disponíveis. Como alternativa, opta-se por modelos empíricos que requerem menos dados, mas seu desempenho depende das características climáticas da região. Dessa forma, o objetivo deste trabalho foi realizar um estudo comparativo de 12 métodos de ETo diária com o método padrão PM. Consideraram-se séries meteorológicas provenientes de 584 estações meteorológicas automáticas agrupadas por classe climática do Brasil para avaliar o desempenho dos diferentes métodos de acordo com o clima. Para avaliar o desempenho dos métodos utilizou-se o coeficiente de determinação (R2), a raiz do quadrado médio do erro (RMSE, mm dia−1), o índice de eficiência de Kling-Gupta (KGE) e o viés percentual (PBIAS). De forma geral, o método Turc mostrou o melhor desempenho em relação aos demais métodos, seguidos pelos métodos Penman FAO-24, Makkink, Priestley-Taylor, Hargreaves-Samani e Tanner-Pelton. Além disso, conclui-se que para a escolha mais adequada de um modelo é necessário considerar as características climáticas da região estudada e a disponibilidade de dados meteorológicos.
Palavras-chave
Climas brasileiros; Penman-Monteith FAO-56; métodos empíricos; classificação climática
1. Introduction
Estimates of reference evapotranspiration (ETo) are widely used in irrigation to define crop water requirements (Ghiat et al. 2021), in hydrological studies (Parajuli et al., 2022), and in crop yield forecasts (Cooper et al., 2021). Therefore, for water management and food production, it is essential that ETo estimates be as accurate as possible (Ghiat et al., 2021; Wanniarachchi and Sarukkalige, 2022).
In the study of evapotranspiration, as in several areas of research, a motivating problem is to find alternative methods to estimate a response variable (in this case ETo) that are simpler, more economical, or that use fewer explanatory (meteorological) variables than traditional, standard methods (Chen et al., 2020; Salam et al., 2020).
Accordingly, several methods based on meteorological data have been developed to estimate ETo under diverse climatic conditions, using different meteorological variables. Among these methods, FAO-56 Penman-Monteith (PM) was introduced as the standard to estimate ETo (EToPM) (Allen et al., 1998), but it requires a variety of meteorological data (minimum and maximum air temperature, relative humidity, solar radiation, and wind speed), which limits - and may even preclude - its use in locations with scarce measurements of these variables.
As an alternative to the PM method, there are empirical methods that require fewer meteorological data. For example, the methods of Hargreaves and Samani (1985) (HS), Camargo (1971) (Cam), and Hamon (1961) (Ham) require only air temperature as the input variable. Other methods require measurements of air temperature and solar radiation, such as Makkink (1957) (Mak), Turc (1961) (Tur), Jensen and Haise (1963) (JH), and Priestley and Taylor (1972) (PT); the latter also requires net radiation (Rn) and soil heat flux, increasing the complexity of the method compared with the three previously mentioned.
There are also physically based or mixed methods that consider both the aerodynamic and radiation components, such as the FAO-24 Penman method (Pen) (Doorenbos and Pruitt, 1977; Penman, 1948) and the Priestley and Taylor (1972) method, which, in theory, can be applied in regions under any climatic type. Although several methods have been reported in the literature for estimating ETo, there remains uncertainty about which equations are appropriate for a specific climatic situation (Raja et al., 2024).
In the Brazilian context, various approaches have been used to evaluate the performance of alternative ETo estimation methods, generally considering the country's political division, with a focus on municipal or state scales. Specific studies have been conducted for localities in the states of Espírito Santo and Rio de Janeiro (Coutinho et al., 2020; Santos et al., 2018), Rio Grande do Sul (Ongaratto and Bortolin, 2021; Pilau et al., 2012), Mato Grosso (Tanaka et al., 2016), Mato Grosso do Sul (Aparecido et al., 2020), Goiás (Rizo and Silva, 2022), Minas Gerais (Silva et al., 2018), Pará (Souza et al., 2022), Amazonas (Teixeira Filho et al., 2023), and Pernambuco and Bahia (Morais et al., 2015).
However, the influence of climate on ETo transcends the boundaries of the country's political division, making it necessary to investigate how climate influences the performance of different ETo estimation methods. In this context, the interest is to determine whether the results of the different methods for calculating daily ETo, which require fewer meteorological variables, are comparable and whether they can be used as substitutes for the standard FAO-56 PM method for each climatic type in Brazil (Awal et al., 2022; Liu et al., 2019; Zanetti et al., 2019).
It should be noted that some methods were developed specifically for certain climatic conditions. For example, the empirical JH and HS methods were proposed for semiarid climatic conditions in Davis, California, USA (Hargreaves and Samani, 1985; Jensen and Haise, 1963). Similarly, the Cam method was proposed for the southern region of Brazil, in a humid subtropical climate (Camargo, 1971), and the Mak method was developed in the Netherlands, a region with a temperate oceanic climate (Makkink, 1957). Studies show that a method's performance tends to be significantly better when applied under climatic conditions like those for which it was originally developed (Lima et al., 2019; Santos et al., 2018), reinforcing the importance of considering climatic particularities when choosing an ETo estimation method.
The applicability of any ETo method is limited by the availability of input data. Therefore, there is a need to identify and understand the most suitable empirical methods for specific areas to obtain ETo estimates from limited datasets (Dehghanisanij et al., 2004; Raja et al., 2024). Thus, the objective was to compare 12 daily ETo methods with the standard PM method at 584 automatic weather stations grouped by climate types (Köppen-Geiger) in Brazil and to evaluate the performance of the different methods according to each Brazilian climate.
2. Materials and Methods
2.1. Study area
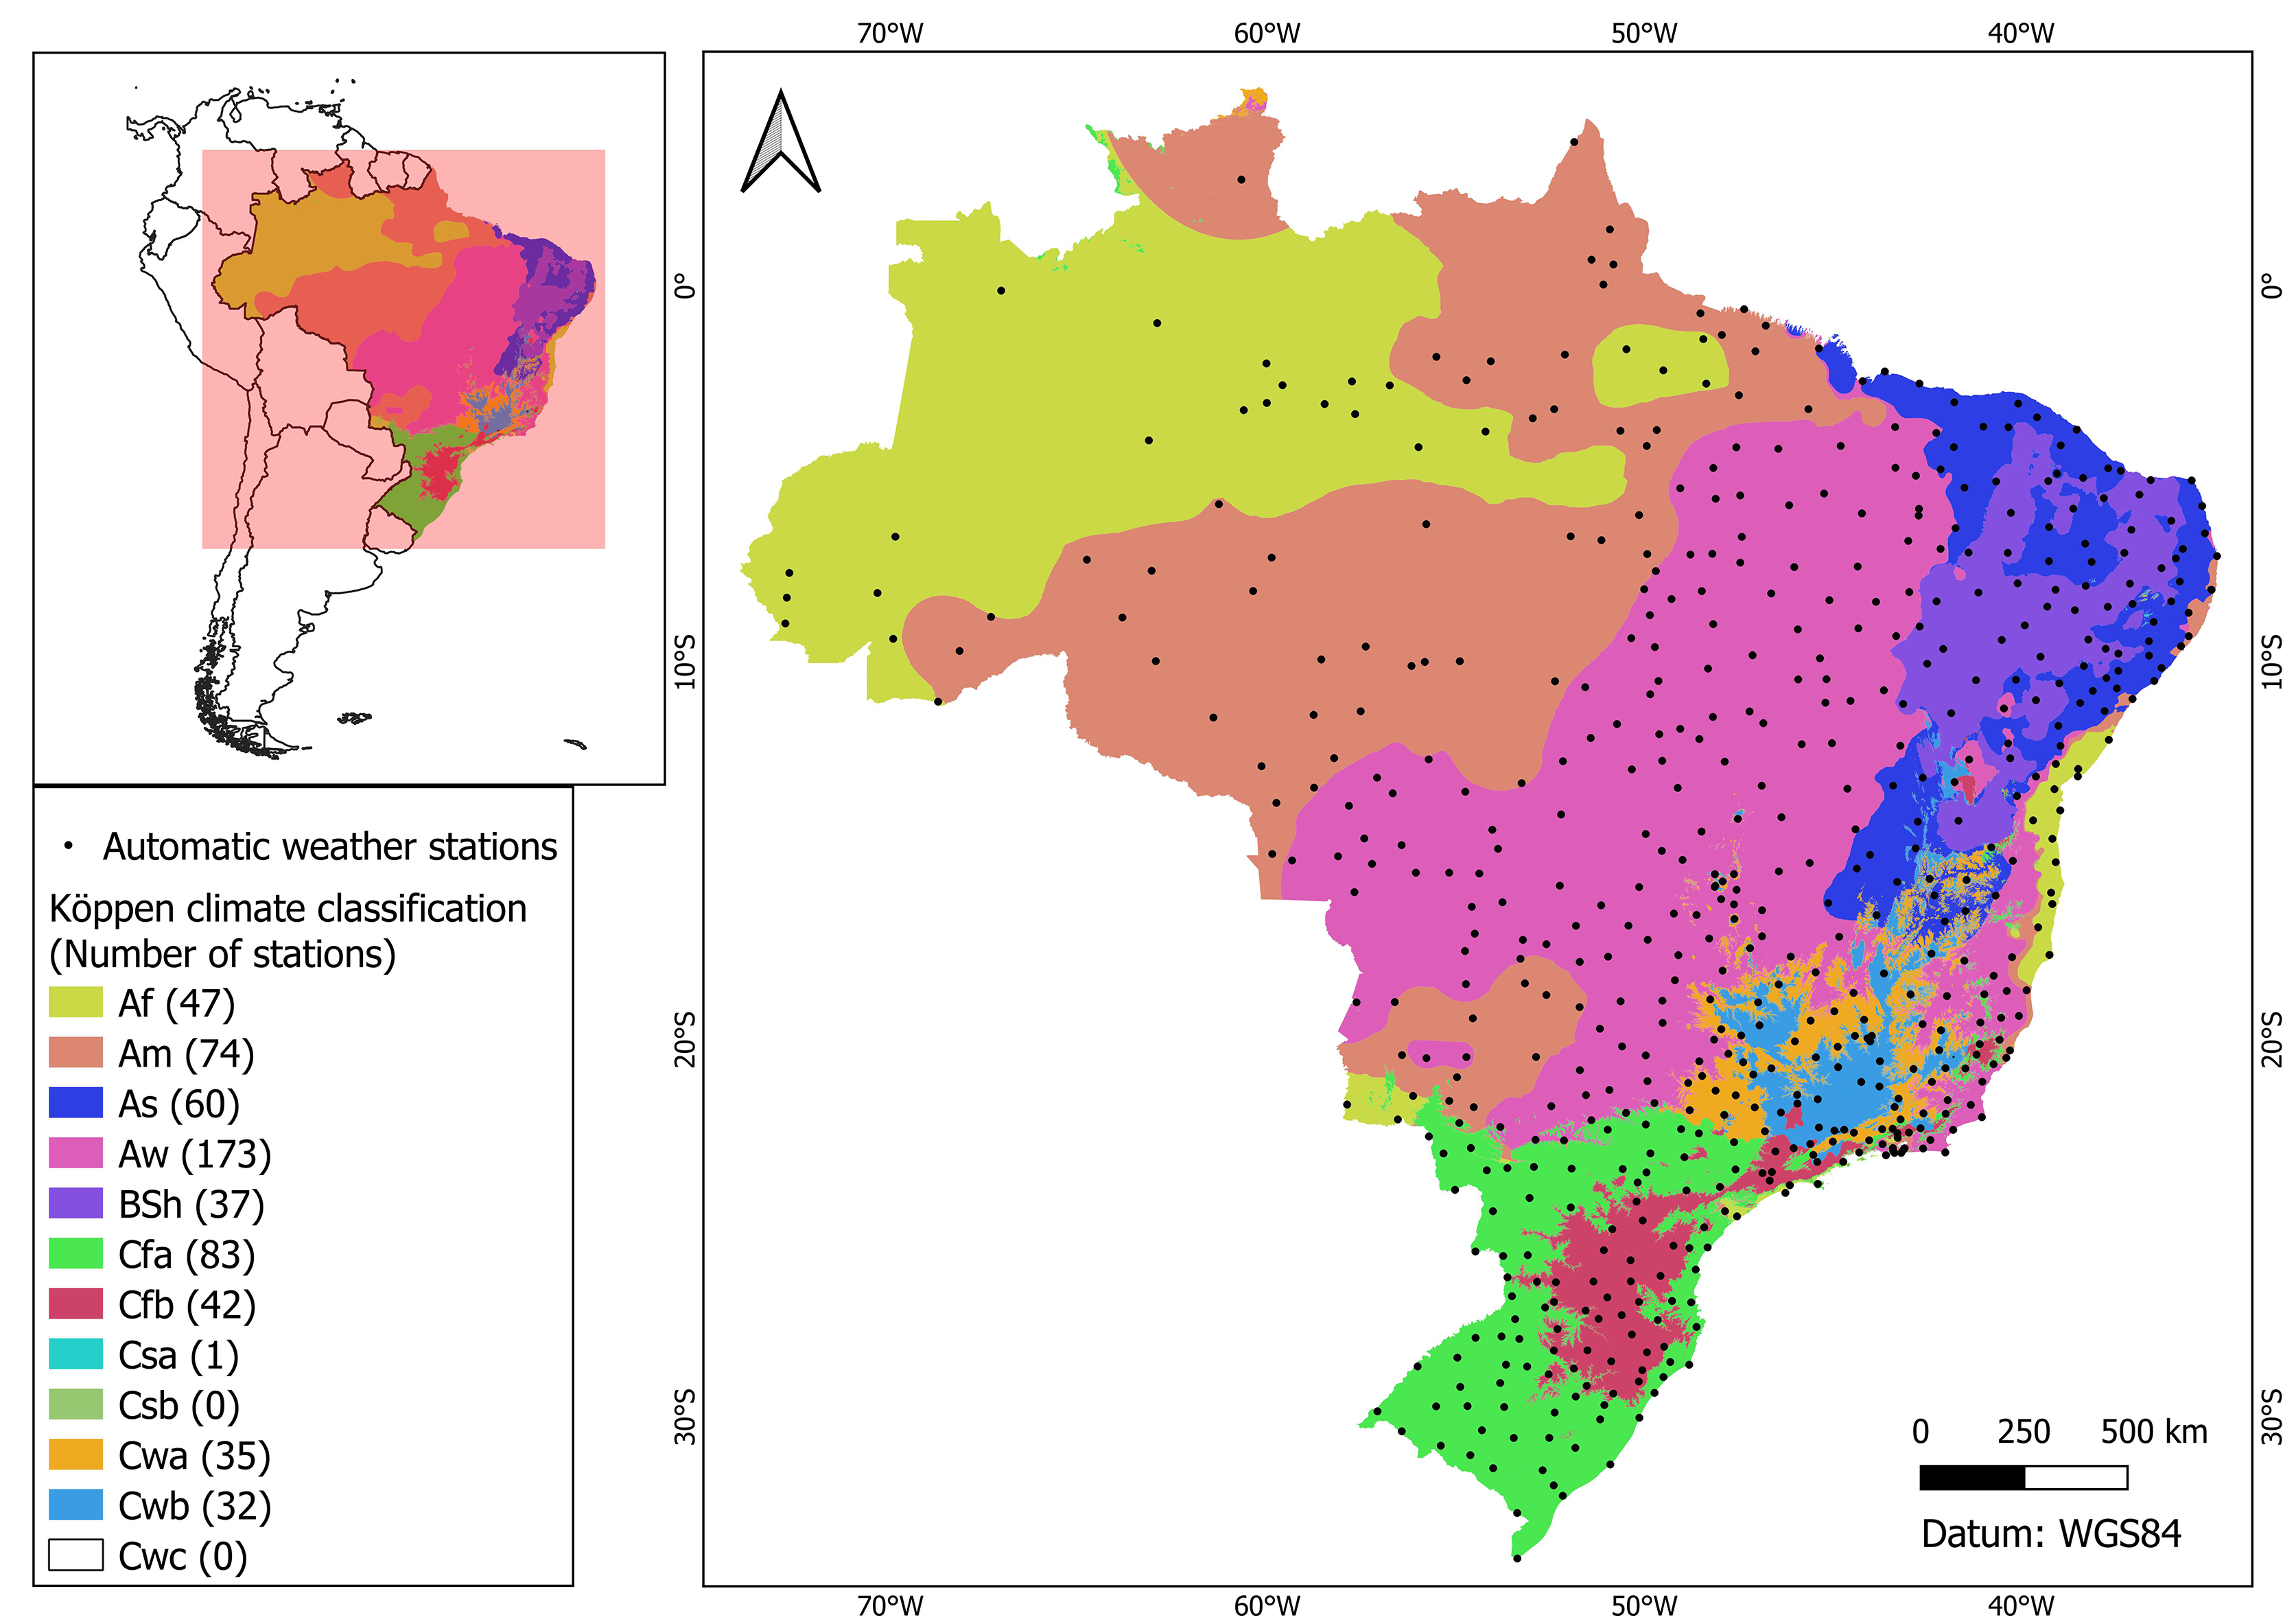
The study area corresponds to Brazilian territory, with an area of approximately 8.51 × 10⁶ km2 (Fig. 1). The study was conducted based on climatic typology, since in hydrology, meteorology, and agriculture, research that encompasses meteorological data and evapotranspiration generally exhibits similar patterns within the same climate type.
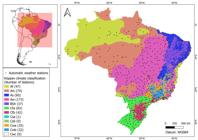
Climatic types of Brazil and distribution of the automatic weather stations used, from Instituto Nacional de Meteorologia.
Brazil exhibits 12 climatic typologies according to the Köppen classification by Alvares et al. (2013), namely: tropical climate with dry season (Af), tropical monsoon (Am), tropical with dry winter (Aw), tropical with dry summer (As), semiarid (Bsh), humid subtropical oceanic without dry season with hot summer (Cfa), humid subtropical oceanic without dry season with temperate summer (Cfb), humid subtropical with dry winter and hot summer (Cwa), humid subtropical with dry winter and temperate summer (Cwb), humid subtropical with dry winter and short, cold summer (Cwc), humid subtropical with dry, hot summer (Csa), and humid subtropical with dry, temperate summer (Csb) (Alvares et al., 2013). The most representative climates in Brazil are Am, Aw, and Af, which together account for 75.89% of the Brazilian territory (Table 1, Fig. 1).
2.2. Meteorological data acquisition and quality
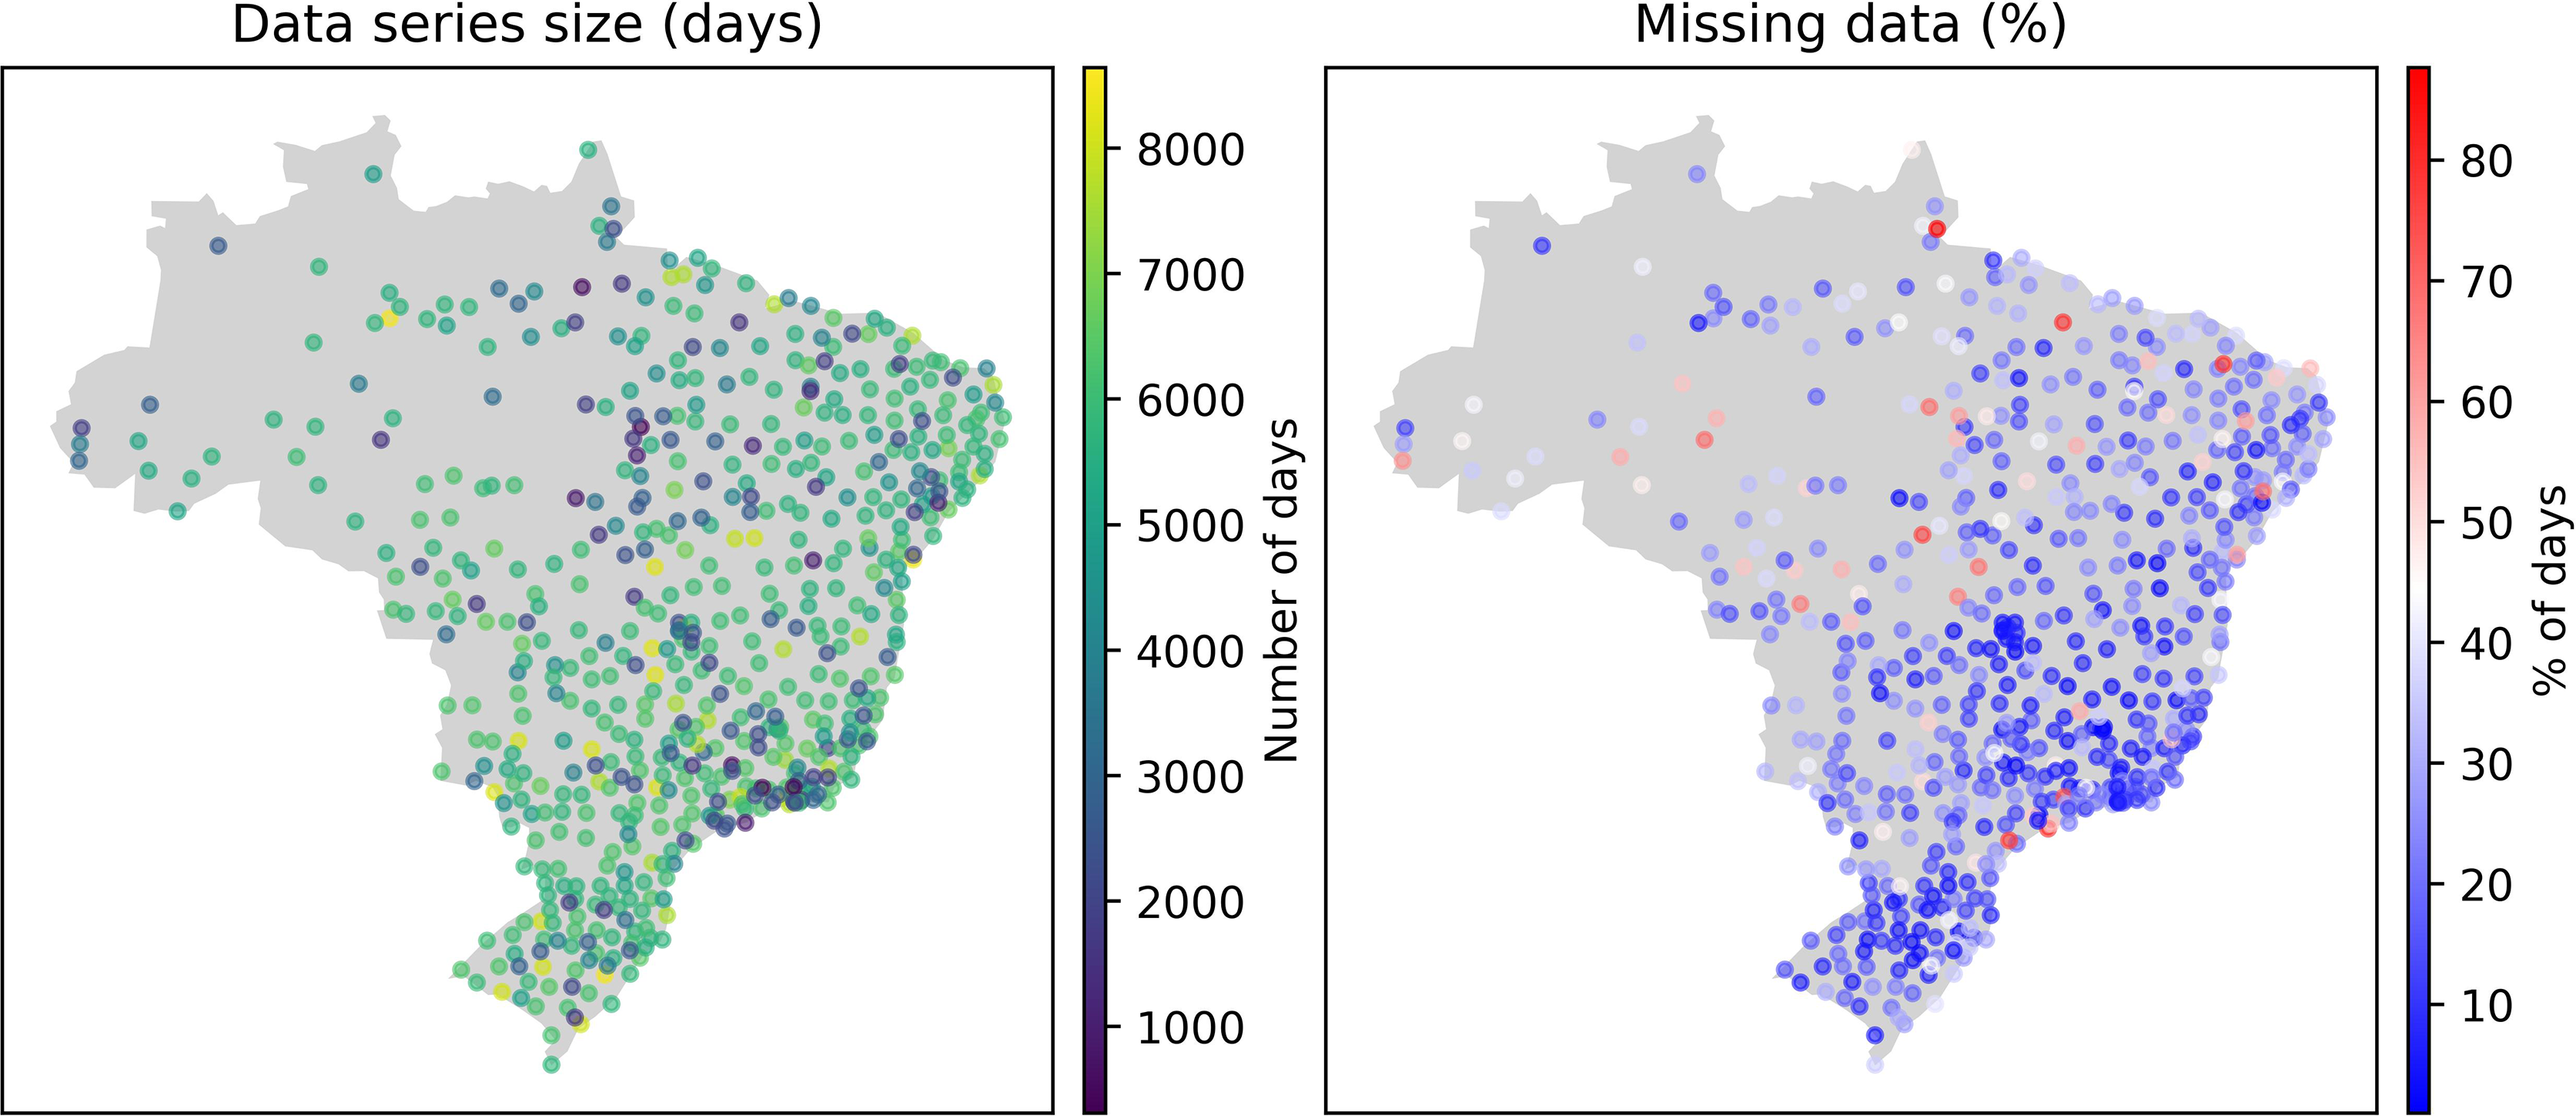
Daily meteorological data (derived from processing the hourly records - mean, maximum, minimum, or integral) from 584 automatic weather stations (AWS) of Instituto Nacional de Meteorologia (INMET), distributed across Brazil (Fig. 1, Table 1), were used. The data period for each AWS was determined by the availability of information, beginning on its start-of-operation date and ending on December 31, 2023. Figure 2 illustrates the number of days and the percentage of missing data for each AWS (Moro et al., 2025).
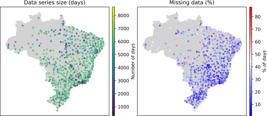
Length of the data series (days) and percentage of missing data for each automatic weather station of Instituto Nacional de Meteorologia. Fonte: Moro et al. (2025).
The meteorological variables measured by the automatic weather stations (AWS) and used in the study were: air temperature (Ta) maximum (Tmax, °C) and minimum (Tmin, °C); relative humidity (RH, %) maximum (RHmax, %) and minimum (RHmin, %); global solar radiation (RS, MJ m−2 day−1); and wind speed measured at ten meters (u10) converted to two meters (u2, m s−1), following Allen et al. (1998).
For the analyses, only the meteorological data from days on which measurements of all variables were available were used. A quality control of the daily data was also performed to ensure integrity and to filter spurious data, as demonstrated by Xavier et al. (2022) and Xavier et al. (2016). The applied tests are presented in Table 2.
2.3. Methods for calculating reference evapotranspiration
Daily reference evapotranspiration (ETo), used as the standard to compare the efficiency of the other methods, was calculated using the FAO-56 Penman-Monteith method (EToPM, mm day−1) as parameterized in the FAO Irrigation and Drainage Paper n. 56, as in Eq. (1) (Allen et al., 1998).
where s is slope of the saturation vapor pressure curve (kPa °C−1); Rn is net radiation at the surface (MJ m−2 day−1); G is soil heat flux (0, MJ m−2 day−1); γ is psychrometric constant (kPa °C−1); u2 is wind speed measured at 2 m height (m s−1); es is mean saturation vapor pressure (kPa); ea is actual vapor pressure (kPa); Tmean is mean daily air temperature (°C).The variables required to calculate EToPM (s, Rn, G, γ, u2, es, ea, and Tmean) were calculated with the equations available in Allen et al. (1998).
a. Hargreaves and Samani (1985) (EToHS):
where Ra is daily extraterrestrial radiation (MJ m−2 day−1); λ is latent heat of vaporization of water (2.45 MJ kg−1); Tmax is daily maximum air temperature (°C); Tmin is daily minimum air temperature (°C).b. Hamon (1961) (EToHam):
where N is photoperiod (hours).c. Camargo (1971) (EToCam):
d. Benevides and Lopez (1970) (EToBL):
where RHmean is mean air relative humidity (%).e. Jobson (Bowie et al., 1985) (EToJ°b):
f. Makkink (1957) (EToMak):
where RS is global solar radiation (MJ m−2 day−1); W is psychrometric weighting factor (dimensionless). The factor W is a function of the wet-bulb temperature (Tu); however, in the absence of this measurement at automatic weather stations, Tmean was used here, following Pereira et al. (1997). Accordingly, an overestimation is expected, because W increases linearly with Tu and, under unsaturated atmospheric conditions, Tmean > Tu (Santos et al., 2018).g. Turc (1961) (EToTur):
-
h. Jensen and Haise (1963) (EToJH):
The coefficients used in the JH method were obtained from Pereira et al. (2013).
i. Tanner and Pelton (1960) (EToTP):
j. Priestley and Taylor (1972) (EToPT):
k. Solar Radiation FAO-24 (Doorenbos and Pruitt, 1977) (EToRS):
where co, cl are adjustment coefficients; co = -0.3; a0 = 1.0656; a1 = -1.275 × 10⁻³; a2 = 4.4953 × 10⁻²; a3 = 2.033 × 10⁻⁴; a4 = -3.1508 × 10⁻⁵; a5 = -1.1026 × 10⁻³. To avoid interpolations and automate the calculations, Frevert et al. (1983) adjusted the coefficients by means of multiple linear regressions (Pereira et al., 1997).l. Penman FAO-24 (Doorenbos and Pruitt, 1977; Penman, 1948) (EToPen):
where λEa is evaporation energy of the air (MJ m−2 day−1).
2.4. Model performance evaluation
The methods for calculating ETo were organized in order of the complexity of obtaining the meteorological data and the number of input variables in each model (Table 3).
Meteorological elements required for each method of calculating daily reference evapotranspiration
The precision of each ETo model was analyzed based on the coefficients of determination (R2), calculated as the square of the linear correlation coefficient between the observed and estimated data, providing a measure of the proportion of variance in the observed data explained by the model. To assess the accuracy of the fitted models, the root mean square error (RMSE, mm day−1) was used Eq. (18) (Willmott, 1982).
where n is number of observations; Pi is ETo estimated by the empirical methods for the i-th observation (mm day−1); Oi is EToPM for the i-th observation (mm day−1).The Kling-Gupta efficiency (KGE) (Gupta et al., 2009) was also calculated. KGE is a metric used to evaluate the performance of hydrological, climate, or simulation models, combining three critical components: the linear correlation between observed and estimated data, the ratio between estimated and observed variability, and the ratio between the mean of the estimated and observed values (Eq. (19)). The KGE ranges from −∞ to 1, where 1 indicates a perfect match between the observed values (EToPM) and the values estimated by the alternative methods evaluated.
where r is linear correlation coefficient between ETo estimated by the empirical methods and EToPM; σp is standard deviation of ETo estimated by the empirical methods; σo is standard deviation of EToPM; μp is mean of ETo estimated by the empirical methods; and μo is mean of EToPM.Percent bias (PBIAS) measures the average tendency of the estimated data to be larger or smaller than the observed data. Thus, the ideal value of PBIAS is zero; positive values indicate a model underestimation bias, whereas negative values indicate an overestimation bias (Gupta et al., 1999; Moriasi et al., 2007). PBIAS is expressed as a percentage (%), calculated as in Eq. (20).
Subsequently, the data were grouped by climate classes, and the performance metrics of each ETo method were summarized using boxplots. Following Almeida et al. (2021), the central box of the plot is bounded by the first and third quartiles (Q1 and Q3), with a line representing the median. The interquartile range (IQR) is defined as the difference between Q3 and Q1 and is used to determine the upper and lower limits (whiskers), which extend to the smallest and largest values within 1.5 times the IQR from the quartiles, aiding in the identification of outliers represented as points beyond this range.
3. Results
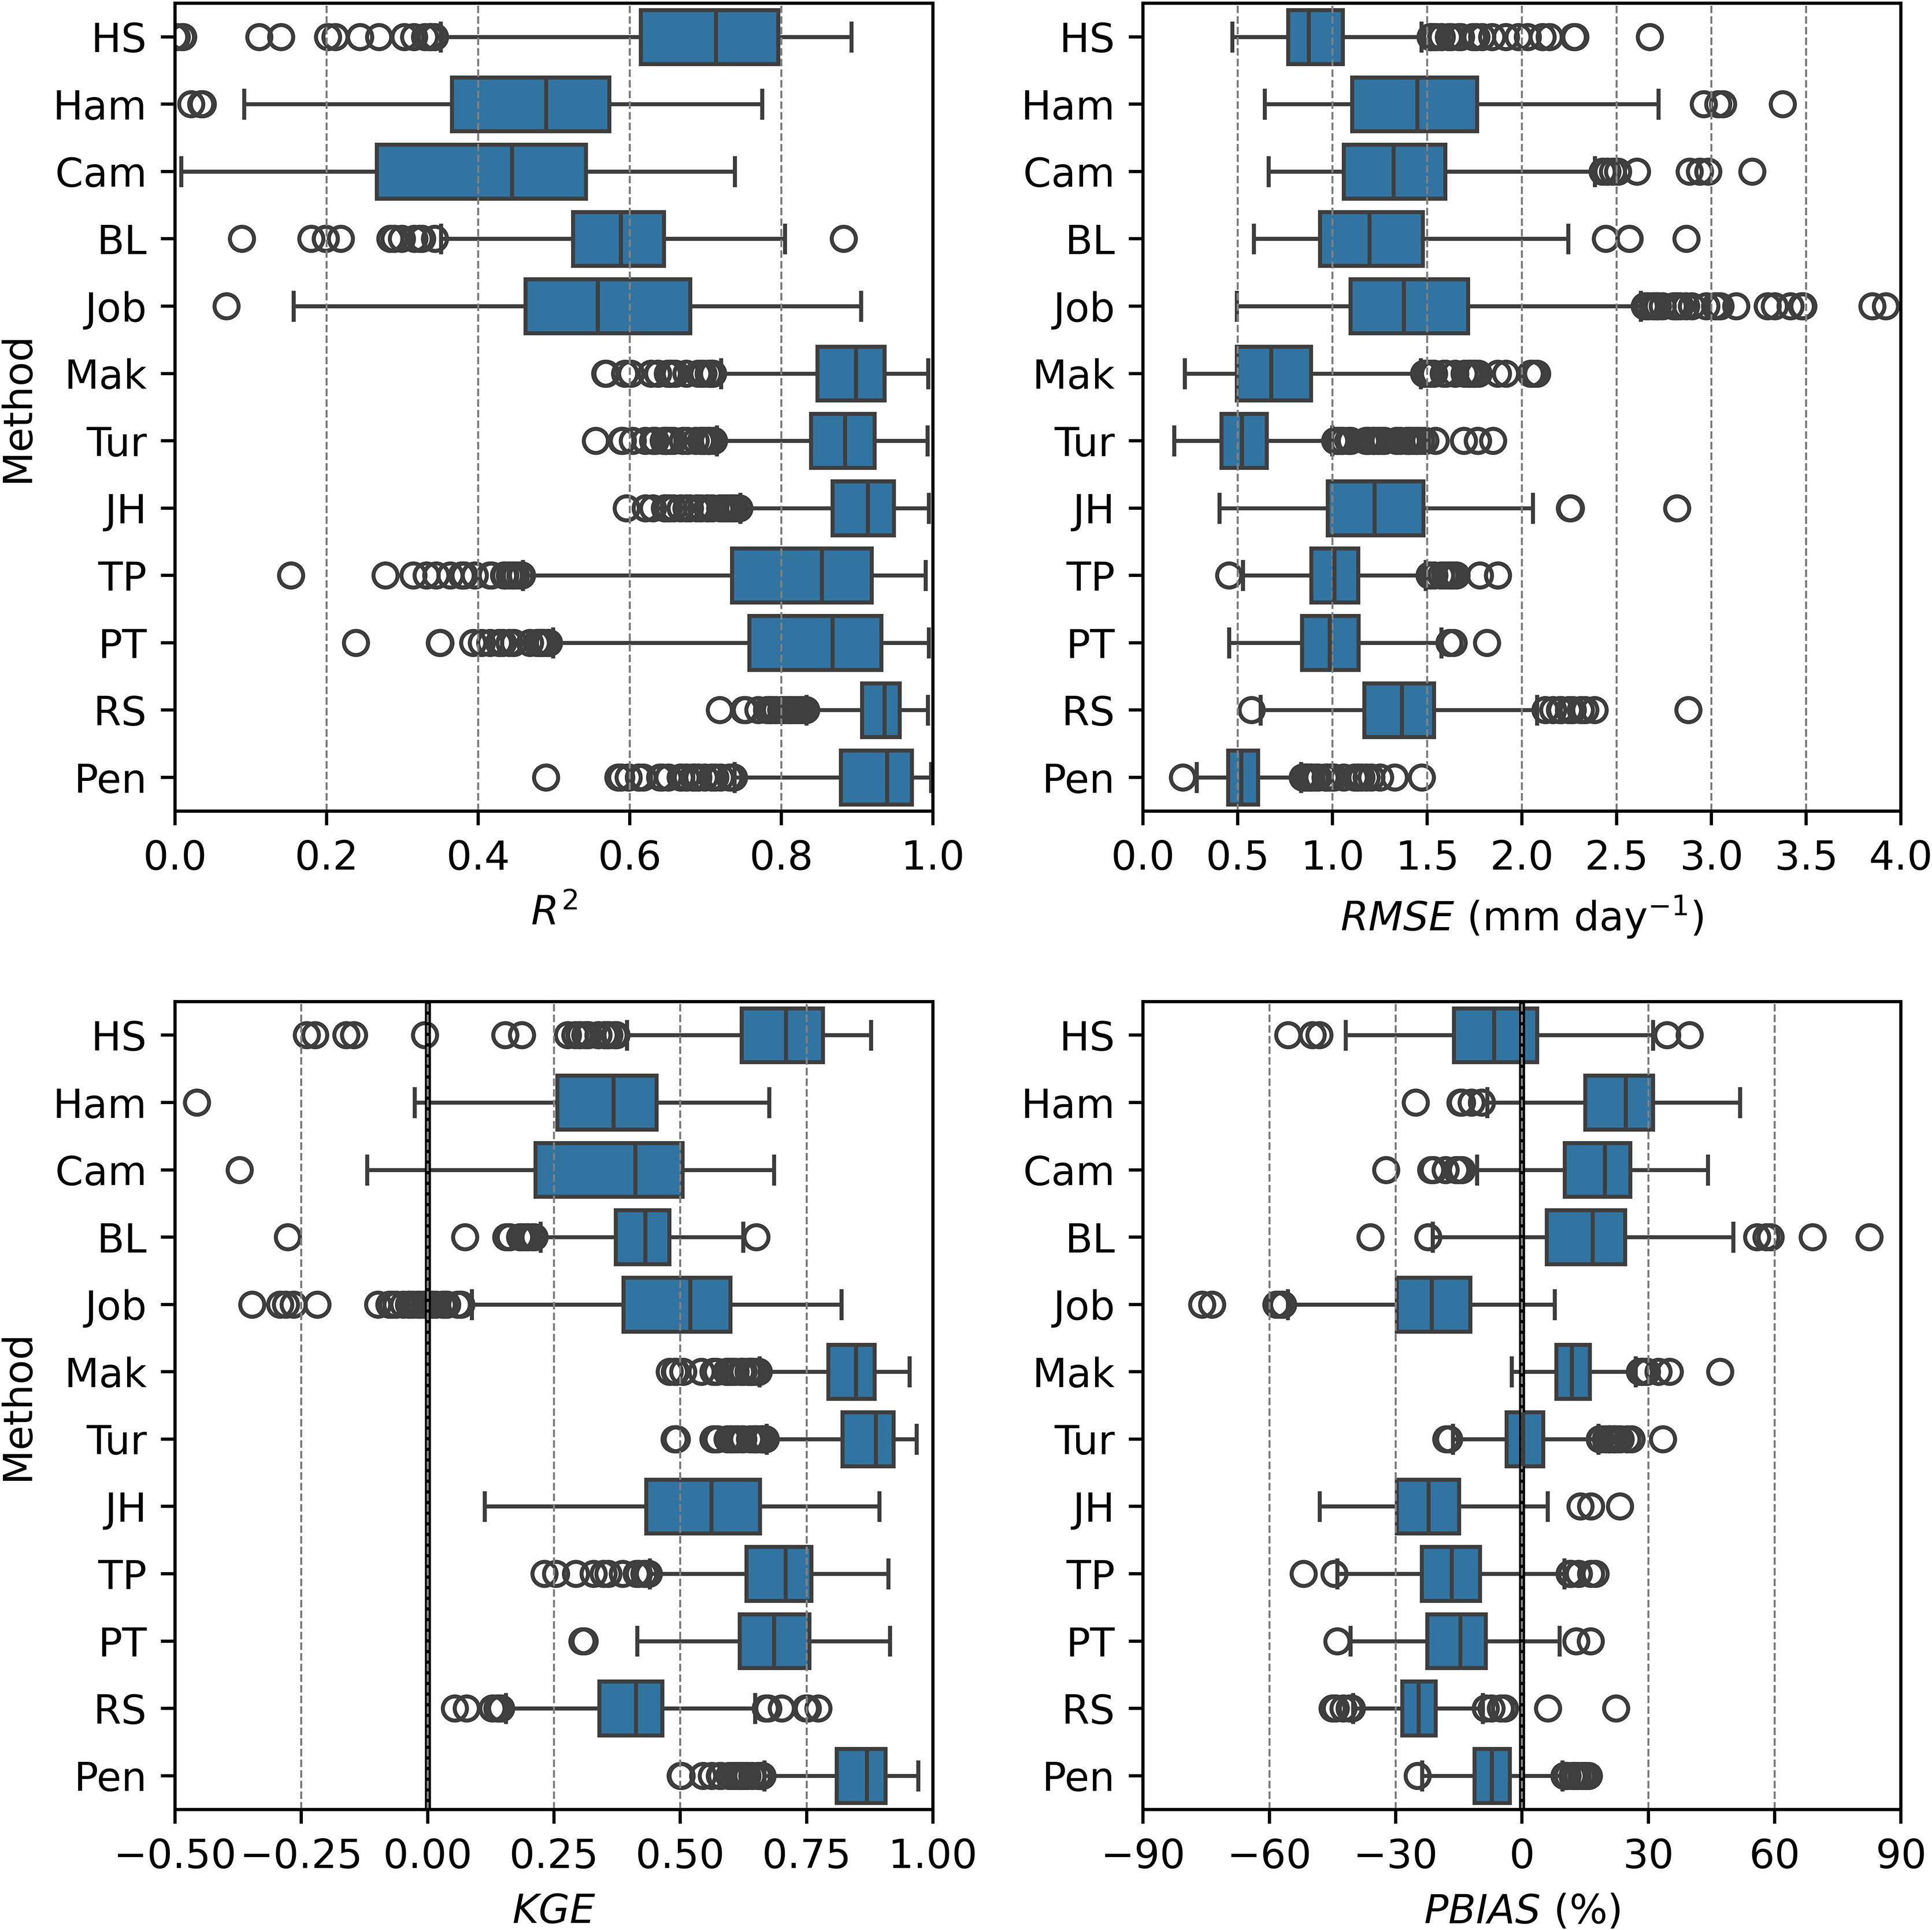
In general, the mass balance-based method - Penman (Pen) - showed the best performance across the diverse climates of Brazil; based on the median, it exhibited higher precision (higher R2) and accuracy (KGE) of the estimates, with lower errors (RMSE) (Fig. 3). It was followed by the radiation-based methods, notably Turc (Tur), which had the lowest PBIAS, and Makkink (Mak). The poorest performances were obtained by the air-temperature-based methods, particularly Camargo (Cam) and Jobson (Job). The Hargreaves (HS) method stands out, as it performed better than the other air-temperature-based methods and also showed lower error (RMSE and PBIAS) and higher accuracy (KGE) - or performance similar to - some radiation-based methods (e.g., Jensen-Haise (JH), Tanner-Pelton (TP), Priestley-Taylor (PT), and Solar Radiation (RS)), albeit with greater dispersion of the estimates, i.e., lower R2.
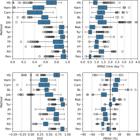
Statistical performance of the daily reference evapotranspiration methods for the 584 Brazilian automatic weather stations. Hargreaves-Samani (HS), Hamon (Ham), Camargo (Cam), Benevides-Lopez (BL), Jobson (Job), Makkink (Mak), Turc (Tur), Jensen-Haise (JH), Tanner-Pelton (TP), Priestley-Taylor (PT), Solar Radiation (RS), and Penman (Pen).
The range and outliers of the statistical indices for the air-temperature-based methods were greater than those of the other methods, indicating greater variability in the performance of these methods. This greater variability may be related primarily to climate. The Pen, Tur, and Mak methods exhibited smaller ranges and fewer outliers for most statistical indices and thus showed less variation in performance, in addition to presenting the best overall performances. Based on PBIAS, the Hamon (Ham), Camargo (Cam), Benevides-Lopez (BL), and Makkink (Mak) methods showed a general pattern of underestimation, whereas the others showed overestimation, with Tur at the median showing a PBIAS close to the ideal (0).
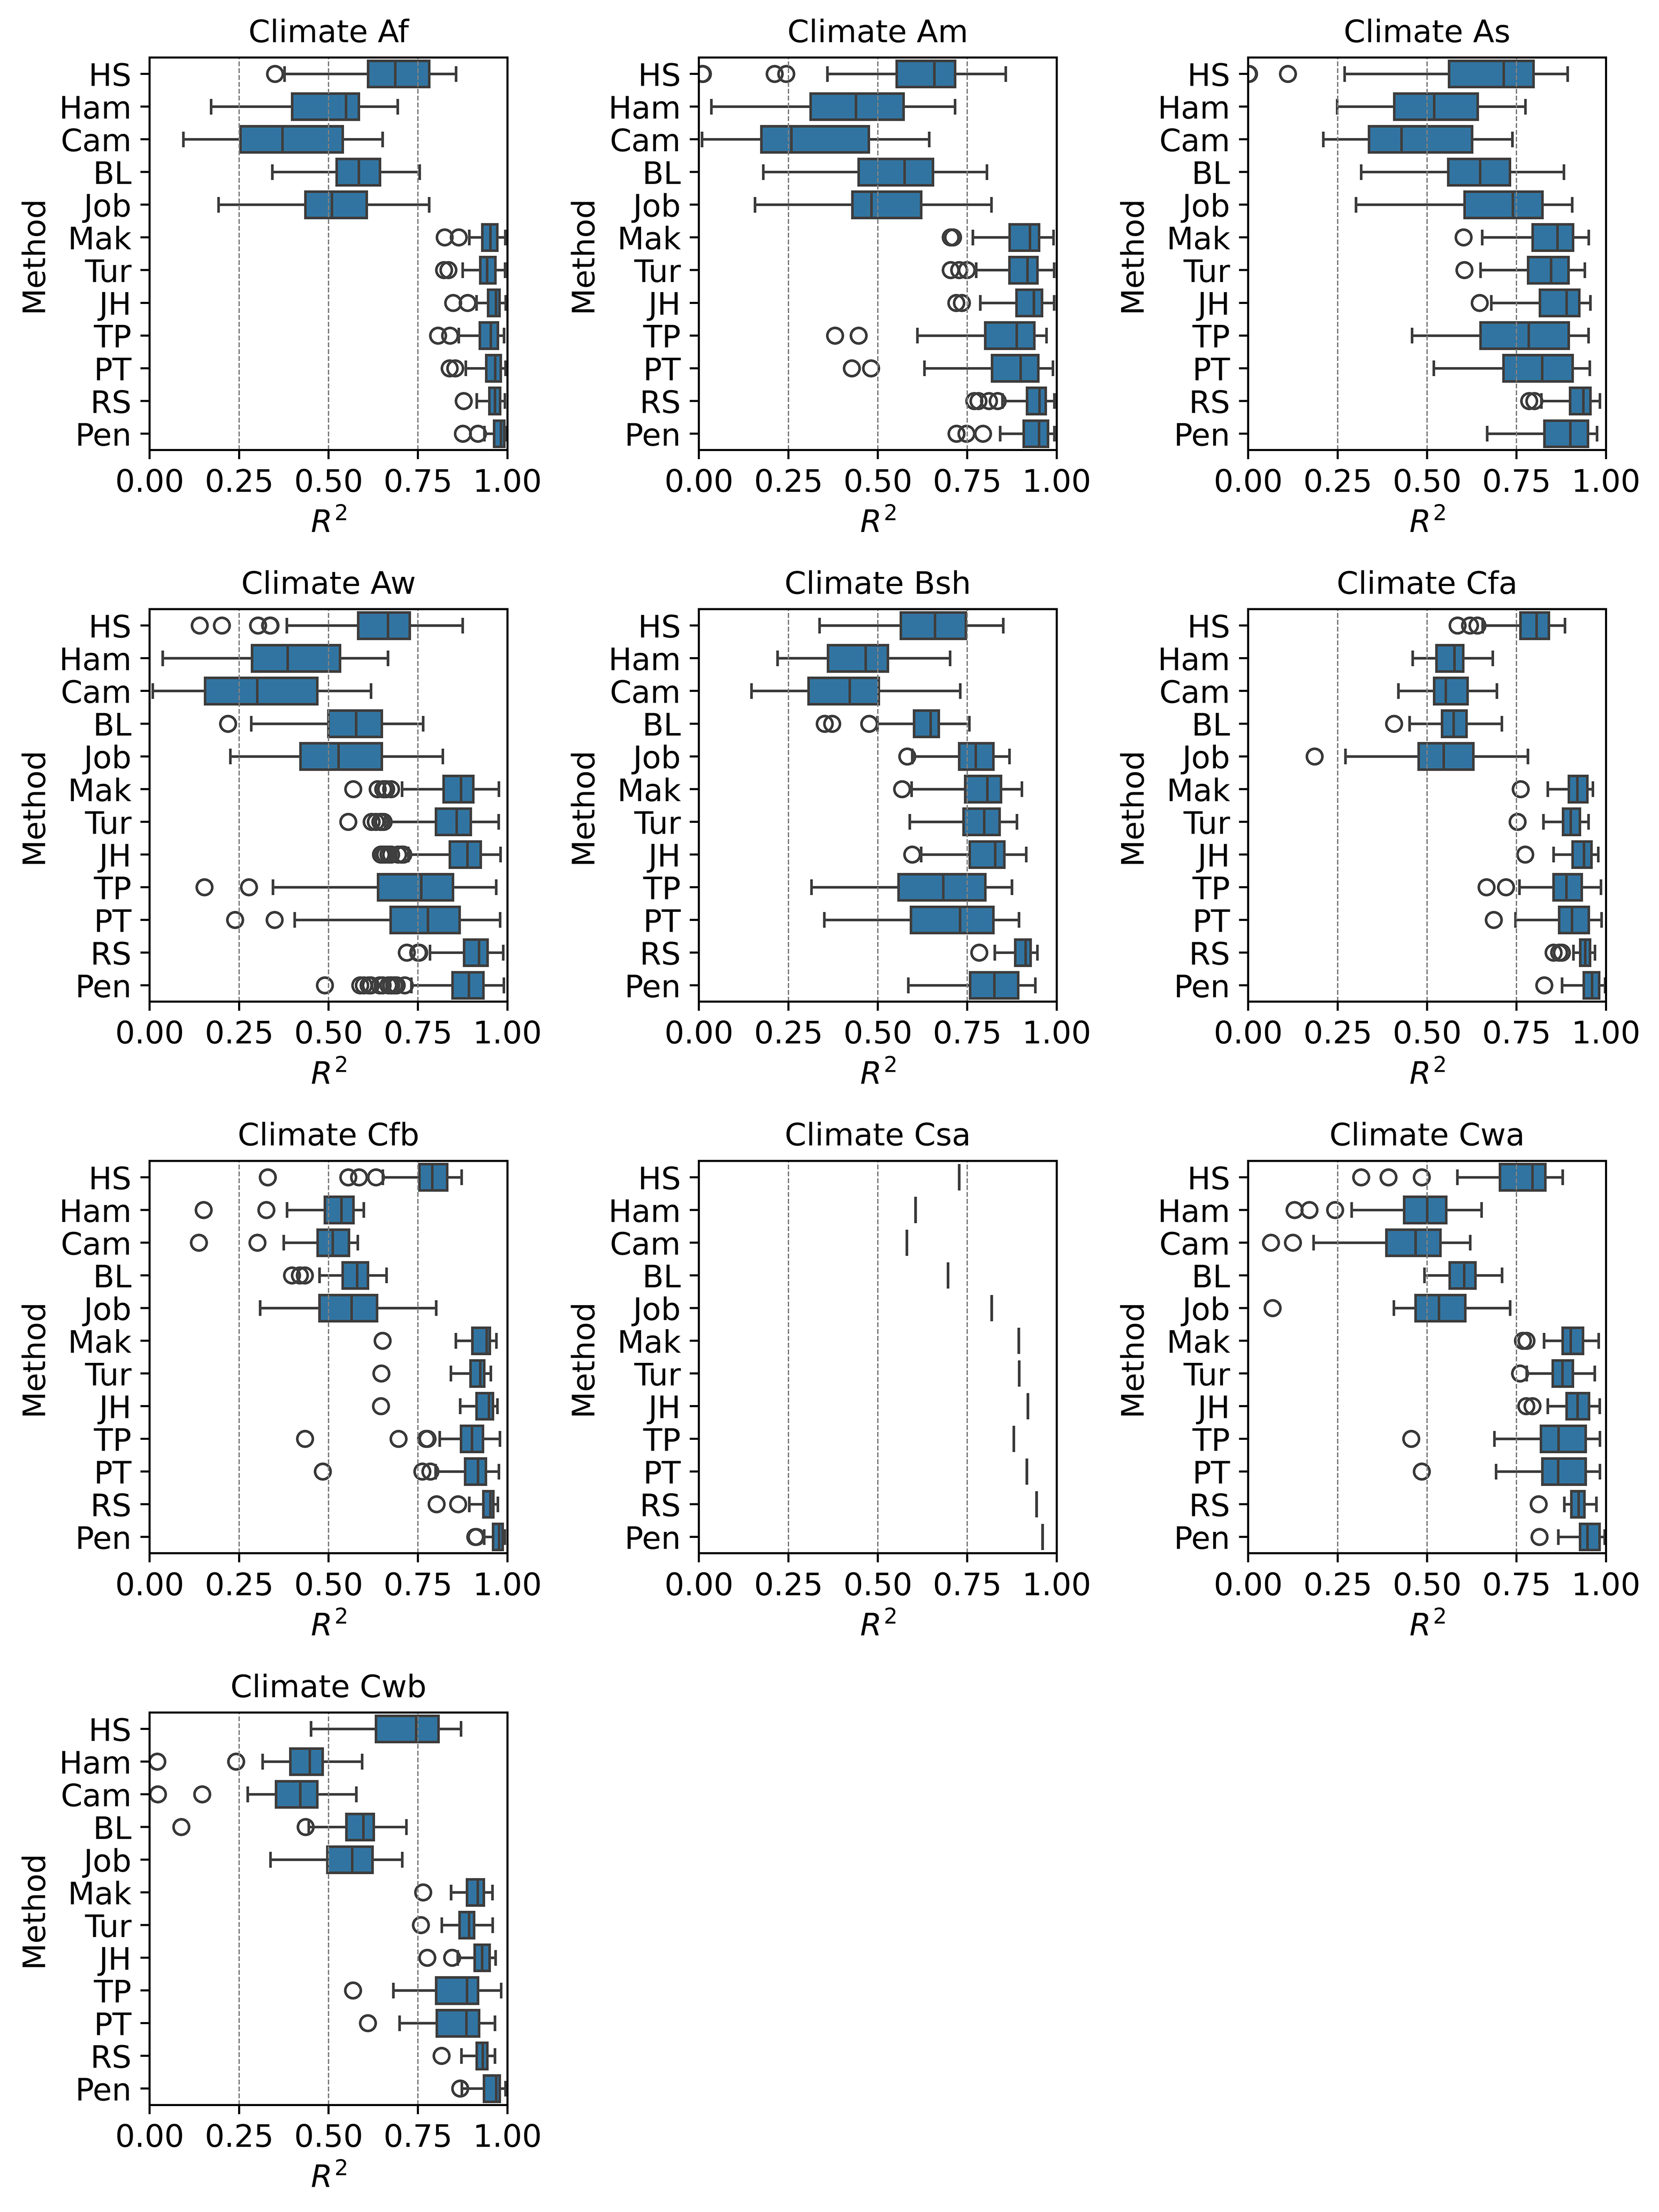
The radiation-based and mass balance-based methods, in climates Af, Am, and all C subtypes, had median precision (R2) greater than 0.8, being more precise than in climates As, Aw, and Bsh (Fig. 4). The Pen and RS methods alternated the highest precisions among the methods, with the RS method standing out in climates As, Aw, and Bsh, and Pen having the highest R2 in the other climates. Regardless of climate, the JS, Mak, and Tur methods had precision inferior only to Pen and RS. In most climates, the PT and TP methods were the least precise among the radiation-based methods. An exception to the radiation-based method patterns was observed for climate Af, where the PT and TP methods showed higher precision than Mak and Tur. In addition to being less precise in climates As, Aw, and Bsh, the radiation-based methods and Pen had larger ranges and more outliers in these climates.
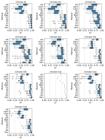
Statistical performance of daily evapotranspiration methods, considering the coefficient of determination (R2), by climate class in Brazil. Hargreaves-Samani (HS), Hamon (Ham), Camargo (Cam), Benevides-Lopez (BL), Jobson (Job), Makkink (Mak), Turc (Tur), Jensen-Haise (JH), Tanner-Pelton (TP), Priestley-Taylor (PT), Solar Radiation (RS), and Penman (Pen).
The temperature-based methods had higher precision in climates As, Cfa, Cfb, and Csa. For these climates, R2 predominantly exceeded 0.50, except for the Cam method in climate As. The lowest precisions for the temperature-based methods were observed for climate Am, followed by Aw, Af, and As. HS showed the highest precision among the temperature-based methods, with emphasis in the C-type climates (R2 > 0.75). The exception was the Job method for climate Csa, which had higher precision than HS. For all methods, the Aw climate showed a wide R2 range and a greater number of outliers.
It is evident that for R2, as well as for RMSE, the radiation-based methods generally exhibited superior performance when compared with the temperature-based methods. Among the temperature-based methods, those that use only the mean (Ham and Cam) were less precise when compared with those that include humidity (BL) and humidity plus wind (Job), for most climates.
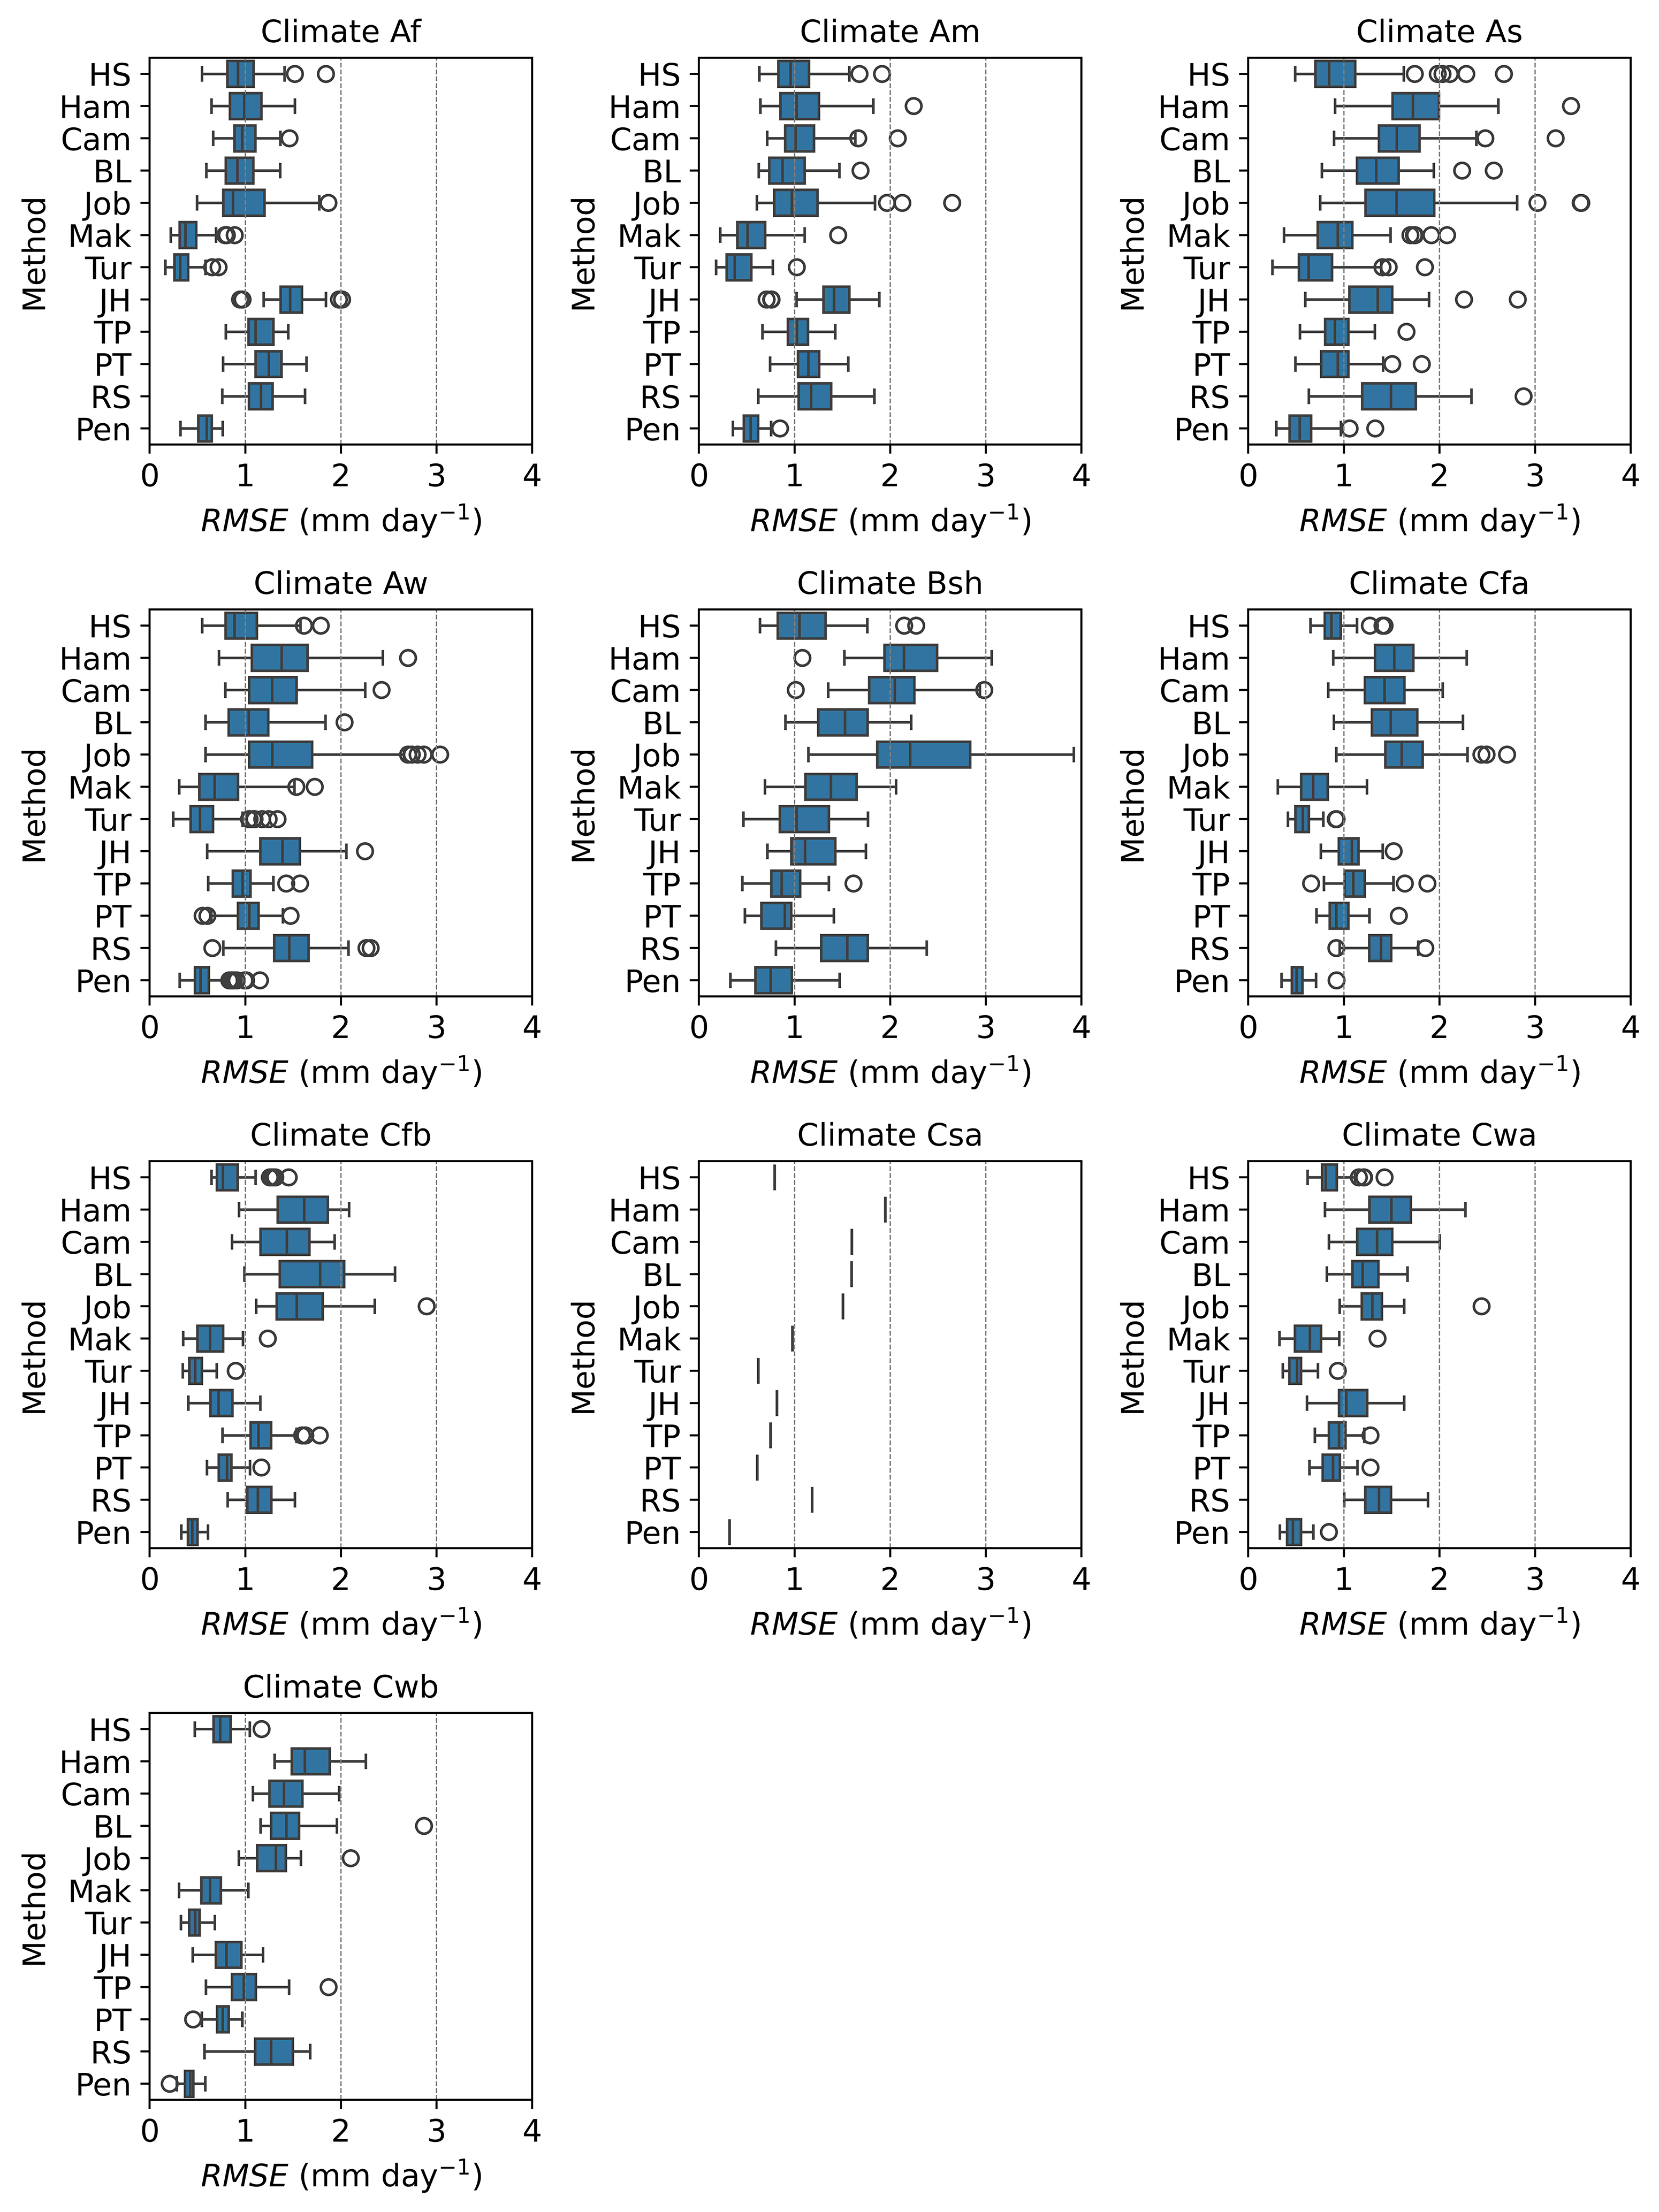
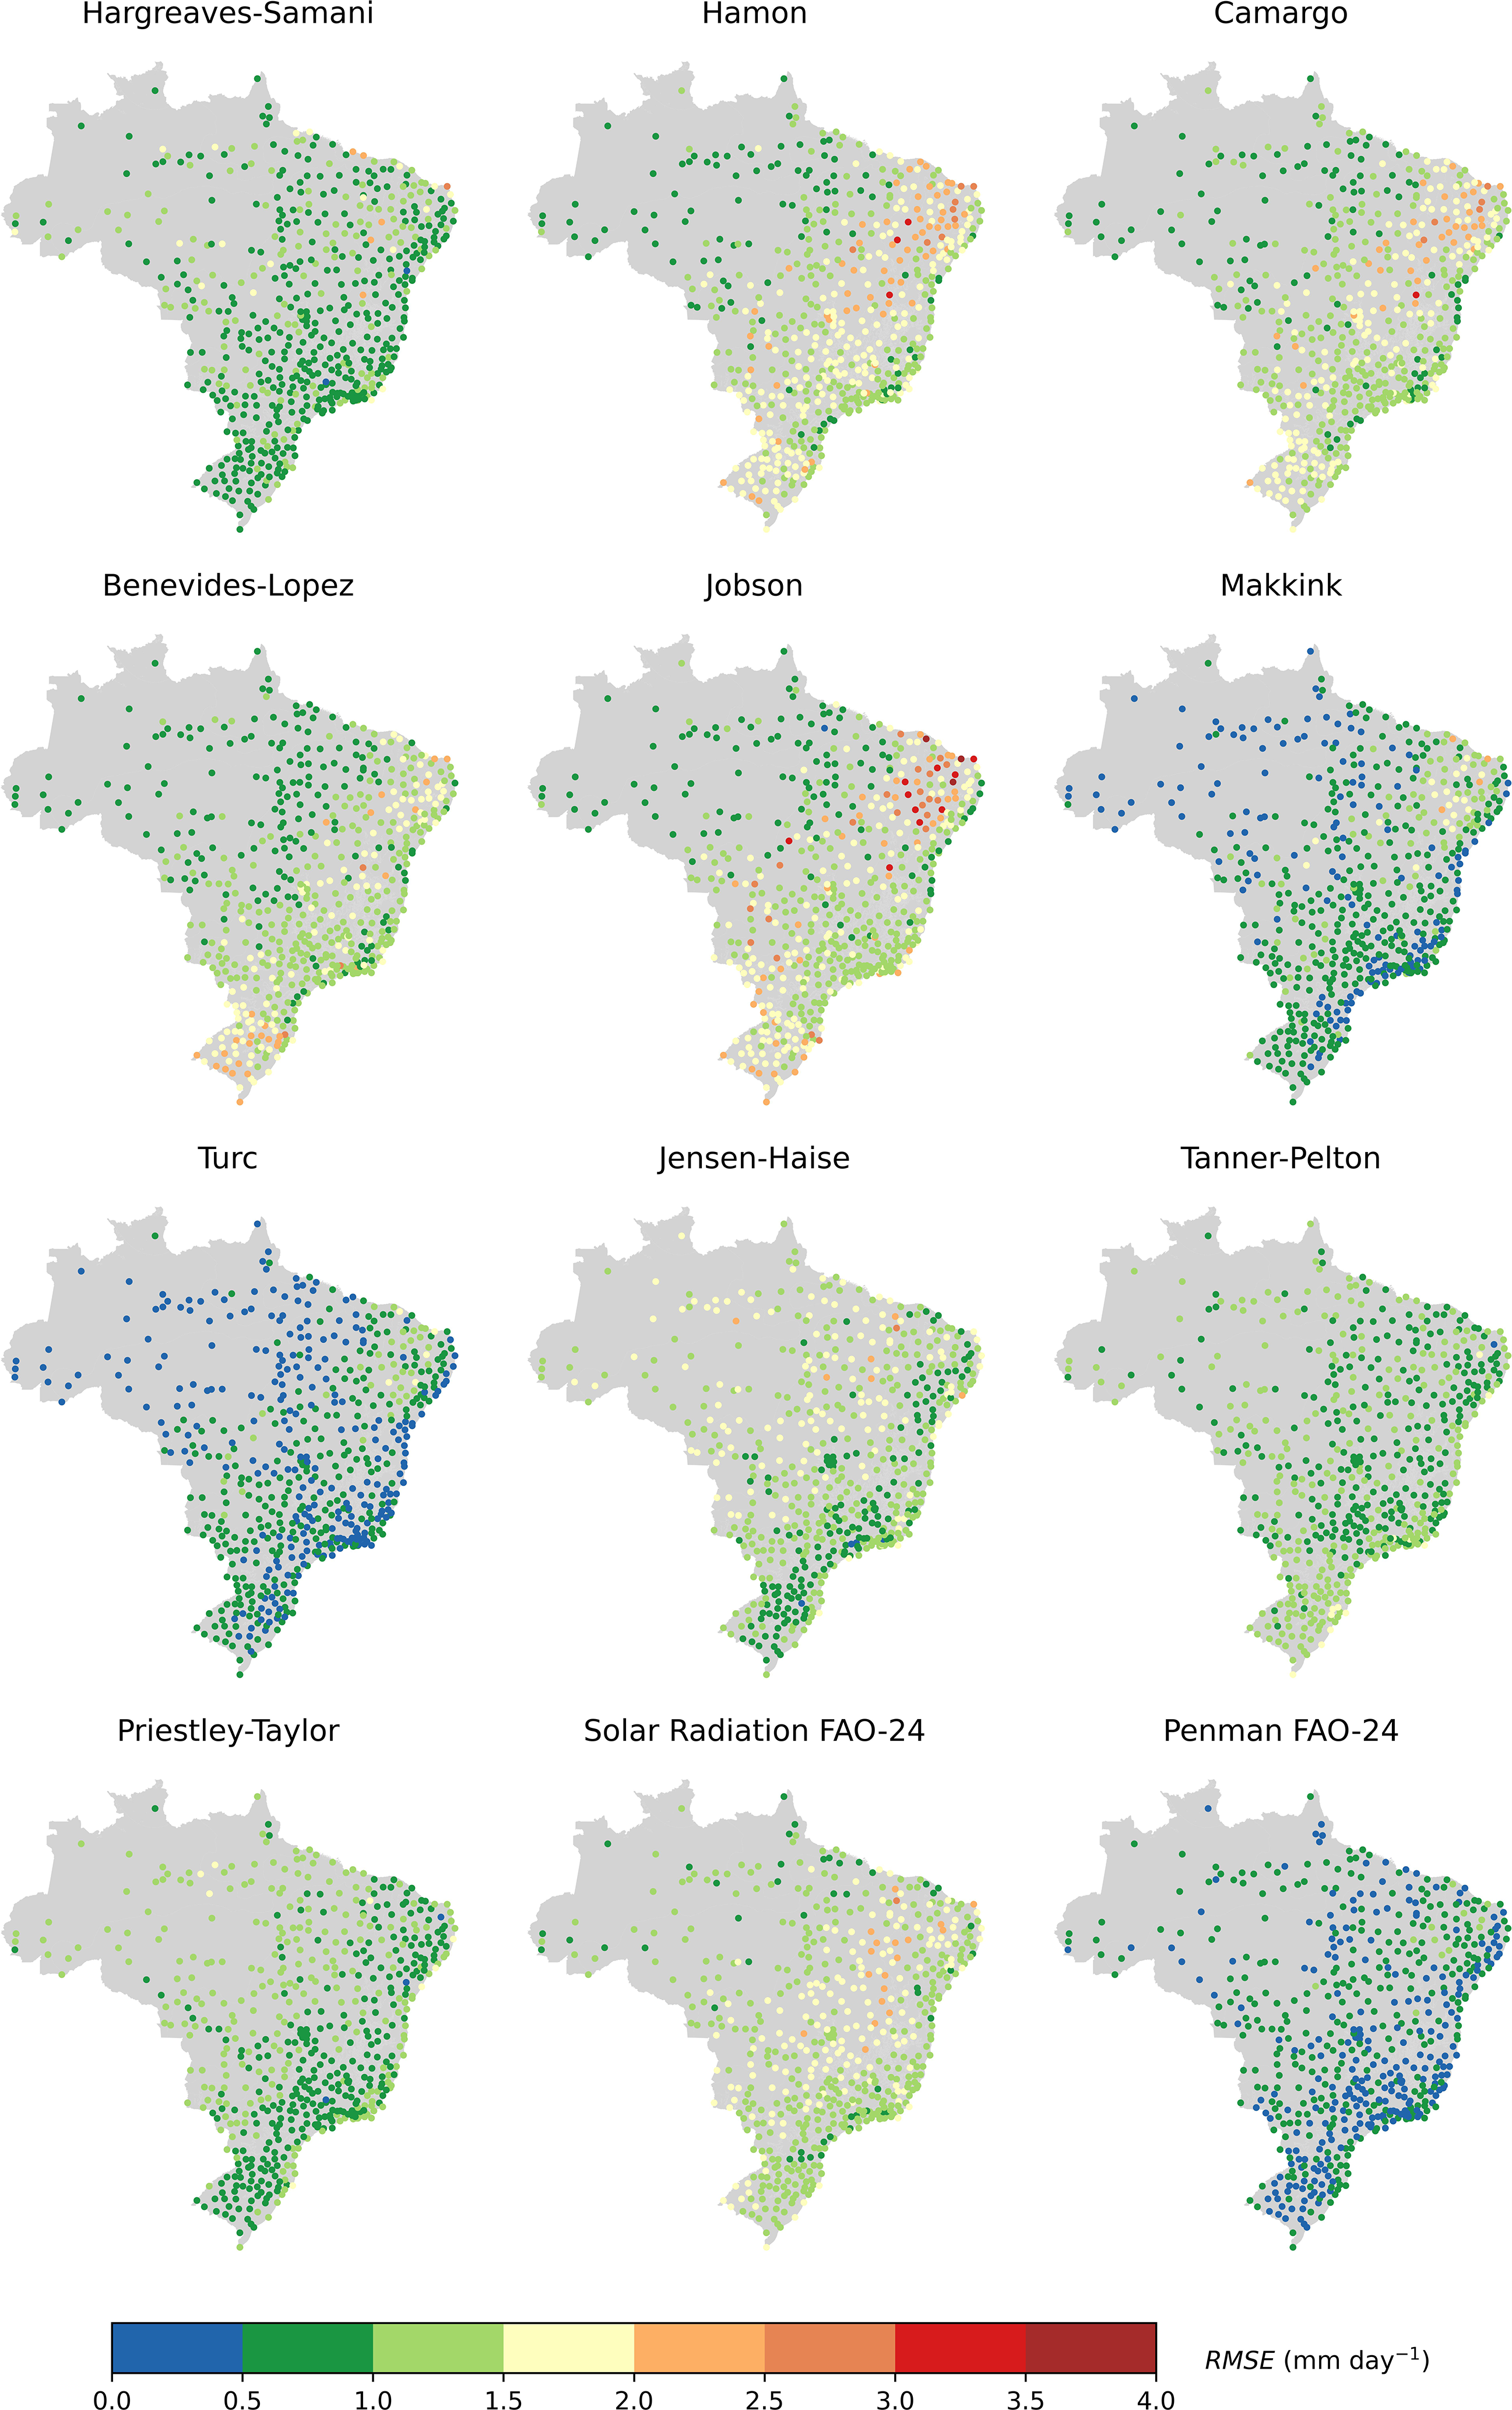
Figures 5 and 6 represent the RMSE associated with each climate and for each automatic weather station (AWS), respectively. In general, a decrease in performance was observed for all methods in climates Bsh and Af relative to the other climates. However, the HS method stood out by maintaining consistency with respect to RMSE across Brazil (Fig. 5).
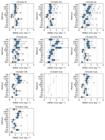
Statistical performance of daily evapotranspiration methods, considering the root mean square error (RMSE), by climate class in Brazil. Hargreaves-Samani (HS), Hamon (Ham), Camargo (Cam), Benevides-Lopez (BL), Jobson (Job), Makkink (Mak), Turc (Tur), Jensen-Haise (JH), Tanner-Pelton (TP), Priestley-Taylor (PT), Solar Radiation (RS), and Penman (Pen).
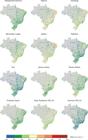
Statistical performance of daily evapotranspiration methods, considering the root mean square error (RMSE), for each meteorological station in Brazil.
Furthermore, Fig. 5 shows that the Pen method performed better than the other methods in all climates, except in climates Af and Am, where Tur performed better. In climate Bsh, the Pen and PT methods showed better performance according to RMSE.
The spatial analysis of RMSE for the different ETo methods (Fig. 6) reveals consistent performance patterns associated with Brazil's regional climatic characteristics. Methods such as Hamon, Camargo, Jobson, and Benevides-Lopez exhibit higher error values, mainly at stations located on the northern coast and in the interior of the Nordeste, Centro-Oeste, and part of the Sul of the country - regions characterized by the predominance of climates As, Bsh, Cwa, and Cwb, which are distinguished by lower annual precipitation totals and lower relative humidity indices. In contrast, the lowest RMSE values occur on the coast of the North East, in the Southeast, part of the South region, and in the North, where climates Am, As, and Aw predominate, marked by high rainfall totals and greater water availability. These results indicate that the performance of the methods is strongly related to the regional climatic type.
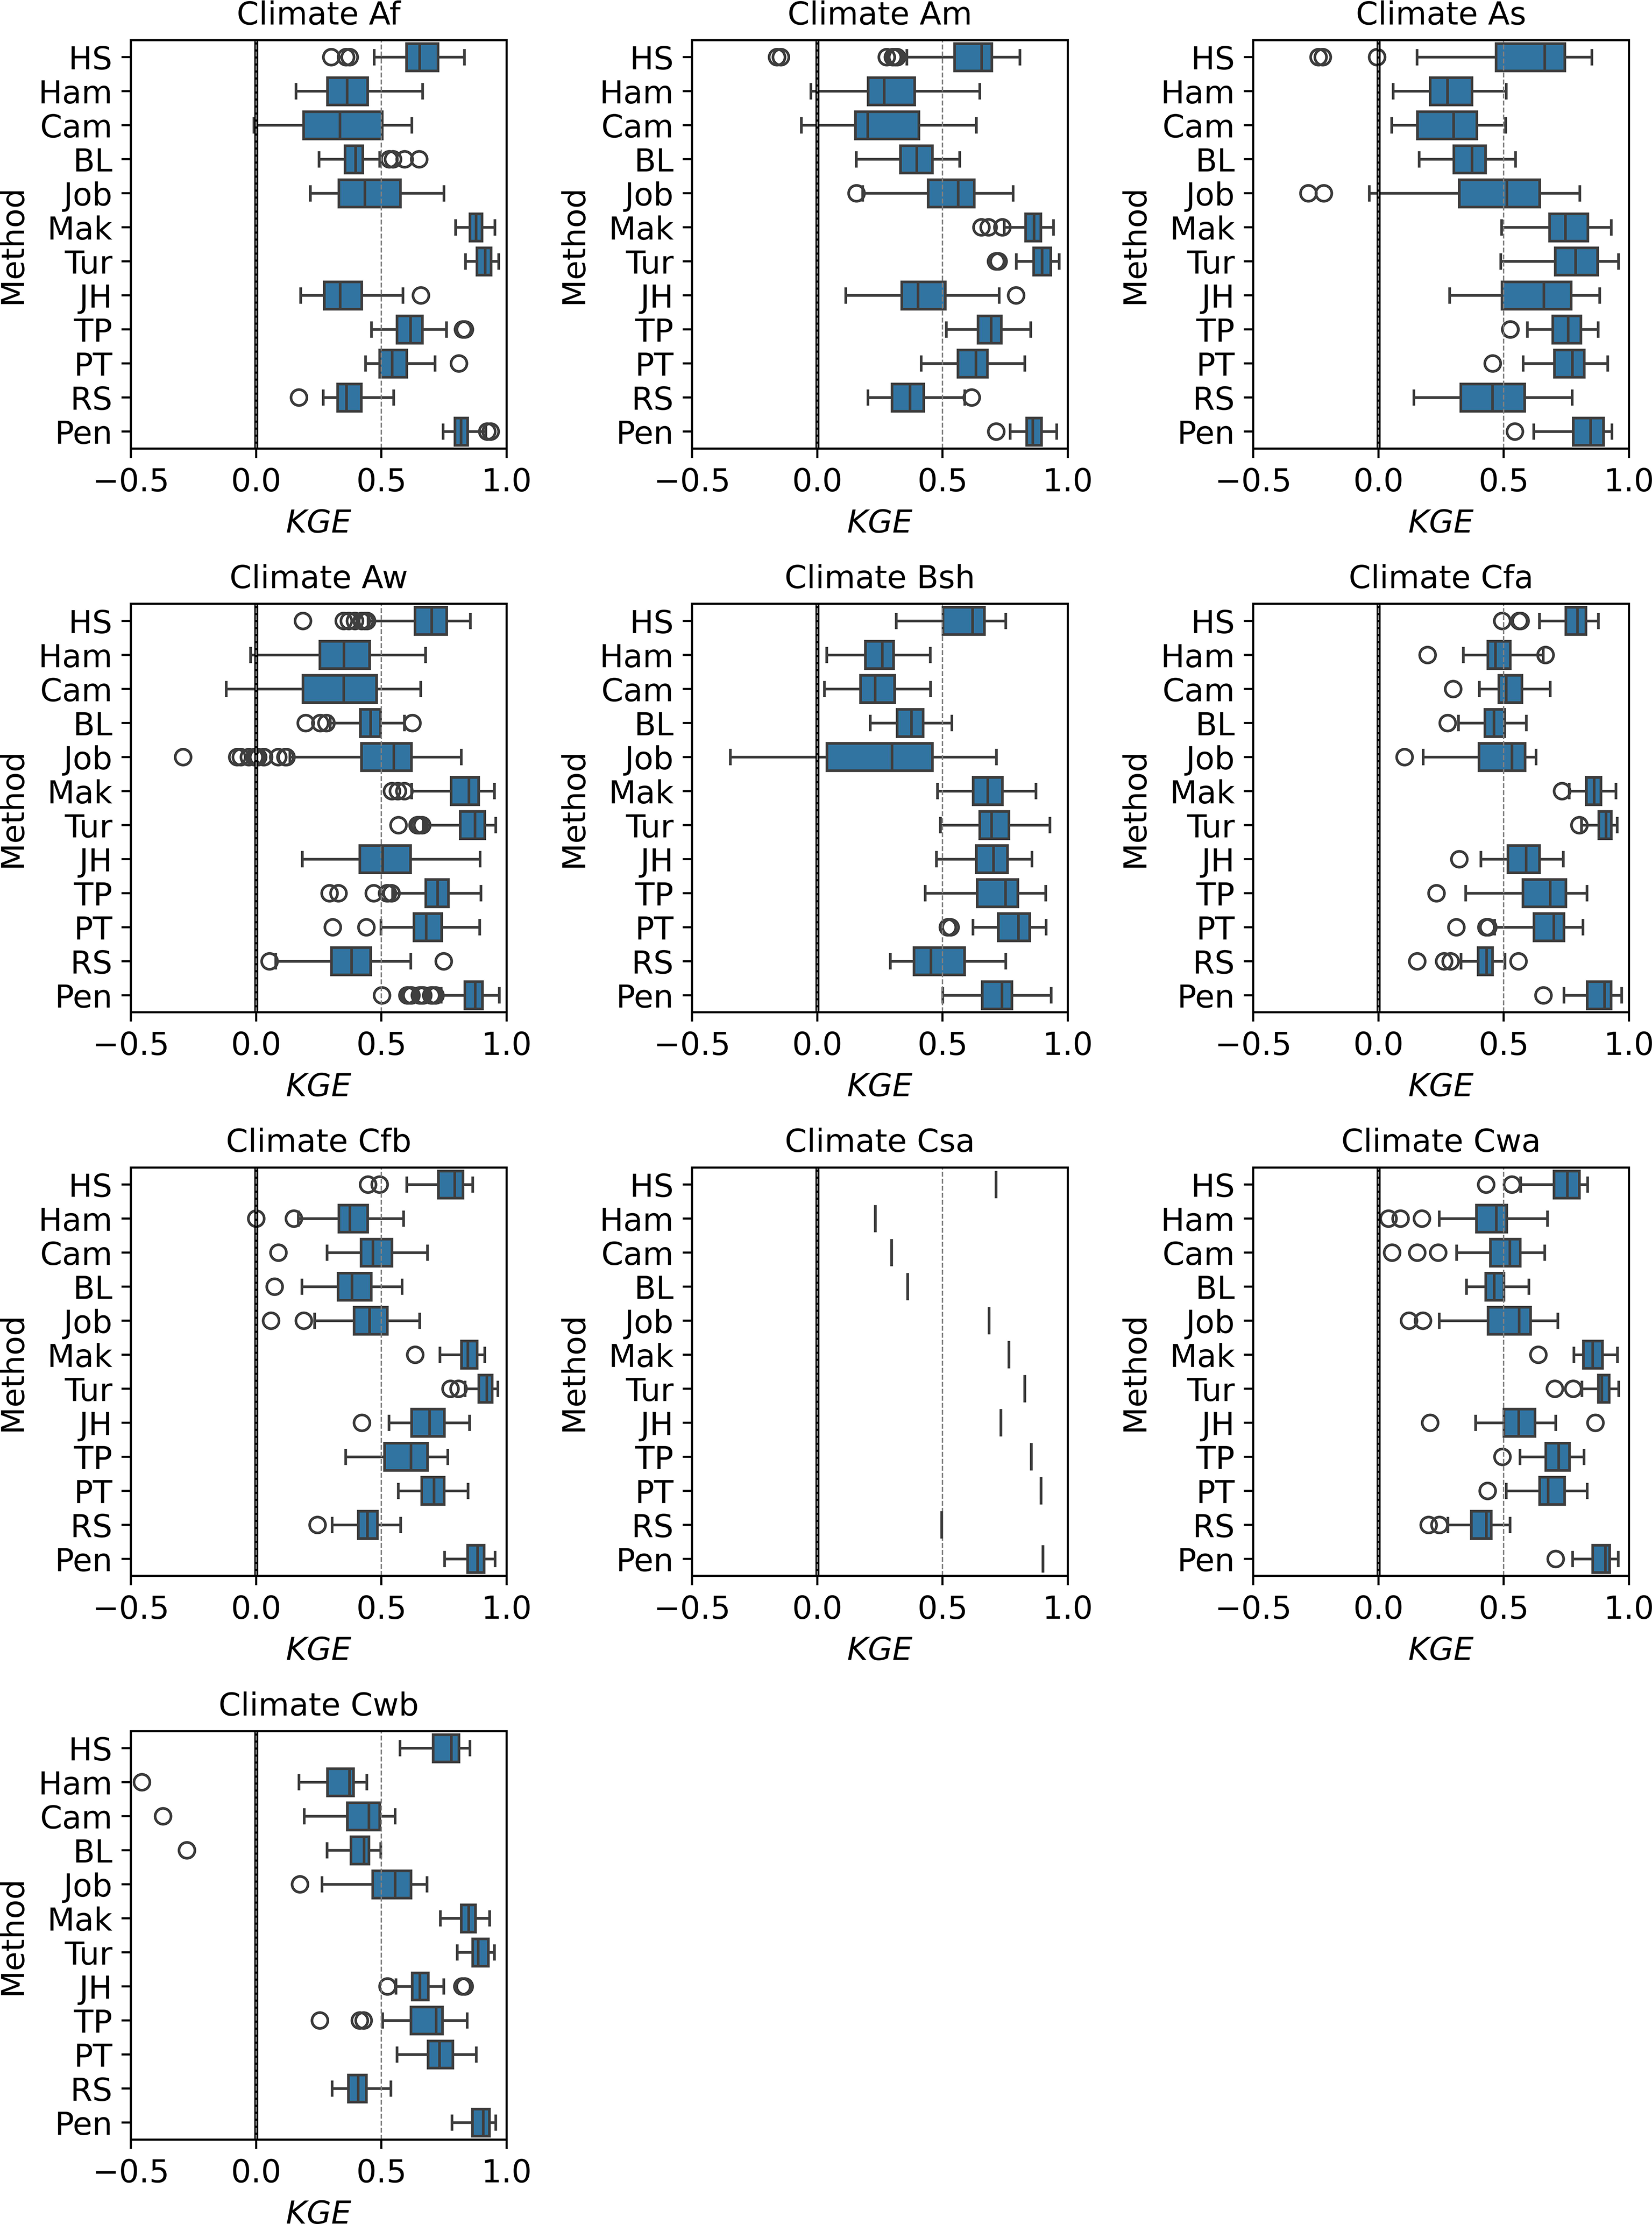
Figure 7 describes the statistical performance of the methods according to KGE values by climate class; among the temperature-based methods, HS maintained the best performance relative to the others, showing an increase in the interquartile range (IQR) in climate As. Considering all methods evaluated, PT achieved the best performance in climate Bsh, followed by TP and Pen.
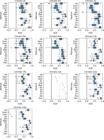
Statistical performance of daily evapotranspiration methods, considering the Kling-Gupta efficiency (KGE), by climate class in Brazil. Hargreaves-Samani (HS), Hamon (Ham), Camargo (Cam), Benevides-Lopez (BL), Jobson (Job), Makkink (Mak), Turc (Tur), Jensen-Haise (JH), Tanner-Pelton (TP), Priestley-Taylor (PT), Solar Radiation (RS), and Penman (Pen).
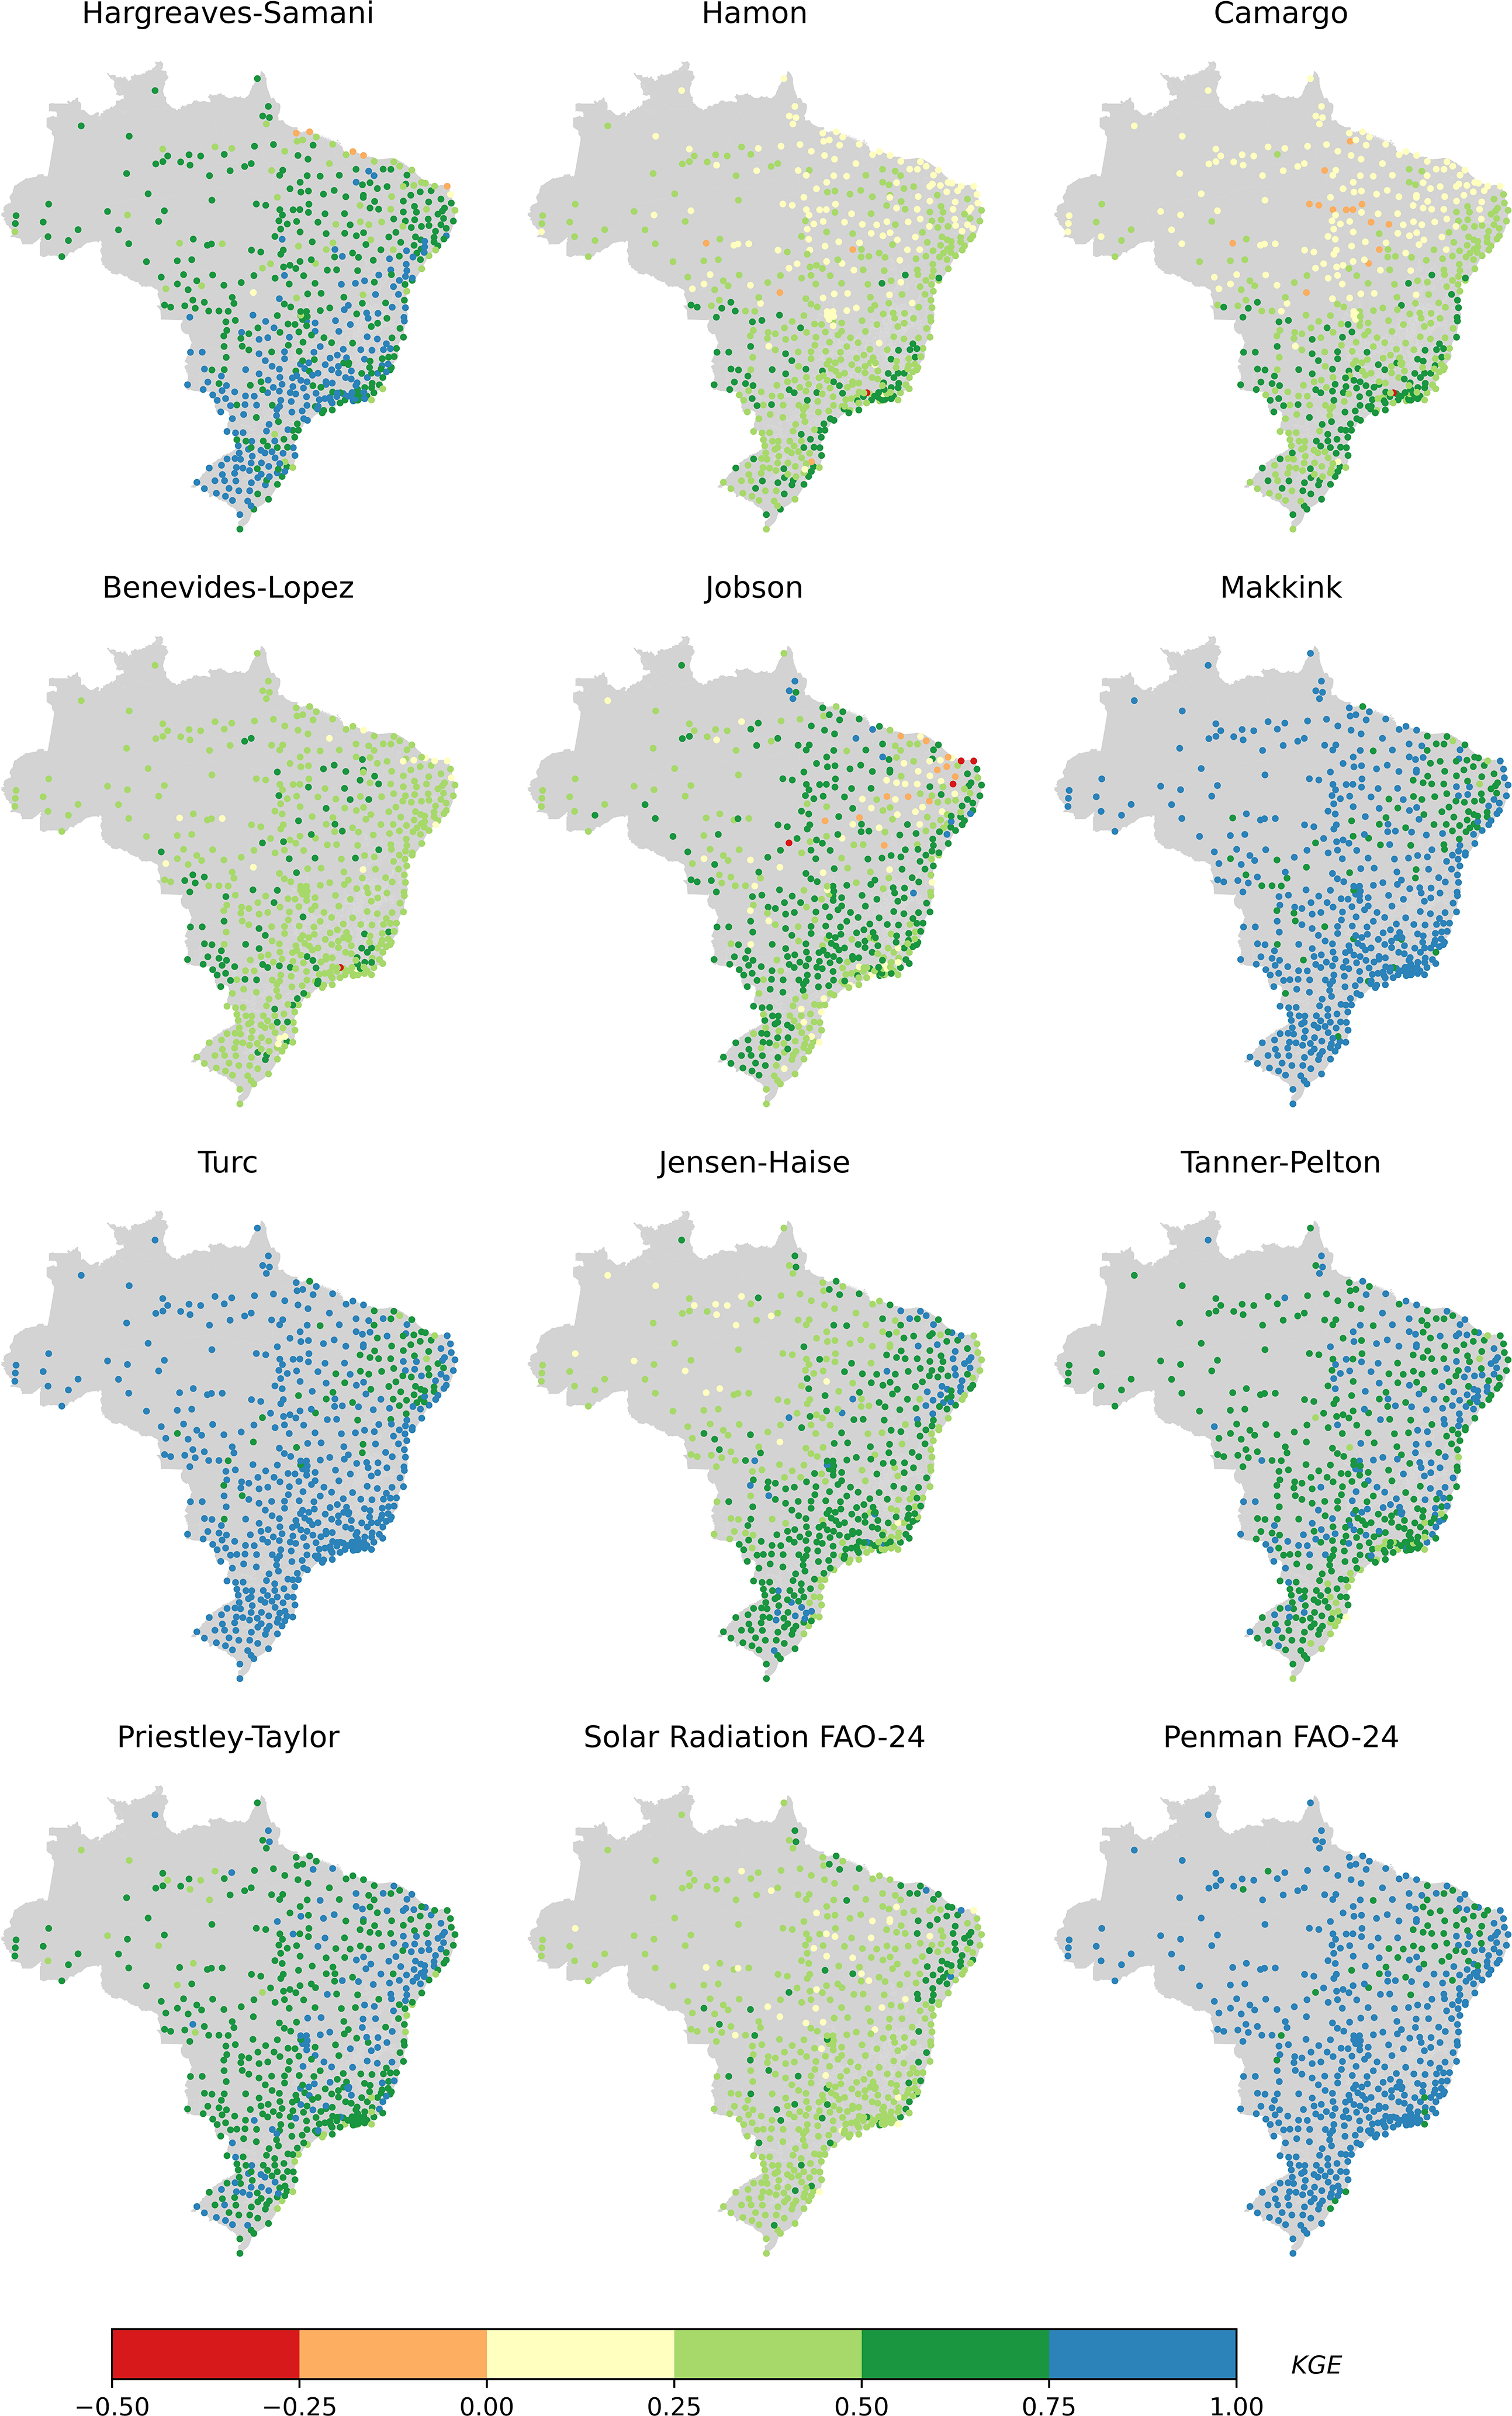
When KGE was evaluated for each meteorological station, HS was the method with the best agreement with the standard method among the temperature-based methods. With respect to the radiation-based methods, Mak, Tur, and Pen stand out (Fig. 8).
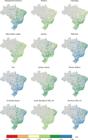
Statistical performance of daily evapotranspiration methods, considering the Kling-Gupta efficiency (KGE), for each meteorological station in Brazil.
The Tur method showed the closest agreement with the standard method for almost all climates, except for As, BSh, and Csa. For As and Csa, the HS and Pen methods performed best, whereas for BSh, TP and PT stood out. Among the temperature-based methods, the Job method exhibited a tendency to overestimate in all climates, which was also observed for the JH and RS methods among the radiation-based methods. Considering the most representative climates in Brazil (Af, Am, and Aw), the method with the smallest bias relative to PM was Tur (Fig. 9).
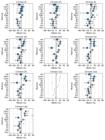
Statistical performance of daily evapotranspiration methods, considering percent bias (PBIAS), by climate class in Brazil. Hargreaves-Samani (HS), Hamon (Ham), Camargo (Cam), Benevides-Lopez (BL), Jobson (Job), Makkink (Mak), Turc (Tur), Jensen-Haise (JH), Tanner-Pelton (TP), Priestley-Taylor (PT), Solar Radiation (RS), and Penman (Pen).
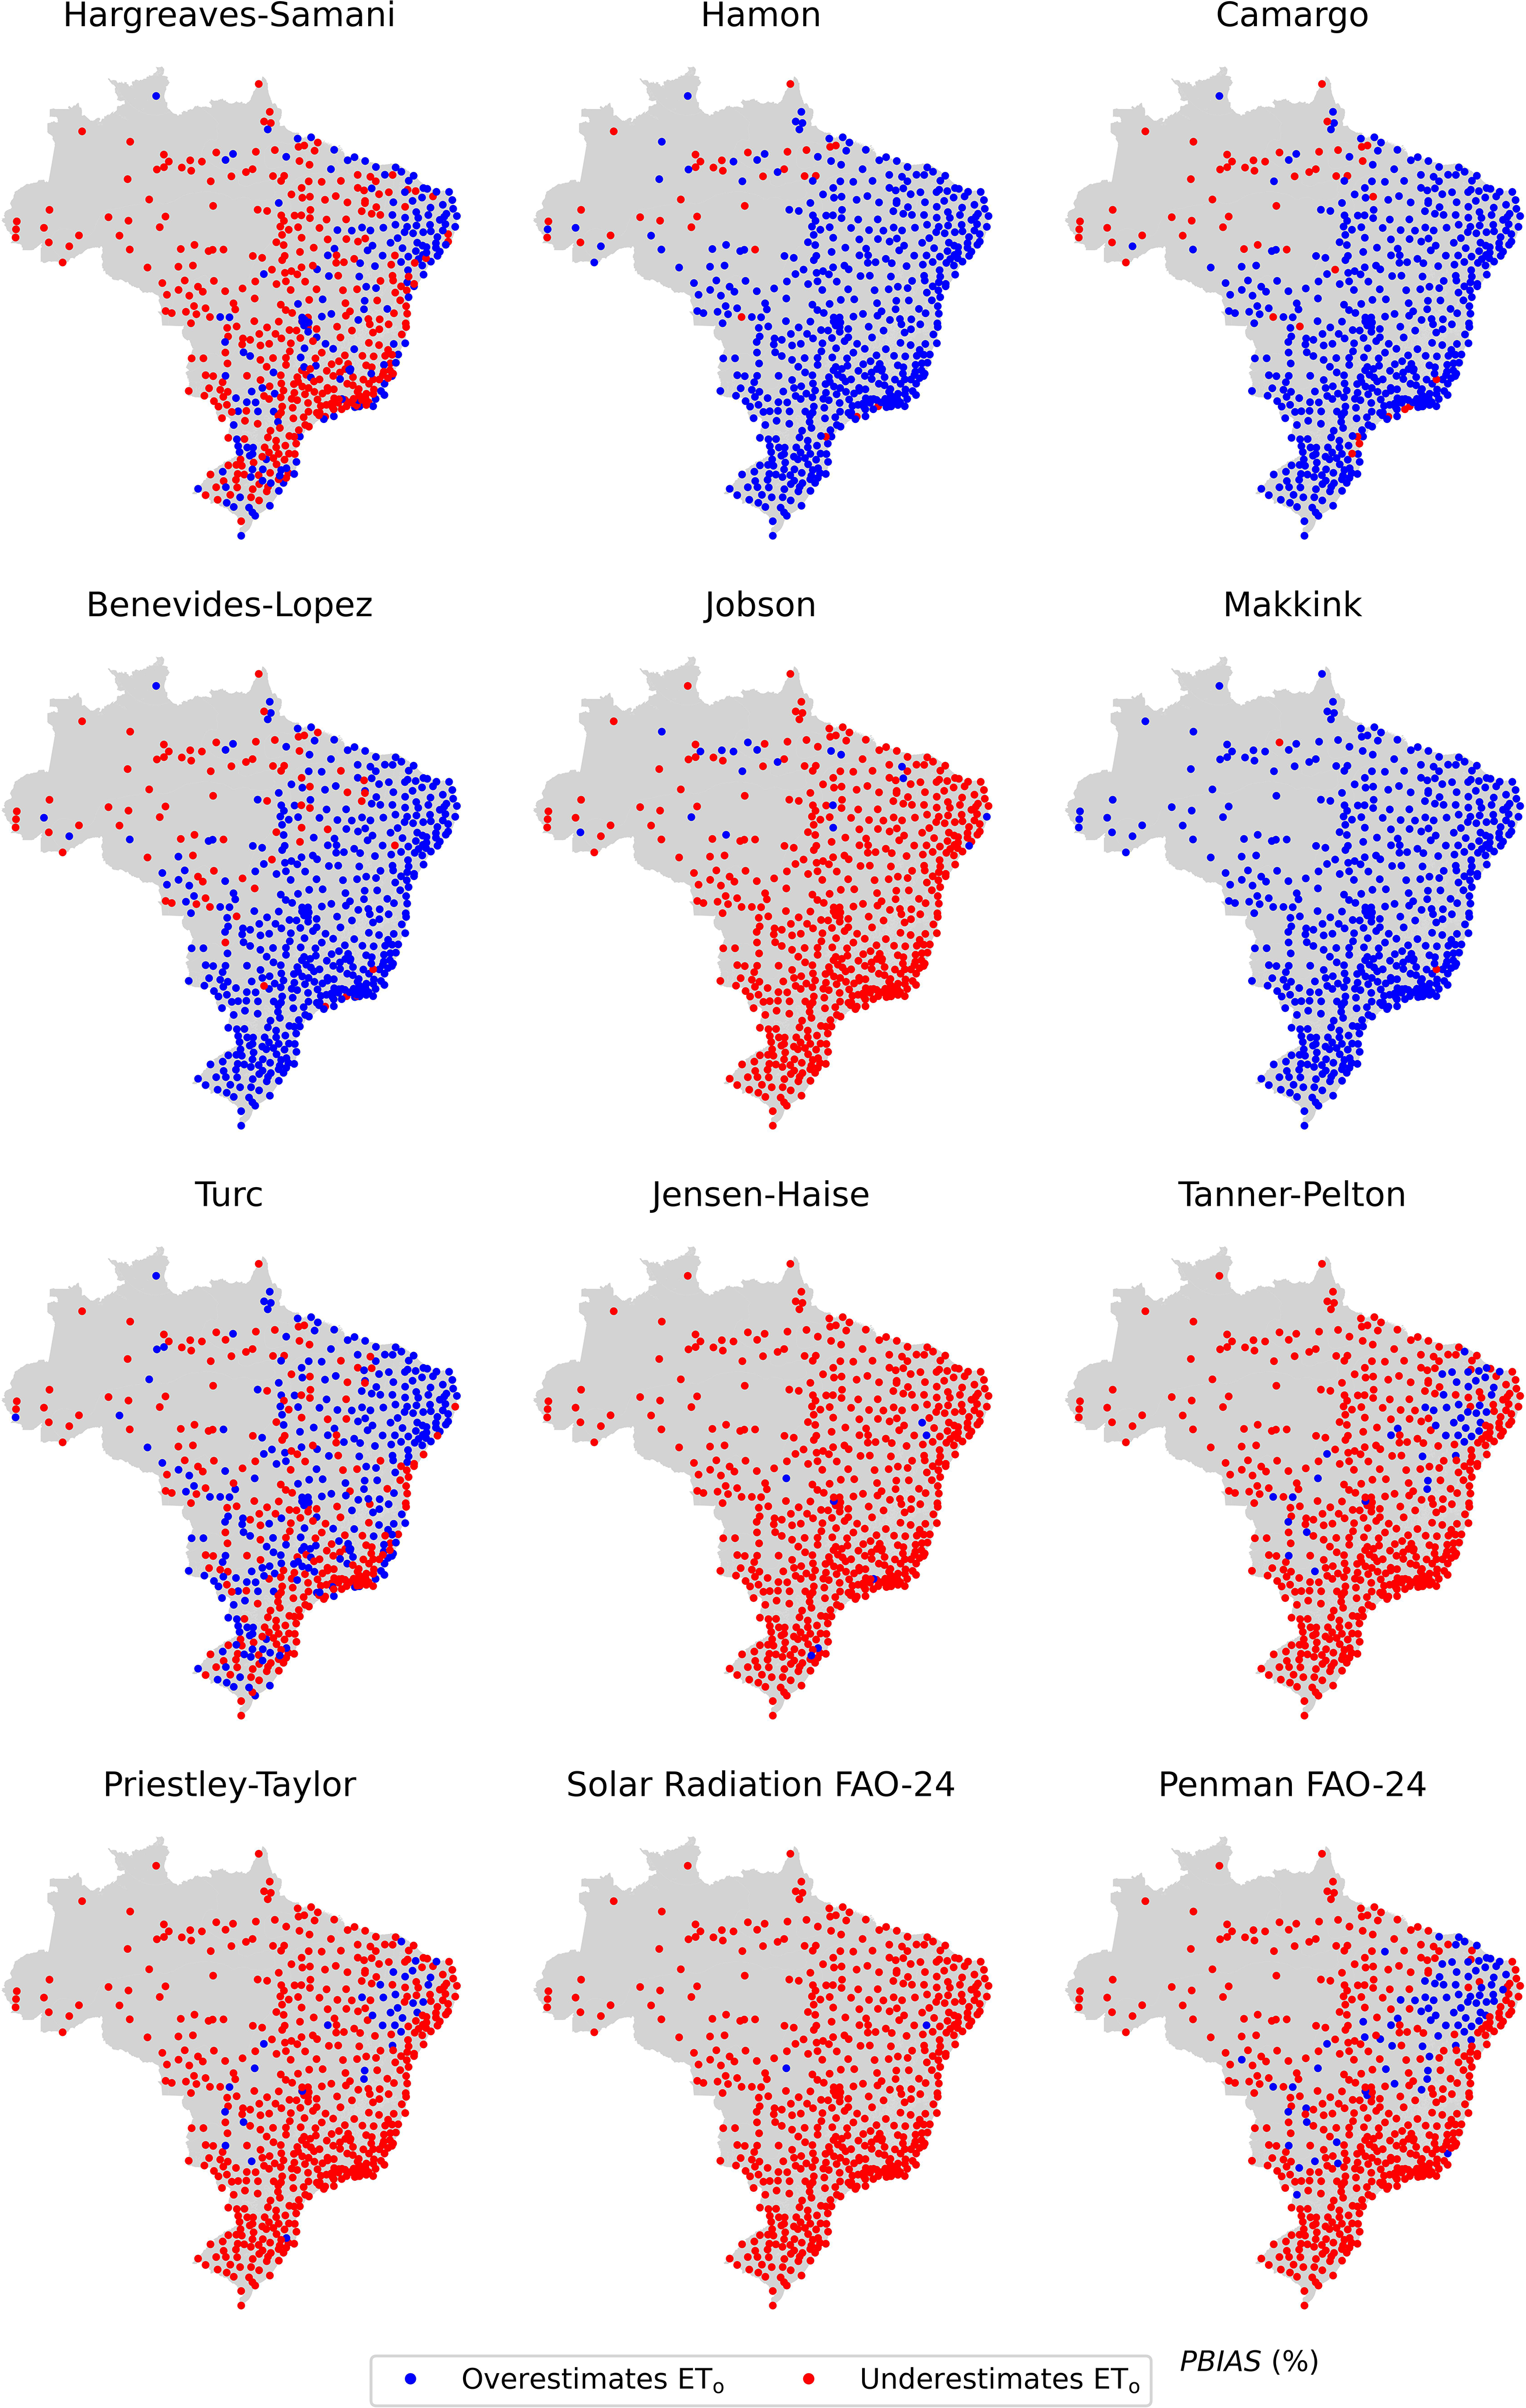
The spatial pattern analysis of PBIAS (Fig. 10) reveals marked trends of overestimation and underestimation of ETo among the evaluated methods, strongly related to the geographical location of the stations. The Hamon, Camargo, Benevides-Lopez, and Makkink methods predominantly overestimate ETo (blue points) in the North, North East, Midwest, and portions of the Southeast, while there is a transition to underestimation (red points) especially in the South region and part of the Southeast, suggesting that these methods tend to overestimate ETo in warmer and more humid regions and underestimate it in colder regions or those with a greater annual temperature range.
In contrast, the Jobson, Jensen-Haise, Priestley-Taylor, FAO-24 Solar Radiation, and FAO-24 Penman methods show a predominance of ETo underestimation (red points) across practically the entire national territory, with overestimation restricted to a few localized areas in the North, North East, and Midwest. The Hargreaves-Samani method exhibits intermediate behavior, with overestimation predominating in the North, North East, and Midwest, and underestimation more frequent in the South and part of the Southeast. In the case of the Priestley-Taylor method, a pattern similar to that of Hargreaves-Samani is observed, but with a greater tendency toward underestimation in the South and overestimation in the Brazilian semiarid.
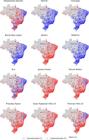
Statistical performance of daily evapotranspiration methods, considering percent bias (PBIAS), for each meteorological station in Brazil.
4. Discussions
In all climate classes in Brazil, except in the semiarid (Bsh), the Tur and Pen methods showed the highest performance relative to the standard PM method at the daily ETo scale (Figs. 4–6). However, the Pen method requires the same meteorological variables as the standard PM method, whereas Tur requires only Tmax and RS (Table 3); thus, this justifies the strong correlation with PM. A similar analysis was conducted by Pereira et al. (2009), who classified the JH, RS, and Pen models - which also require Tmax and RS - as the most appropriate to be applied in the Serra da Mantiqueira region, climate Cwb, as a substitute for the PM method.
The results found in this work are consistent with those obtained by Conceição and Mandelli (2005) and Pilau et al. (2012), which showed that methods that employ Ta and RS as input variables are more efficient than methods based solely on temperature. In fact, the worst-performing method was Cam, which is temperature-only. According to Ongaratto and Bortolin (2021), although Cam performs well in humid climates, this method yields less satisfactory results compared with those based on solar radiation. Moreover, its methodology is based on the Thornthwaite method, which is recommended for calculating ETo at the monthly scale (Carvalho et al., 2011).
Overall, the Tur and Pen models also showed the greatest accuracy compared with the other methods. However, when results from other studies are compared for individual climate types, there are divergences regarding the best method. In the study by Coutinho et al. (2020), which evaluated the performance of the HS, JH, BL, and Ham methods for the states of Rio de Janeiro and Espírito Santo at localities with climates Aw, Cwa, and Cwb, the method that best adapted to the localities studied in both states was JH. The results of the present work do not agree with those found by Coutinho et al. (2020), since JH, although outperforming BL and Ham, performs worse than HS for the same climates.
As in Cunha et al. (2017), who evaluated the performance of 30 methods for daily ETo estimation in a region with climate Aw, it was observed that Pen, PT, Turc, Ham, and Cam are among the best methods to estimate daily ETo for that climate type. According to those authors, Mak, HS, JH, and TP are some of the methods characterized by simplicity due to the reduced number of input variables, but despite these advantages, they are not recommended for estimating daily ETo for the Aw climate. In contrast, in the present study the Ham and Cam methods did not perform well, being outperformed by HS, Mak, and TP.
Aparecido et al. (2020) confirmed that despite the simplicity of the equations, the PT, HS, Ham, and Mak methods showed high performance at the daily scale in the state of Mato Grosso do Sul, especially the Ham method, which showed the highest accuracy in regions with climate Aw, with an average error of 12%. Therefore, this method is simple, reliable, and requires only mean temperature as input. The authors also emphasized that in the localities analyzed, the JH method had the lowest accuracy compared with the other methods. In the study conducted by Pereira et al. (2009), in a region with climate Cwb, the RS, JH, and Mak methods showed satisfactory performance at the daily scale (Fig. 5).
The Pen model was the only one that showed good accuracy and low dispersion across all climates, except in climates Af and Aw, where Tur performed better (Figs. 5–7). Although it overestimates ETo (Fig. 3), Pen achieved the best fit, a result that was expected because the model involves a combined effect of the solar radiation balance and aerodynamic effects, similar to the PM model, which is why it can be applied in different climate types (Oliveira et al., 2001).
The models had different errors for each climate (Fig. 6). Among the temperature-based methods, the HS method was superior in all climate classes; however, it showed lower RMSE values in dry climates. This pattern for the method was found by Lima et al. (2019) and can be explained because air temperature-based methods, such as HS, tend to overestimate ETo in humid climates (Fig. 9), increasing the estimation error (Jensen et al., 1990).
Regarding the radiation-based methods, the results show that Tur is the most suitable for estimating ETo in humid and temperate locations, considering KGE (Fig. 8), as also observed by Trajkovic and Kolakovic (2009). However, it underestimates ETo in the semiarid climate (Fig. 9). As a substitute for Tur, the Mak method is a viable option for estimating ETo when humidity data are not available; however, it tends to underestimate in all climates. Sentelhas et al. (2000) and Fietz et al. (2005) obtained satisfactory results in locations under high-humidity conditions with the RS method when compared with PM.
PT, like HS, underestimated ETo in climate Bsh. Divergent observations were made by Costa et al. (2020) for conditions in Bom Jesus da Lapa, with climate type BSh. The analyses showed that the PT method had the highest coefficient of determination (R2). However, based on RMSE, the HS method stood out positively. This result can be justified by the environmental conditions of the study area, since HS was developed in Davis, California, with conditions similar to those found in the municipality under study. They also observed that HS and BL overestimated, whereas the PT and Cam methods underestimated ETo. Considering the KGE efficiency index, the Job method had the worst performance compared with the others in the semiarid climate (Bsh). Among the radiation-based methods, PT had the best KGE index in climate Bsh.
5. Conclusions
Methods that incorporate more meteorological variables, such as FAO-24 Penman, tend to exhibit better performance across a wider range of climates, especially when data availability is complete. However, there are significant performance variations among climates.
Among all evaluated methods, the three that showed the best performance in each climate, in descending order, were as follows: in climates As, Aw, and Cwb, FAO-24 Penman, Turc, and Makkink stood out; in climates Am, Cwa, Cfa, and Cfb, the best results were obtained with Turc, FAO-24 Penman, and Makkink; in climate Af, the Turc, Makkink, and FAO-24 Penman methods were superior; in climate Csa, FAO-24 Penman, Priestley-Taylor, and Tanner-Pelton showed the best performances; and, finally, in climate Bsh, the Priestley-Taylor, FAO-24 Penman, and Tanner-Pelton methods stood out.
For the climatic conditions evaluated in Brazil, when only maximum and minimum air temperature data are available, the Hargreaves-Samani method is recommended for estimating daily reference evapotranspiration (ETo). This method showed better performance than the other temperature-based methods in all Brazilian climates analyzed, corroborating the recommendation of FAO Irrigation and Drainage Paper No. 56, which suggests applying the Hargreaves-Samani method as an alternative to the Penman-Monteith method in situations with incomplete meteorological data.
Acknowledgments
This study was financed in part by the Coordenação de Aperfeiçoamento de Pessoal de Nível Superior - Brasil (CAPES) - Finance Code 001
-
Declaração de disponibilidade dos dados
Não se aplica.
References
- ALLEN, R.G.; PEREIRA, L.S.; RAES, D.; SMITH, M. Crop Evapotranspiration: Guidelines for Computing Crop Water Requirements Rome: FAO, 1998.
-
ALMEIDA, C.R.; SOUSA, H.J.; CAZORLA, I.M. Letramento estatístico na educação básica: os desafios de ensinar o diagrama da caixa (box-plot) em contexto. Educação Matemática Pesquisa: Revista do Programa de Estudos Pós-Graduados em Educação Matemática, v. 23, n. 1, p. 499-529, 2021. doi
» https://doi.org/10.23925/1983-3156.2021v23i1p499-529 -
ALVARES, C.A.; STAPE, J.L.; SENTELHAS, P.C.; GONçALVES, J.L.M.; SPAROVEK, G. Köppen's climate classification map for Brazil. Meteorologische Zeitschrift, v. 22, n. 6, p. 711-728, 2013. doi
» https://doi.org/10.1127/0941-2948/2013/0507 -
APARECIDO, L. E.; MENESES, K.C.; TORSONI, G.B.; MORAES, J.R.S.C.; MESQUITA, D.Z. Accuracy of potential evapotranspiration models in different time scales. Revista Brasileira de Meteorologia, v. 35, n. 1, p. 63-80, 2020. doi
» https://doi.org/10.1590/0102-7786351026 -
AWAL, R.; RAHMAN, A.; FARES, A.; HABIBI, H. Calibration and evaluation of empirical methods to estimate reference crop evapotranspiration in West Texas. Water, v. 14, n. 19, p. 3032, 2022. doi
» https://doi.org/10.3390/w14193032 - BENEVIDES, J.G; LOPEZ, D. Formula para el caculo de la evapotranspiracion potencial adaptada al tropico (15° N-15° S). Agronomia Tropical, v. 20, n. 5, p. 335-345, 1970.
- BOWIE, G.L.; MILLS, W.B.; PORCELLA, D.B.; CAMPBELL, C.L.; PAGENKOPF, J.R. et al O. Rates, Constants, and Kinetics Formulations in Surface Water Quality Modeling Athens: United States Environmental Protection Agency, 1985.
- CAMARGO, A.P. Balanço Hídrico no Estado de São Paulo Campinas: IAC, 1971.
-
CARVALHO, L.G.; RIOS, G.F.A.; MIRANDA, W.L.; NETO, P.C. Evapotranspiração de referência: uma abordagem atual de diferentes métodos de estimativa. Pesquisa Agropecuária Tropical, v. 41, n. 3, p. 456-465, 2011. doi
» https://doi.org/10.5216/pat.v41i3.12760 -
CHEN, Z.; ZHU, Z.; JIANG, H.; SUN, S. Estimating daily reference evapotranspiration based on limited meteorological data using deep learning and classical machine learning methods. Journal of Hydrology, v. 591, 125286, 2020. doi
» https://doi.org/10.1016/j.jhydrol.2020.125286 - CONCEIçãO, M.A.F.; MANDELLI, F. Comparação entre métodos de estimativa da evapotranspiração de referência em Bento Gonçalves, RS. Rev. Bras. Agrometeorologia, v. 13, n. 2, p. 303-307, 2005.
-
COOPER, M.; VOSS-FELS, K.P.; MESSINA, C.D.; TANG, T.; HAMMER, G.L. Tackling G × E × M interactions to close on-farm yield-gaps: creating novel pathways for crop improvement by predicting contributions of genetics and management to crop productivity. Theoretical and Applied Genetics, v. 134, n. 6, p. 1625-1644, 2021. doi
» https://doi.org/10.1007/s00122-021-03812-3 -
COSTA, T.S.; SANTOS, R.A.A.; SALES, R.A.A; NOGUEIRA, A.T.; SANTOS, R.L. Comparison between estimation methods of reference evapotranspiration in Bom Jesus da Lapa, BA. Revista Engenharia na Agricultura, v. 28, p. 120-128, 2020. doi
» https://doi.org/10.13083/reveng.v28i.974 -
COUTINHO, E.R.; MADEIRA, J.G.F.; SILVA, R.M.; OLIVEIRA, E.M.; DELGADO, A.R.S. Avaliação de métodos de estimativa da evapotranspiração de referência (ETo) diária para regiões dos estados do Rio de Janeiro e Espírito Santo. Revista Brasileira de Meteorologia, v. 35, n. 4, p. 649-657, 2020. doi
» https://doi.org/10.1590/0102-77863540069 -
CUNHA, F.F.; MAGALHãES, F.F.; CASTRO, M.A.; SOUZA, E.J. Performance of estimative models for daily reference evapotranspiration in the city of Cassilândia, Brazil. Engenharia Agrícola, v. 37, n. 1, p. 173-184, 2017. doi
» https://doi.org/10.1590/1809-4430-eng.agric.v37n1p173-184/2017 -
DEHGHANISANIJ, H.; YAMAMOTO, T.; RASIAH, V. Assessment of evapotranspiration estimation models for use in semi-arid environments. Agricultural Water Management, v. 64, n. 2, p. 91-106, 2004. doi
» https://doi.org/10.1016/S0378-3774(03)00200-2 - DOORENBOS, J.; PRUITT, W.O. Guidelines for Predicting Crop Water Requirements Rome: Food and Agriculture Organization (FAO), p. 1-145, 1977.
- FIETZ, C.R.; SILVA, F.C.; URCHEI, M.A. Estimativa da evapotranspiração de referência diária para a região de Dourados, MS. Rev. Bras. Agrometeorologia, v. 13, n. 2, p. 250-255, 2005.
-
FREVERT, D.K.; HILL, R.W.; BRAATEN, B.C. Estimation of FAO evapotranspiration coefficients. Journal of Irrigation and Drainage Engineering, v. 109, n. 2, p. 265-270, 1983. doi
» https://doi.org/10.1061/(ASCE)0733-9437(1983)109:2(265) -
GHIAT, I.; MACKEY, H.R.; AL-ANSARI, T. A review of evapotranspiration measurement models, techniques and methods for open and closed agricultural field applications. Water, v. 13, n. 18, p. 2523, 2021. doi
» https://doi.org/10.3390/w13182523 -
GUPTA, H.V.; SOROOSHIAN, S.; YAPO, P.O. Status of automatic calibration for hydrologic models: comparison with multilevel expert calibration. Journal of Hydrologic Engineering, v. 4, n. 2, p. 135-143, 1999. doi
» https://doi.org/10.1061/(ASCE)1084-0699(1999)4:2(135) -
GUPTA, H.V.; KLING, H.; YILMAZ, K.K.; MARTINEZ, G.F. Decomposition of the mean squared error and NSE performance criteria: implications for improving hydrological modelling. Journal of Hydrology, v. 377, n. 1-2, p. 80-91, 2009. doi
» https://doi.org/10.1016/j.jhydrol.2009.08.003 -
HAMON, W.R. Estimating potential evapotranspiration. Journal of the Hydraulics Division, v. 87, n. 3, p. 107-120, 1961. doi
» https://doi.org/10.1061/JYCEAJ.0000599 -
HARGREAVES, G.H.; SAMANI, Z.A. Reference crop evapotranspiration from temperature. Applied Engineering in Agriculture, v. 1, n. 2, p. 96-99, 1985. doi
» https://doi.org/10.13031/2013.26773 - JENSEN, M.E.; BURMAN, R.D.; ALLEN, R.G. Evapotranspiration and Irrigation Water Requirements New York: ASCE, 1990.
-
JENSEN, M.E.; HAISE, H.R. Estimating evapotranspiration from solar radiation. Journal of the Irrigation and Drainage Division, v. 89, n. 4, p. 15-41, 1963. doi
» https://doi.org/10.1061/JRCEA4.0000287 -
LIMA, J.G.A.; VIANA, P.C.; ESPíNOLA-SOBRINHO, J.; COUTO, J.P.C. Comparação de métodos de estimativa de ETo e análise de sensibilidade para diferentes climas brasileiros. IRRIGA, v. 24, n. 3, p. 538-551, 2019. doi
» https://doi.org/10.15809/irriga.2019v24n3p538-551 -
LIU, Z.; YAO, Z.; WANG, R. Simulation and evaluation of actual evapotranspiration based on inverse hydrological modeling at a basin scale. CATENA, v. 180, p. 160-168, 2019. doi
» https://doi.org/10.1016/j.catena.2019.03.039 - MAKKINK, G.F. Ekzamento de la formulo de Penman. Netherlands Journal of Agricultural Science, v. 5, p. 290-305, 1957.
-
MORADI, I. Quality control of global solar radiation using sunshine duration hours. Energy, v. 34, n. 1, p. 1-6, 2009. doi
» https://doi.org/10.1016/j.energy.2008.09.006 -
MORAIS, J.E.F. de; SILVA, T.G.F.; SOUZA, L.S.B.; MOURA, M.S.B.; DINIZ, W.J.S. et al Evaluation of the method of FAO data 56 Monteith Penman with missing data and of alternative methods in the estimation of reference evapotranspiration in the Submedium Valley of San Francisco. Revista Brasileira de Geografia Física, v. 8, n. 6, p. 1644-1660, 2015. doi
» https://doi.org/10.5935/1984-2295.20150093 -
MORIASI, D.N.; ARNOLD, J.G.; VAN LIEW, M.W.; BINGNER, R.D.; VEITH, T.L. Model evaluation guidelines for systematic quantification of accuracy in watershed simulations. Transactions of the ASABE, v. 50, n. 3, p. 885-900, 2007. doi
» https://doi.org/10.13031/2013.23153 -
MORO, I.P.; ZANETTI, S.S.; CECíLIO, R.A.; PEZZOPANE, J.E.M.; XAVIER, A.C. Influência dos elementos meteorológicos na evapotranspiração de referência diária. Revista Brasileira de Meteorologia, v. 40, e 40240043, 2025. doi
» https://doi.org/10.1590/0102-778640240043 - OLIVEIRA, L.F.C.; DANIEL, F.C.; PATRíCIA, A.R.; FERNANDO, C.C. Estudo comparativo de modelos de estimativa da evapotranspiração de referência para algumas localidades no estado de Goiás e Distrito Federal. Pesquisa Agropecuária Tropical, v. 31, n. 2, p. 121-126, 2001.
-
ONGARATTO, J.M.; BORTOLIN, T.A. Comparação entre métodos de estimativa de evapotranspiração de referência no município de São José dos Ausentes (RS), Brasil. Engenharia Sanitaria e Ambiental, v. 26, n. 5, p. 979-987, 2021. doi
» https://doi.org/10.1590/s1413-415220190196 -
PARAJULI, P.B.; RISAL, A.; OUYANG, Y.; THOMPSON, A. Comparison of SWAT and MODIS evapotranspiration data for multiple timescales. Hydrology, v. 9, n. 6, p. 103, 2022. doi
» https://doi.org/10.3390/hydrology9060103 -
PENMAN, H.L. Natural evaporation from open water, bare soil and grass. Proceedings of the Royal Society of London. Series A. Mathematical and Physical Sciences, v. 193, n. 1032, p. 120-145, 1948. doi
» https://doi.org/10.1098/rspa.1948.0037 - PEREIRA, A.R.; SEDIYAMA, G.C.; VILLA NOVA, N.A. Evapotranspiração Campinas: Fundag, 2013.
- PEREIRA, A.R.; VILLA NOVA, N.A.; SEDIYAMA, G.C. Evapo(transpi)ração Piracicaba: FEALQ, 1997.
-
PEREIRA, D.R.; YANAGI, S.N. M.; MELLO, C.R. de; SILVA, A.M.; SILVA, L.A. Desempenho de métodos de estimativa da evapotranspiração de referência para a região da Serra da Mantiqueira, MG. Ciência Rural, v. 39, n. 9, p. 2488-2493, 2009. doi
» https://doi.org/10.1590/S0103-84782009000900016 -
PILAU, F.G.; BATTISTI, R.; SOMAVILLA, L.; RIGHI, E.Z. Desempenho de métodos de estimativa da evapotranspiração de referência nas localidades de Frederico Westphalen e Palmeira das Missões, RS. Ciência Rural, v. 42, n. 2, p. 283-290, 2012. doi
» https://doi.org/10.1590/S0103-84782012000200016 -
PRIESTLEY, C.H.B.; TAYLOR, R.J. On the assessment of surface heat flux and evaporation using large-scale parameters. Monthly Weather Review, v. 100, n. 2, p. 81-92, 1972. doi
» https://doi.org/10.1175/1520-0493(1972)100<0081:OTAOSH>2.3.CO;2 -
RAJA, P.; SONA, F.; SURENDRAN, U.; SRINIVAS, C.V.; KANNAN, K. et al Performance evaluation of different empirical models for reference evapotranspiration estimation over Udhagamandalm, The Nilgiris, India. Scientific Reports, v. 14, n. 1, p. 12429, 2024. doi
» https://doi.org/10.1038/s41598-024-60952-4 -
RIZO, A.A.I.; SILVA, C.J. Desempenho de métodos de estimativa de evapotranspiração de referência na região sul de Goiás. IRRIGA, v. 27, n. 2, p. 242-255, 2022. doi
» https://doi.org/10.15809/irriga.2022v27n2p242-255 -
SALAM, R.; ISLAM, A.R.M.T.; PHAM, Q.B.; DEHGHANI, M.; AL-ANSARI, N. et al The optimal alternative for quantifying reference evapotranspiration in climatic sub-regions of Bangladesh. Scientific Reports, v. 10, n. 1, 20171, 2020. doi
» https://doi.org/10.1038/s41598-020-77183-y -
SANTOS, A.A.R.; LYRA, G.B.; LYRA, G.B.; LIMA, E.P.; SOUZA, J.L. et al Evapotranspiração de referência em função dos extremos da temperatura do ar no estado do Rio de Janeiro. IRRIGA, v. 21, n. 3, 449, 2018. doi
» https://doi.org/10.15809/irriga.2016v21n3p449-465 - SENTELHAS, P.C.; PEREIRA, A.R.; FOLEGATTI, M.V.; PEREIRA, F.A.C.; VILLA NOVA, N.A. et al Variação sazonal do parâmetro de Priestley-Taylor para estimativa diária da evapotranspiração de referência. Revista Brasileira de Agrometeorologia, v. 8, n. 1, p. 49-53, 2000.
-
SHAFER, M.A.; FIEBRICH, C.A.; ARNDT, D.S.; FREDRICKSON, S.E.; HUGHES, T.W. Quality assurance procedures in the Oklahoma Mesonetwork. Journal of Atmospheric and Oceanic Technology, v. 17, n. 4, p. 474-494, 2000. doi
» https://doi.org/10.1175/1520-0426(2000)017<0474:QAPITO>2.0.CO;2 -
SILVA, G.H.; DIAS, S.H.B.; FERREIRA, L.B.; SANTOS, J.E.O.; CUNHA, F.F. Performance of different methods for reference evapotranspiration estimation in Jaíba, Brazil. Revista Brasileira de Engenharia Agrícola e Ambiental, v. 22, n. 2, p. 83-89, 2018. doi
» https://doi.org/10.1590/1807-1929/agriambi.v22n2p83-89 -
SOUZA, V.Q.; GOMES, M.J.D.A.; CARMO, A.P.M.; SILVA, F.L.; SILVA, M.B.P. et al Desempenho de modelos para estimativa da evapotranspiração de referência na microrregião de Tomé Açú-PA. IRRIGA, v. 27, n. 1, p. 155-167, 2022. doi
» https://doi.org/10.15809/irriga.2022v27n1p155-167 -
TANAKA, A.A.; SOUZA, A.P.; KLAR, A.E.; SILVA, A.C.; GOMES, A.W.A. Evapotranspiração de referência estimada por modelos simplificados para o Estado do Mato Grosso. Pesquisa Agropecuária Brasileira, v. 51, n. 2, p. 91-104, 2016. doi
» https://doi.org/10.1590/S0100-204X2016000200001 -
TANNER, C.B.; PELTON, W.L. Potential evapotranspiration estimates by the approximate energy balance method of Penman. Journal of Geophysical Research, v. 65, n. 10, p. 3391-3413, 1960. doi
» https://doi.org/10.1029/JZ065i010p03391 -
TEIXEIRA FILHO, A.J.; BARBOSA, J.V.G.; FERREIRA, J.C.C. Performance evaluation of reference evapotranspiration estimation methods for the city of Manicoré, Amazonas. IRRIGA, v. 28, n. 1, p. 60-76, 2023. doi
» https://doi.org/10.15809/irriga.2023v28n3p60-76 -
TRAJKOVIC, S.; KOLAKOVIC, S. Evaluation of reference evapotranspiration equations under humid conditions. Water Resources Management, v. 23, n. 14, p. 3057-3067, 2009. doi
» https://doi.org/10.1007/s11269-009-9423-4 - TURC L. Estimation of irrigation water requirements, potential evapotranspiration: a simple climatic formula evolved up to date. Ann. Agron., v. 12, n. 1, p. 13-49, 1961.
-
WANNIARACHCHI, S.; SARUKKALIGE, R. A review on evapotranspiration estimation in agricultural water management: past, present, and future. Hydrology, v. 9, n. 7, p. 123, 2022. doi
» https://doi.org/10.3390/hydrology9070123 -
WILLMOTT, C.J. Some comments on the evaluation of model performance. Bulletin of the American Meteorological Society, v. 63, n. 11, p. 1309-1313, 1982. doi
» https://doi.org/10.1175/1520-0477(1982)063<1309:SCOTEO>2.0.CO;2 -
XAVIER, A.C.; KING, C.W.; SCANLON, B.R. Daily gridded meteorological variables in Brazil (1980-2013). International Journal of Climatology, v. 36, n. 6, p. 2644-2659, 2016. doi
» https://doi.org/10.1002/joc.4518 -
XAVIER, A.C.; SCANLON, B.R.; KING, C.W.; ALVES, A.I. New improved Brazilian daily weather gridded data (1961-2020). International Journal of Climatology, v. 42, n. 16, p. 8390-8404, 2022. doi
» https://doi.org/10.1002/joc.7731 -
ZANETTI, S.S.; DOHLER, R.E.; CECíLIO, R.A.; PEZZOPANE, J.E.M.; XAVIER, A.C. Proposal for the use of daily thermal amplitude for the calibration of the Hargreaves-Samani equation. Journal of Hydrology, v. 571, p. 193-201, 2019. doi
» https://doi.org/10.1016/j.jhydrol.2019.01.049
Edited by
-
Scientific Editor:
Carlos Frederico Mendonça Raupp.
Não se aplica.