 Total dissolved gas (TDG) calculation in a spillway with a stilling basin using the Go programming language
ABSTRACT
During voluntary and involuntary spills, total dissolved gas (TDG) levels can rise and may cause gas bubble disease (GBD) in fish. At hydropower plants (HPP), one way to reduce the TDG levels is to design the deflectors in spillway. Ideally, deflector design combines physical model testing with mathematical or computational modeling, whose simulations require significant computational effort. This study presents a computational model developed in the Go programming language, to estimate the TDG levels, using with input data the hydrodynamic variable as velocity, pressure, and water volume fraction simulated in the OpenFOAM. The main advantage of this approach is that it requires only a personal computer to estimate TDG values making it suitable for preliminary studies. In contrast, the simulations performed for the design of the Colíder HPP spillway deflector required on a cluster with 96 processors.
Keywords:
Total dissolved gas (TDG); Deflector in spillway; Go programming language
RESUMO
Durante vertimentos voluntários e involuntários os níveis de total de gás dissolvido (TDG) aumentam e podem causar a doença da bolha (GBD) em peixes. Este trabalho descreve um modelo computacional desenvolvido em linguagem Go para calcular os níveis de TDG utilizando como dados de entrada variáveis hidrodinâmicas calculadas através do software OpenFOAM, como velocidade do fluxo, pressão e fração volumétrica de água. A principal vantagem desta abordagem é que ela requer apenas um computador pessoal para estimar os valores de TDG, sendo adequada para estudos preliminares. Em contraste, os estudos desenvolvidos para a construção do defletor da UHE Colíder, demandaram um cluster com 96 processadores.
Palavras-chave:
Total de gases dissolvidos (TDG); Defletores em vertedouros; Programação em linguagem Go
INTRODUCTION
Gas bubble disease (GBD) is an adverse condition affecting aquatic organisms exposed to supersaturated water. During voluntary or involuntary spills, total dissolved gas (TDG) levels may increase, potentially inducing GBD in fish. The effects of TDG supersaturation are complex and depend on factors such as TDG concentration, exposure time, and fish (Weitkamp, 2008). Bubbles can form under the skin, in the mouth, gills, fins, and eyes of affected fish (Canadian Council of Ministers of the Environment, 1999).
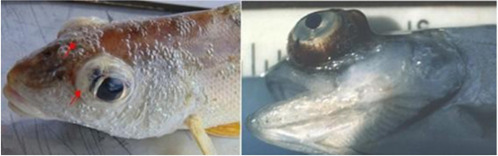
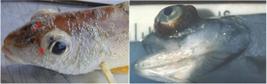
TDG supersaturation is considered a potential environment risk to fish fauna (Ebel, 1969). In Brazil, since 2000s, fish mortality events were registered at different hydropower plants (HPPs). Recently, monitored TDG and fish mortality studies in Teles Pires river were conducted by Agostinho et al. (2021). Figure 1 illustrates typical gas bubble disease symptoms in fish.
An alternative to minimize TDG supersaturation is the installation of deflectors on the face of the spillway, which redirect the typical plunging flow into surface jets tangential to the free surface (Politano et al., 2016). This strategy has been adopted in hydroelectric plants such as Colíder HPP (Andriolo et al., 2023), Hells Canyon Dam (Politano et al., 2016), McNary Dam (Politano et al., 2015), (Wang et al., 2018), Wanapum Dam (Bender & Hadjerioua, 2012), Brownlee Dam (Myers & Parkinson, 2003) and Yacyretá HPP (Bacchiega & Fattor, 2014).
Horizontal deflectors change the flow pattern downstream the spillway, decreasing air bubbles concentration in high pressure areas, and thus decrease TDG levels.
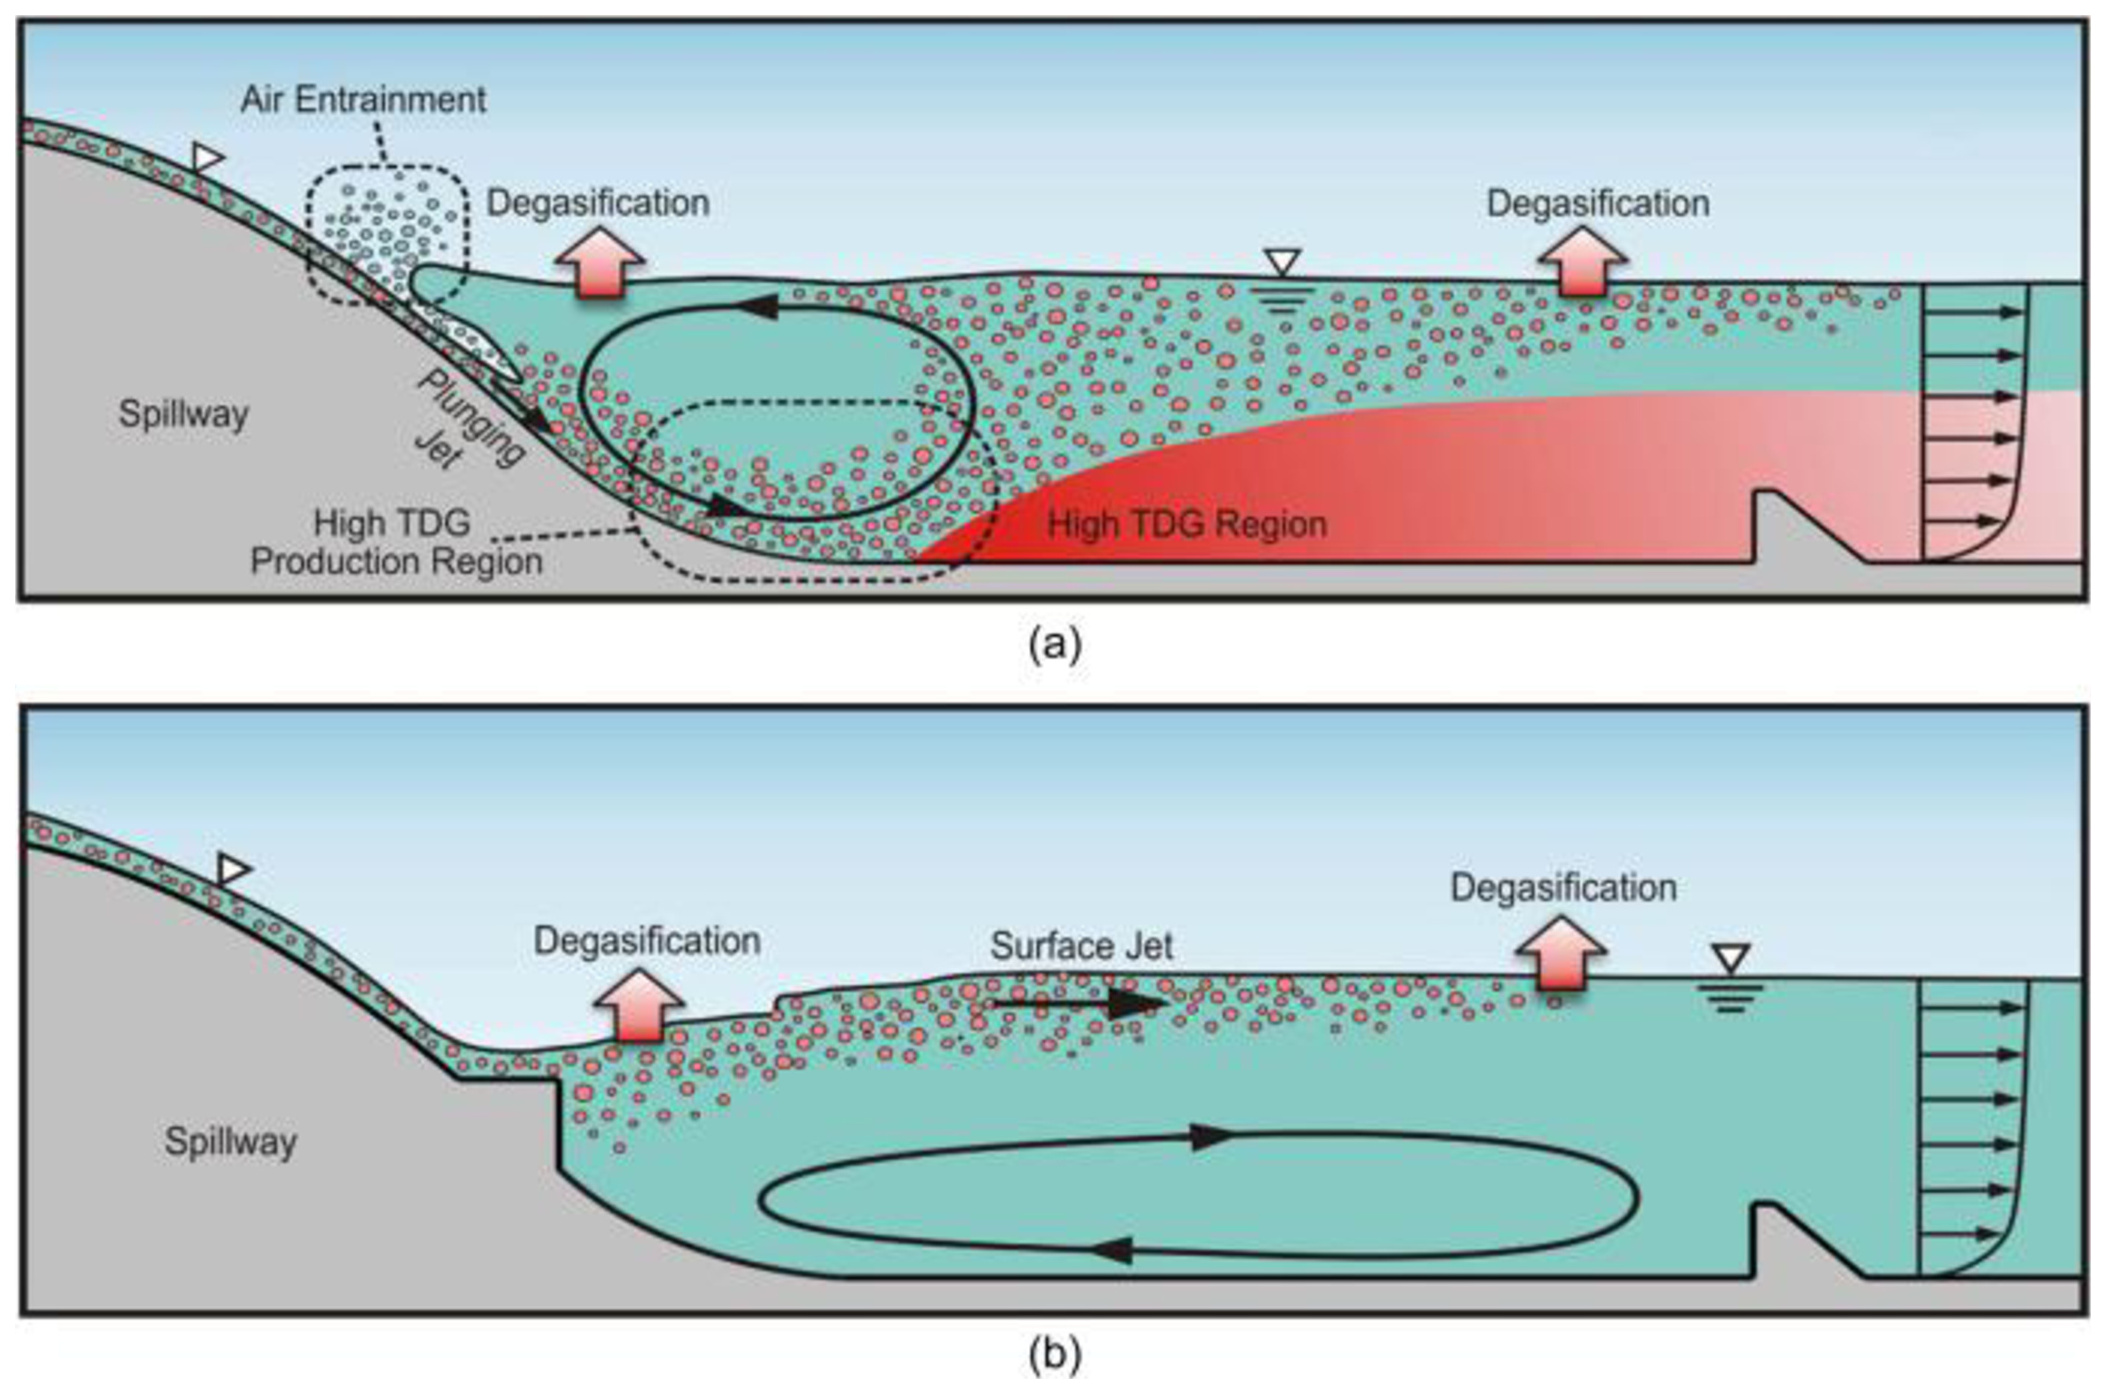
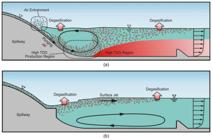
Bubbles entrained during spill releases can be transported by plunging jets to deep, high-pressure regions in the tailrace in which dissolution is enhanced, leading to an increase in total TDG concentration (Figure 2a). Degassing at the free surface after the bubbles leave the domain is an inefficient process unless the mass transfer is enhanced by wind or turbulence. The most common strategy to reduce TDG uptake in dams is to install flow deflectors on the spillway face (Figure 2b). Deflectors change the typically plunging flow into skimming flow to minimize the bubble transport to depth. However, achieving a skimming flow is not guaranteed because the spillway jet regime depends on the flowrate; tailwater elevation (TWE); and deflector characteristics such as length, curvature radius, and elevation on the spillway face (Politano et al., 2024).
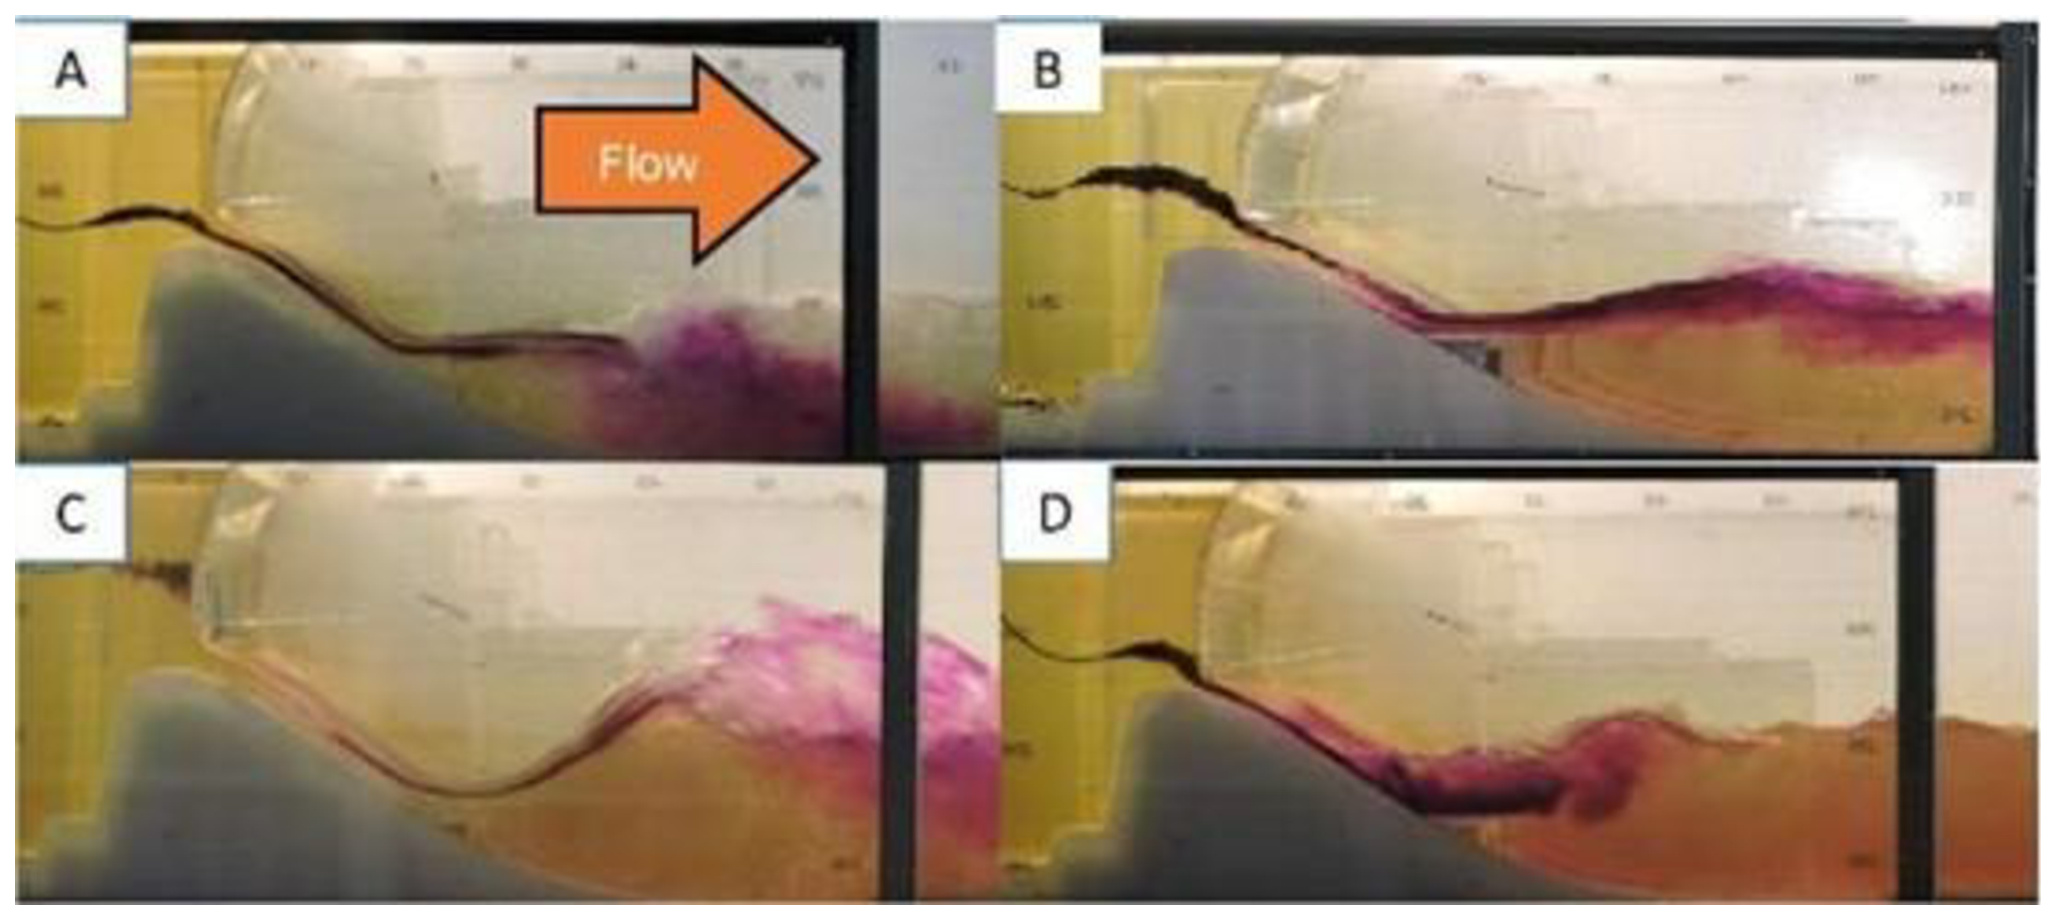
According to the literature, 4 typical jet regimes may occur due to the combination of the operational settings of the spillway flowrate and tailwater elevation. Figure 3 shows the four spillway jet regimes: a) plunging flow, b) skimming flow, c) undular jet and d) surface jump.
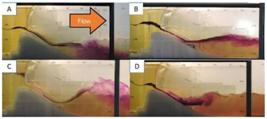
Jet regimes in the physical reduced-scale model: (A) Plunging flow (B) Skimming flow (C) Undular Jet (D) Surface Jump (Andriolo et al., 2023).
This paper describes a model developed in the Go programming language (www.golang.org) to calculate the levels of TDG, using as input data the hydrodynamic variables obtained from the OpenFOAM simulations, such as the velocity, pressure and water volume fraction. In the first phase, the OpenFOAM variables were extracted; in the second, the TDG concentration distribution was simulated using a Go program.
Go was created in September 2007 (and released in November 2009) as an internal project at Google by Robert Griesemer, Rob Pike, and Ken Thompson. It is an open-source language designed to be expressive, efficient to compile and execute, and effective for writing reliable and robust programs. Some characteristics of Go include: (a) a clean syntax that allows concise and readable code; (b) a combination of features of languages such as C++, Java, and Python; (c) support for procedural, object-oriented, and functional programming paradigms; (d) its own compiler; and (e) strong concurrency support (Donavan & Kernighan, 2015).
A key advantage of the program developed here is that it enables the estimation of TDG on a personal computer, allowing rapid preliminary studies. By comparison, TDG simulations for Colíder HPP previously required 3 to 4 days of computation on 336 processors of a high-performance computing (HPC) system (Politano et al., 2024).
In study developed by Ovelar et al. (2022) within the R&D project, a cluster with 96 processors was used.
It is important to note, however, that the model presented in this work is intended for initial-phase studies and should not be used for the final design of spillway deflectors.
CASE STUDY
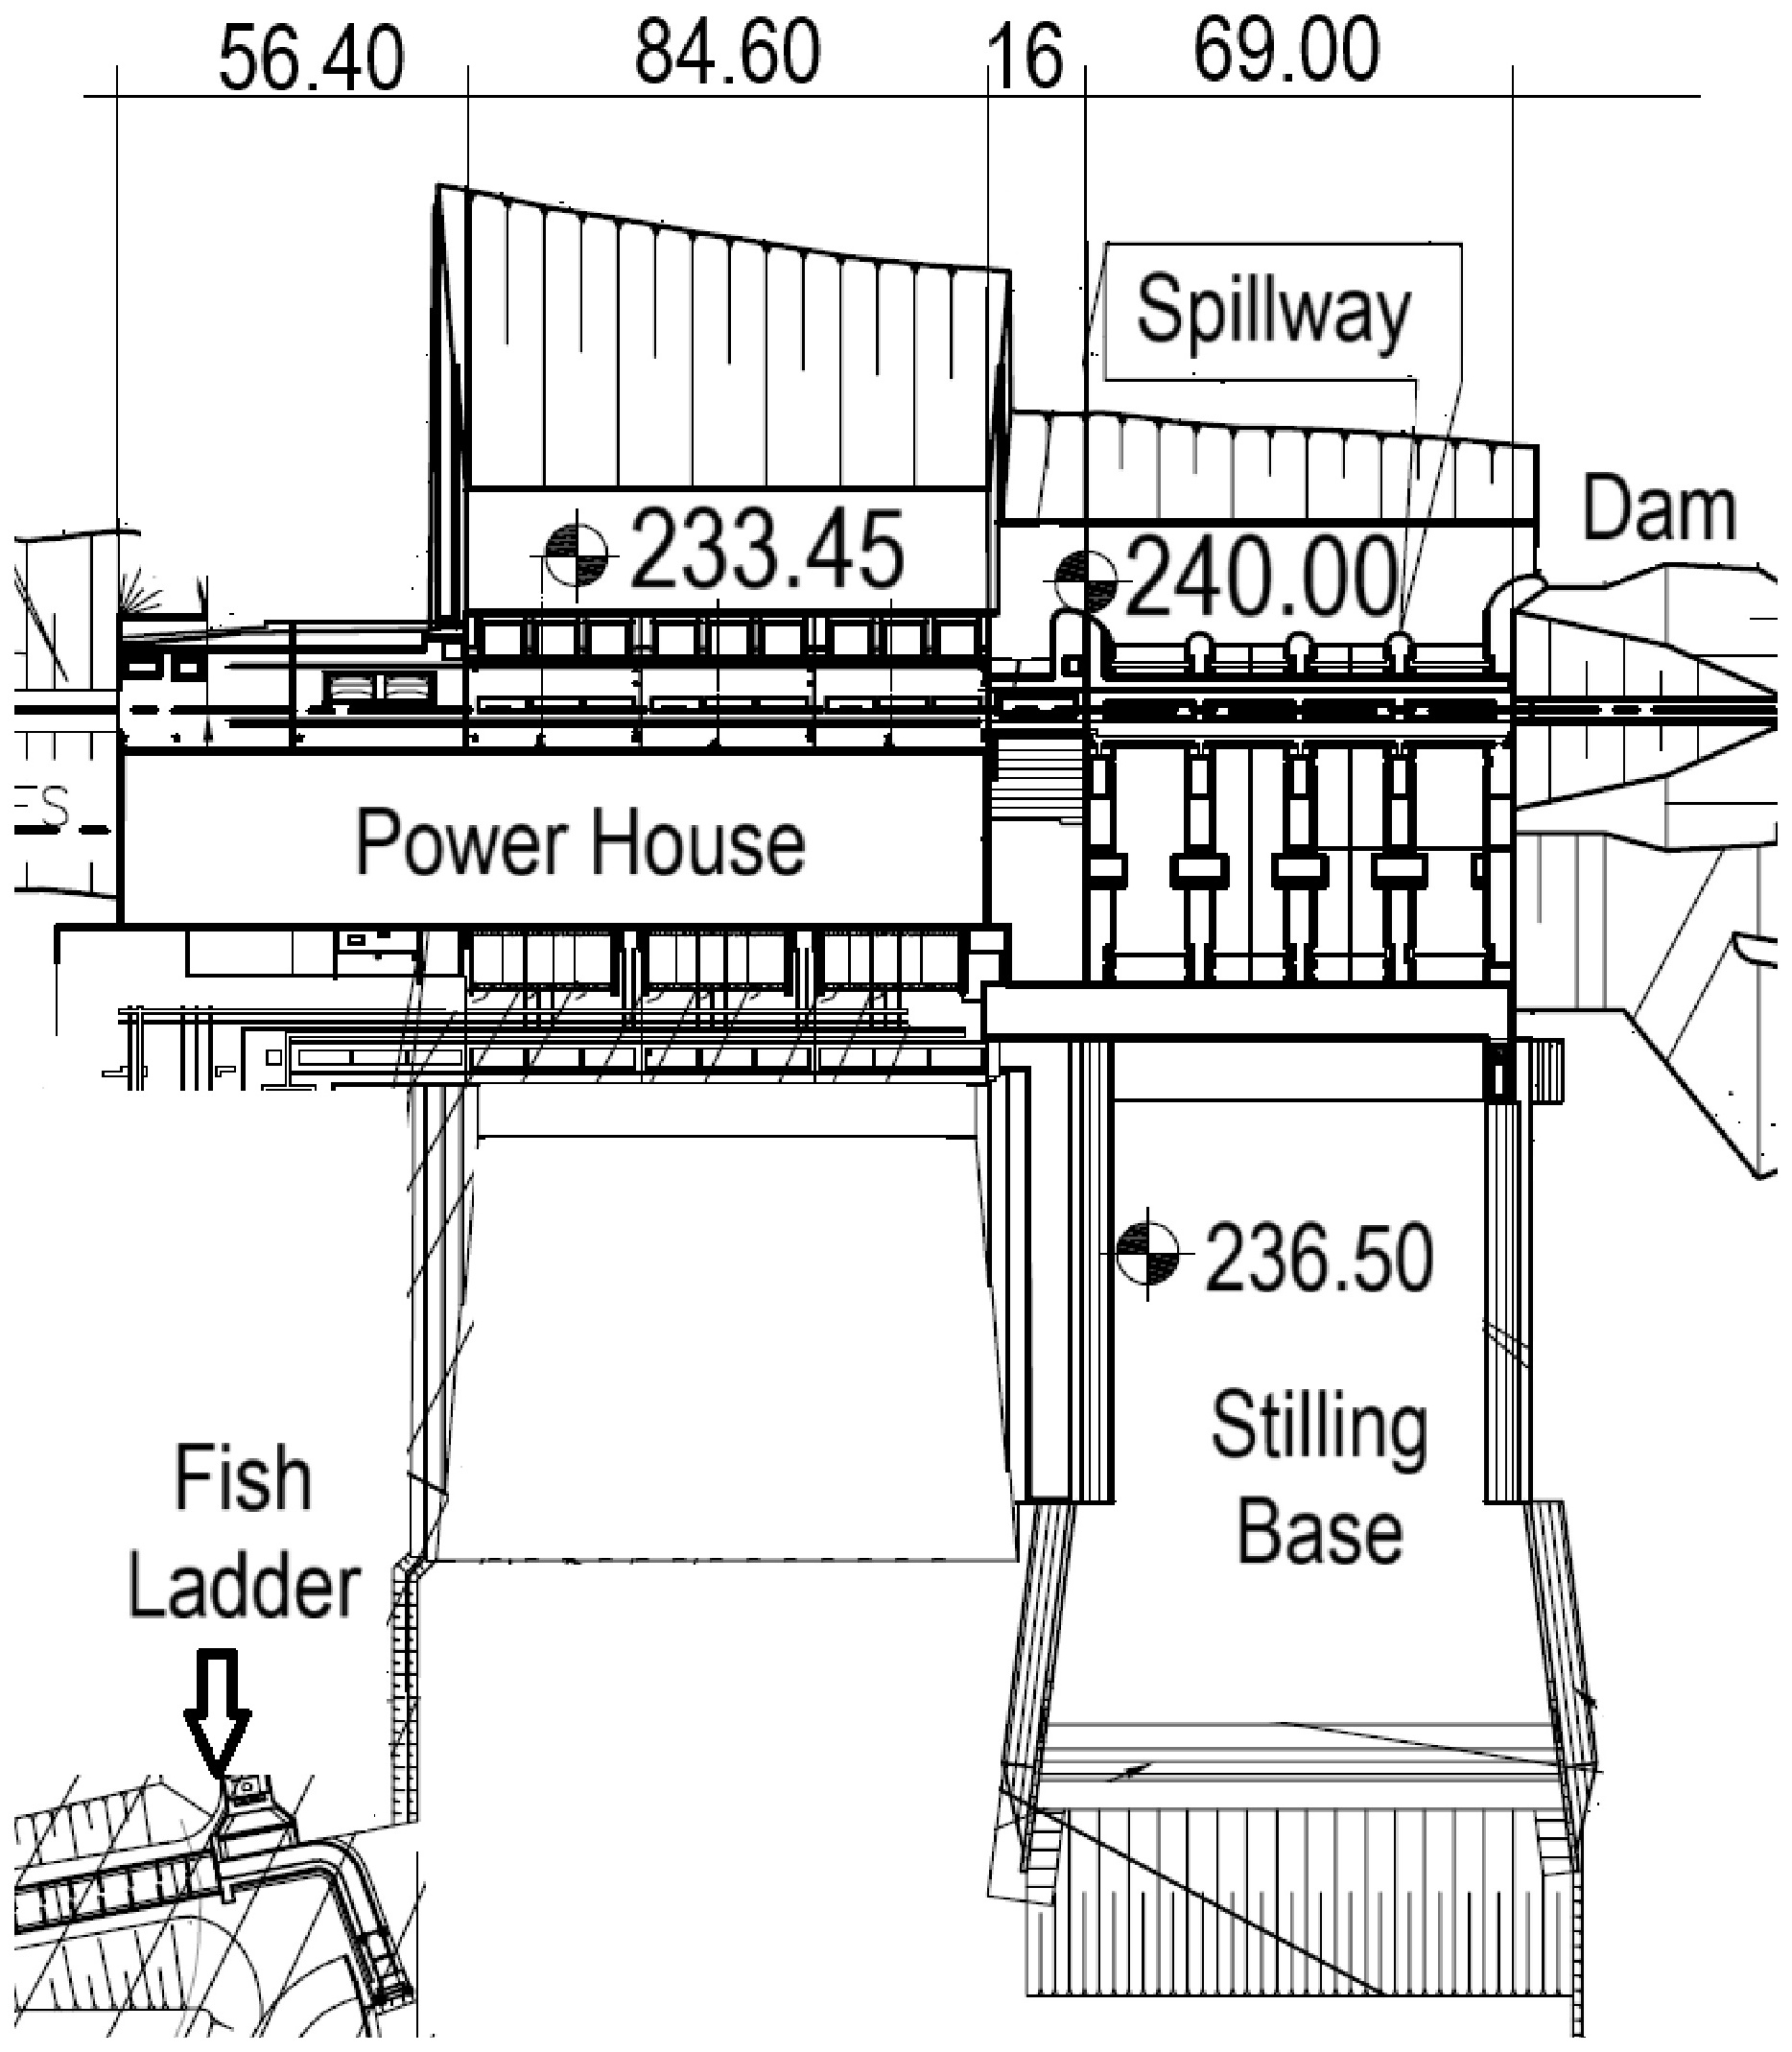
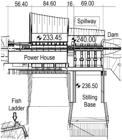
The case study is the Colíder HPP, an earthfill dam on the Teles Pires River in the northern Mato Grosso, Brazil. The dam is 1,526 m long and has an installed capacity of 300 MW. The spillway has four bays controlled by radial gates, each 16.7 m high and 12 m wide, and it was designed for a 10,000-year flood of 6,935 m3/s. Reservoir impoundment began in February 2017, and commercial operation started in 2019 with three Kaplan turbines. (Figure 4).
During spill events at Colíder HPP, bubbles are entrained in the flow and the dissolved air in the water increases the TDG concentration. To decrease the TDG levels downstream of the Colíder's spillway, and thus preventing potential gas bubble disease in fish, Copel installed deflectors in the four spillway bays. The design of the deflectors was assisted with two studies. The first study was a 1:60 scale physical model developed by Lactec (Andriolo et al., 2022) and the other study was a numerical model based on the open-source toolbox OpenFOAM developed by IIHR-Hydroscience and Engineering at the University of Iowa and the US Army Engineer Research and Development Center (Politano et al., 2024).
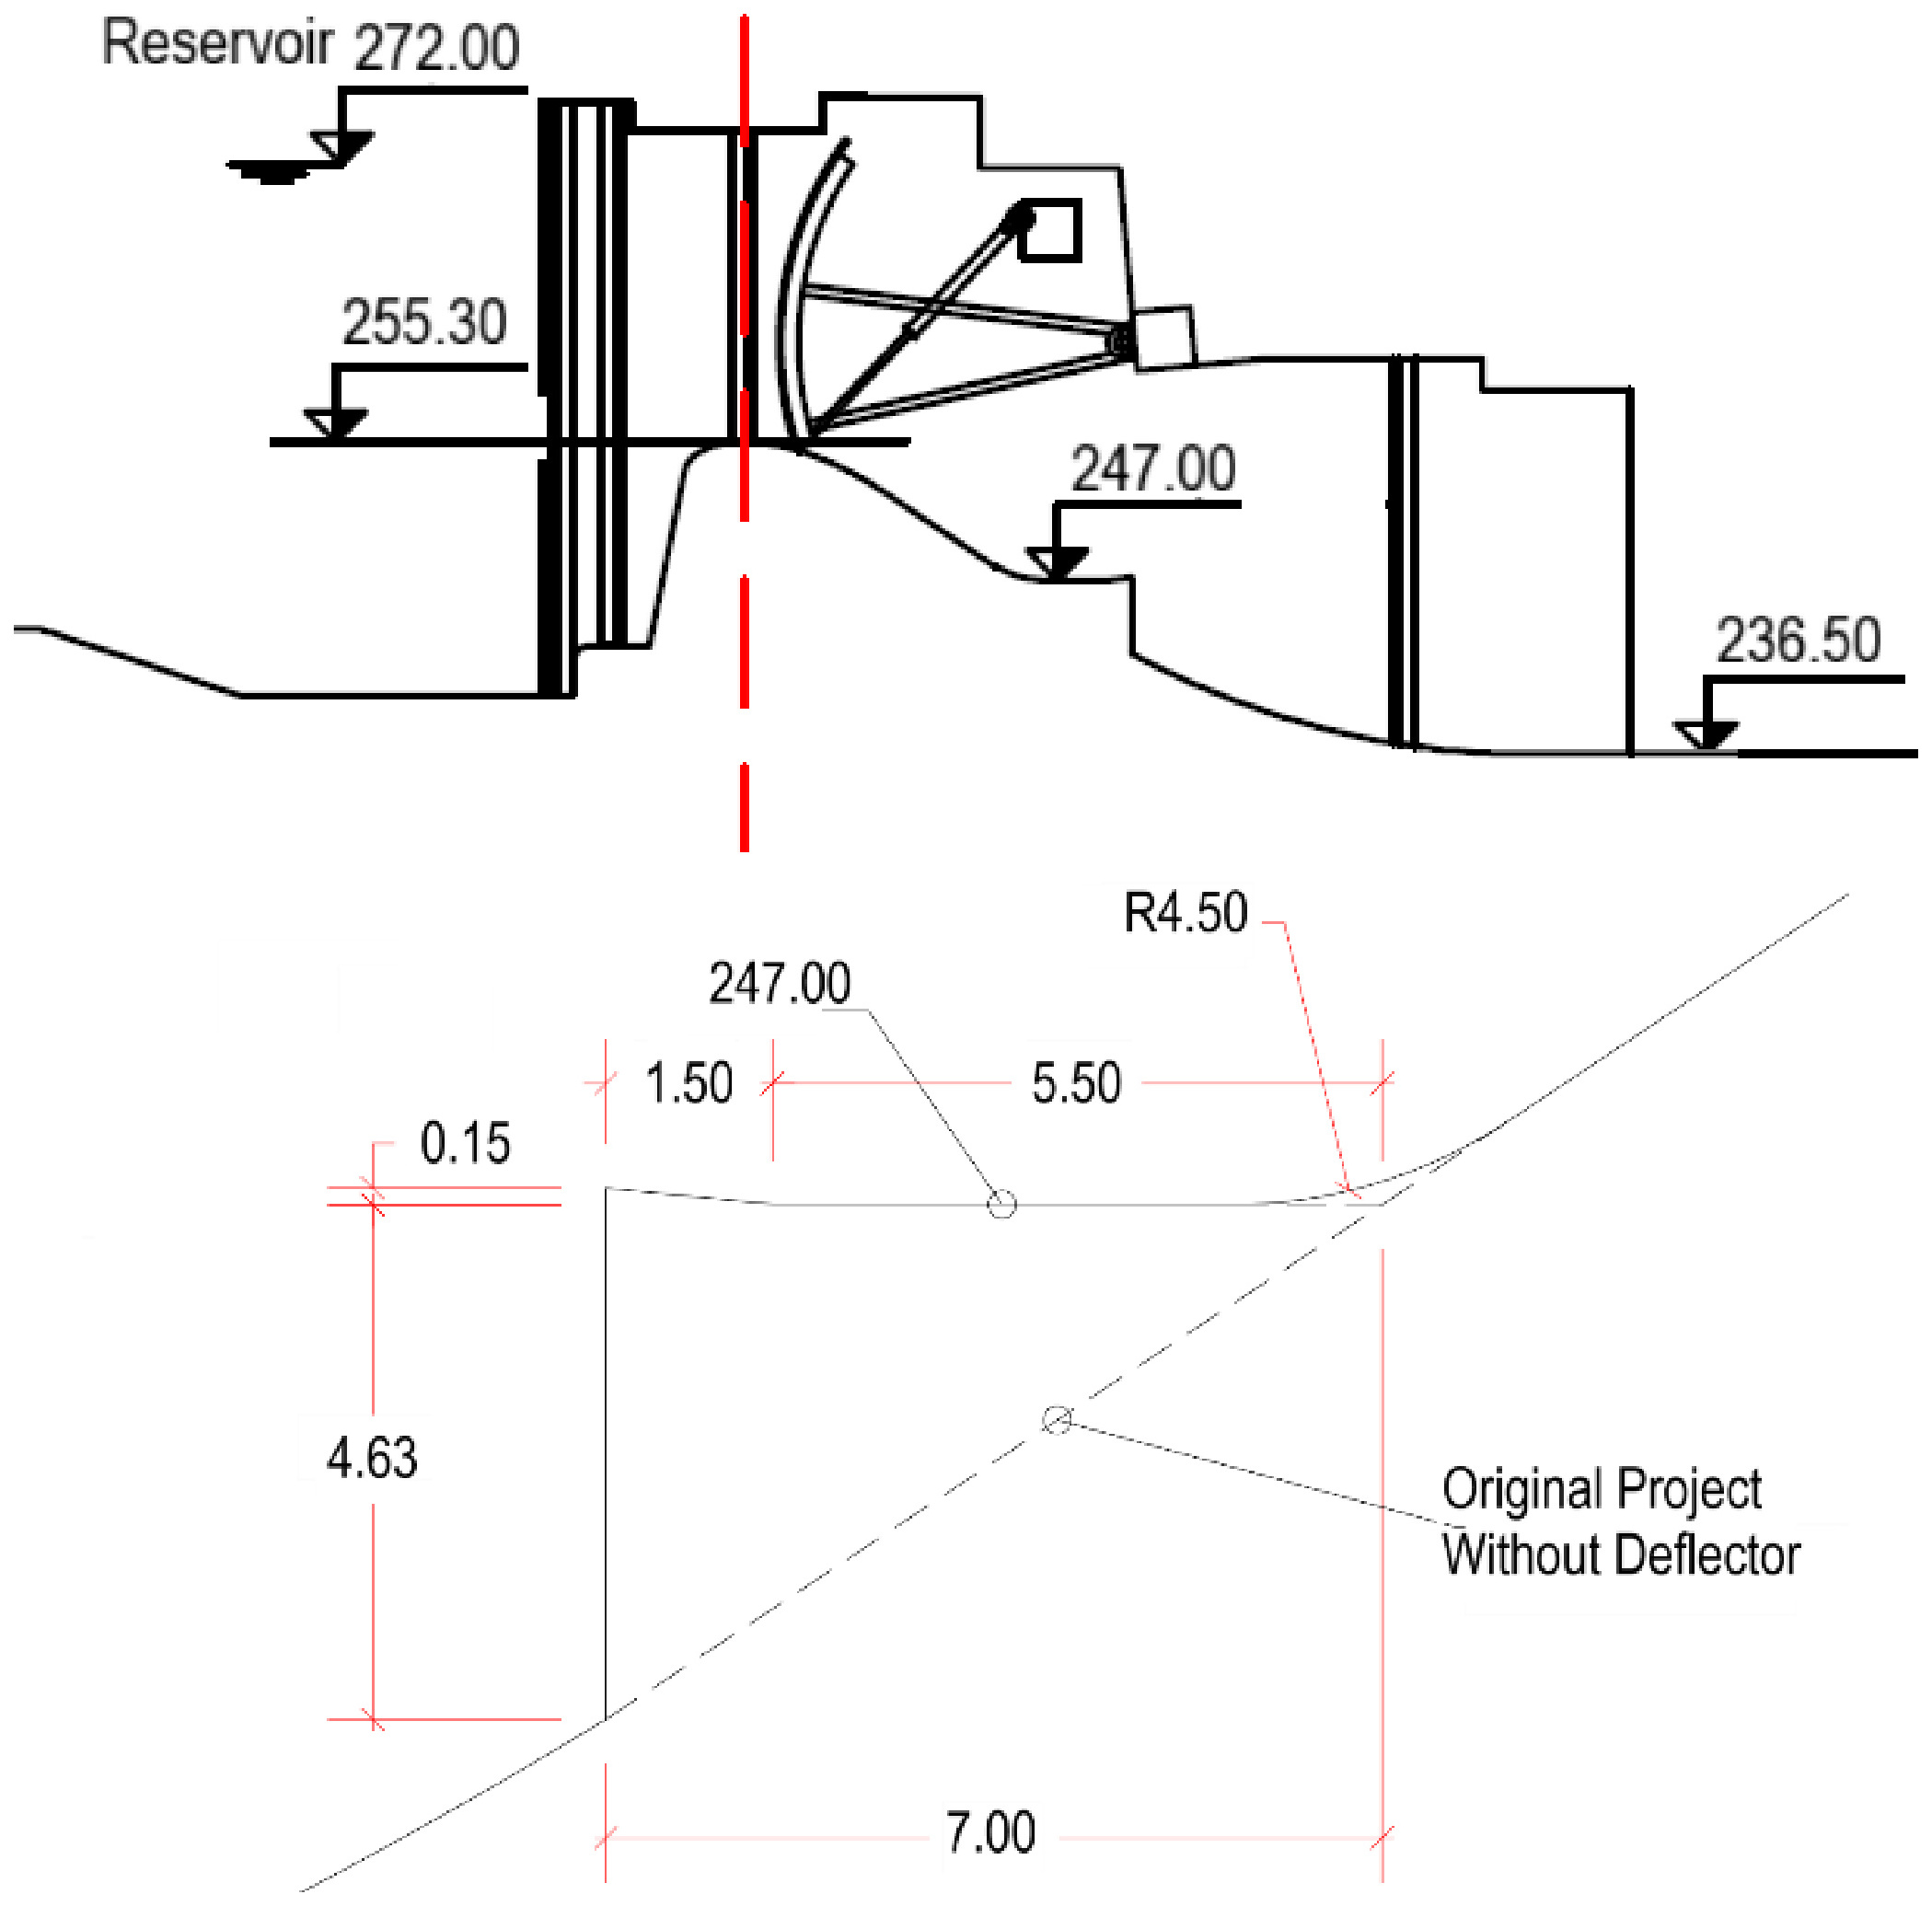
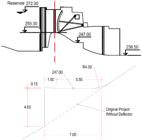
The reservoir normal water level is 272.0 m. The spillway crest is located at elevation 255.3 m. The energy dissipation structure is a stilling basin of hydraulic jump type. Figure 5 shows the spillway cross-section.
Water quality field data
Water quality probes were used to monitor TDG saturation upstream (reservoir) and downstream of the dam, (stilling basin at elevation of 246.0 m). The TDG probes were Hydrolab model MS5 (Ovelar et al., 2022). Measurements at the Colíder HPP began in October 2019. Before installation of the deflector, TDG data were used to calibrate the CFD model, afterwards, they were used to monitor the deflector’s performance.
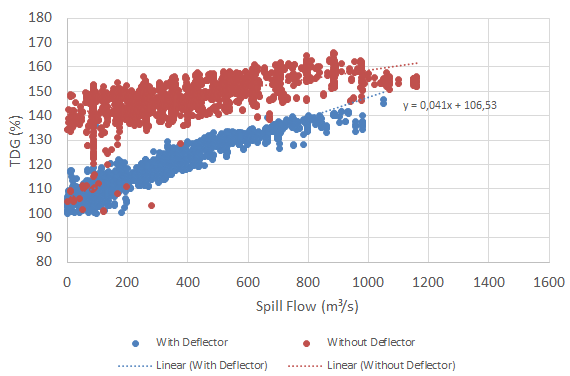
Figure 6 shows the historical TDG levels in the Colíder HPP stilling basin during spill events before and after deflector installation. For small spill events, the deflector reduced TDG by approximately 30 percent. For spills exceeding 1,000 m3/s when the powerhouse was not operating, the reduction was about 15 percent.
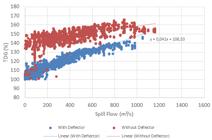
TDG concentration in the stilling basin with and without deflector. Adapted (Andriolo et al., 2023).
Mathematical model
Mathematical modeling can be very useful to understand the underlying phenomena leading to TDG (Politano et al., 2009). A comprehensive numerical modeling analysis was completed to assess the design of the Colíder HPP deflectors using CFD (Politano et al., 2022).
The model used in the original (Politano et al., 2024) were based on the open-source code OpenFOAM version 8.
The PIMPLE algorithm, which combines the pressure implicit with splitting of operators (PISO) and the semi-implicit method for pressure-linked equations (SIMPLE), was used. The algorithm improves the convergence of the coupled pressure–velocity equations.
A first-order Euler discretization scheme was used for time, and second-order Gauss limited linear schemes were utilized for the convective term. Although a second-order time scheme typically is preferred for simulations requiring high temporal accuracy, a first-order Euler discretization scheme was used in this study because it was more robust. Additionally, the time step corresponding to the selected Courant number of 0.5 was small enough that the first-order Euler discretization scheme provided sufficient accuracy for the goals of this study.
In this study, a program was developed in the Go programming language based on the mathematical model proposed by Wang et al. (2018). This program uses as input the hydrodynamic variables obtained from OpenFOAM simulations, such as velocity, pressure, and water volume fraction (Takenobu et al., 2022). This implementation replaces the TDG model embedded in OpenFOAM, where TDG is typically simulated alongside the hydrodynamic model.
The gas volume fraction is one of the parameters used in TDG modeling. In the study developed for the Colíder HPP (Politano et al., 2024) the sensitivity of the relationship between gas and water was evaluated, between 1% and 3%, with the value of 3% being adopted.
Continuity and momentum equations for the bubble phase are:
where is the gas volume fraction, is the bubble velocity vector, S represents the bubble–liquid mass transfer, is the pressure, t is the time, is the gravitational field vector, and is the bubble density calculated following the ideal gas law:
with M is the average molar mass of air, R is the universal gas constant, and T is the temperature, is the interfacial momentum transfer between phases.
with is the relative velocity vector of the bubble with respect to the liquid phase, is the bubble density and is the bubble diameter.
The drag coefficient can be modelled as:
with is the bubble Reynolds number:
In the studies developed by Politano et al. (2007) (Politano et al., 2009) it was considered that the bubbles were added to the system by the entrainment of air in the spillway and that there was no other volumetric source of bubbles along the domain, disregarding the generation of bubbles from supersaturated regions of TDG, since, according to the authors, in the region downstream of plants there are no places that favor the nucleation of bubbles. Thus, the bubble number density transport equation can be expressed as follows:
with N is the number bubble density.
The bubble radius is calculated from:
Politano et al. (2009) computed total dissolved gas concentration from:
where is the fluid volume fraction, is the fluid velocity vector. and are the fluid kinematic molecular and turbulent viscosity, respectively, and is the Schmidt number. The rate of mass transfer between bubble and liquid phases can be modelled as:
where is the mass transfer coefficient due to turbulence, σ is the interfacial tension, and H is the Henry’s constant.
The rate of mass transfer between bubble and liquid phases can be modelled as:
where is the Schmidt number: , is the kinematic viscosity, is the molecular diffusivity, is the rate of dispersion of turbulent kinetic energy (Equation 18).
In the present work, the relative velocity vector of the bubble, describe in Equation 4 to 6, was changed for the stochastic model developed by Valero et al. (2019).
To estimate the scale of longitudinal, vertical and transverse velocity fluctuations: 𝜎𝑥, 𝜎𝑦 and 𝜎𝑧, respectively, in the range 0.10<𝑦/𝛿<1 (Valero et al., 2019) used the semi-empirical expression proposed by Nezu (1977):
where is the shear velocity; y is the depth; is the boundary layer thickness. Di and Ki are the coefficients show in Table 1.
Hydrodynamic data
With the advent of modern computers with increased processing power and memory capacity, as well as the availability of cloud computing, it has become possible to computationally investigate more complex phenomena that require higher computational costs for their simulations. As a result, CFD simulations have become increasingly popular, even on personal computers (Bocchi et al., 2024).
During these years, special attention has been given to understanding flow characteristics such as energy dissipation, cavitation, aeration, and reoxygenation or re-aeration. Re-aeration, in particular, plays a critical role in environmental and engineering applications. One of its most relevant implications is enhancing river water quality, where stepped chutes can be strategically implemented to increase dissolved oxygen levels in degraded water bodies (Minho et al., 2024). Studying re-aeration also provides a gateway to numerical investigations of gas transfer across the air-water interface. In some cases, excessive gas dissolution downstream of stepped chutes may lead to total dissolved gas supersaturation, potentially causing gas bubble disease in fish (Minho et al., 2025).
In this study, the input data consisted of hydrodynamic variables such as velocity, pressure, and water volume fraction simulated by Takenobu et al. (2022). The hydraulic settings are shown in Table 2. The data were obtained using the OpenFOAM software with the interFoam solver, employing Detached Eddy Simulation (DES) and the k-ω SST turbulence model. A maximum Courant number of 0.5 was maintained throughout the simulations. The interFoam solver uses the VOF (Volume of Fluid) method to capture air entrainment into the flow. The simulated duration was 1.200 s.
Hydraulic Settings and Results – With Deflector –reservoir water elevation (RWL) and tailwater elevation (TWE).
Model parameterization adopted by Takenobu were based on Politano et al. (2015) studies. The results were compared against physical-model measurements.
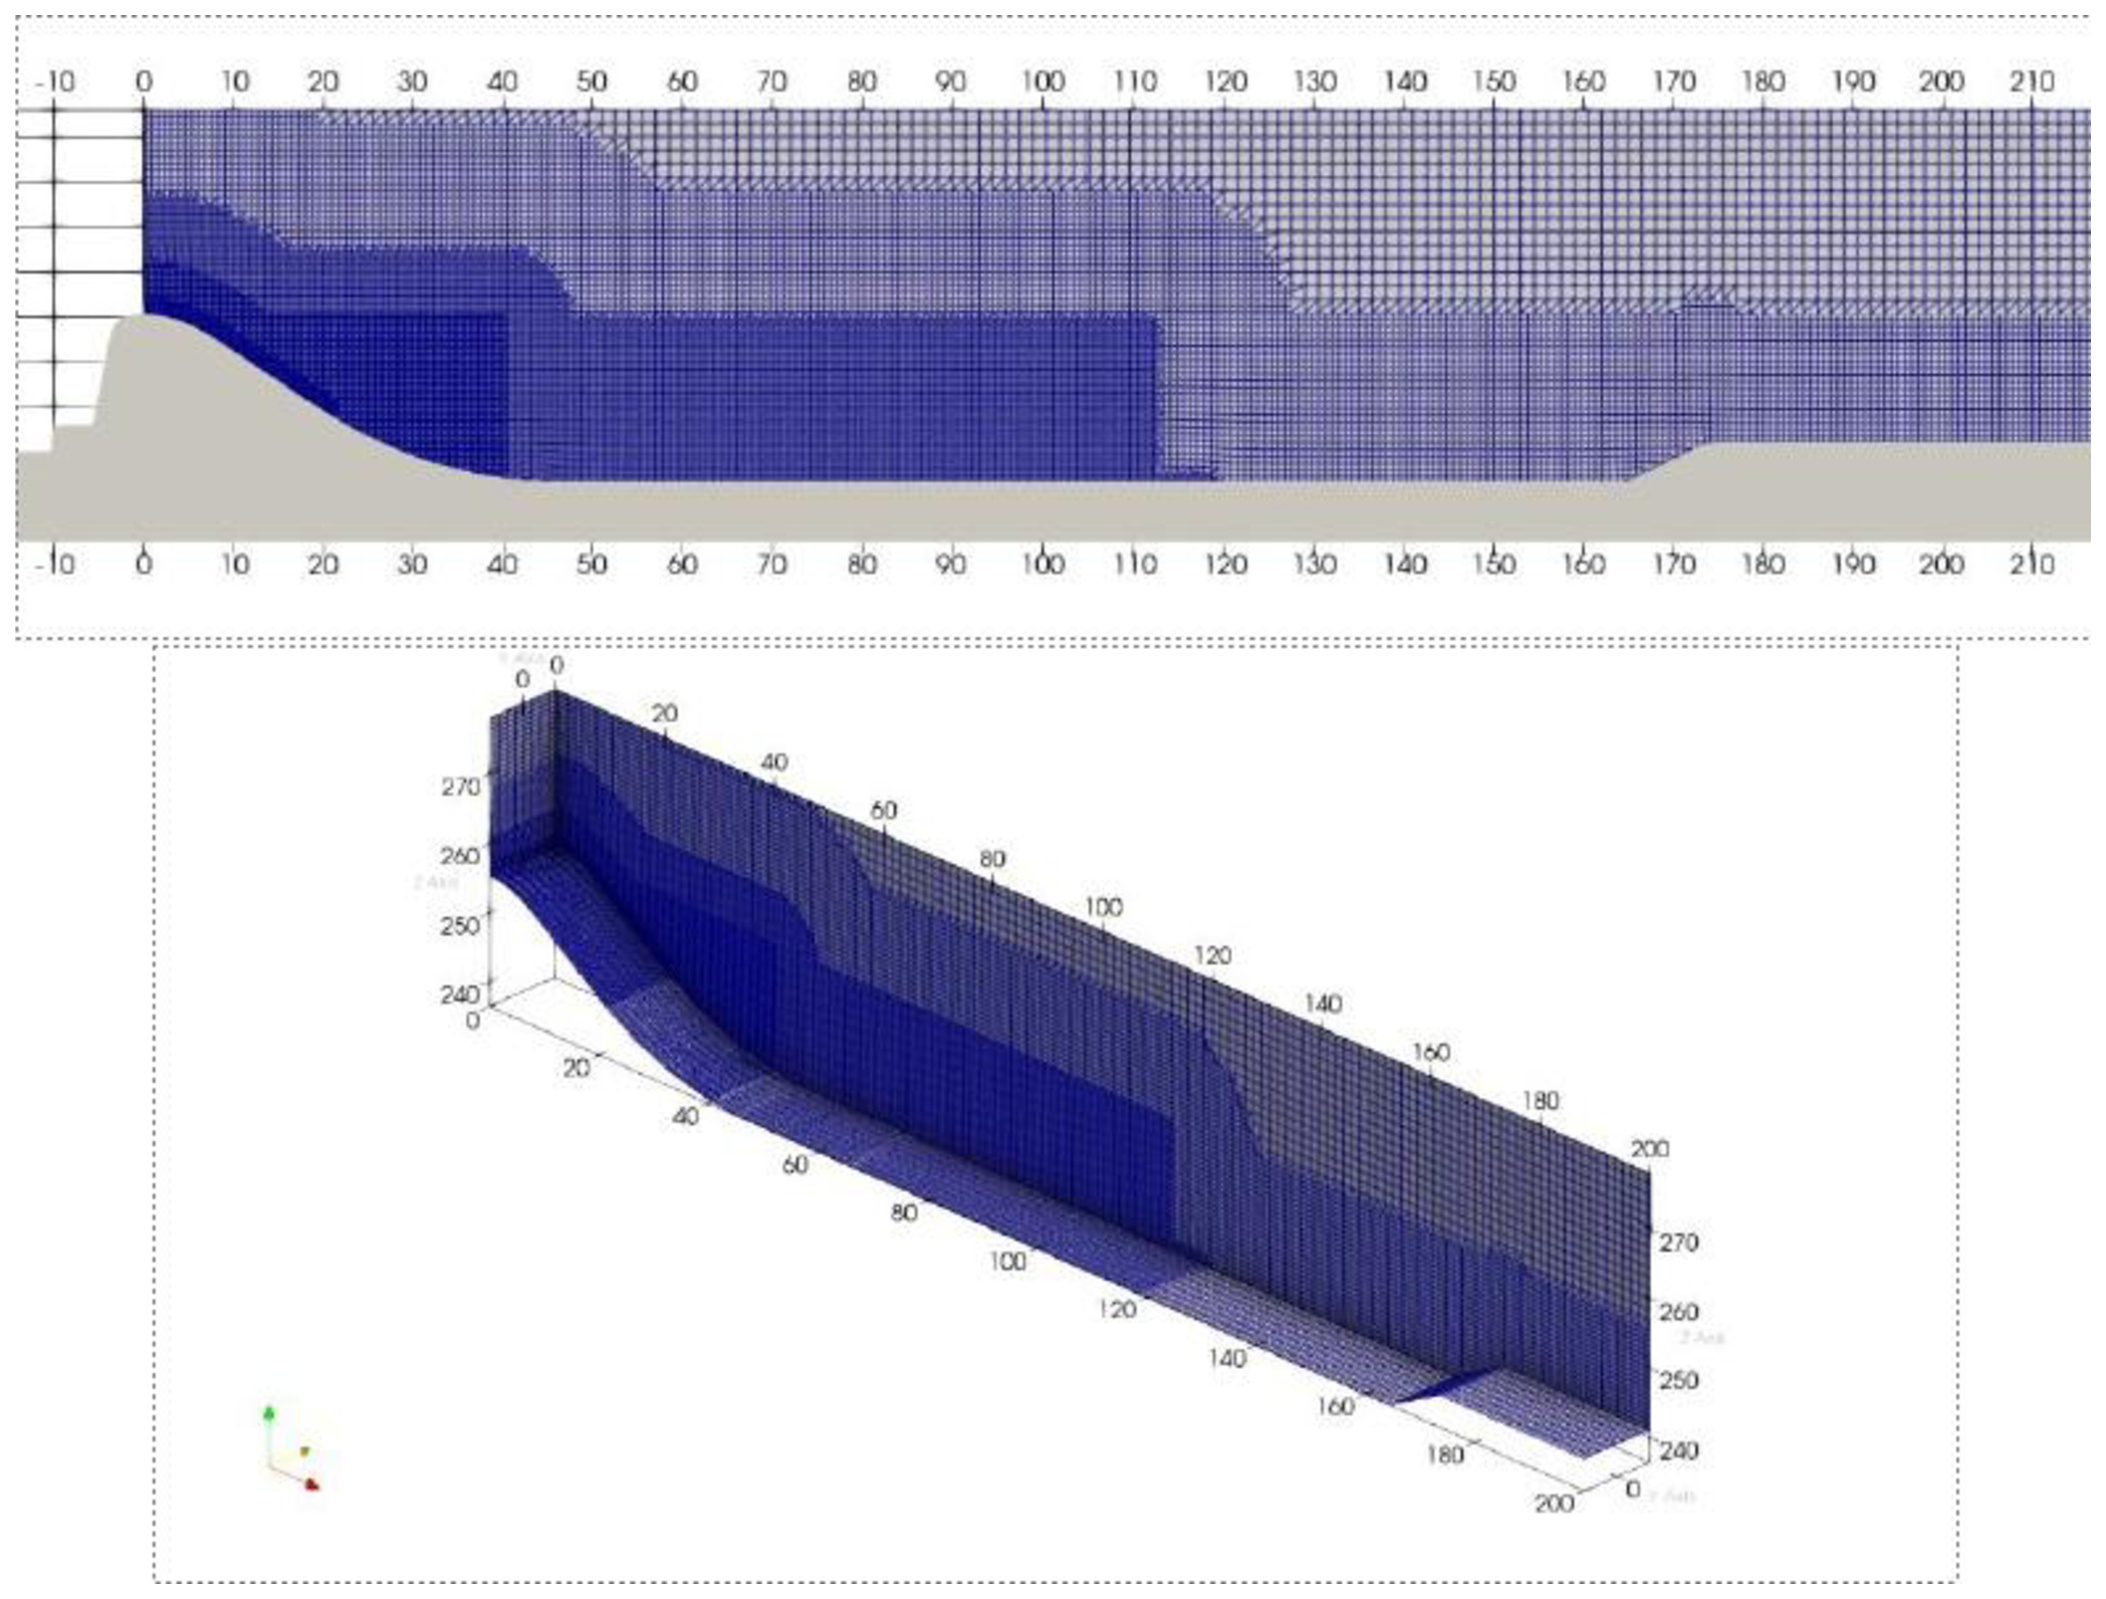
As reported by Takenobu et al. (2022) the computational domain, shown in Figure 7, represents one spillway bay, the entire stilling basin, and a reach of downstream channel, approximately 400 m long and 12 m wide. The mesh consists of cubic cells with 1.5 m on a side, with local refinement to 0.1m near the inlet, spillway, and stilling basin. The total mesh size was about 350x103 cells.
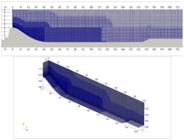
To validate the CFD model, Takenobu et al. (2022) compared numerical results with physical-model measurements. Discharge coefficients for partial gate openings differed by about 1% relative to the physical model. Overall, the OpenFOAM simulations reproduced the key hydraulic regimes (surface jet, plunging flow, and undular jet) observed in the experiments.
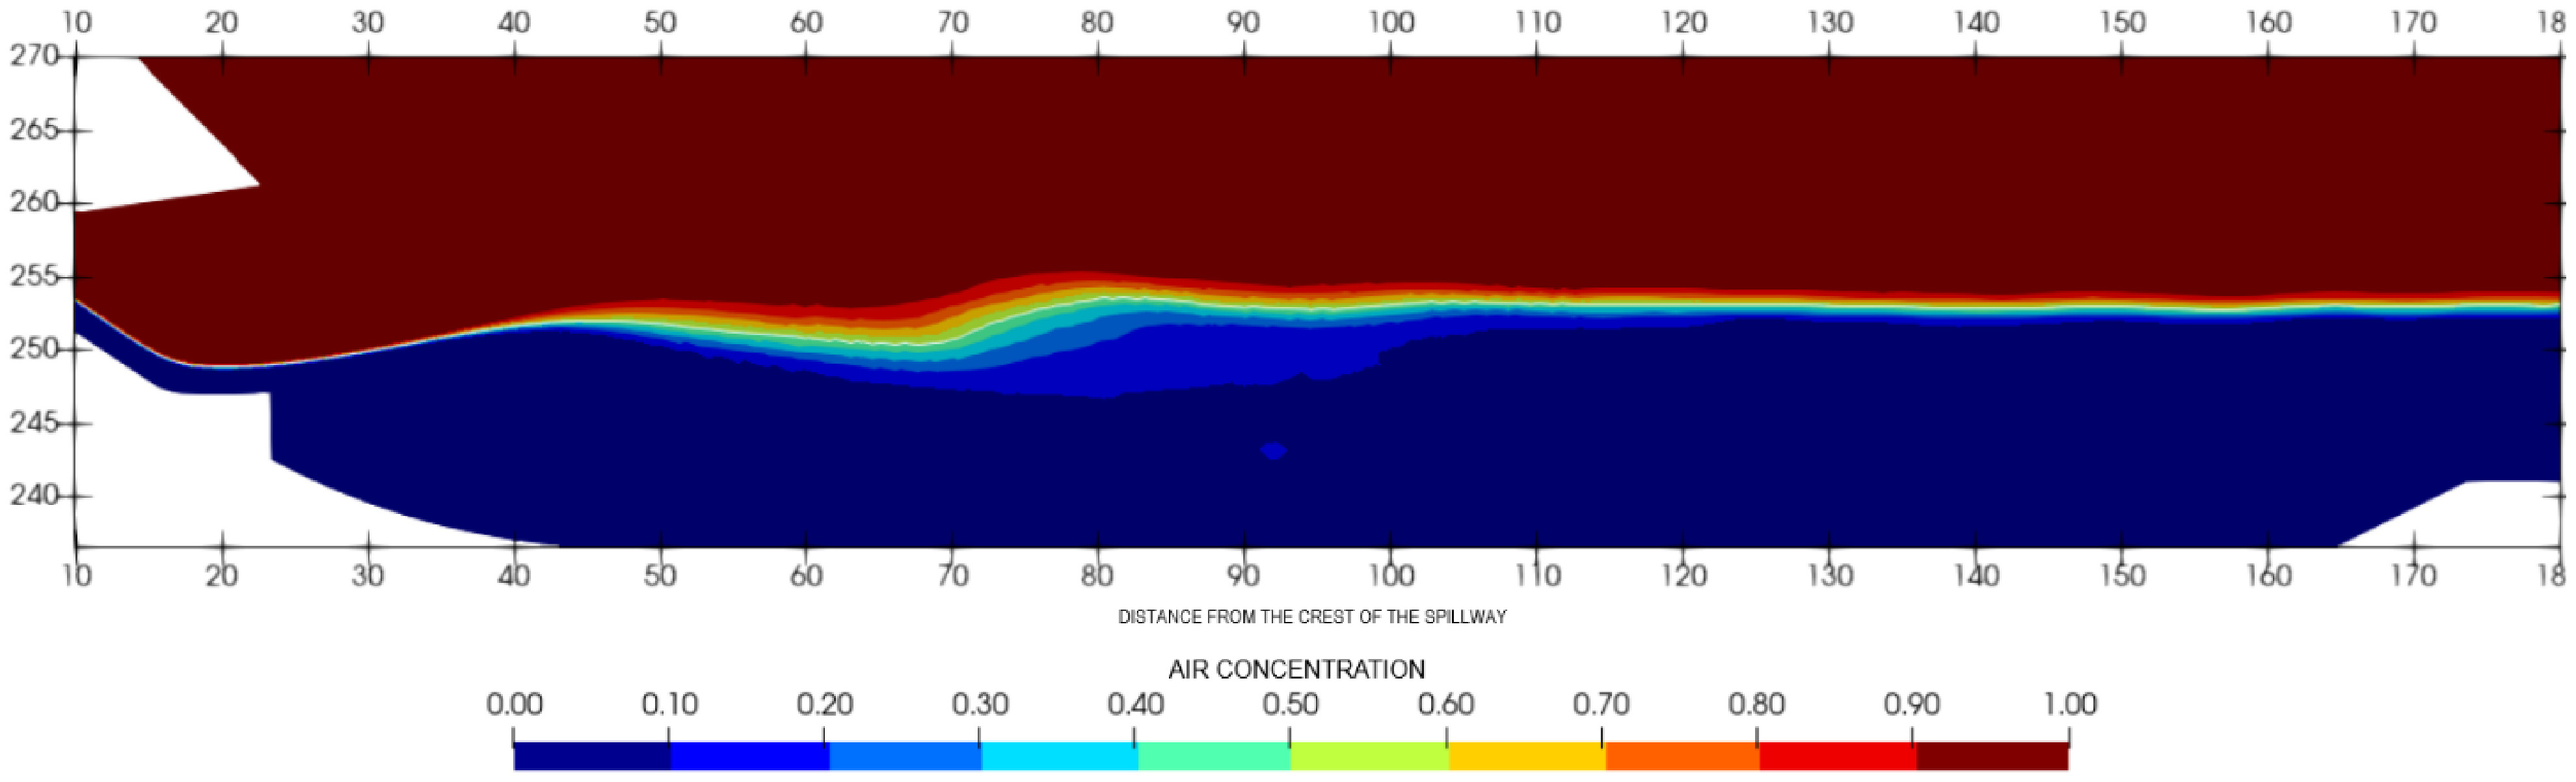
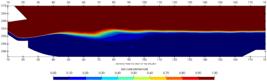
Table 3 summarize the computational domain, and Figure 8 shows the mean air concentration profile computed with OpenFOAM (Takenobu et al., 2022).
Computational mathematical model in Go
In this work the mathematical model was discretized with the finite difference method (Melo et al., 2017).
OpenFOAM hydrodynamic fields: velocity, pressure, and water volume fraction, were exported from ParaView in VTK-XML format and processed by a custom program written in Go.
To make the dataset simulated by Ovelar & Takenobu (2023) compatible with the TDG grid used here, it was resampled to the chosen grid resolution.
The available data were assigned to the corresponding cells (i, j), and the empty cells were filled according to the following rules:
-
use the arithmetic mean of available neighboring cells;
-
if no immediate neighbors were available, use the six closest cells to fit a least squares plane was fitted using the Gaussian elimination method with total pivoting;
-
if no nearby data existed use the inverse distance square weighting of all available cells to estimate the value.
Initial and numerical conditions:
-
The initial concentration C was set to the equilibrium TDG (100% saturation), 0.021 kg m-3, for T = 27.8 °C and P=97.2 kPa, with N2 ≈ 0.0122 kg m-3, O2 ≈ 0.0078 kg m-3, Ar ≈ 0.00052 kg m-3, CO2 ≈ 0.00052 kg m- 3 (Colt, 2012);
-
The initial bubble diameter (Db) adopted was 0.8 mm, as used in the studies developed by Politano et al. (2024) for the Colíder HPP.
-
The air inlet on the free surface was considered as incorporated by the value of , obtained in the hydrodynamic simulation (Takenobu et al., 2022) and adopted as the input parameter for this work.
-
The mesh spacing was and is 0.1 m.
-
The time step is 0.01 s; 10,000-time steps were computed, for a total simulation time of 100 s.
The convective term in Equation 9 ( ) was solved using the finite difference method, as shown in Equation 13.
where is the fluid volume fraction in cell (i,j), is the fluid velocity vector in cell (i,j), is the dissolved gas concentration in cell (i,j), and , are the grid spacings in the x and y directions, respectively.
The diffusive term in Equation 9 ( ) was solved using the finite difference method, as shown in Equation 14.
where , v- is the kinematic viscosity=1.004*10-6; is the turbulent viscosity = 1.002*10-5; Sc is the Schmidt number = 0.7.
To calculate the TDG source term of Equation 9 (S), Equation 15 was used.
where is the mass transfer coefficient due to turbulence.
The value of N, defined in Equation 7, is recalculated at each simulation time interval according to Equation 17, with the bubble Reynolds number (, defined in Equation 6) also being update at each interval.
where is the time step, is the liquid velocity e is the relative bubble velocity.
The rate of dispersion of turbulent kinetic energy (ε [m2/s3]) is solved as shown in Equation 18.
In this study, the relative bubble velocity (ub) was calculated using the Equation 12 presented in Valero et al., 2019), diverging from the relative bubble velocity calculated according to Huang et al. (2019).
To solve the first term of Equation 7,( ), the finite difference method was used, as illustrated in Equation 19, with Equation 20 being solved according to the selected time step.
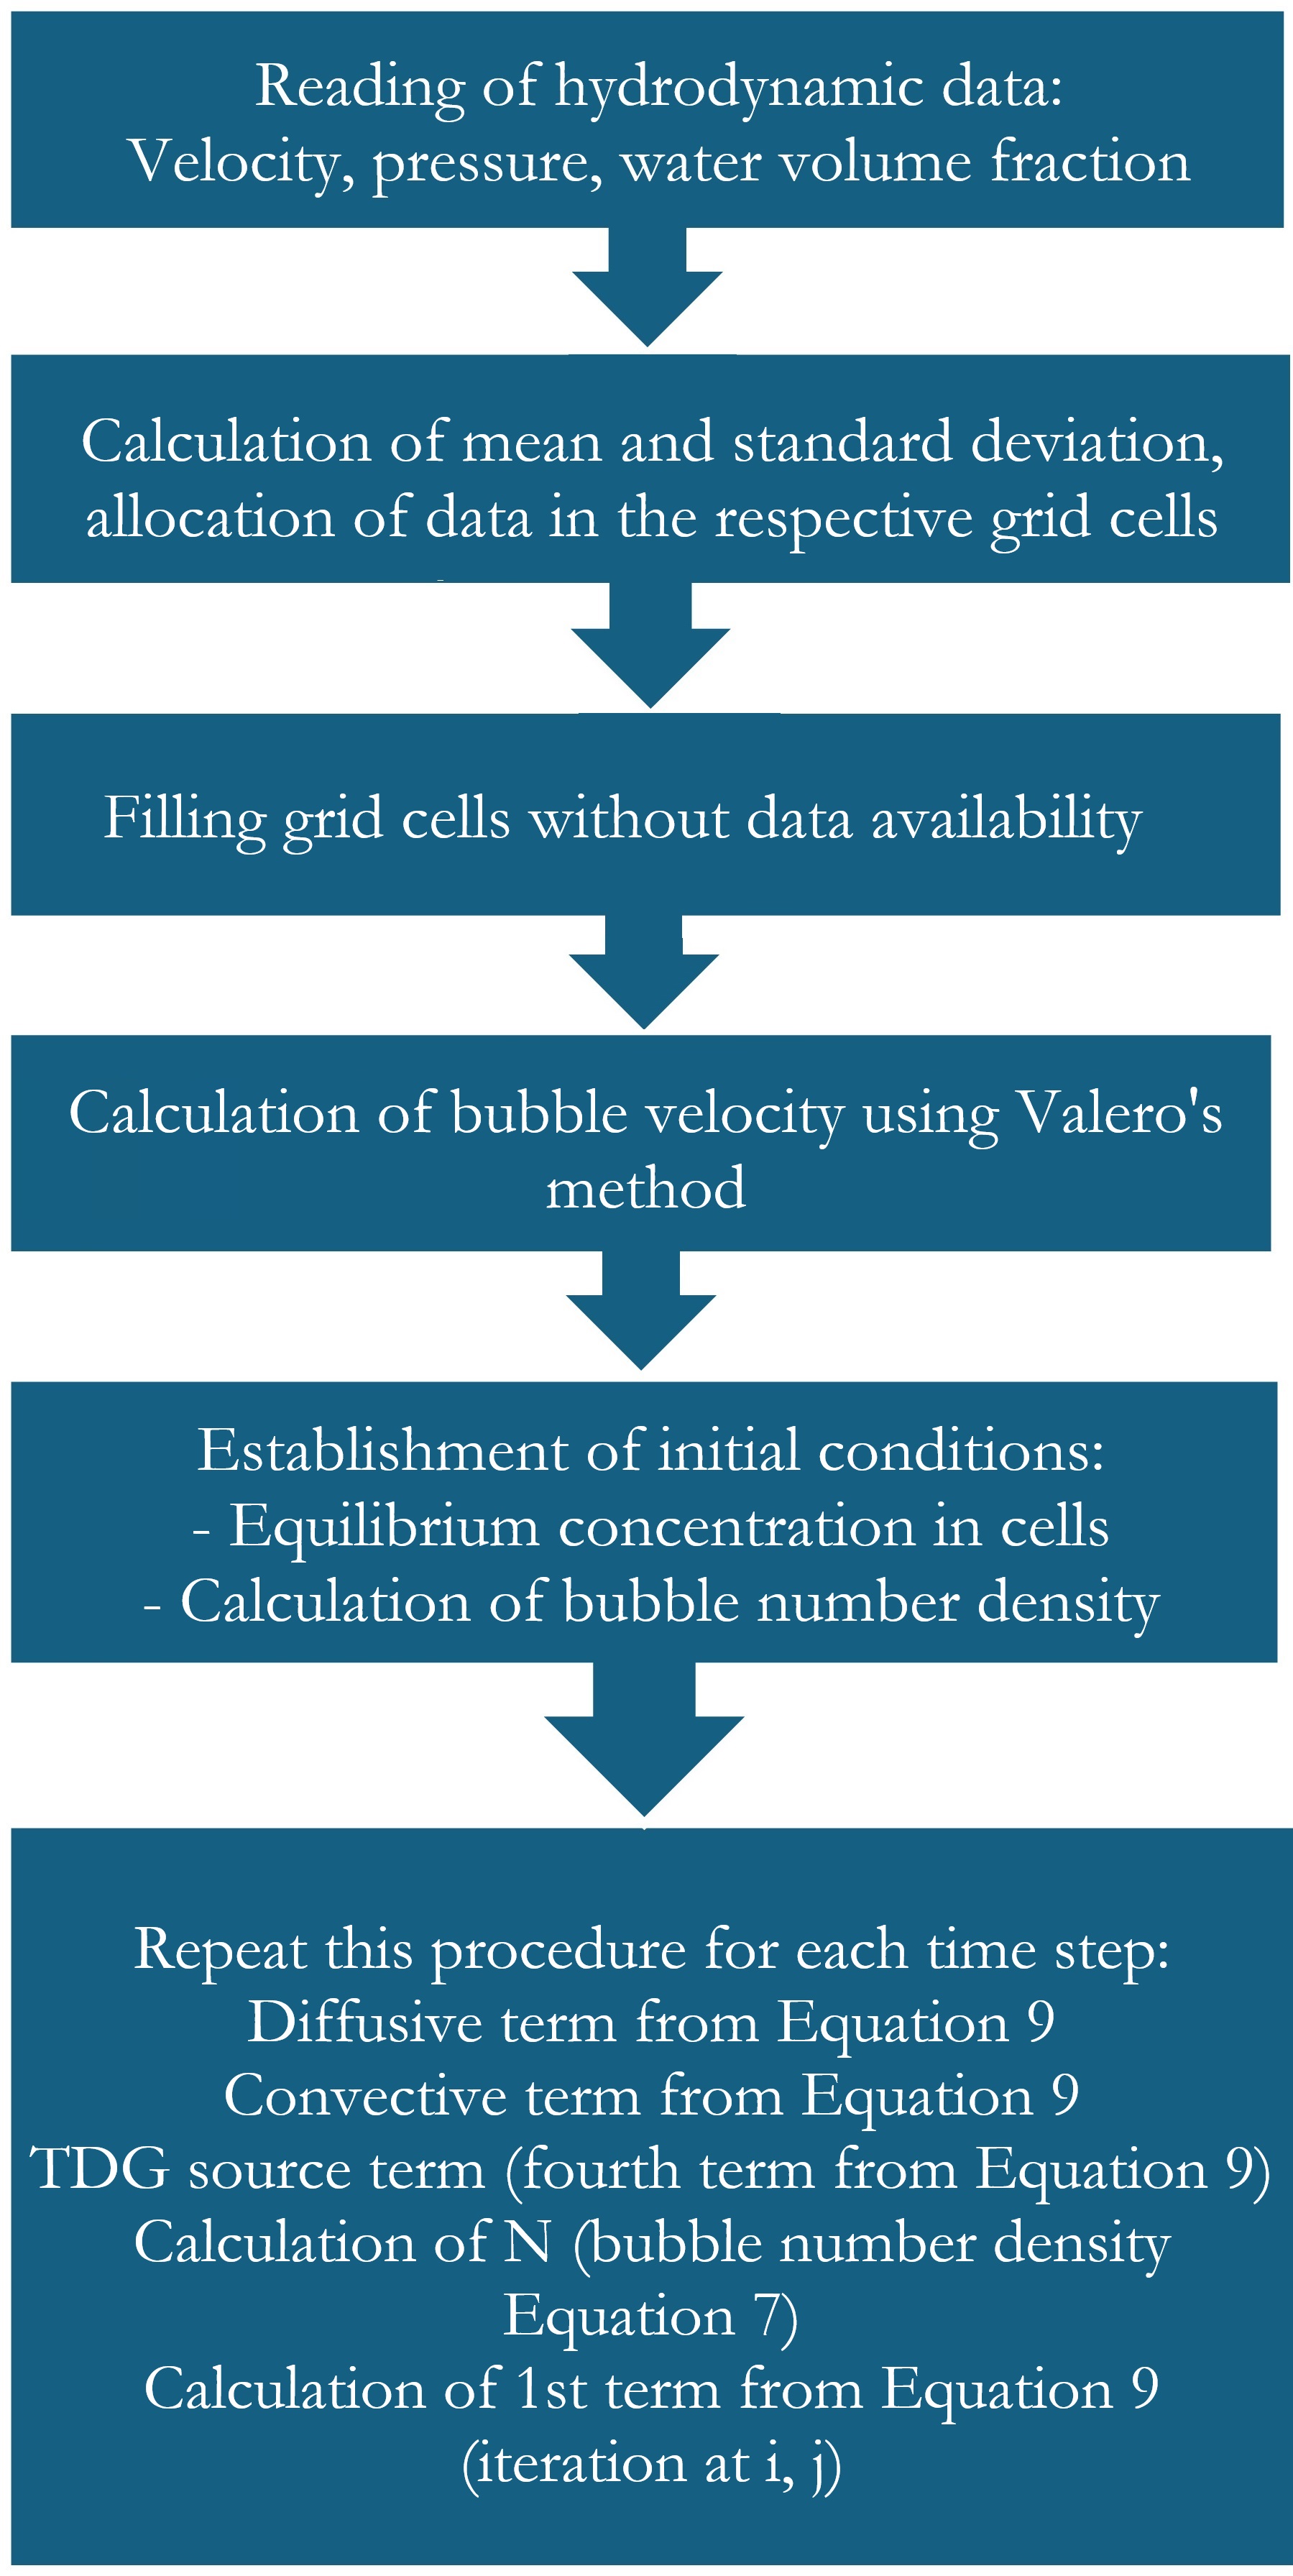
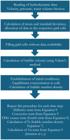
Figure 9 shows the flowchart of the steps for calculating the TDG developed in this work, whose equations are presented in item “Implementation of mathematical model in Go”.
RESULTS
The mathematical model implemented in Go was run on a 10 cm x 10 cm grid, with a time step of 0.01s was and a total simulated duration of 100 s.
The total dissolved gas pressure is conventionally referred to as the total gas pressure (TDG). Assuming that only the major gases (Nitrogen (78.084%), Oxygen (20.946%), Argon (0.934%) and Carbon dioxide (0.032%)) are present, the total dissolved gas pressure equation can be written (Colt, 1983):
If the TDG value is greater than the BP value (barometric pressure) the water is supersaturated.
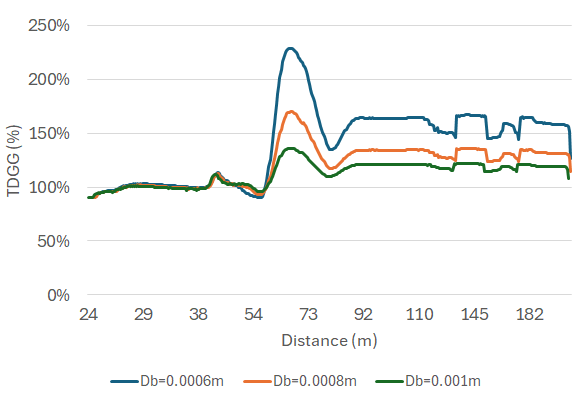
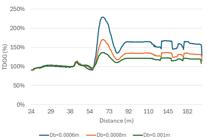
Figure 10 shows the simulated TDG saturation along the stilling basin at elevation 246 m, for different bubble diameters, under a total spill of 1,600 m3/s (400 m3/s per bay and specific flow rate of 33.3 m3/s.m), and a tailwater level at elevation 253.22. The maximum TDG reached approximately 170% at elevation 246 for a bubble diameter of 0.8 mm, for a bubble diameter of 0.6 mm and 1.0 mm, the maximum TDG were about 229% and 136%, respectively.
These simulation results can be compared with the TDG performance curve for the Colíder HPP spillway, as presented by Andriolo et al. (2023) and shows in Figure 6. The TDG data used by Andriolo et al. (2023) was installed in the stilling basin, at elevation 246 m, 54 m downstream of the spillway crest. For a total discharge of 1,600 m3/s (unit discharge of 33.3 m3/s.m), the performance curve yields an expect TDG of approximately 172%, when the linear relation shown in that figure is applied. Noted that the maximum post deflector discharge observed during the monitoring period was 1,050 m3/s, at with a TDG of 145% was measured.
Comparing the maximum simulated TDG values of 170% with the curve estimate (~172%) in Figure 6 indicates close agreement, within the variability of the field measurements and the uncertainly associated with extrapolating to 1,600 m3/s.
The increase in TDG between 50 m to 80 m downstream of the crest, shown in Figure 10, is consistent with the increase in the air-water ratio in this region, as shown in Figure 8 and with the TDG transport equation presented in Equation 9.
The greater reduction in TDG along the stilling basin simulated in this study, compared to other studies, can be attributed to the calculation method employed, which used Equation 9.
CONCLUSIONS
The TDG calculation model proposed in this work solves the TDG transport equations using the finite difference method, implemented in the Go programming language. By decoupling these equations from the computation of hydrodynamic variables and from the OpenFOAM solver, the approach significantly reduces computational time.
Comparing the maximum simulated TDG values of 170% with the curve estimate (~172%) in Figure 6 indicates close agreement, within the variability of the field measurements and the uncertainly associated with extrapolating to 1,600 m3/s.
This methodology enables hydrodynamic simulations to be performed in OpenFOAM with a coarser mesh, after which TDG calculations are carried out in the Go-based program.
The algorithm developed in Go produced promising results, with maximum values comparable to those reported in more complex studies that require substantially greater computational resources. Nevertheless, the program presented here is intended as a tool for preliminary studies and should not be used for the final design of spillway deflectors.
ACKNOWLEDGEMENTS
This article presents parts of the results obtained during the execution of the R&D project PD-06491-0541/2019 entitled "Methodology for computational modeling of TDG in water in spillway effluent flows" carried out by the Lactec Institutes and sponsored by Copel Geração e Transmissão S.A. within the scope of the Research, Development and Innovation Program of the Brazilian Electricity Sector, regulated by the National Electric Energy Agency (ANEEL).
DATA AVAIABILITY STATEMENT
Research data is only available upon request
REFERENCES
-
Agostinho, A. A., Alves, D. C., Gomes, L. C., Dias, R. M., Petrere Junior, M., & Pelicice, F. M. (2021). Fish die-off in river and reservoir: a review on anoxia and gas supersaturation. Neotropical Ichthyology, 19(3), e210037. https://doi.org/10.1590/1982-0224-2021-0037
» https://doi.org/10.1590/1982-0224-2021-0037 - Andriolo, M. V., Araujo, A. N., Fontanelli, C., Paranhos, C. S. A., & Dettmer, P. H. C. (2022). Hydraulic performance curves to support the design of spillway deflectors in colíder dam Denver: Hydrovision.
-
Andriolo, M. V., Araújo, A. N., Fontanelli, C., Paranhos, C. S. A., Politano, M., & Dettmer, P. H. C. (2023). Installation of deflector in Colider Dam to minimize the percentage of total dissolved gases. RBRH, 28, e25. https://doi.org/10.1590/2318-0331.282320230024
» https://doi.org/10.1590/2318-0331.282320230024 - Bacchiega, J. D., & Fattor, C. A. (2014). Yacyretá Dam: spillways modification to reduce total dissolved gases concentrations downstream of the dam. In F. Yazdandoost & J. Attari (Eds.), Hydraulics of dams and river structures (pp. 77-84). Boca Raton: CRC Press.
- Bender, M. D., & Hadjerioua, B. (2012). Prediction of Total Dissolved Gas (TDG) at Columbia River Basin dams Washington, D.C.: U.S. Department of the Interior, Bureau of Reclamation.
-
Bocchi, J. P. P., Sanagiotto, D. G., & Teixeira, E. D. (2024). Submerged hydraulic jump: a computational analysis in different scales. RBRH, 29, e2. https://doi.org/10.1590/2318-0331.292420230089
» https://doi.org/10.1590/2318-0331.292420230089 - Canadian Council of Ministers of the Environment – CCME. (1999). Canadian environmental quality guidelines Winnipeg: CCME.
-
Colt, J. E. (1983). The computation and reporting of dissolved gas levels. Water Research, 17(8), 841-849. https://doi.org/10.1016/0043-1354(83)90157-4
» https://doi.org/10.1016/0043-1354(83)90157-4 - Colt, J. (2012). Dissolved gas concentration in water Amsterdam: Elsevier.
- Donavan, A. A. A., & Kernighan, B. W. (2015). The Go programming language Indiana: Go Project.
- Ebel, W. J. (1969). Supersaturation of nitrogen in the Columbia River and its effect on salmon and steelhead trout bureau of commercial fisheries biological laboratory. Fishery Bulletin Bureau of Commercial Fisheries Biological Laboratory, 68(1), 1-11.
-
Huang, J., Li, J., Politano, M., Ran, L., & Carrica, P. (2019). Modeling air entrainment downstream of spillways. In L. Calvo (Ed.), 38th IAHR World Congress (pp. 11). Beijing: International Association for Hydro-Environment Engineering and Research. https://doi.org/10.3850/38WC092019-1317.
» https://doi.org/10.3850/38WC092019-1317 -
Melo, A. R., Gramani, L. M., & Kaviski, E. (2017). Um novo método para incluir condições de contorno e condições iniciais em esquemas explícitos de equações hiperbólicas unidimensionais. Revista Interdisciplinar de Pesquisa em Engenharia, 2(14), 6-17. https://doi.org/10.26512/ripe.v2i14.21359
» https://doi.org/10.26512/ripe.v2i14.21359 - Minho, T. R. P., Simões, A. L. A., Queiroz, L. M., Arcanjo, G. S., Schulz, H. E., Porto, R. M., & Gonçalves, J. C. S. I. (2024). Numerical modeling and empirical formulation for re-aeration in nappe flow without hydraulic jump in stepped chutes. Revista Brasileira de Recursos Hídricos, 29, e40.
- Minho, T. R. P., Simões, A. L. A., Queiroz, L. M., Arcanjo, G. S., Schulz, H. E., Porto, R. M., & Gonçalves, J. C. S. I. (2025). Re-aeration in skimming flow over stepped chutes: two-dimensional CFD modeling and empirical equations — a numerical and conceptual approach. Revista Brasileira de Recursos Hídricos, 30, e19.
- Myers, R., & Parkinson, S. E. (2003). Hells canyon complex total dissolved gas study Boise: Idaho Power Company.
- Nezu, I. (1977). Turbulent structure in open-channel flows (Doctoral thesis). Kyoto University, Kyoto.
-
Ovelar, C. O. S., Takenobu, M. Y. M., Souza, F. F., Andriolo, M. V., Ferreira, F. C. A. da S., & Aver, C. S. (2022). OpenFOAM TDG Model Applied in Colíder Dam Case. In XXX Congreso Latinoamericano de Hidraulica (pp. 104-112). Madrid: IAHR Publishing. Retrieved in 2025, May 21, from https://www.researchgate.net/publication/368471738_OPENFOAM_TDG_MODEL_APPLIED_IN_COLIDER_DAM_CASE/citations
» https://www.researchgate.net/publication/368471738_OPENFOAM_TDG_MODEL_APPLIED_IN_COLIDER_DAM_CASE/citations - Ovelar, C. O. S., & Takenobu, M. Y. M. (2023). Projeto PD-06491-0541/2019 metodologia para modelagem computacional de TDG na água em fluxos efluentes de vertedouros. Relatório técnico final Curitiba: ANEEL.
-
Politano, M. S., Carrica, P. M., Turan, C., & Weber, L. (2007). A multidimensional two-phase flow model for the total dissolved gas downstream of spillways. Journal of Hydraulic Research, 45(2), 165-177. https://doi.org/10.1080/00221686.2007.9521757
» https://doi.org/10.1080/00221686.2007.9521757 -
Politano, M. S., Carrica, P., & Weber, L. (2009). A multiphase model for the hydrodynamics and total dissolved gas in tailraces. International Journal of Multiphase Flow, 35(11), 1036-1050. https://doi.org/10.1016/j.ijmultiphaseflow.2009.06.009
» https://doi.org/10.1016/j.ijmultiphaseflow.2009.06.009 - Politano, M. S., Wang, Y., & Laughery, R. (2015). A numerical model for spillway jet regimes and total dissolved gas. Hydro Research Foundation, 357, 339-357.
-
Politano, M. S., Lyons, T., Anderson, K., Parksinson, S., & Weber, L. (2016). Spillway deflector design using physical and numerical models. In 6th International Symposium on Hydraulic Structures (pp. 27-30), Portland. Retrieved in 2025, May 21, from http://digitalcommons.usu.edu/ishs/2016/Session5/2
» http://digitalcommons.usu.edu/ishs/2016/Session5/2 - Politano, M., Huang, J., Andriolo, M. V., Araujo, A. N., & Lyons, T. (2022). A numerical modeling to support the design of spillway deflectors in colider dam Denver: Hydrovision.
-
Politano, M., Huang, J., Lyons, T., & Andriolo, V. (2024). Performance evaluation of spillway deflectors with a multiphase flow model. Journal of Hydraulic Engineering, 150(2), 05023004. https://doi.org/10.1061/JHEND8.HYENG-13643
» https://doi.org/10.1061/JHEND8.HYENG-13643 -
Takenobu, M. Y. M., Ovelar, C. O. S., Dettmer, P. H. C., Andriolo, M. V., & Fontanelli, C. (2022). Physical and numerical hydraulic modeling of a spillway with horizontal deflectors. In M. Ortega-Sánchez (Ed.), Proceedings of the 39th IAHR World Congress Madrid: IAHR Publishing. https://doi.org/10.3850/IAHR-39WC2521711920221103
» https://doi.org/10.3850/IAHR-39WC2521711920221103 -
Valero, D., Kramer, M., Bung, D. B., & Chanson, H. (2019). A stochastic bubble generator for air-water flow research. In Proceedings of the 38th IAHR World Congress (pp. 5714-5721). Madrid: IAHR Publishing. https://doi.org/10.3850/38WC092019-0909
» https://doi.org/10.3850/38WC092019-0909 -
Wang, Y., Politano, M., & Weber, L. (2018). Spillway jet regime and total dissolved gas prediction with a multiphase flow model. Journal of Hydraulic Research, 57(1), 26-38. https://doi.org/10.1080/00221686.2018.1428231
» https://doi.org/10.1080/00221686.2018.1428231 - Weitkamp, D E. (2008). Total dissolved gas supersaturation biological effects, review of literature 1980-2007. Bellevue: Parametrix.
Edited by
-
Editor in-Chief:
Adilson Pinheiro
-
Associated Editor:
Iran Eduardo Lima Neto