ABSTRACT
This paper aims to present a methodology to conduct a water stress assessment of water resources systems through indices. The proposed methodology was applied to Cantareira System, which is one of the most important water supply systems of São Paulo Metropolitan Region (SPMR). The authors used two indices to support this evaluation: Normalized Deficit Index (NDI) and Normalized Deficit Cumulated (NDC). Both of them consider only the natural flow as the renewable source of water (supply), and account for natural and anthropic uses of this water (demand) as a way to determine the dependence level that the area relies on endogenous and/or exogenous sources of water to meet its needs. To support this assessment, two meteorological drought indices were used as well: the Standardized Precipitation Index (SPI) and Drought Magnitude (DM). The diagnosis of a water supply system, a country, region or even district, based on indices that represent the local water risk, is extremely important not only to bring a better understanding of extreme events, such as droughts and floods, but also to support strategic decision-making process regarding water resources management. This sort of assessment is a useful tool, for instance, in indicating eventual necessity of water storage, such as large reservoirs, or interbasin water transfers, which could improve the water security levels of the study unit.
Keywords:
Indices; Water stress assessment; Water resources management; Cantareira water supply system
RESUMO
O presente artigo teve como objetivo apresentar uma metodologia para avaliação do estresse hídrico de sistemas de recursos hídricos por meio de índices. Neste caso, aplicou-se a metodologia proposta ao Sistema Cantareira, um dos principais sistemas produtores de água da Região Metropolitana de São Paulo (RMSP). Foram utilizados para esta avaliação o Normalized Deficit Index (NDI) e o Normalized Deficit Cumulated (NDC), que utilizam apenas os aportes naturais como fonte renovável de água (fornecimento), e consideram os usos naturais e antrópicos desta água (demandas), como forma de determinar o grau de dependência que a área apresenta tanto de fontes endógenas, quanto exógenas para suprimento das necessidades de abastecimento. Para subsidiar esta avaliação, utilizou-se de forma combinada dois índices que representam secas meteorológicas: o Standardized Precipitation Index (SPI) e Drought Magnitude (DM). A realização do diagnóstico de um sistema produtor, ou mesmo de um determinado país, região ou distrito, por meio de índices que refletem o risco hídrico, contribui para o melhor entendimento de eventos extremos, como secas e enchentes e, principalmente, auxiliam a tomada de decisões estratégicas na gestão de recursos hídricos local, indicando, por exemplo, eventuais necessidades de armazenamento ou importação de água de outras bacias, que contribuem para o aumento da segurança hídrica na unidade de avaliação.
Palavras-chave:
Índices; Avaliação de estresse hídrico; Gerenciamento de recursos hídricos; Sistema produtor Cantareira
INTRODUCTION
In recent years, many indices and indicators have been developed to quantitatively measure the water fragility of regions, river basins and water-producing systems, as well as to evaluate in detail water stress or scarcity events.
The characterization of water stress, however, carries a relative difficulty, once there are many evaluation criteria, apparently of equal importance, when it comes to approaching the issues related to water management. The selection of these evaluation criteria can be either a political decision or a scientific ( BROWN; MATLOCK, 2011 BROWN, A.; MATLOCK, M. D. A review of water scarcity indices and methodologies . Arkansas: The Sustainability Consortium, 2011. v. 106, p. 21. ) one.
The estimation of current levels of water stress is of fundamental importance, also if one considers the need for reliable projections about the severity of future water-related crises, mainly due to climatic variability ( OKI et al., 2001 OKI, T.; AGATA, Y.; KANAE, S.; SARUHASHI, T.; YANG, D.; MUSIAKE, K. Global assessment of current water resources using total runoff integrating pathways. Hydrological Sciences Journal, v. 46, n. 6, p. 983-995, 2001. http://dx.doi.org/10.1080/02626660109492890.
http://dx.doi.org/10.1080/0262666010949...
).
In the Brazilian scenario, unlike the water quality indices, widely studied in the scientific community, indices that quantitatively evaluate water matters still remain little explored. There is not a wide range of papers that approach the evaluation of water resources systems through methodologies that use indices and indicators of water, meteorological or climatic stress. Much of the work in this line deals with the application of these methods for agronomic processes assessment, as in the works of Alves, Campos and Vieira (2008) ALVES, J. M. B.; CAMPOS, J. N. B.; VIEIRA, V. P. B. Analysis of sustainability agro-hydrometeorology in the state of the Ceará. Revista Brasileira de Meteorologia , v. 23, n. 1, p. 103-114, 2008. http://dx.doi.org/10.1590/S0102-77862008000100010.
http://dx.doi.org/10.1590/S0102-7786200...
, who analyzed the agro-hydrometeorological sustainability of Ceará State through performance indices proposed by Hashimoto, Stedinger and Loucks (1982) HASHIMOTO, T.; STEDINGER, J. R.; LOUCKS, D. P. Reliability, resiliency, and vulnerability criteria for water resource system performance evaluation. Water Resources Research , v. 18, n. 1, p. 14-20, 1982. http://dx.doi.org/10.1029/WR018i001p00014.
http://dx.doi.org/10.1029/WR018i001p000...
: reliability, resilience and vulnerability. Fernandes et al. (2010) FERNANDES, D. S.; HEINEMANN, A. B.; PAZ, R. L. F.; AMORIM, A. O. Desempenho de índices quantitativos de seca na estimativa da produtividade de arroz de terras altas. Pesquisa Agropecuária Brasileira, v. 45, n. 8, p. 771-779, 2010. http://dx.doi.org/10.1590/S0100-204X2010000800001.
http://dx.doi.org/10.1590/S0100-204X201...
also applied quantitative indices of drought in the estimation of rice yield in Goiânia-GO microregion. In this work, the authors employed the Palmer Drought Severity Index (PDSI); Z of Palmer (Z-index); Rainfall Anomaly Index (RAI); and the Standardized Precipitation Index (SPI).
In this context, the main objective of this work is to develop a strategic assessment of water resources systems stress, based on indices and indicators. Therefore, the authors propose to contribute to the existing works in the area, as well as to strengthen the range of methodologies for water resources assessment through indices and indicators. Tools such as these enable rapid and accurate evaluation of systems, events, or even regions, usually handling with accessible and user-friendly data. The interpretation of indexes and indicators application results, besides providing a diagnosis of the analyzed phenomenon, also contributes to the decision-making process and helps to guide the studies of multiple alternatives.
In order to contribute to the water stress assessment process, this work also presents a comparative analysis between the original NDI and NDC calculation methodology, which uses daily resolution data, with a new approach that uses monthly resolution data. This approach intends to contribute to the feasibility of this methodology as a practical tool for water resources systems evaluation, consistent with available databases, and thus “more applicable” to the practical problems of hydrological engineering. Monthly-basis data are more easily available, as well as regularly presents greater consistency than daily-basis data.
The Cantareira System ( Figure 1 ), the main water supply system of São Paulo Metropolitan Region (SPMR), is used as the case study for the proposed evaluations.

During the years 2014 and 2015, the state of São Paulo went through a severe period of water crisis, notably affecting the SPMR’s water supply, which raised the alert for the way the state's water resources management policies were structured, and mainly, if they were prepared (or not) for events of that critical nature.
The Cantareira System constitutes an important water-producing system not only in Brazilian national context, but also when one evaluates different water systems worldwide. As the main system that supplies one of the largest metropolitan regions in the world, São Paulo Metropolitan Region (SPMR), with approximately 18 million inhabitants ( PORTO, 2003 PORTO, M. Recursos hídricos e saneamento na Região Metropolitana de São Paulo: um desafio do tamanho da cidade. Brasília: Banco Mundial, 2003. (Série Água Brasil). ), the Cantareira System consists of an equivalent water system, composed by five reservoirs, totaling 982.06 hm3 of active volume ( Table 1 ).
The 2014-2015 crisis provoked the study of several measures and lines of action, all of them aiming an increase in water security of RMSP's main water-producing system. Among the strategic measures studied at the time, the interconnection work of the Jaguari - Atibainha reservoirs stands out. This project, inaugurated in the first half of 2018 (first stage), consists of the water importation from the Paraíba do Sul Basin to the Cantareira System.
The repercussions of this new contribution, within the framework of the Cantareira System water stress, measured by the NDI and NDC, will be later discussed in this paper.
Section 2 presents a literature review on the water stress indices that the authors used in this work. Section 3 presents the data and methodologies used, while Section 4 shows the results obtained for the Cantareira System. Finally, Section 5 presents the final considerations of the paper.
WATER STRESS INDICES
According to Siche et al. (2007) SICHE, R.; AGOSTINHO, F.; ORTEGA, E.; ROMEIRO, A. Índices versus indicadores: precisões conceituais na discussão da sustentabilidade de países. Ambiente & Sociedade, v. 10, n. 2, p. 137-148, 2007. http://dx.doi.org/10.1590/S1414-753X2007000200009.
http://dx.doi.org/10.1590/S1414-753X200...
, the term index is understood as a numerical value that represents the correct interpretation of a system's reality, using, in its calculation, adequate scientific bases and methods. The obtained value can serve as a decision-making tool, usually consisting of a structured set of indicators and variables.
Following the evaluation methodology of “indices of drought”, presented by Keyantash and Dracup (2002) KEYANTASH, J.; DRACUP, J. A. The quantification of drought: an evaluation of drought indices. Bulletin of the American Meteorological Society, v. 83, n. 8, p. 1167-1180, 2002. http://dx.doi.org/10.1175/1520-0477-83.8.1167.
http://dx.doi.org/10.1175/1520-0477-83....
, it is desirable that the representations of systems and hydrological phenomena are made by indices that present an adequate balance between several performance criteria, which evaluate the Robustness of the index (applicability against a wide range of physical conditions) to its Transparency (objective clarity and rationality of the measure). These authors propose a division of the drought indices in three groups, following the definitions of this phenomenon presented by Wilhite (2000) WILHITE, D. A. Drought as a natural hazard: concepts and definitions. In: WILHITE, D. A. Drought: a global assessment. London: Routledge, 2000. p. 3-18. . Although these definitions are intrinsically related, they preserve some main characteristics which differentiate them, as follow: meteorological drought indices, resulting from direct scarcity of precipitation; hydrological drought indices, which are related to reductions in water supply volumes, directly related to natural flows, storage reservoirs and groundwater; and, finally, agricultural drought indices, which refer to insufficient moisture in the soil to replace evapotranspiration losses, that is, the unavailability of water for plant growth.
The Standardized Precipitation Index (SPI) is commonly used for monitoring conditions associated with droughts and excessive rainfall. The SPI was developed by McKee, Doesken and Kleist (1993) MCKEE, T. B.; DOESKEN, N. J.; KLEIST, J. The relationship of drought frequency and duration to time scales. In: CONFERENCE ON APPLIED CLIMATOLOGY, 8., 1993, Anaheim. Proceedings ... Boston: American Meteorological Society, 1993. p. 179-183. and is only based on the monthly precipitation product. The main feature of the SPI is the possibility of use in monitoring both wet and dry conditions at various time scales.
In this same segment, there is also the Palmer Drought Severity Index (PDSI), which measures the cumulative departure of moisture supply through sequential water balances. Although widely used in the North American context, the application of this index has relatively complicated computation, and its empirical character, associated to the fact that it was initially developed for agricultural regions of the United States, limits its applicability to other contexts ( KEYANTASH; DRACUP, 2002 KEYANTASH, J.; DRACUP, J. A. The quantification of drought: an evaluation of drought indices. Bulletin of the American Meteorological Society, v. 83, n. 8, p. 1167-1180, 2002. http://dx.doi.org/10.1175/1520-0477-83.8.1167.
http://dx.doi.org/10.1175/1520-0477-83....
).
Also in the list of meteorological indices, there are the Drought Area Index (DAI), initially developed for the moisture condition evaluation of the Indian monsoon regions, whose (recursive) calculation depends only on precipitation data, just like the SPI, and the result of the index in the previous month ( BHALME; MOOLEY, 1980 BHALME, H. N.; MOOLEY, D. A. Large-scale droughts/floods and monsoon circulation. Monthly Weather Review, v. 108, n. 8, p. 1197-1211, 1980. http://dx.doi.org/10.1175/1520-0493(1980)108<1197:LSDAMC>2.0.CO;2.
http://dx.doi.org/10.1175/1520-0493(198...
). The Rainfall Anomaly Index (RAI), which was developed by Van Rooy (1965 apud KEYANTASH; DRACUP, 2002 KEYANTASH, J.; DRACUP, J. A. The quantification of drought: an evaluation of drought indices. Bulletin of the American Meteorological Society, v. 83, n. 8, p. 1167-1180, 2002. http://dx.doi.org/10.1175/1520-0477-83.8.1167.
http://dx.doi.org/10.1175/1520-0477-83....
), and uses a classification procedure to determine the magnitude of precipitation anomalies. And the Rainfall Deciles, which is based on the division of monthly precipitation into tenths equal parts and evaluation of these quantiles in relation to the median of the historical series ( GIBBS; MAHER, 1967 GIBBS, W. J.; MAHER, J. V. Rainfall deciles as drought indicators. Australian Bureau of Meteorology Bulletin, v. 48, p. 37, 1967. apud ZARGAR et al., 2011 ZARGAR, A.; SADIQ, R.; NASER, B.; KHAN, F. I. A review of drought indices. Environmental Reviews, v. 19, p. 333-349, 2011. http://dx.doi.org/10.1139/a11-013.
http://dx.doi.org/10.1139/a11-013 ...
).
In comparison with other indices that seek to represent meteorological droughts, such as PDSI, DAI, RAI, among others, the SPI presents itself as a highly classified and highly valuable index to estimate the severity of rainfall events ( KEYANTASH; DRACUP, 2002 KEYANTASH, J.; DRACUP, J. A. The quantification of drought: an evaluation of drought indices. Bulletin of the American Meteorological Society, v. 83, n. 8, p. 1167-1180, 2002. http://dx.doi.org/10.1175/1520-0477-83.8.1167.
http://dx.doi.org/10.1175/1520-0477-83....
). This happens mainly because of two features: it is only based on precipitation data, widely available, and it can also probabilistically describe precipitation scarcity events at any desired time scale. For these reasons, even American agencies such as the NDMC (National Drought Mitigation Center) and WRCC (Western Regional Climate Center) support the use of this index, rather than the traditional PDSI.
Derived from SPI, the DM (Drought Magnitude) is an indicator that estimates the magnitude of the drought, considering its persistence and accumulated intensity.
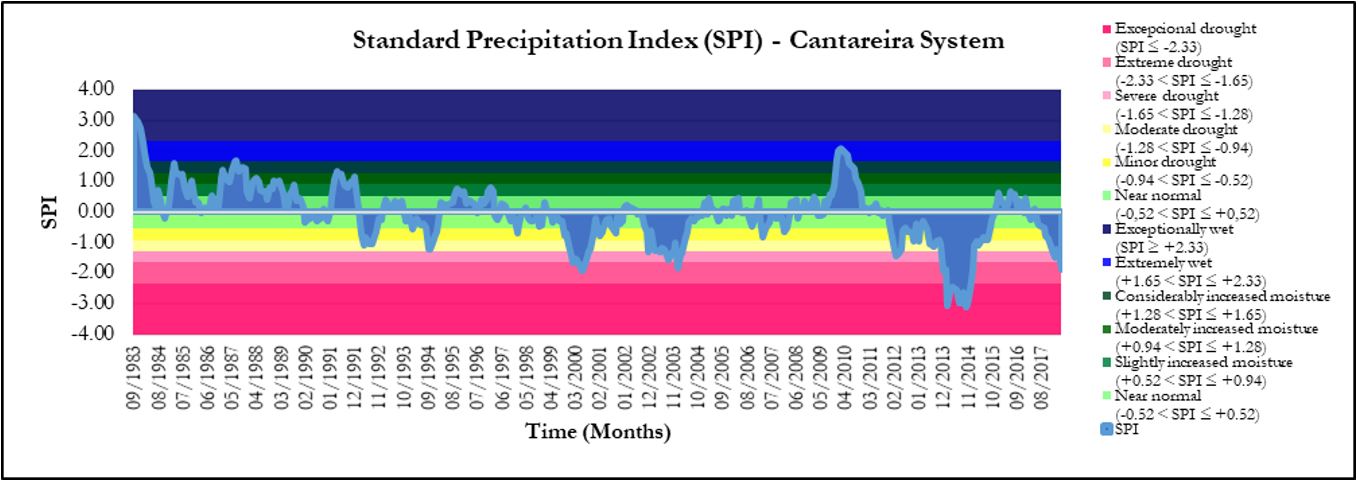
The SPI result is given in thresholds (see legend of Graph 1 ), which technically correspond to the number of standard deviations that the observed precipitation departs from the mean. The thresholds range from the most extreme event in terms of precipitation deficit (SPI ≤ -2.326 - Exceptional Drought) to the most extreme one in terms of excess precipitation (SPI ≥ 2.326 - Exceptionally Wet) ( KRAJINOVIĆ; RADOVANOVIĆ, 2010 KRAJINOVIĆ, Z.; RADOVANOVIĆ, S. Implementation of Standardized Precipitation Index (SPI). Republic Hydrometeorological Service of Serbia, 2010. Report. v. 17. ). The precipitation used in the calculation of SPI can be aggregated in periods of i months. Typically, data entry are the average rainfall of 3, 6, 12, 24 or 48 month periods. Ideally, the SPI calculation should be based on series of at least 30 years of observation data ( MCKEE; DOESKEN; KLEIST, 1993 MCKEE, T. B.; DOESKEN, N. J.; KLEIST, J. The relationship of drought frequency and duration to time scales. In: CONFERENCE ON APPLIED CLIMATOLOGY, 8., 1993, Anaheim. Proceedings ... Boston: American Meteorological Society, 1993. p. 179-183. ).

SPI, i = 12 months - Set for 12-month rainfall averages (moving average) - Cantareira System (September/83 to May/18).
The SPI already has a wide use in studies of extreme events, whether in the national or international scenario.
In the works of Hayes et al. (1999) HAYES, M. J.; SVOBODA, M. D.; WILHITE, D. A.; VANYARKHO, O. V. Monitoring the 1996 drought using the standardized precipitation index. Bulletin of the American Meteorological Society, v. 80, n. 3, p. 429-438, 1999. http://dx.doi.org/10.1175/1520-0477(1999)080<0429:MTDUTS>2.0.CO;2.
http://dx.doi.org/10.1175/1520-0477(199...
, which evaluated the 1996 drought in the south and southwest of the United States, the SPI application has proved to be an important tool for detecting and monitoring these phenomena. Although not yet used at the time of the drought, it was proved that this methodology would have been effective in identifying the progression of the event a few months in advance, thus helping to trigger contingency actions.
At the national level, two works stand up: the analysis of Paraíba state through SPI, conducted by Sousa et al. (2010) SOUSA, F. A. S.; DANTAS, F. R. C.; GUEDES, R. V. S.; MACEDO, M. J. H. Análise do índice padronizado de precipitação para o estado da Paraíba, Brasil. Ambiente & Água: An Interdisciplinary Journal of Applied Sciences , v. 5, n. 1, p. 204-214, 2010. , which identified and evaluated the occurrence of severe and extreme droughts, mainly located in Paraíba's semi-arid region. And the comparative analysis of PDSI, Adapted PDSI and SPI in São Paulo state, by Blain and Brunini (2007) BLAIN, G. C.; BRUNINI, O. Análise comparativa dos índices de seca de palmer, palmer adaptado e índice padronizado de precipitação no estado de São Paulo. Revista Brasileira de Meteorologia, v. 22, n. 1, p. 105-111, 2007. http://dx.doi.org/10.1590/S0102-77862007000100011.
http://dx.doi.org/10.1590/S0102-7786200...
, which emphasized the characteristics of the latter as a versatile, spatially consistent and easily interpreted tool for risk analysis, mitigation and implications of drought events for a wide range of applications.
Differently from the works of Alcamo et al. (2003) ALCAMO, J.; DÖLL, P.; HENRICHS, T.; KASPAR, F.; LEHNER, B.; RÖSCH, T.; SIEBERT, S. Global estimates of water withdrawals and availability under current and future “business-as-usual” conditions. Hydrological Sciences Journal, v. 48, n. 3, p. 339-348, 2003. http://dx.doi.org/10.1623/hysj.48.3.339.45278.
http://dx.doi.org/10.1623/hysj.48.3.339...
and Oki and Kanae (2006) OKI, T.; KANAE, S. Global hydrological cycles and world water resources. Science , v. 313, n. 5790, p. 1068-1072, 2006. http://dx.doi.org/10.1126/science.1128845. PMid:16931749.
http://dx.doi.org/10.1126/science.11288...
, which used estimates related to groundwater and river flow as “supply quantities”, the NDI and NDC use only local precipitation as the renewable source of water (supply), and consider the natural and anthropogenic uses of this water (demand), as a way to determine the dependence level that an area exhibts from both endogenous and exogenous sources to supply its needs ( CHEN et al., 2014 CHEN, X.; NARESH, D.; UPMANU, L.; HAO, Z.; DONG, L.; JU, Q.; WANG, J.; WANG, S. China’s water sustainability in the 21st century: a climate-informed water risk assessment covering multi-sector water demands. Hydrology and Earth System Sciences, v. 18, n. 5, p. 1653-1662, 2014. http://dx.doi.org/10.5194/hess-18-1653-2014.
http://dx.doi.org/10.5194/hess-18-1653-...
). According to the authors, this approach was motivated by the need to separate the spatial competition and the uses of the resource for the purpose of a purelly locally induced stress analisys. Thus, this application highlights the regions and systems that hold high implicit dependence on external sources of water supply.
The NDI and NDC represent the water stress defined through a temporal integration of accumulated deficits, in daily resolution, and can be evaluated at different levels of aggregation: seasonal, annual or throughout the entire observation period.
For an n year period, intra-annual water stress can be evaluated as the maximum accumulated deficit in each year, divided by the annual average rainfall of the accounting unit. The result of this calculation consists of the Normalized Deficit Index (NDI). When the maximum accumulated deficit is computed for the whole series, not considering the segmentation in annual sub-periods, then one obtains the Normalized Deficit Cumulated (NDC) ( DEVINENI; PERVEEN; LALL, 2013 DEVINENI, N.; PERVEEN, S.; LALL, U. Assessing chronic and climate‐induced water risk through spatially distributed cumulative deficit measures: a new picture of water sustainability in India. Water Resources Research, v. 49, n. 4, p. 2135-2145, 2013. http://dx.doi.org/10.1002/wrcr.20184.
http://dx.doi.org/10.1002/wrcr.20184 ...
).
In recent years, the NDI and NDC have been applied to assess water stress at a national scale, especially in the following countries: India ( DEVINENI; PERVEEN; LALL, 2013 DEVINENI, N.; PERVEEN, S.; LALL, U. Assessing chronic and climate‐induced water risk through spatially distributed cumulative deficit measures: a new picture of water sustainability in India. Water Resources Research, v. 49, n. 4, p. 2135-2145, 2013. http://dx.doi.org/10.1002/wrcr.20184.
http://dx.doi.org/10.1002/wrcr.20184 ...
; CHEN et al., 2014 CHEN, X.; NARESH, D.; UPMANU, L.; HAO, Z.; DONG, L.; JU, Q.; WANG, J.; WANG, S. China’s water sustainability in the 21st century: a climate-informed water risk assessment covering multi-sector water demands. Hydrology and Earth System Sciences, v. 18, n. 5, p. 1653-1662, 2014. http://dx.doi.org/10.5194/hess-18-1653-2014.
http://dx.doi.org/10.5194/hess-18-1653-...
) and the United States ( DEVINENI et al., 2015 DEVINENI, N.; LALL, U.; ETIENNE, E.; SHI, D.; XI, C. America’s water risk: current demand and climate variability. Geophysical Research Letters, v. 42, n. 7, p. 2285-2293, 2015. http://dx.doi.org/10.1002/2015GL063487.
http://dx.doi.org/10.1002/2015GL063487 ...
). Generally, in these countries, the authors have verified that the regions of intense agricultural activity, as well as great metropolitan regions, present the most significant values of water stress (NDC> 5).
Still in this context, Wen et al. (2014) WEN, C. H.; WILLIAMS, M.; ECONOMIDES, C.; DOVE, N. San Diego County: assessment of water resources, green infrastructure and utility rates. San Diego: San Diego County Water Authority, Columbia Water Center, 2014. p. 18. also used the NDI and NDC for a drought vulnerability analysis in a major work conducted to evaluate San Diego County water resources, in the United States.
The application of these indices, whether on a national or regional scale, emerges as another important tool that supports strategic decision-making process, concerning water resources management. The interpretation of NDI and NDC results can contribute to the risk analysis process of water allocation projects, investments targeting in water efficient technologies in the agricultural area, and public-private incentives for the occupation of less water-vulnerable regions ( CHEN et al., 2014 CHEN, X.; NARESH, D.; UPMANU, L.; HAO, Z.; DONG, L.; JU, Q.; WANG, J.; WANG, S. China’s water sustainability in the 21st century: a climate-informed water risk assessment covering multi-sector water demands. Hydrology and Earth System Sciences, v. 18, n. 5, p. 1653-1662, 2014. http://dx.doi.org/10.5194/hess-18-1653-2014.
http://dx.doi.org/10.5194/hess-18-1653-...
).
METHODOLOGY
The SPI, DM, NDI and NDC indices presented in this work were calculated in electronic worksheet models.
The period of evaluation of this paper extended from January 1983 to January 2018, totaling 36 years of observations data. For the calculation of the SPI and DM indices, the authors considered the precipitation data of Cantareira System influence area. While for the NDI and NDC indices, historical data of daily and monthly natural flows were used.
All data used in this work were obtained from the “Cantareira System’s Monitoring Data” database ( SABESP, 2018 SABESP – COMPANHIA DE SANEAMENTO BÁSICO DO ESTADO DE SÃO PAULO. Dados de monitoramento do sistema Cantareira. São Paulo: SABESP, 2018. Disponível em: <http://www2.sabesp.com.br/mananciais/dadoscantareira/>. Acesso em: 14 fev. 2018.
http://www2.sabesp.com.br/mananciais/da...
), complemented by the data provided by the Sanitation Company of São Paulo State (SABESP).
According to Mckee, Doesken and Kleist (1993) MCKEE, T. B.; DOESKEN, N. J.; KLEIST, J. The relationship of drought frequency and duration to time scales. In: CONFERENCE ON APPLIED CLIMATOLOGY, 8., 1993, Anaheim. Proceedings ... Boston: American Meteorological Society, 1993. p. 179-183. , the SPI and DM indices are calculated as follows: firstly, the monthly precipitation data is adjusted to a Gamma Function in order to define the relationship between probability and precipitation of the historical series. Once this relationship is defined, the probability of each observed value is calculated and used together with an estimate of the Normal Inverse Function to calculate the precipitation deviation value relative to a Normal Probability Density Distribution, with zero mean and unitary standard-deviation. The equations used in this methodology are presented below. The authors followed the step-by-step procedure presented by Naresh Kumar et al. (2009) NARESH KUMAR, M.; MURTHY, C. S.; SESHA SAI, M. V. R.; ROY, P. S. On the use of Standardized Precipitation Index (SPI) for drought intensity assessment. Meteorological Applications , v. 16, n. 3, p. 381-389, 2009. http://dx.doi.org/10.1002/met.136.
http://dx.doi.org/10.1002/met.136 ...
:
-
1
Conversion of precipitation to lognormal values. Calculation of scale (α) and form (β) parameters of Gamma Distribution:
-
2
Calculation of observed events accumulated probabilities.
Since the Gamma Function is undefined for x = 0 and a precipitation distribution may contain values equal to zero, the cumulative probability becomes:
where q is the probability of occurrence of values equal to zero.
-
3
Transformation of the cumulative probability H (x) in the standard normal random variable Z, with mean equal to zero and variance of one.
where, c0 = 2.515517; c1 = 0.802583; c2 = 0.010328; d 1 = 1.432788; d2 = 0.189269; d3 = 0.001308.
where, j begins in the first month of drought and continues until the end of this drought (x), for any time scale i. The DM has units of months and is numerically equivalent to drought duration, if each month of this drought has SPI = -1.0 ( MCKEE; DOESKEN; KLEIST, 1993 MCKEE, T. B.; DOESKEN, N. J.; KLEIST, J. The relationship of drought frequency and duration to time scales. In: CONFERENCE ON APPLIED CLIMATOLOGY, 8., 1993, Anaheim. Proceedings ... Boston: American Meteorological Society, 1993. p. 179-183. ).
The calculation of NDI and NDC indices followed the methodology presented by Devineni, Perveen and Lall (2013) DEVINENI, N.; PERVEEN, S.; LALL, U. Assessing chronic and climate‐induced water risk through spatially distributed cumulative deficit measures: a new picture of water sustainability in India. Water Resources Research, v. 49, n. 4, p. 2135-2145, 2013. http://dx.doi.org/10.1002/wrcr.20184.
http://dx.doi.org/10.1002/wrcr.20184 ...
. The equations used for this procedure are shown below:
where, .
where, .
where, Dj,t = Demand (volume); Sj,t = Supply (volume); SII = Stress Index Intra-Annual; SIC = Stress Index Cumulative; and APj = Average Annual Precipitation (volume); j refers to the geographical accounting unit; t to the step of time (daily); and y to each evaluation subperiod (calendar-year).
As previously reported, SPI and DM calculations rely only on precipitation data from a given location, while for NDI and NDC, in addition to the available water volume data in the system (supply), it is also necessary to consider the demands of consumption (public supply, agriculture, industry, etc.), which must be abstracted from the evaluated system.
In contrast to the original work of Devineni, Perveen and Lall (2013) DEVINENI, N.; PERVEEN, S.; LALL, U. Assessing chronic and climate‐induced water risk through spatially distributed cumulative deficit measures: a new picture of water sustainability in India. Water Resources Research, v. 49, n. 4, p. 2135-2145, 2013. http://dx.doi.org/10.1002/wrcr.20184.
http://dx.doi.org/10.1002/wrcr.20184 ...
, which multiplied the volumes generated by incident precipitation by a transformation coefficient, differentiating only cultivated areas (0.7) and non-cultivated areas (0.3), the present work directly used Cantareira System natural inflows to obtain the volumes of endogenous water supply.
Considering that the present work directly evaluates a water-producing system, the approach described above was possible due to the availability of Cantareira System natural inflows data, which represent more accurately the quantities of supply (for large areas) than the multiplication of rainfall by a transformation coefficient, similar to the Runoff Coefficient, commonly applied in the Rational Method.
The average annual rainfall volume (APj) was obtained by multiplying average precipitation by the Cantareira System's drainage area. The latter value was the sum of the “individual” drainage areas of each dam part of the system ( Table 2 ):
Also within the scope of NDI and NDC, demand volumes were determined based on Cantareira System's operating criteria, which were established in ANA / DAEE Joint Resolution No. 925, from May 29, 2017. The authors chose to use seasonal demands, which varied according to the hydrological period of the year: Dry (June - November) or Wet (December - May).
In daily water balance calculation, the authors considered the required discharges in two Cantareira System “key points” as demands: Santa Inês Elevation Station (ESI) and the sum of Downstream Discharges of the Jaguari-Jacareí, Cachoeira, Atibainha and Paiva Castro Dams (PCJ + PC) ( Table 3 ).
It should be noted that a scenario of maximum required demand, with “limiting withdrawals” was used, considering that the present paper aimed to evaluate the system response to a maximum water stress condition, and thus, its sensitivity to the results demonstrated by the water stress indices, hereby studied.
Specifically, for the demand at the “PCJ + PC” point, the value of 2.86 m 3/s was obtained from average daily downstream discharges, at Cantareira System's Dams, during the wet period, from 2000 to 2017. For the dry season, the demand of 10.10 m3 /s was obtained from the sum of the “water bank” required discharge (10.00 m 3/s), related to the PCJ basins, and the required natural flow, downstream Paiva Castro Dam (0.10 m3/s).
In the analysis of the Jaguari-Atibainha interconnection project impact, the average discharge rate of 5.13 m3/s was used as an additional source of supply, resulting from the regulated average annual volume (162 hm3/year), according to DAEE Ordinance No 4.563, of December 11, 2017.
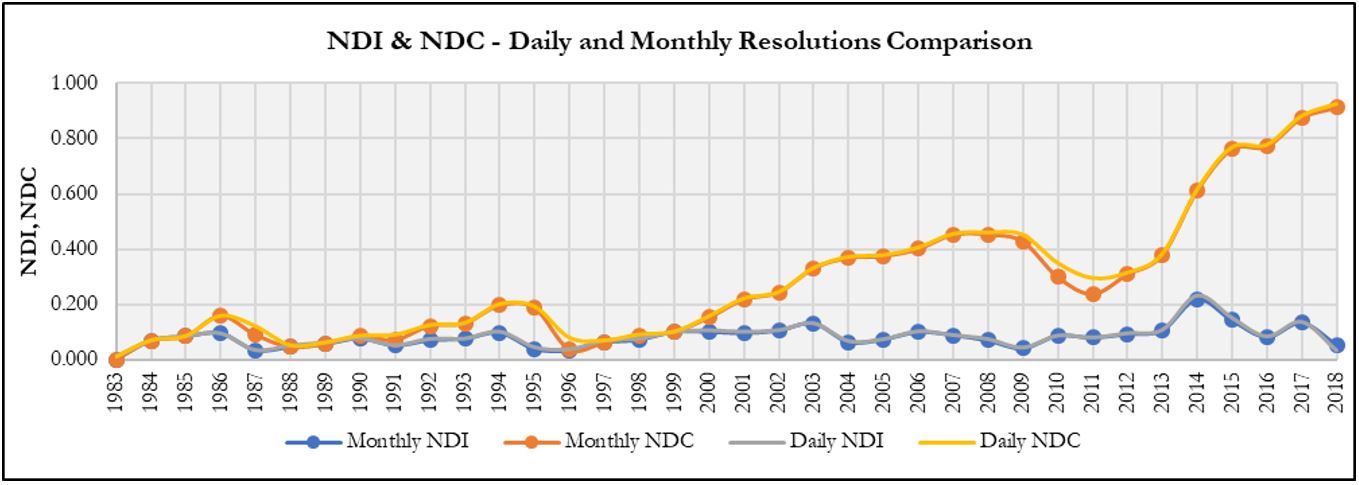
The evaluation of the use of monthly, rather than daily scales in the calculation of NDI and NDC was performed through a comparative approach, considering the same period of evaluation (1983-2018), for which daily and monthly natural flows data were available.
RESULTS AND DISCUSSION
Firstly, it will be presented the accumulated absolute deficits monitoring over the 36-year observation period ( Graph 2 ). Following, the results of SPI and DM ( Graphs 1 and 3 ) are presented, which aimed to characterize the pluviometric regime of the region during the study period, and thus, support the analysis that will be presented later on the NDI and NDC results for the Cantareira System ( Graphs 4 and 5 ). After, the results of the comparison between the NDI and NDC computed in daily and monthly resolutions are presented ( Graphs 6 and 7 ). Finally, the authors show the results for the Cantareira System that came from the Jaguari-Atibainha interconnection project.

Main axis: Cantareira System's Cumulated Deficits. Secondary axis: Supply and Demand Volumes (monthly totals). Follow-up carried out from September/83 to May/18.

DM, i = 12 months - Set for 12-month rainfall averages (moving average) - Cantareira System (September/83 to May/18).


Concomitant follow-up of NDC (monthly aggregated) and SPI (12-month moving average) for the Cantareira System, from 1983 to 2018.


Cantareira system’s water stress
As shown above, before presenting the NDI and NDC results, Graph 2 shows the monitoring of accumulated deficits for the study period (main axis). In this same graph (secondary axis) it is also displayed, in an accumulated monthly basis, Cantareira System's inflow (supply) and outflow volumes (demand). It is evident that from the year 2000 onwards, despite an attenuated period between 2009 and 2011, the growth trend of the system's deficits began to occur more intensely, with a greater gradient, considering both the volume and duration magnitude of the event. This event lasts until the middle 2018's. During this period, in May 2018, the maximum accumulated monthly deficit was observed, which exceeded the volume of 3,410.00 hm3.
In this 36-year observation period, one may verify that the Cantareira System, when only considered its endogenous supply capacity, presents an average resilience of 6.4 months. Which means that when, in a given month, the system is not able to supply its demands, on average, it takes approximately 6 months to recover and, thus, to properly meet the demands at the consumption points ( SANDOVAL-SOLIS; MCKINNEY; LOUCKS, 2011 SANDOVAL-SOLIS, S.; MCKINNEY, D. C.; LOUCKS, D. P. Sustainability index for water resources planning and management. Journal of Water Resources Planning and Management , v. 137, n. 5, p. 381-390, 2011. http://dx.doi.org/10.1061/(ASCE)WR.1943-5452.0000134.
http://dx.doi.org/10.1061/(ASCE)WR.1943...
). This result is consistent with the region’s seasonal hydrological cycles, during which one can observe the alternation of dry periods, characterized by an inherent inability to supply demands in an endogenous manner; and wet periods, in which a full possibility of attendance and an urgent need for reserving water for subsequent dry periods may be expected.
On the other hand, when one observes the worst period of consecutive failures, which consists of the resilience concept given by Moy, Cohon and Revelle (1986) MOY, W. S.; COHON, J. L.; REVELLE, C. S. A programming model for analysis of the reliability, resilience, and vulnerability of a water supply reservoir. Water Resources Research , v. 22, n. 4, p. 489-498, 1986. http://dx.doi.org/10.1029/WR022i004p00489.
http://dx.doi.org/10.1029/WR022i004p004...
, the system is characterized by a resilience of 21 months, given by the critical period of May/2013 to January/2015.
Unlike the first approach, which brings valuable information to the short-medium-term tactical-operational management of a region's water resources, resilience, according to the concept of Moy, Cohon and Revelle (1986) MOY, W. S.; COHON, J. L.; REVELLE, C. S. A programming model for analysis of the reliability, resilience, and vulnerability of a water supply reservoir. Water Resources Research , v. 22, n. 4, p. 489-498, 1986. http://dx.doi.org/10.1029/WR022i004p00489.
http://dx.doi.org/10.1029/WR022i004p004...
, has great value for the management strategic planning, since it presents a condition of maximum stress, that is, a limit scenario for which the system must be structured to reliably support critical rainfall events. In addition, both results of resilience, average or maximum, help to jointly compose the framework of information that subsidizes the analysis of management alternatives that will be later addressed in this paper.
As will be seen in the indices analysis below, the water crisis experienced by São Paulo Metropolitan Region (RMSP) is clearly defined when the accumulated deficit behavior is verified as of the year 2011. From this milestone onwards, it is well known that low rainfall levels, significantly below regional historical averages, intensify the imbalance between supply and demand within the Cantareira System. This fact is clearly demonstrated when assessing the SPI behavior in the period, using annual moving averages (i = 12 months) ( Graph 1 ). From the mid-2011 on, rainfall behavior in the region began to figure below historical averages, starting from the Minor Drought range and culminating in the Exceptional Drought limit in 2014; the peak of the water crisis in São Paulo state. This event is also verified in Graph 3 , when the Drought Magnitude (DM) hits its peak in the period, caused by the persistence of rainfall depths significantly lower than historical averages. In August 2015, the DM value (12 months) reaches the peak of 49.7 months of accumulated persistence and intensity. Only from this month onwards, precipitation begins to occur within an Approximately Normal range.
Following the application of the methodology proposed by Devineni, Perveen and Lall (2013) DEVINENI, N.; PERVEEN, S.; LALL, U. Assessing chronic and climate‐induced water risk through spatially distributed cumulative deficit measures: a new picture of water sustainability in India. Water Resources Research, v. 49, n. 4, p. 2135-2145, 2013. http://dx.doi.org/10.1002/wrcr.20184.
http://dx.doi.org/10.1002/wrcr.20184 ...
, the NDI and NDC values were calculated from the accumulated maximum deficits presented in Graph 2 . This application results are presented in Graph 4 .
The NDImax (worst annual daily deficit) of 0.24 was registered in 2014, coinciding with the year in which the lowest SPI values were observed. This value results from a maximum daily deficit (intra-annual) of 887.32 hm3. From the point of view of the event's theoretical frequency, this deficit has a 2.7% probability of equality or exceedance, if one does not consider consecutive-year droughts. The average NDI in the period was 0.10.
The maximum cumulative deficit for the whole series, divided by the average annual precipitation volume, resulted in a NDC of 0.93, which was observed in the current year of 2018. This year, the calculation of the Cantareira System’s water balance resulted in a cumulative maximum daily deficit of 3411.44 hm3. Since both indices, NDI max and NDC, are below 1.0; it is noticed that the water storage required to supply the deficits between supply and demand is inferior to the average annual rainfall of Cantareira System’s region ( DEVINENI; PERVEEN; LALL, 2013 DEVINENI, N.; PERVEEN, S.; LALL, U. Assessing chronic and climate‐induced water risk through spatially distributed cumulative deficit measures: a new picture of water sustainability in India. Water Resources Research, v. 49, n. 4, p. 2135-2145, 2013. http://dx.doi.org/10.1002/wrcr.20184.
http://dx.doi.org/10.1002/wrcr.20184 ...
; CHEN et al., 2014 CHEN, X.; NARESH, D.; UPMANU, L.; HAO, Z.; DONG, L.; JU, Q.; WANG, J.; WANG, S. China’s water sustainability in the 21st century: a climate-informed water risk assessment covering multi-sector water demands. Hydrology and Earth System Sciences, v. 18, n. 5, p. 1653-1662, 2014. http://dx.doi.org/10.5194/hess-18-1653-2014.
http://dx.doi.org/10.5194/hess-18-1653-...
; DEVINENI et al., 2015 DEVINENI, N.; LALL, U.; ETIENNE, E.; SHI, D.; XI, C. America’s water risk: current demand and climate variability. Geophysical Research Letters, v. 42, n. 7, p. 2285-2293, 2015. http://dx.doi.org/10.1002/2015GL063487.
http://dx.doi.org/10.1002/2015GL063487 ...
). According to Chen et al. (2014) CHEN, X.; NARESH, D.; UPMANU, L.; HAO, Z.; DONG, L.; JU, Q.; WANG, J.; WANG, S. China’s water sustainability in the 21st century: a climate-informed water risk assessment covering multi-sector water demands. Hydrology and Earth System Sciences, v. 18, n. 5, p. 1653-1662, 2014. http://dx.doi.org/10.5194/hess-18-1653-2014.
http://dx.doi.org/10.5194/hess-18-1653-...
, in these cases the authors indicate that the evaluated region or system is subject to hydric stress of moderate magnitude, as well as a moderate need of flow regulation systems.
For the Cantareira System, the period with the worst drought of consecutive years (NDC = 0.93) represents around 4 times the value of NDImax (0.24), that is, the sum of the water stress observed in the system is associated with approximately 4 consecutive years of deficits in demand attendance. When one observes that the NDC result is greater than that of NDI max, it has been shown that the system under study presents greater susceptibility to water stress events of sequential years, that is, multi-year scale, and not to events restricted to a specific year of the series. In these cases, strategies for reducing water demands in consumption points may be particularly important in mitigating the pressure on the water-producing system.
The NDC monitoring over time makes it possible to verify that the severe water crisis of the years 2014 and 2015 that affected the RMSP was part of a long process of pressure on the Cantareira System, which began in the early 2000’s. At this point, the NDI and NDC curves started to detach ( Graph 4 ): the water balance deficits assumed an increasing behavior that culminated in the use of the Cantareira System's technical reserve in mid-2014, which has lasted for consecutive months, making it the worst water crisis ever experienced in the region. The above-average rainfall between 2009 and 2011, although contributing to a reduction in the growth of accumulated deficits, was not enough to equalize the regional water imbalance between supply and demand, once the subsequent years suffered from low precipitation rates, as discussed previously. During the apex of the 2014-2015 water crisis, extreme management measures were necessary to accordingly maintain São Paulo Metropolitan Region water supply.
Graph 5 shows the SPI and NDC follow-up from 1983 to 2018. In contrast to Graph 4 , NDC is aggregated in an alternative way, demonstrated by normalized maximum deficits in each month, not annually, as the original methodology of Devineni, Perveen and Lall (2013) DEVINENI, N.; PERVEEN, S.; LALL, U. Assessing chronic and climate‐induced water risk through spatially distributed cumulative deficit measures: a new picture of water sustainability in India. Water Resources Research, v. 49, n. 4, p. 2135-2145, 2013. http://dx.doi.org/10.1002/wrcr.20184.
http://dx.doi.org/10.1002/wrcr.20184 ...
indicates. It is evident that the water stress periods observed in Cantareira System's region were due to consecutive observations of rainfall significantly below historical averages. Notably from the year 2000 onwards.
Thus, one can verify that the use of SPI and DM indices contributed indeed to support the Cantareira System evaluation through the NDI and NDC.
According to Devineni et al. (2015) DEVINENI, N.; LALL, U.; ETIENNE, E.; SHI, D.; XI, C. America’s water risk: current demand and climate variability. Geophysical Research Letters, v. 42, n. 7, p. 2285-2293, 2015. http://dx.doi.org/10.1002/2015GL063487.
http://dx.doi.org/10.1002/2015GL063487 ...
, systems subject to the above condition may resort to large storages (reservoirs) or water transfers (imports) from other sources/systems, where feasible, as effective options to equalize the imbalance between required demand and water supply from endogenous sources (rainfall).
As shown in Graph 5 , the NDC behavior throughout the studied series shows that the system’s water balance deficits may be attenuated by precipitations that occur seasonally in the wet periods, from December to May, as occurred cyclically in general, from 1983 to 2000. However, consecutive periods of below-average precipitation tend to have significant impacts on the system behavior. This fact is clearly verified by the sharp detachment in NDI and NDC curves that occurs from the year 2000 onwards. In these detachment sections, the volume of precipitated water in Cantareira System's influence area is not able to supply the required demands in the intra-annual cycle, thus configuring water stress events of consecutive periods. From this point of view, it is clear that the Cantareira System is a water-producing system able to regulate the discharges of an approximately annual period, since, when the precipitations in its influence area do not occur minimally close to the historical averages (Moderately Humid - Moderately Dry), the NDC accuses the occurrence of water stress events, due to the growing imbalance between (endogenous) supply and demand. In addition to the period that begins from the year 2000, with a marked detachment of NDI and NDC curves, these imbalances can also be observed, more smoothly, between 1985 to 1987 and 1993 to 1996
Daily and monthly basis comparison in the calculation of NDI and NDC
In this second part of the work results, the authors demonstrate a proposed comparison between the original methodology of the NDI and NDC calculation, which uses a daily resolution time step, and a new approach that employs the calculations on a monthly basis, which may figure as a more consistent approach according to the availability of the vast majority of hydrological data.
In Graph 6 , below, it is possible to observe the follow-up of the indices in the monthly and daily basis, for the same evaluation period modeled previously: 1983 to 2018. Despite the fact that there is less discretization in the calculation of the indices, since monthly average values tend to attenuate the differences between supply and demand, the monthly-computed NDI and NDC can adequately represent the general behavior of the normalized deficits of the system.
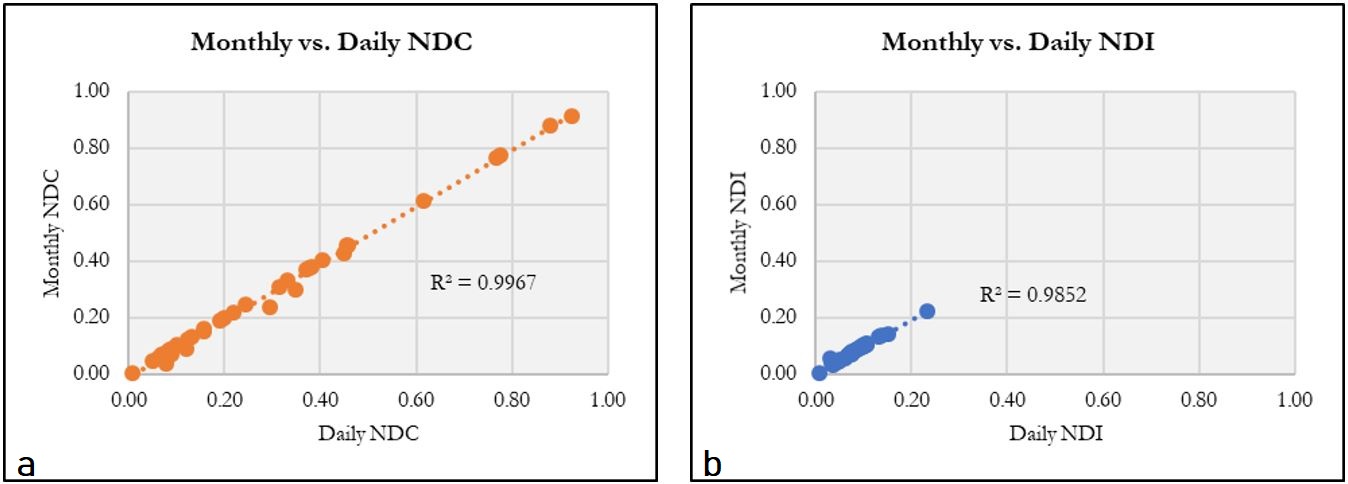
Also, as a way of validating the presented comparison, for the NDC and NDI, respectively, the monthly and daily series plotting results in R2 values of 0.9967 and 0.9852. The similarity of the statistical variables also corroborates this positive evaluation. The comparison of these variables is shown in Table 4 .
Water imports and the impacts on NDI and NDC
As shown in the results of the Cantareira System evaluation through the application of NDI and NDC water stress indices, one may observe that the main cause of the water crisis experienced by the system refers to the successive imbalance between water supply and demand. This process, which was caused directly by the low incident precipitations in the catchment area of the system, especially since the year 2000, resulted in reduced available water volumes to supply Cantareira's water demands. In this sense, the present work also demonstrates, through the NDI and NDC, the possible water stress attenuation process generated by the addition of supplementary inflows to the Cantareira System, in this case, considering the Jaguari-Atibainha Interconnection, resulted from the Paraíba do Sul Basin transfer.
In Graph 8 , one can observe that in the same simulation period (from 1983 to 2018), the 5.13 m3 /s increase in monthly average contribution is able to reduce by approximately 50% the system's normalized cumulative deficit in 2018, which goes from 0.91 (already calculated on the monthly basis) to 0.45. The NDI and NDC graphs remain overlapped during the initial 30 years of the series (1983-2013), showing an adequate balance between supply and demand in the period. Starting in 2014, as expected, it is noticeable the detachment of both curves, marking the beginning of the multi-year critical event, caused by a series of rainfall indices significantly below regional historical averages. However, unlike the scenario initially modeled without the interconnection, when considering the Paraíba do Sul Basin transfer, the water stress magnitude at the end of the period is reduced by half, thus denoting the positive impact, at least from a water supply perspective, which this measure brings to the Cantareira System.

NDI and NDC considering the supplementary inflows provided by the Jaguari-Atibainha interconnection, on a monthly basis (1983-2018).
The application of indices and the water resource strategic management
By applying the NDI and NDC, it is possible to identify regions that are more vulnerable to water stress, because of either their intrinsic characteristics or the occupancy and consumption pressures they are subjected to. The results of this application, therefore, have the capacity to guide the definition of action measures that seek to mitigate, or even prevent, the occurrence of critical availability scenarios.
Within Cantareira System, the integration of reservoirs components of the system in order to constitute a single equivalent, robust and integrated water-producing system, in addition to the most recent Jaguari - Atibainha interconnection, which is an import of water from the Paraíba do Sul Basin, corroborate the results interpretation also presented in the works of Devineni, Perveen and Lall (2013) DEVINENI, N.; PERVEEN, S.; LALL, U. Assessing chronic and climate‐induced water risk through spatially distributed cumulative deficit measures: a new picture of water sustainability in India. Water Resources Research, v. 49, n. 4, p. 2135-2145, 2013. http://dx.doi.org/10.1002/wrcr.20184.
http://dx.doi.org/10.1002/wrcr.20184 ...
.
It should also be pointed out that other management measures not evaluated in this work, such as the definition of operating rules, observed in the current Cantareira System water granting, as well as the demands management, also tend to contribute in an efficient way to the pressure reduction on water-producing systems in large metropolitan regions.
Similar cases of this evaluation are observed in important metropolitan areas such as Washington D.C. and New York, where the work of Devineni et al. (2015) DEVINENI, N.; LALL, U.; ETIENNE, E.; SHI, D.; XI, C. America’s water risk: current demand and climate variability. Geophysical Research Letters, v. 42, n. 7, p. 2285-2293, 2015. http://dx.doi.org/10.1002/2015GL063487.
http://dx.doi.org/10.1002/2015GL063487 ...
, also using the NDI and NDC indices, exposed potential supply problems caused by sequential deficits in the water balance and the dependence of these areas on external water transfers.
As in the cases of these cities, one can observe that, for the Cantareira System and, consequently, for the São Paulo Metropolitan Region, droughts of sequential periods emerge as a more important concern, from the strategic management point of view, than the imbalances between supply and demand relative to short (monthly) periods, restricted to the annual cycle.
In this line, water managers may realize that decisions regarding regional water management should not be based on isolated “momentary portraits” and operational variables only, but also on a medium-long-term vision that considers the inherent characteristics of each region, and the implementation of structural measures that guarantee the increase of the water security of its water-producing systems and reduction of the vulnerability to critical climatic events.
FINAL CONSIDERATIONS
The diagnosis of a water system and its influence area; in this work exemplified by the Cantareira System; based on the application of water stress indices, allows a strategic assessment of solutions to be adopted within the framework of regional water supply infrastructures.
In this paper, the NDI and NDC water stress indices were calculated for the Cantareira System from September/1983 to May/2018. Using the same range of observed data, the SPI and DM indices were also calculated as a way to complement the assessment of the system's water risk.
Considering the fact that in the NDI and NDC calculation, the water supply from river flow, abstraction of groundwater, storage, etc. is not taken into account ( DEVINENI; PERVEEN; LALL, 2013 DEVINENI, N.; PERVEEN, S.; LALL, U. Assessing chronic and climate‐induced water risk through spatially distributed cumulative deficit measures: a new picture of water sustainability in India. Water Resources Research, v. 49, n. 4, p. 2135-2145, 2013. http://dx.doi.org/10.1002/wrcr.20184.
http://dx.doi.org/10.1002/wrcr.20184 ...
), the proposed analysis is accurate in demonstrating the water stress to which a given hydrological region is subject to, considering only its endogenous sources of supply, and also in pointing out possible management alternatives, such as water transfer from other basins or even the construction of large reservoirs.
In this sense, the presented approach provides a contribution to any region's water resources management framework, as it enables technical assessment and potentially ratifies specific choices related to the management of regional water resources, thus favoring the seek for conciliation among the various stakeholders' interests that compose this complex framework.
The diagnosis of a water-producing system, or even of a particular country, region or district, as presented in the works of Devineni, Perveen and Lall (2013) DEVINENI, N.; PERVEEN, S.; LALL, U. Assessing chronic and climate‐induced water risk through spatially distributed cumulative deficit measures: a new picture of water sustainability in India. Water Resources Research, v. 49, n. 4, p. 2135-2145, 2013. http://dx.doi.org/10.1002/wrcr.20184.
http://dx.doi.org/10.1002/wrcr.20184 ...
, Chen et al. (2014) CHEN, X.; NARESH, D.; UPMANU, L.; HAO, Z.; DONG, L.; JU, Q.; WANG, J.; WANG, S. China’s water sustainability in the 21st century: a climate-informed water risk assessment covering multi-sector water demands. Hydrology and Earth System Sciences, v. 18, n. 5, p. 1653-1662, 2014. http://dx.doi.org/10.5194/hess-18-1653-2014.
http://dx.doi.org/10.5194/hess-18-1653-...
and Devineni et al. (2015) DEVINENI, N.; LALL, U.; ETIENNE, E.; SHI, D.; XI, C. America’s water risk: current demand and climate variability. Geophysical Research Letters, v. 42, n. 7, p. 2285-2293, 2015. http://dx.doi.org/10.1002/2015GL063487.
http://dx.doi.org/10.1002/2015GL063487 ...
, through indices that reflect water risk, besides helping to make strategic management decisions, also contributes to a better understanding of extreme events, such as droughts and floods, that may occur locally or regionally.
When evaluating the behavior of both indices along the time series, the manager can observe the periods in which a region or system will be subject to multiyear drought events, as in these cases, it becomes noticeable the detachment of the NDI and NDC curves. From this analysis, one can identify, for instance, key points in which a given system has entered a critical climatic event. The joint evaluation with other tools and indices can also show good indications of the behavior tendency of these systems over time, possibly contributing to the activation of certain management triggers and/or contingency plans, even if this approach does not pretend to be featured as a predictive tool.
It is also worth mentioning the strong interest that the current studies in the area demonstrate in assessing the sensitivity of water resources systems to climatic variations and their consequences ( DEVINENI; PERVEEN; LALL, 2013 DEVINENI, N.; PERVEEN, S.; LALL, U. Assessing chronic and climate‐induced water risk through spatially distributed cumulative deficit measures: a new picture of water sustainability in India. Water Resources Research, v. 49, n. 4, p. 2135-2145, 2013. http://dx.doi.org/10.1002/wrcr.20184.
http://dx.doi.org/10.1002/wrcr.20184 ...
). The potential climatic risks associated with water supply, whether for the agricultural sector (main consumer), industrial, or even for large urban conglomerates, can be adequately measured and evaluated according to the presented methodology. As for historical series, predicted precipitation series resulted from climate change models may also be evaluated and, thus, prognosis of possible pressure on water-producing systems may be obtained from the application of NDI, NDC, SPI and DM indices.
As mentioned previously, the authors reinforce that the methodology presented in this paper significantly enhances the group of tools aimed to support the decision-making process. This methodology is mainly applicable to scenarios which require the evaluation of multiple alternatives in the management of regional water resources. The application of the indices herein presented consolidates an important strategic value, considering the fact that it allows the decision maker to evaluate, in how many scenarios it is required, to what levels of stress a region or water-producing system presents in response to chosen input (supply) and output (demand) conditions. Such conditions may, for instance, simulate the behavior of a water-producing system subject to changes in water use patterns, demand variations, new inputs, among others.
Finally, one may observe that the present methodology adds knowledge to the current methods related to water resources management as it presents and attests the applicability of a practical tool to evaluate water stress of water-producing systems. The resulting diagnosis from this application translates into the characteristic water stress of a given system, considering only its endogenous sources of supplying its water demands.
In this sense, unlike the original approach of Devineni, Perveen and Lall (2013) DEVINENI, N.; PERVEEN, S.; LALL, U. Assessing chronic and climate‐induced water risk through spatially distributed cumulative deficit measures: a new picture of water sustainability in India. Water Resources Research, v. 49, n. 4, p. 2135-2145, 2013. http://dx.doi.org/10.1002/wrcr.20184.
http://dx.doi.org/10.1002/wrcr.20184 ...
, applied to macro-regions and national scales, the authors of this work sought to regionalize the water resources evaluation to smaller management units, in order to propose a different approach which, in turn, intends to accurately diagnose the inherent hydrological characteristics of a region and, thus, propose better planning and management regional strategies. The incorporation of other indicators such as SPI and DM, which support the analysis of NDI and NDC behavior, helps to solidify the proposed approach, since they are effective in contextualizing the hydrological scenario in which a region or a given system is located.
In the Cantareira System evaluation, although the low precipitations observed in 2014-2015 were probably the main crisis trigger, one should not attribute the SPMR complex water crisis to a single factor. The association of other conditions, such as the restricted water availability inherent to the region ( ANA, 2017a ANA – AGÊNCIA NACIONAL DE ÁGUAS. Conjuntura dos recursos hídricos no Brasil: relatório pleno. Brasília: ANA, 2017a. ), and the high water demands, due to the high population density, definitely contributed to this critical event deflagration.
In the same way that causes are not restricted to a single factor, it is not correct to imagine that solutions are either. As presented by ANA (2017a) ANA – AGÊNCIA NACIONAL DE ÁGUAS. Conjuntura dos recursos hídricos no Brasil: relatório pleno. Brasília: ANA, 2017a. , solutions for crisis management and incremental water security must consider structured actions that synergistically integrate factors such as demand management, implementation of structuring solutions, definition of use priorities, negotiation of water allocation, operation rules and procedures.
Through indices that reflect water stress, this paper sought to systematize already existing tools with the purpose of consolidating a methodology for water-strategic risk assessment of water-producing systems.
ACKNOWLEDGEMENTS
To the other members of the technical teams of SABESP and LabSid-USP, who gave valuable contributions to the discussions that enriched and supported the development of this paper.
REFERENCES
- ANA – AGÊNCIA NACIONAL DE ÁGUAS. Departamento de Águas e Energia Elétrica – DAEE. Dados de referência acerca da outorga do sistema Cantareira Brasília: ANA, 2016. p. 135.
- ANA – AGÊNCIA NACIONAL DE ÁGUAS. Conjuntura dos recursos hídricos no Brasil: relatório pleno. Brasília: ANA, 2017a.
- ANA – AGÊNCIA NACIONAL DE ÁGUAS. Departamento de Águas e Energia Elétrica – DAEE. Resolução Conjunta ANA/DAEE nº 925, de 29 de maio de 2017. Diário Oficial [da] República Federativa do Brasil, Brasília, DF, 30 maio 2017b. p. 7.
- ALCAMO, J.; DÖLL, P.; HENRICHS, T.; KASPAR, F.; LEHNER, B.; RÖSCH, T.; SIEBERT, S. Global estimates of water withdrawals and availability under current and future “business-as-usual” conditions. Hydrological Sciences Journal, v. 48, n. 3, p. 339-348, 2003. http://dx.doi.org/10.1623/hysj.48.3.339.45278.
» http://dx.doi.org/10.1623/hysj.48.3.339.45278 - ALVES, J. M. B.; CAMPOS, J. N. B.; VIEIRA, V. P. B. Analysis of sustainability agro-hydrometeorology in the state of the Ceará. Revista Brasileira de Meteorologia , v. 23, n. 1, p. 103-114, 2008. http://dx.doi.org/10.1590/S0102-77862008000100010.
» http://dx.doi.org/10.1590/S0102-77862008000100010 - BHALME, H. N.; MOOLEY, D. A. Large-scale droughts/floods and monsoon circulation. Monthly Weather Review, v. 108, n. 8, p. 1197-1211, 1980. http://dx.doi.org/10.1175/1520-0493(1980)108<1197:LSDAMC>2.0.CO;2.
» http://dx.doi.org/10.1175/1520-0493(1980)108<1197:LSDAMC>2.0.CO;2 - BLAIN, G. C.; BRUNINI, O. Análise comparativa dos índices de seca de palmer, palmer adaptado e índice padronizado de precipitação no estado de São Paulo. Revista Brasileira de Meteorologia, v. 22, n. 1, p. 105-111, 2007. http://dx.doi.org/10.1590/S0102-77862007000100011.
» http://dx.doi.org/10.1590/S0102-77862007000100011 - BROWN, A.; MATLOCK, M. D. A review of water scarcity indices and methodologies . Arkansas: The Sustainability Consortium, 2011. v. 106, p. 21.
- CHEN, X.; NARESH, D.; UPMANU, L.; HAO, Z.; DONG, L.; JU, Q.; WANG, J.; WANG, S. China’s water sustainability in the 21st century: a climate-informed water risk assessment covering multi-sector water demands. Hydrology and Earth System Sciences, v. 18, n. 5, p. 1653-1662, 2014. http://dx.doi.org/10.5194/hess-18-1653-2014.
» http://dx.doi.org/10.5194/hess-18-1653-2014 - DEVINENI, N.; LALL, U.; ETIENNE, E.; SHI, D.; XI, C. America’s water risk: current demand and climate variability. Geophysical Research Letters, v. 42, n. 7, p. 2285-2293, 2015. http://dx.doi.org/10.1002/2015GL063487.
» http://dx.doi.org/10.1002/2015GL063487 - DEVINENI, N.; PERVEEN, S.; LALL, U. Assessing chronic and climate‐induced water risk through spatially distributed cumulative deficit measures: a new picture of water sustainability in India. Water Resources Research, v. 49, n. 4, p. 2135-2145, 2013. http://dx.doi.org/10.1002/wrcr.20184.
» http://dx.doi.org/10.1002/wrcr.20184 - FERNANDES, D. S.; HEINEMANN, A. B.; PAZ, R. L. F.; AMORIM, A. O. Desempenho de índices quantitativos de seca na estimativa da produtividade de arroz de terras altas. Pesquisa Agropecuária Brasileira, v. 45, n. 8, p. 771-779, 2010. http://dx.doi.org/10.1590/S0100-204X2010000800001.
» http://dx.doi.org/10.1590/S0100-204X2010000800001 - GIBBS, W. J.; MAHER, J. V. Rainfall deciles as drought indicators. Australian Bureau of Meteorology Bulletin, v. 48, p. 37, 1967.
- HASHIMOTO, T.; STEDINGER, J. R.; LOUCKS, D. P. Reliability, resiliency, and vulnerability criteria for water resource system performance evaluation. Water Resources Research , v. 18, n. 1, p. 14-20, 1982. http://dx.doi.org/10.1029/WR018i001p00014.
» http://dx.doi.org/10.1029/WR018i001p00014 - HAYES, M. J.; SVOBODA, M. D.; WILHITE, D. A.; VANYARKHO, O. V. Monitoring the 1996 drought using the standardized precipitation index. Bulletin of the American Meteorological Society, v. 80, n. 3, p. 429-438, 1999. http://dx.doi.org/10.1175/1520-0477(1999)080<0429:MTDUTS>2.0.CO;2.
» http://dx.doi.org/10.1175/1520-0477(1999)080<0429:MTDUTS>2.0.CO;2 - KEYANTASH, J.; DRACUP, J. A. The quantification of drought: an evaluation of drought indices. Bulletin of the American Meteorological Society, v. 83, n. 8, p. 1167-1180, 2002. http://dx.doi.org/10.1175/1520-0477-83.8.1167.
» http://dx.doi.org/10.1175/1520-0477-83.8.1167 - KRAJINOVIĆ, Z.; RADOVANOVIĆ, S. Implementation of Standardized Precipitation Index (SPI) Republic Hydrometeorological Service of Serbia, 2010. Report. v. 17.
- MCKEE, T. B.; DOESKEN, N. J.; KLEIST, J. The relationship of drought frequency and duration to time scales. In: CONFERENCE ON APPLIED CLIMATOLOGY, 8., 1993, Anaheim. Proceedings ... Boston: American Meteorological Society, 1993. p. 179-183.
- MOY, W. S.; COHON, J. L.; REVELLE, C. S. A programming model for analysis of the reliability, resilience, and vulnerability of a water supply reservoir. Water Resources Research , v. 22, n. 4, p. 489-498, 1986. http://dx.doi.org/10.1029/WR022i004p00489.
» http://dx.doi.org/10.1029/WR022i004p00489 - NARESH KUMAR, M.; MURTHY, C. S.; SESHA SAI, M. V. R.; ROY, P. S. On the use of Standardized Precipitation Index (SPI) for drought intensity assessment. Meteorological Applications , v. 16, n. 3, p. 381-389, 2009. http://dx.doi.org/10.1002/met.136.
» http://dx.doi.org/10.1002/met.136 - OKI, T.; AGATA, Y.; KANAE, S.; SARUHASHI, T.; YANG, D.; MUSIAKE, K. Global assessment of current water resources using total runoff integrating pathways. Hydrological Sciences Journal, v. 46, n. 6, p. 983-995, 2001. http://dx.doi.org/10.1080/02626660109492890.
» http://dx.doi.org/10.1080/02626660109492890 - OKI, T.; KANAE, S. Global hydrological cycles and world water resources. Science , v. 313, n. 5790, p. 1068-1072, 2006. http://dx.doi.org/10.1126/science.1128845. PMid:16931749.
» http://dx.doi.org/10.1126/science.1128845 - PORTO, M. Recursos hídricos e saneamento na Região Metropolitana de São Paulo: um desafio do tamanho da cidade. Brasília: Banco Mundial, 2003. (Série Água Brasil).
- SABESP – COMPANHIA DE SANEAMENTO BÁSICO DO ESTADO DE SÃO PAULO. Dados de monitoramento do sistema Cantareira São Paulo: SABESP, 2018. Disponível em: <http://www2.sabesp.com.br/mananciais/dadoscantareira/>. Acesso em: 14 fev. 2018.
» http://www2.sabesp.com.br/mananciais/dadoscantareira/ - SANDOVAL-SOLIS, S.; MCKINNEY, D. C.; LOUCKS, D. P. Sustainability index for water resources planning and management. Journal of Water Resources Planning and Management , v. 137, n. 5, p. 381-390, 2011. http://dx.doi.org/10.1061/(ASCE)WR.1943-5452.0000134.
» http://dx.doi.org/10.1061/(ASCE)WR.1943-5452.0000134 - SICHE, R.; AGOSTINHO, F.; ORTEGA, E.; ROMEIRO, A. Índices versus indicadores: precisões conceituais na discussão da sustentabilidade de países. Ambiente & Sociedade, v. 10, n. 2, p. 137-148, 2007. http://dx.doi.org/10.1590/S1414-753X2007000200009.
» http://dx.doi.org/10.1590/S1414-753X2007000200009 - SOUSA, F. A. S.; DANTAS, F. R. C.; GUEDES, R. V. S.; MACEDO, M. J. H. Análise do índice padronizado de precipitação para o estado da Paraíba, Brasil. Ambiente & Água: An Interdisciplinary Journal of Applied Sciences , v. 5, n. 1, p. 204-214, 2010.
- WEN, C. H.; WILLIAMS, M.; ECONOMIDES, C.; DOVE, N. San Diego County: assessment of water resources, green infrastructure and utility rates. San Diego: San Diego County Water Authority, Columbia Water Center, 2014. p. 18.
- WILHITE, D. A. Drought as a natural hazard: concepts and definitions. In: WILHITE, D. A. Drought: a global assessment. London: Routledge, 2000. p. 3-18.
- ZARGAR, A.; SADIQ, R.; NASER, B.; KHAN, F. I. A review of drought indices. Environmental Reviews, v. 19, p. 333-349, 2011. http://dx.doi.org/10.1139/a11-013.
» http://dx.doi.org/10.1139/a11-013
Publication Dates
-
Publication in this collection
18 Feb 2019 -
Date of issue
2019
History
-
Received
22 June 2018 -
Reviewed
19 Oct 2018 -
Accepted
28 Nov 2018