 Uncertainty in water availability estimates due to land use and calibration choices in hydrological modelling
ABSTRACT
Reliable estimates of water availability are fundamental for water resources planning and management, yet they remain strongly affected by uncertainties associated with hydrological modeling choices, data availability, and landscape representation. This study evaluates the effects of land use and land cover (LULC) datasets and calibration strategies on water availability estimates in the Iguaçu River basin (approximately 70,000 km2), southern Brazil. The MGB distributed hydrological model was implemented using two contrasting LULC databases to generate distinct sets of hydrological response units, combined with three alternative calibration approaches. Results indicate that both LULC representation and calibration strategy substantially affect simulated low flows, particularly low-flow estimates that underpin water allocation criteria. Differences between simulations reached, on average, 38% for Q90, 42% for Q95, and nearly 50% for Q98, highlighting significant variability in reference flows commonly used for water permitting. These findings demonstrate that fixed-value indicators of water availability may mask critical uncertainties and lead to suboptimal management decisions. The study therefore advocates for the adoption of water availability ranges, rather than single reference values, as a more robust framework for water allocation and risk-informed decision-making, especially in data-scarce regions and highly regulated basins.
Keywords:
Water resources management; Hydrological models; Land use and land cover; Water availability
RESUMO
Estimativas confiáveis de disponibilidade hídrica são fundamentais para o planejamento e a gestão dos recursos hídricos, mas permanecem fortemente afetadas por incertezas associadas às escolhas de modelagem hidrológica, à disponibilidade de dados e à representação espacial da paisagem. Este estudo avalia os efeitos de diferentes bases de dados de uso e cobertura da terra e de estratégias de calibração do modelo sobre as estimativas de disponibilidade hídrica na bacia do rio Iguaçu (aproximadamente 70.000 km2), no sul do Brasil. O modelo hidrológico distribuído MGB foi implementado utilizando duas bases de dados contrastantes de uso e cobertura da terra para gerar diferentes conjuntos de Unidades de Resposta Hidrológica (URHs), combinadas com três abordagens alternativas de calibração. Os resultados indicam que tanto a representação do uso e cobertura da terra quanto a estratégia de calibração afetam substancialmente as estimativas de vazões mínimas simuladas, particularmente aquelas que servem de base para os critérios de alocação de água. As diferenças entre as simulações atingiram, em média, 38% para a Q90, 42% para a Q95 e quase 50% para a Q98, evidenciando elevada variabilidade nas vazões de referência comumente utilizadas para a outorga de direito de uso dos recursos hídricos. Esses resultados demonstram que indicadores fixos de disponibilidade hídrica podem mascarar incertezas críticas e conduzir a decisões de gestão subótimas. O estudo, portanto, defende a adoção de faixas de disponibilidade hídrica, em vez de valores únicos de referência, como uma abordagem mais robusta para a alocação da água e para a tomada de decisão baseada em riscos, especialmente em regiões com escassez de dados e em bacias hidrográficas altamente reguladas.
Palavras-chave:
Gestão de recursos hídricos; Modelos hidrológicos; Uso e cobertura da terra; Disponibilidade hídrica
INTRODUCTION
Managing multiple water uses poses increasing challenges due to extreme events and rising socio-economic pressures, which both affect water security during droughts and floods and subsequently lead to conflicts over its use (Haydar et al., 2016; Schlaepfer et al., 2017; Javadinejad et al., 2019; Phan et al., 2019, Montenegro et al., 2025). Therefore, careful planning is increasingly critical to ensure sustainable water usage (United Nations, 1987).
Hydrological models are valuable tools for this purpose, as they assess current water availability and simulate the impacts of various environmental and socio-economic scenarios on water resources (Tu et al., 2024; Munar et al., 2018). These models approximate real hydrologic systems either by physically representing the system or through abstract equations (Chow et al., 1988). Various types of hydrological models employing different approaches have been developed for application in Water Resources Management (see Table 1 and Table 2 - Supplementary Material), requiring the user/hydrologist to exercise prior judgment in determining which model best suits the intended purpose.
Selecting the appropriate hydrological model requires evaluating various criteria to support decision-making (Ferreira et al., 2018; Salvadore et al., 2015). Distinct scientific contributions have focused on implementation, calibration, and verification of these models using data science management techniques (Arsenault et al., 2018; Zheng et al., 2018; Liu et al., 2018; Huard & Mailhot, 2008). In this research focus is to assess to land use and land cover (LULC) dynamics that significantly influence the hydrological cycle, affecting river flows, aquifer recharge and water quality (Dash et al., 2024; Gbohoui et al., 2021; Song et al., 2018; Arsiso & Mengistu Tsidu, 2023; Mewded et al., 2021; Koneti et al., 2018), identification of vegetation, water bodies and artificial structures (Green et al., 1994), regional impacts on water balances, deforestation and carbon cycling (Dile et al., 2018).
Additionally, the combination of potential LULC changes and natural phenomena and processes exhibit spatial variability, as their characteristics are not constant across observed areas and may change over time (Whiteaker & Maidment, 2004; Seyfried & Wilcox, 1995). This inherent complexity poses significant challenges to accurately estimating the amount of water available for all environments that depend on this resource (Fleischmann et al., 2021; Wongchuig et al., 2019; Pontes et al., 2017).
In general, to incorporate such spatial variability into hydrological modeling, the integration of hydrological models with Geographic Information Systems (GIS) enables analyses to include not only hydrological variables themselves but also the heterogeneity of natural systems (Chatrabhuj et al., 2024). This integration has proven to be one of the most effective tools for improving the representation of hydrological processes, considering one LULC representation, to better assess water availability estimates focusing on reducing uncertainties in estimates and in the interpretation of results.
In this context, it is essential to understand not only the technical challenges of modeling but also the importance of considering the spatial and temporal variability of hydrological phenomena in water availability assessments through the consequences of LULC representation. This integrated approach enables the analysis to move beyond traditional quantitative aspects by incorporating environmental and management criteria that reflect the complexity of natural systems (Baran-Gurgul & Rutkowska, 2024). Therefore, this study aims to address these multiple dimensions, emphasizing the relevance of methods that account for the inherent uncertainties in water resources planning and management processes, considering potential changes on LULC representation.
Water availability represents the portion of water available for society's use while considering the needs for conserving aquatic ecosystems and environmental aspects particularly in the context of water safety (Zhang et al., 2024; Salehi, 2022; van Vliet et al., 2021; Brunner et al., 2019). Once methodology used to calculate water availability is the flow duration curve (Vogel & Fennessey, 1995; Stedinger et al., 1993), results may vary depending on the method used, the model's characteristics, and the period, quality, and quantity of data utilized (Leong & Yokoo, 2021; Yokoo & Sivapalan, 2011; Vogel & Fennessey, 1995), with no evidence of assessing LULC changes for planning and management purposes (Toosi et al. 2025).
A review of recent studies on hydrological modeling (see Table 3 – Supplementary Material) indicates that the trends identified in the historical overviews of Todini (2007) and Singh (2018) persist. Research in this field continues to be primarily driven by reservoir sizing (Fleischmann et al., 2021; Rippl, 1883), real-time flow forecasting (Krajewski et al., 2021; Goswami & O’Connor, 2007), and flood (Tegos et al., 2022; Wang et al., 2021) or drought analysis (Veettil & Mishra, 2020; Tallaksen et al., 2009). Environmental concerns and water resource management have only been more prominently incorporated in response to the increasing degradation of natural resources (Swain et al., 2020; Schuster et al., 2020; Oliveira et al., 2019), representing the research gap herein focused. Toosi et al. (2025) presented an interesting review of existing approaches to integrating LULC into hydrological modeling and highlights the need for improved methods that better assess technological advances and enhance better hydrological response.
Additionally, the scientific community continues to regard the issues highlighted in this review as part of the 23 unsolved problems in hydrology, particularly those related to the variability and spatiotemporal changes in hydrological processes from LULC dynamics (Blöschl et al., 2019). Although the studies reviewed pertain to water resources management, this topic is not explicitly addressed, as hydrological modeling remains focused on other aspects. Consequently, uncertainty analyses are often insufficiently conducted within these applications. This issue is particularly critical in South America, where the continent's vast size and the limited number of monitoring stations result in a low density of hydrometric gauges. Additionally, the available data often cover shorter-than-ideal periods and contain significant gaps (World Meteorological Organization, 2021).
These inconsistencies in hydrological monitoring directly impact water resource management by increasing uncertainty and elevating risks associated with water security. This monitoring inconsistency directly influences water resources management, increasing uncertainty and elevating the risks associated with water security and having been addressed by distinct applications as for sediment fluxes (Fagundes et al., 2023), large reservoirs (Kolling Neto et al., 2023), inundation flows (Fleischmann et al., 2023), Climate change impacts (Brêda et al., 2023), and real time platform (Reis et al., 2023).
In this regard, the present study aims to estimate water availability for water use planning and management, based on distinct characteristics of two LULC datasets using hydrological modeling, considering different calibration approaches, and flow frequency curves for selected locations in the Iguaçu River basin. Our results indicate variations in water availability estimates, leading to the recommendation that range analysis should replace fixed-value assessments (Q95 index, i.e.) for improved management practices.
MATERIALS AND METHODS
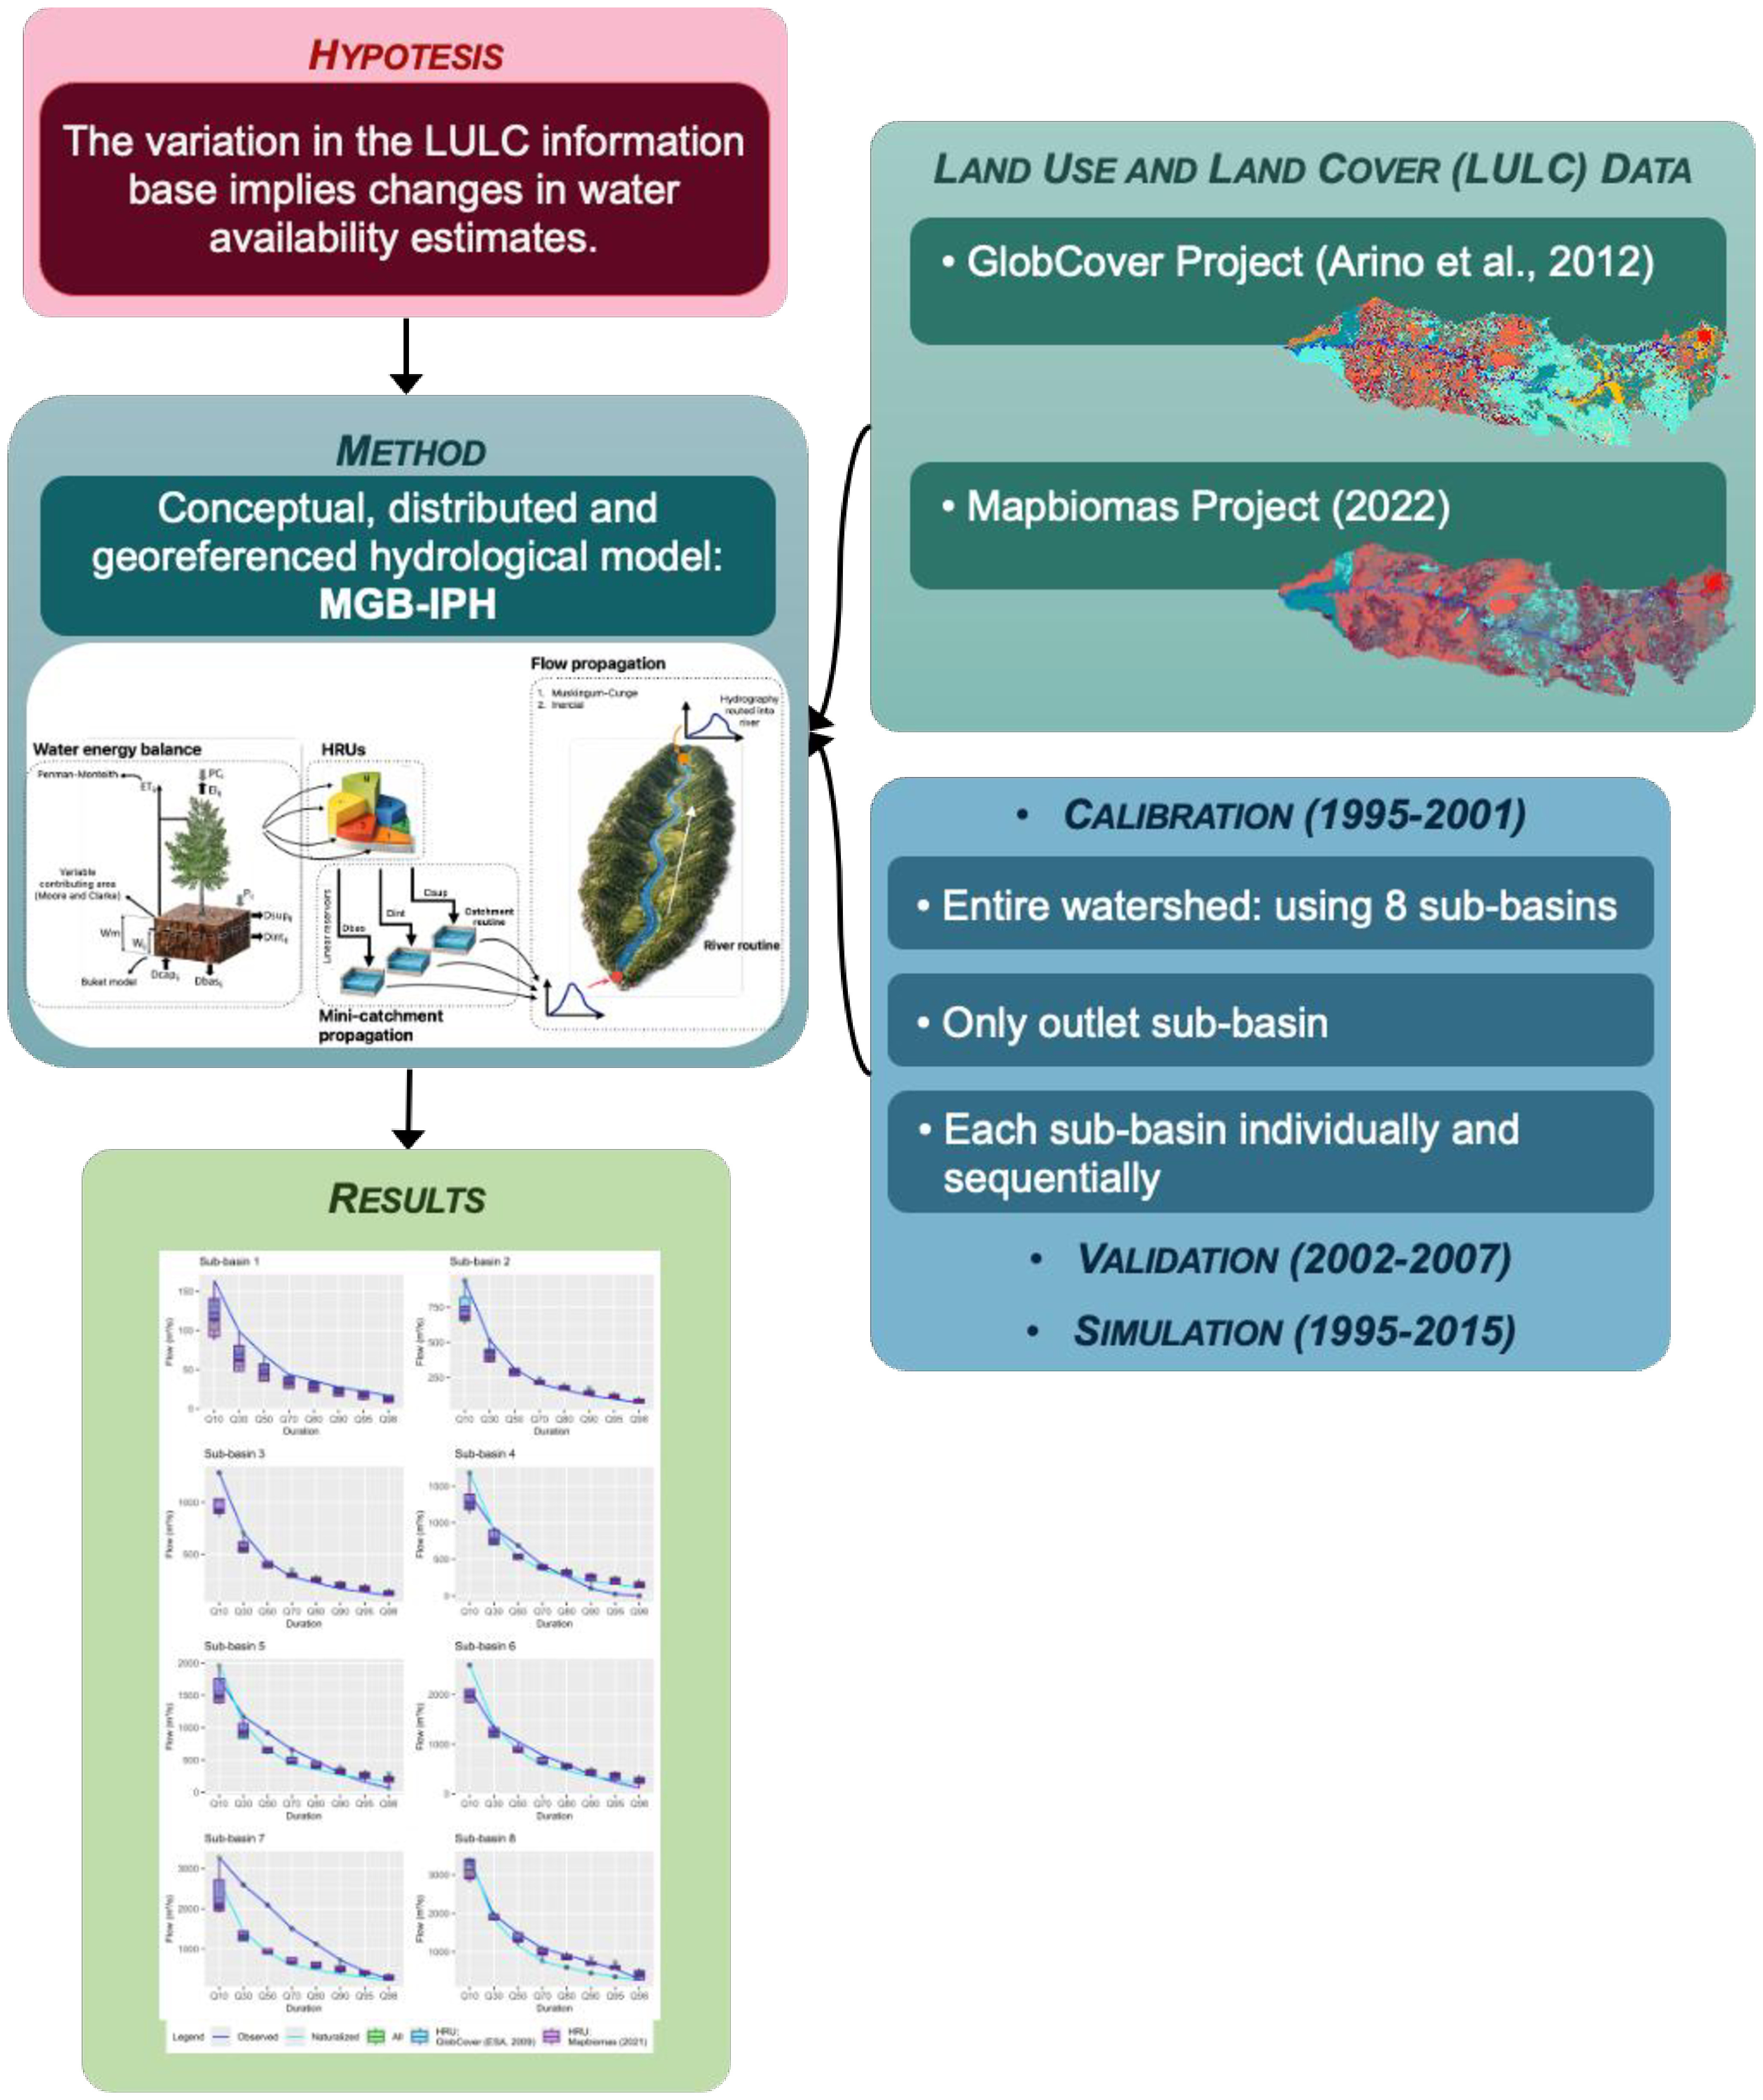
The experimental plan (Figure 1) highlights a synthesis of the methodological approach by employing the MGB hydrological model in conjunction with a GIS tool (Collischonn et al., 2020). The case study is the Iguaçu River that is relevant in terms of water usage, not only for energy production impacts but also for various other water uses such as agriculture and water supply. The primary steps are as follows: (i) Model implementation, calibration, and validation for the Iguaçu Watershed; (ii) Implementation of two distinct LULC datasets – GlobCover Project (Arino et al., 2012) and Mapbiomas (2022); and (iii) Uncertainty analysis based on extensive simulations using distinct calibration strategies for both LULC databases.
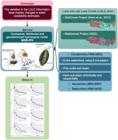
The MGB model (Collischonn et al., 2020) is a distributed hydrological model that offers detailed spatial discretization by creating unit-catchments and subsequently Hydrological Response Units (HRUs) to represent spatial variability.
The MGB model simulates naturalized streamflows, which is consistent with the use of model-derived time series for the estimation of reference flows for water resources management purposes, as these flows must represent natural or naturalized conditions.
In the study region, the observed streamflow records at existing gauging stations are significantly influenced by the operation of multiple reservoirs, limiting their direct applicability for model evaluation. Therefore, naturalized streamflow data provided by the National Electric System Operator (2022) were used as a reference for comparison with the streamflow results obtained from the MGB simulations.
Study area
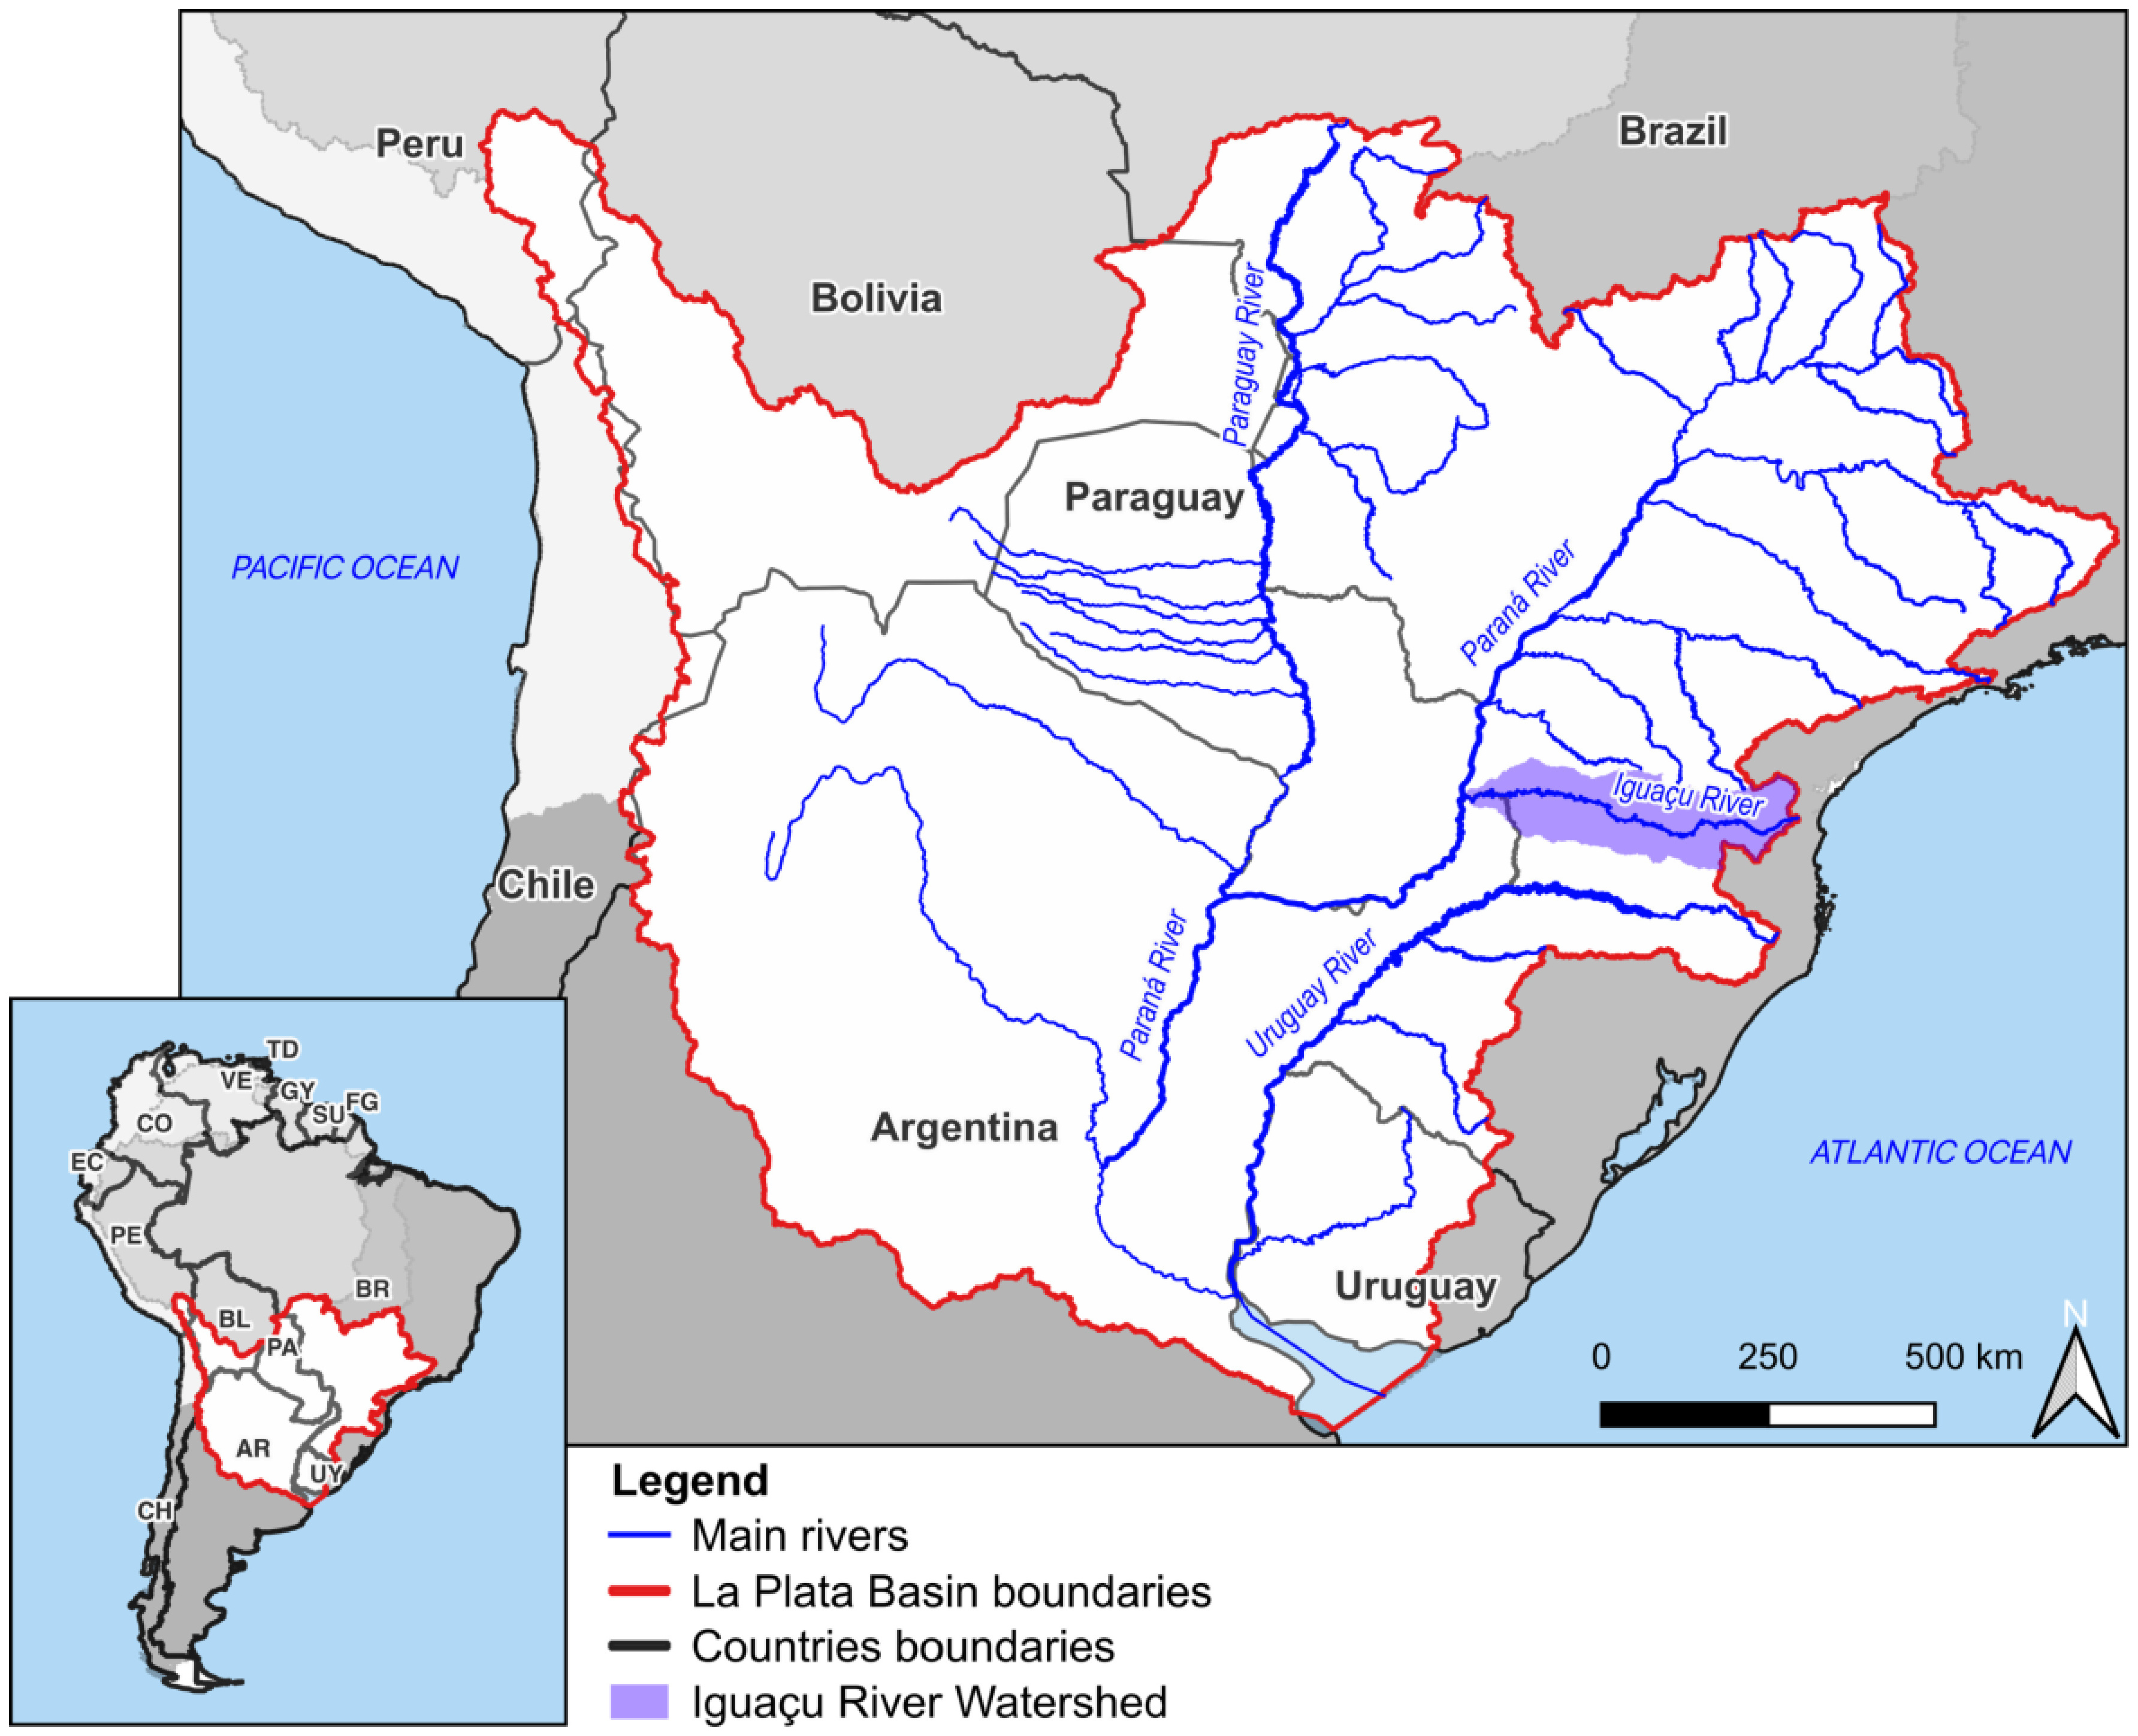
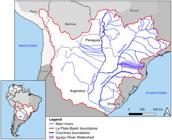
The Iguaçu River, a main tributary of the Paraná River, meets the Paraguay and Uruguay Rivers to form the La Plata River basin (Figure 2). This basin spans 17% of Brazil, all of Paraguay, 33% of Argentina, 19% of Bolivia, and 79% of Uruguay, before flowing into the Atlantic Ocean (Food and Agriculture Organization of the United Nations, 2016). The Iguaçu River flows into the Paraná River at the Triple Border, where Brazil, Argentina, and Paraguay meet.
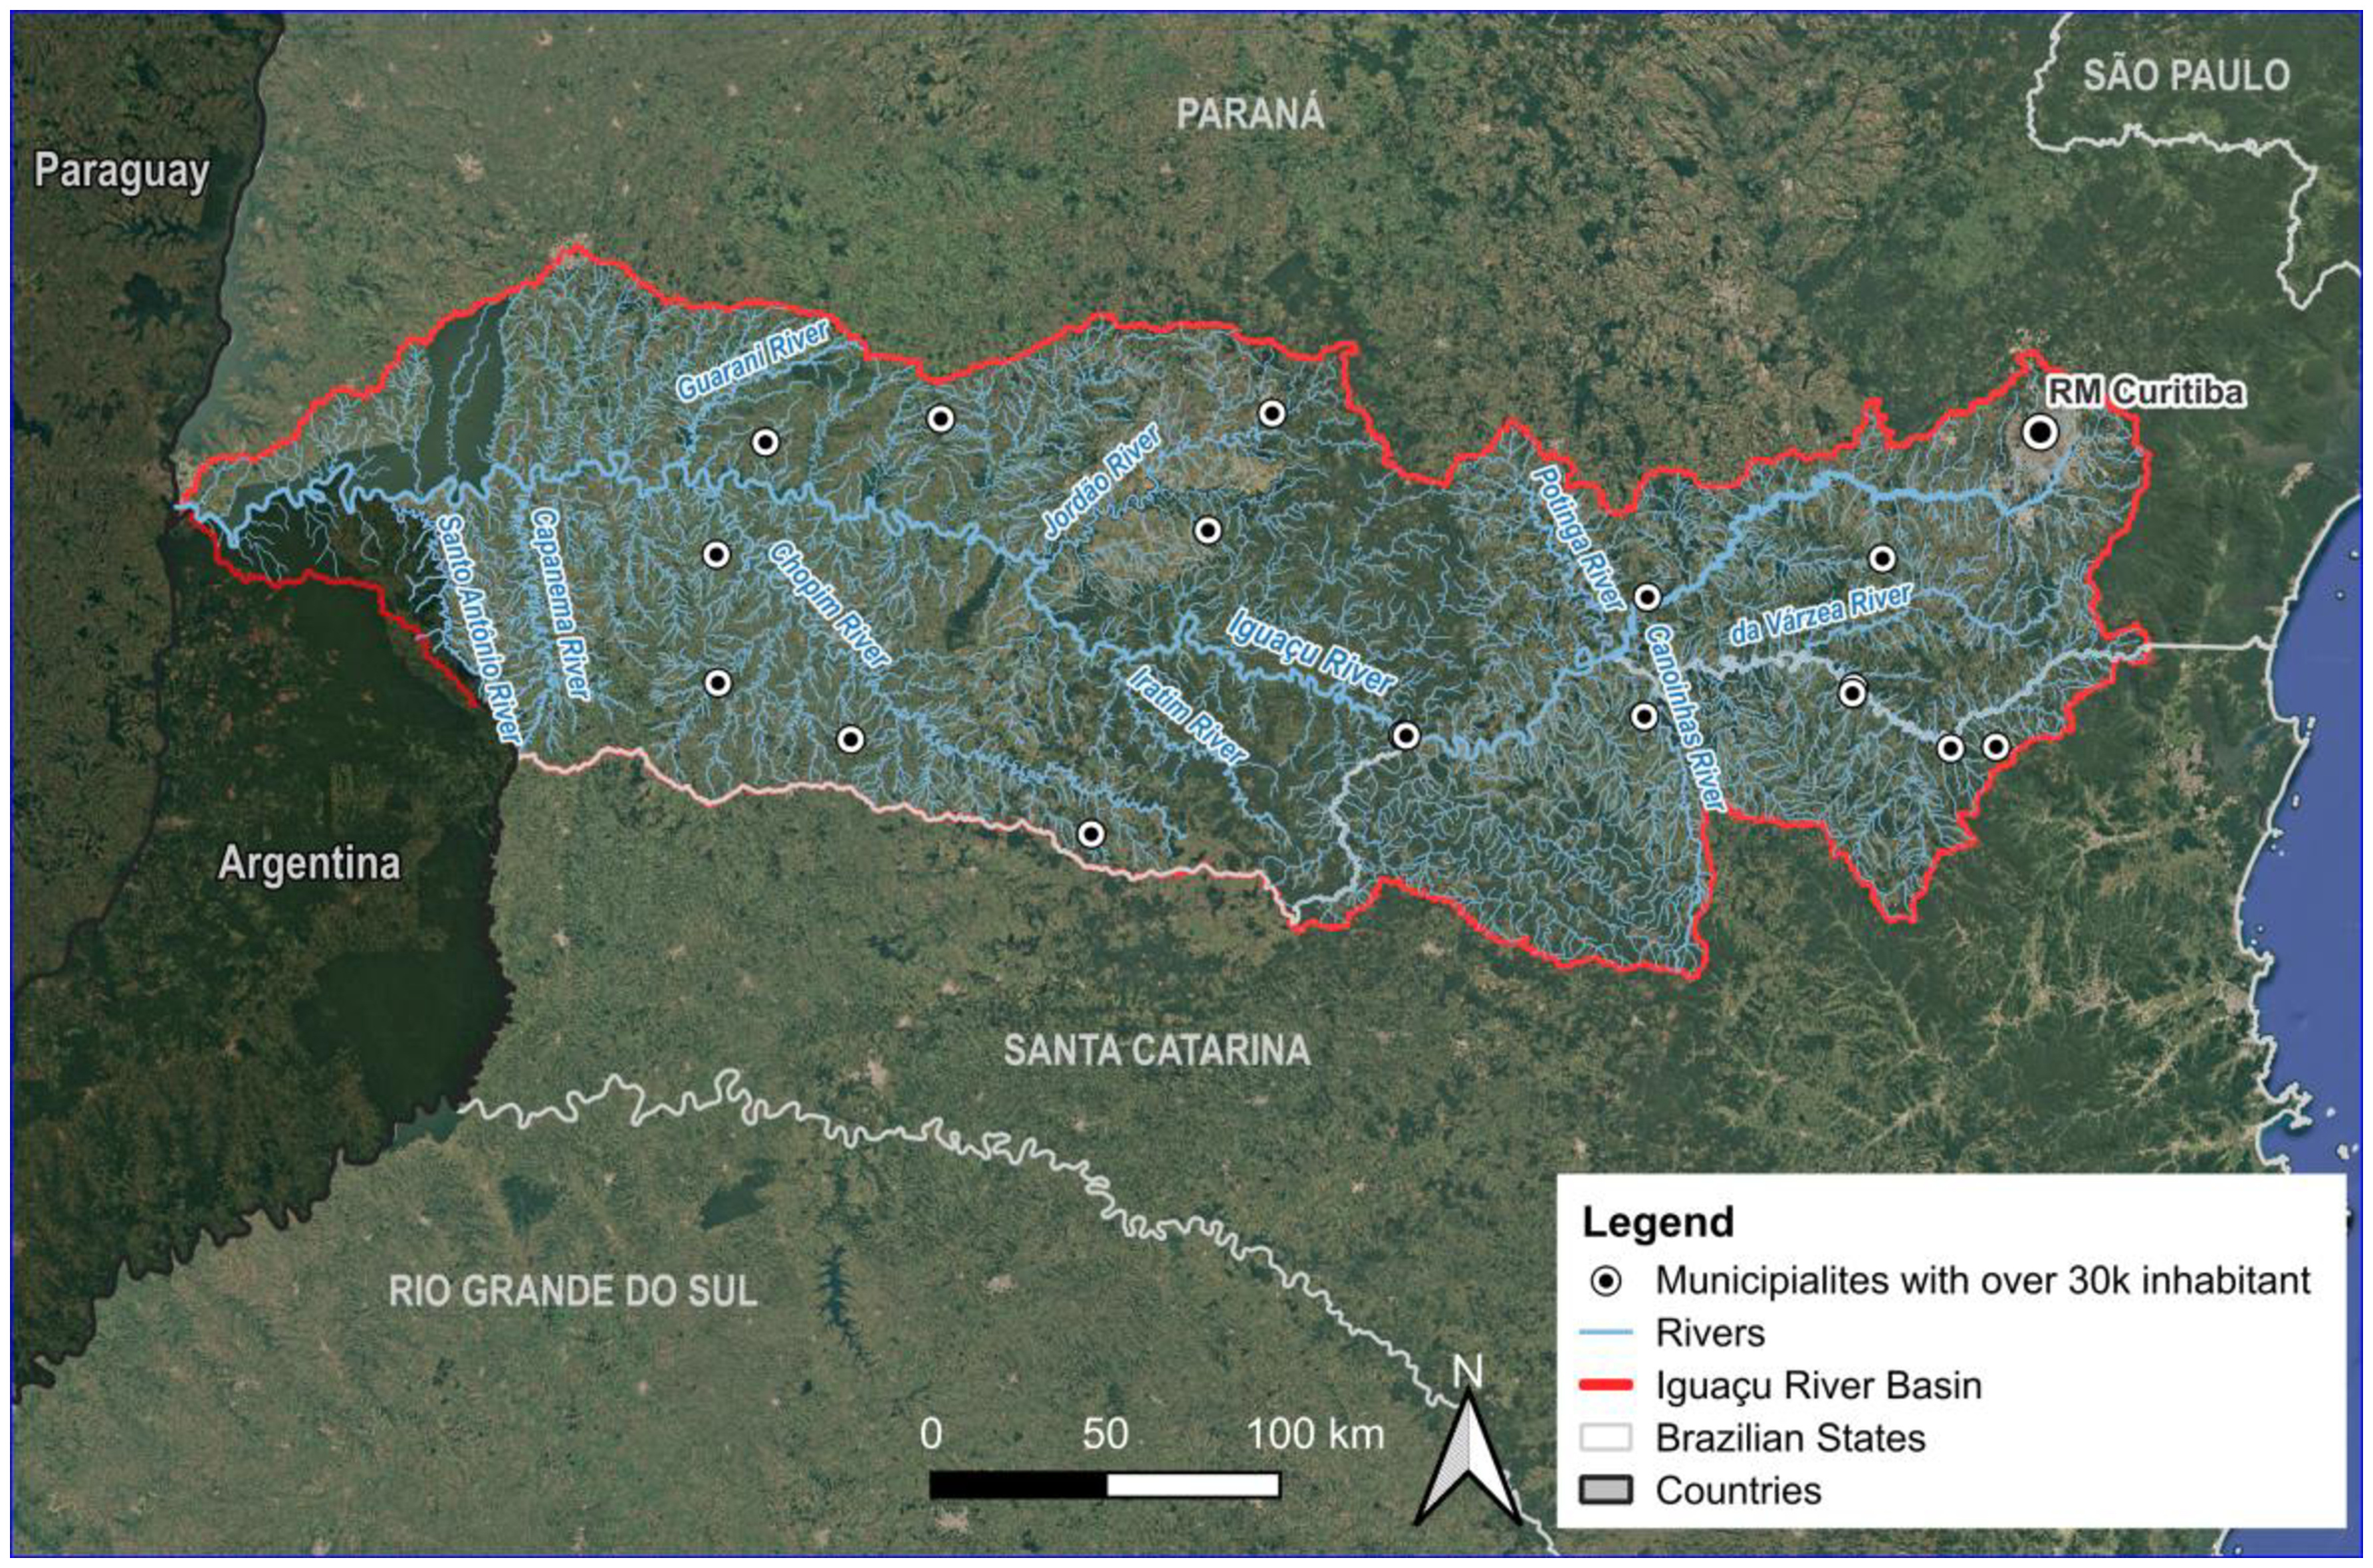
The Iguaçu River basin (Figure 3) is the largest hydrographic basin in the state of Paraná encompassing approximately 70,000 km2. Around 80% of this area is within the state of Paraná, 17% in the state of Santa Catarina, and 3% in Argentine territory. The Iguaçu River originates in the Curitiba Plateau near the Serra do Mar and follows a course of 1,320 km through the three plateaus of Paraná until it merges with the Paraná River. Along its course, the river traverses distinct phytophysiognomic units of the Atlantic Forest biome, reflecting variations in topography, climate, and land use across the basin. The regional climate is predominantly humid subtropical according to the Köppen climate classification, with the mean temperature of the coldest month below 18 °C and the mean temperature of the warmest month above 22 °C. Mean annual precipitation ranges from approximately 1,200 to 2,000 mm and is relatively well distributed throughout the year.
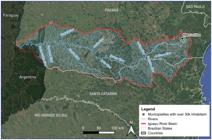
Iguaçu River Basin: the study area, highlighting the Metropolitan Region (RM) of Curitiba and municipalities with over 30,000 inhabitants.
The population in the Iguaçu River basin is approximately 4.5 million people, representing half of the total population of the state of Paraná. Accordingly, the public water supply sector is the largest consumer of water in the basin, accounting for just over 70% of the water resource demand in the region, followed by the industrial sector at 20% and 8% utilized for agricultural activity (Paraná, 2023).
According to the Brazilian National Water and Sanitation Agency (2021a), a portion of the Paraná Hydrographic Basin, which includes the Iguaçu River Basin, experienced wet periods between 2016 and 2017. This scenario differed from the severe drought that was observed in 2018 in the region. As a result, studies recommended that ANA issue a Declaration of a critical situation of quantitative water scarcity in the Paraná Hydrographic Region (Brazilian National Water and Sanitation Agency, 2021b, 2021c).
In this context, the most affected uses would be non-consumptive ones, such as recreation and tourism, navigation, and hydroelectric generation. Specifically, the impact on meeting the needs of the National Interconnected System (SIN) was observed during a recent energy crisis in Brazil, arising from the water scarcity situation also observed in other basins in the country. As the backbone of the national power system, the SIN integrates generation and transmission across most of the country and relies heavily on coordinated hydropower operation (National Electric System Operator, 2026). Consequently, reduced reservoir inflows and constrained river discharges directly limited generation capacity and energy exchanges among regions, amplifying system vulnerability during drought conditions.
Furthermore, hydroelectric exploitation is a natural activity in the Iguaçu River basin, as its main river originates near the state's coast and flows inland with an elevation drop of approximately 800 meters. When combined with the substantial flows observed at the Iguaçu River outlet, this makes it suitable for the installation of hydroelectric developments.
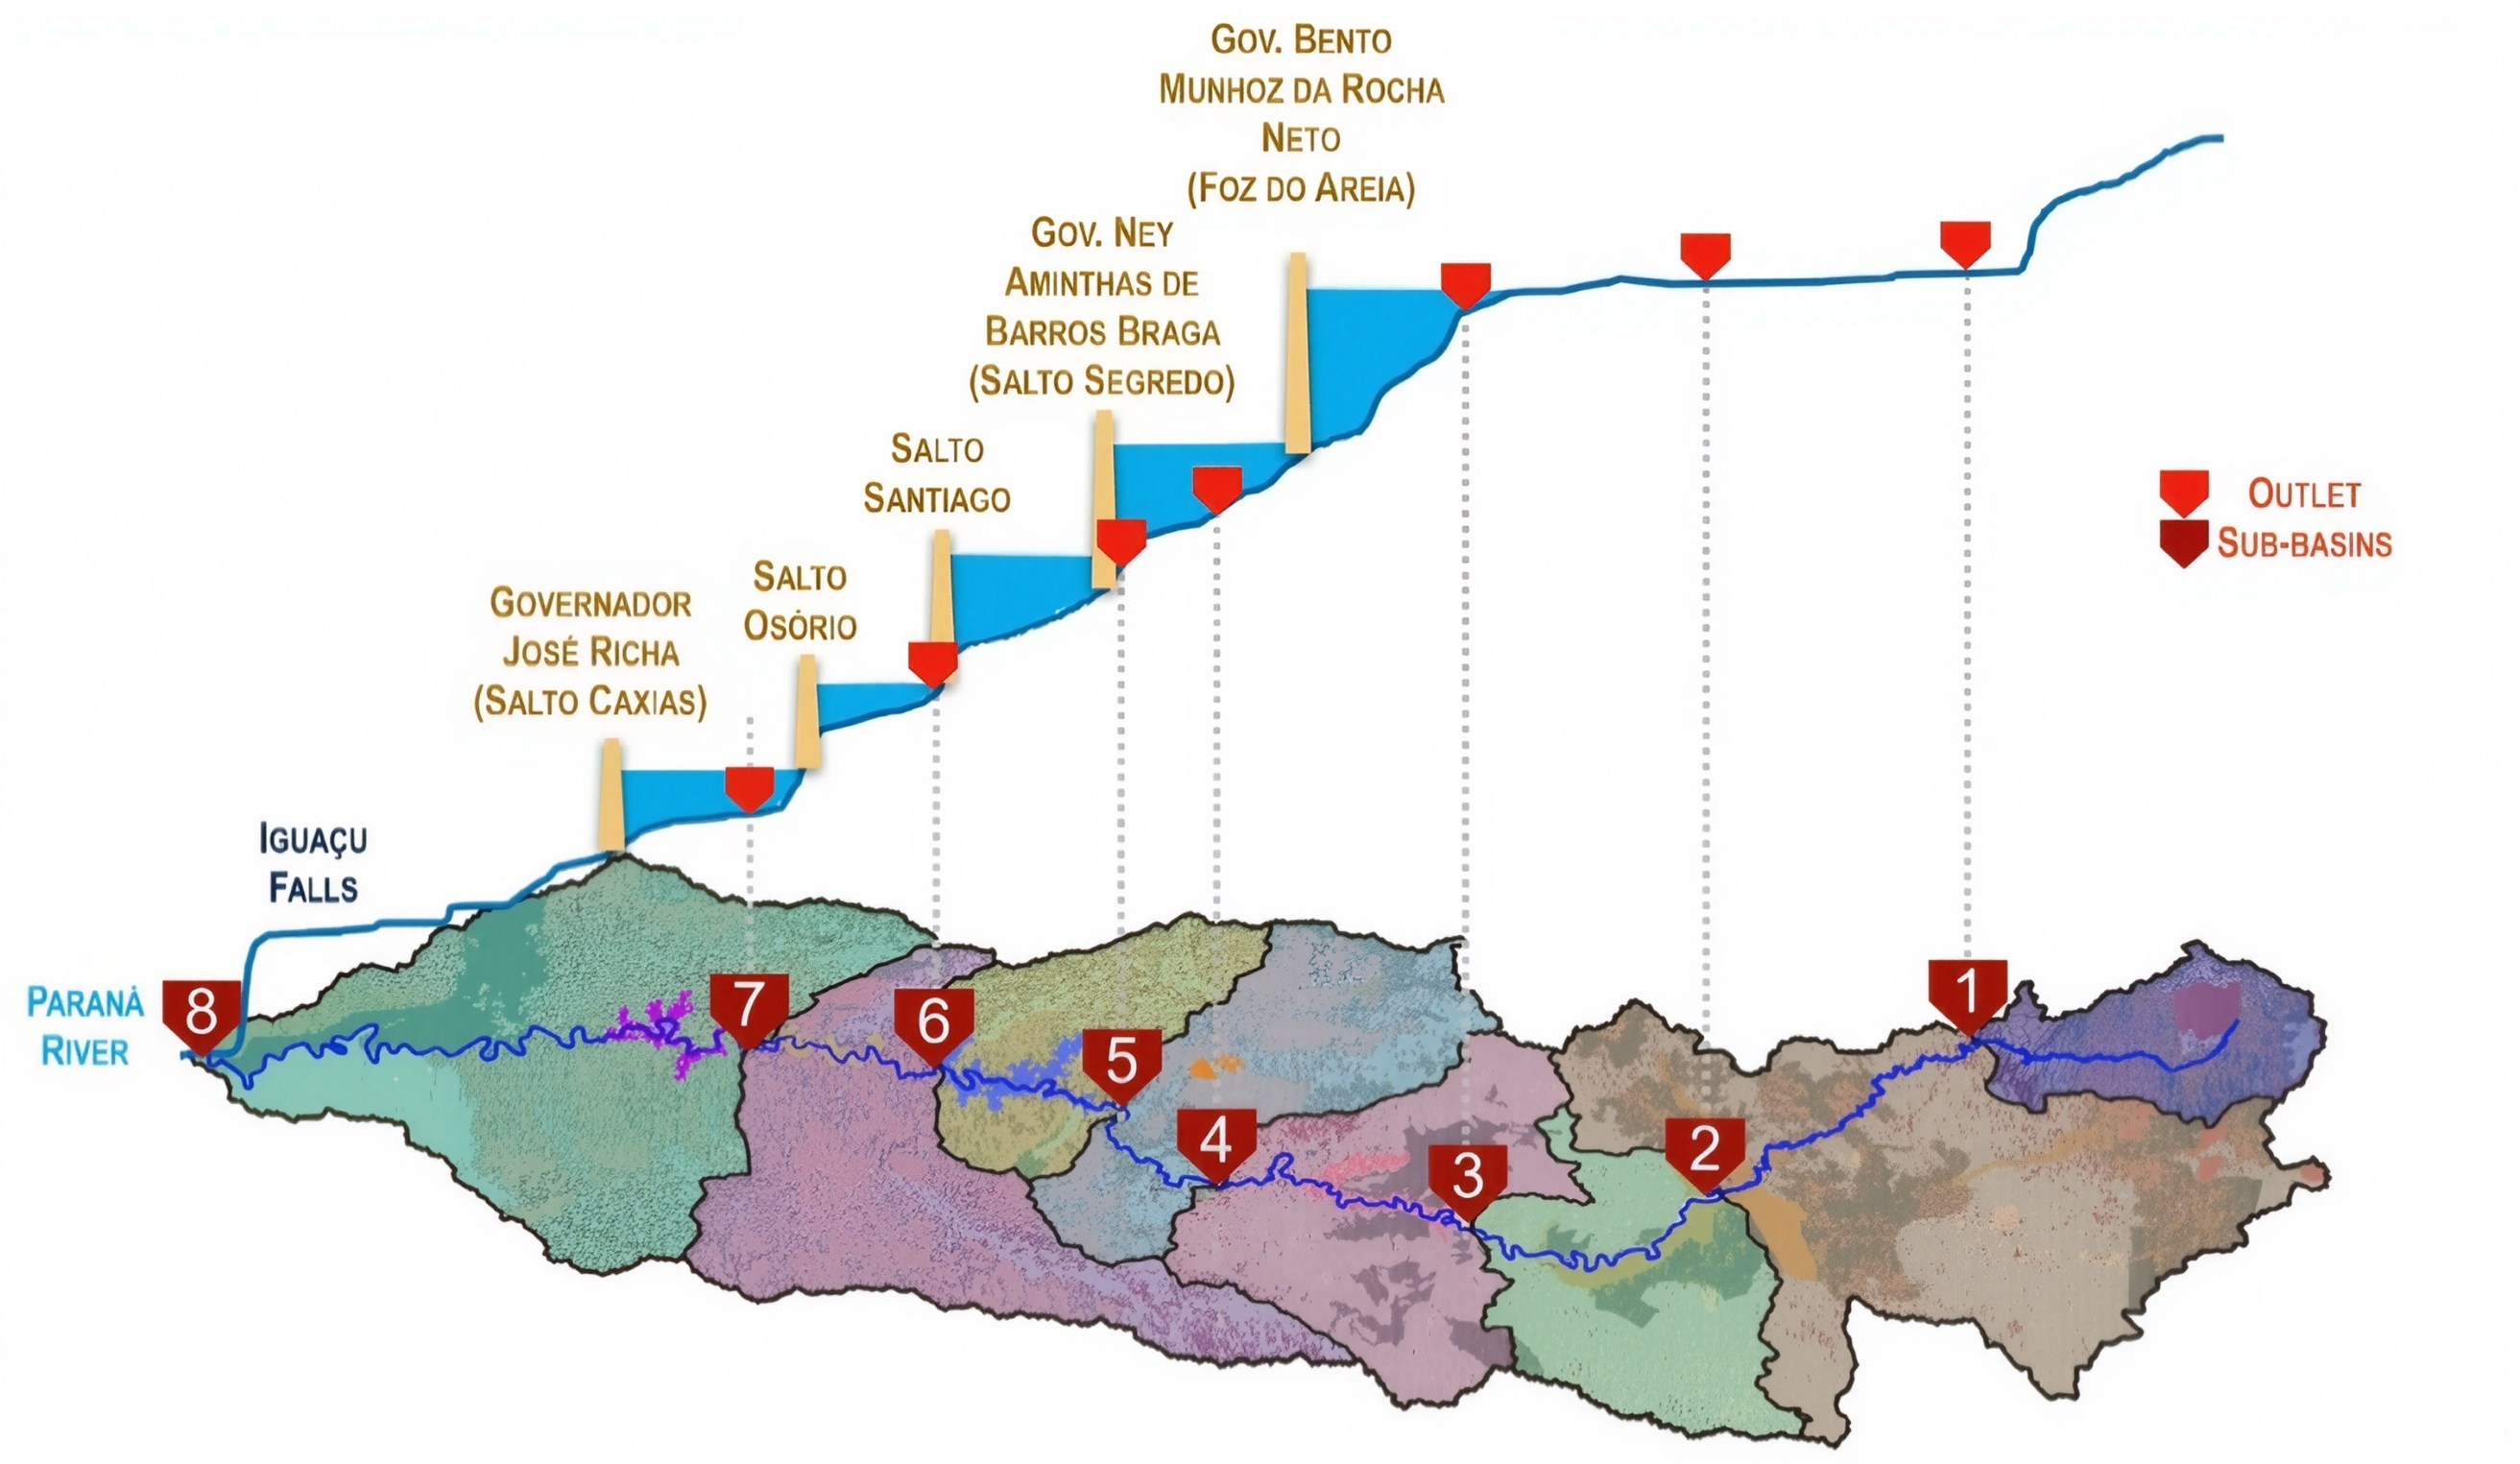
In this context, notable hydroelectric powerplants (HEPs) include Gov. Bento Munhoz da Rocha Neto HEP (Foz do Areia - 1,676 MW, 5,779 hm3), Gov. Ney de Barros Braga HEP (Salto Segredo - 1,260 MW, 2,942 m3), Salto Santiago HEP (1,420 MW, 6,775 hm3), Salto Osório HEP (1,078 MW, 1,124 hm3), and Governador José Richa HEP (Salto Caxias - 1,240 MW, 3,573 hm3). The location of these HEPs in the mentioned basin can be observed in Figure 4, together with the corresponding control points, which represent the locations of the streamflow gauging stations used in the simulations. These stations define or approximate the outlets of the sub-basins adopted in this study, enabling a more detailed overview of the spatial distribution of the HEPs within the Iguaçu River basin. Additionally, these streamflow gauging were utilized to delineate the sub-basins for the analyses conducted in this study.
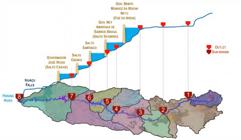
Sub-basins numbered from upstream (1) to downstream (8), and major hydroelectric developments in the Iguaçu River basin.
The basin is governed by three river basin committees established in accordance with Brazil’s National Water Resources Policy, which operate as deliberative and consultative bodies composed of representatives from state and municipal governments, water users, and civil society. The executive authority responsible for implementing water-resources management actions is the Paraná State Institute for Water and Land (IAT). In the Iguaçu River basin, water availability is defined by the IAT based on the natural streamflow with 95% permanence (Q95), which serves as a reference criterion for water allocation and permitting decisions (Institute of Waters of Paraná, 2006).
Hydrometeorological database
Meteorological data for both the characterization of the Iguaçu River basin and the assessment and validation of the modeling performed were primarily obtained from the National System of Information on Water Resources (SNIRH) database. This information was accessed through the Hidroweb Portal, a virtual tool that provides data from the ANA's hydrometeorological monitoring network (Brazilian National Water and Sanitation Agency, 2022).
To supplement stations no longer available on Hidroweb, data were also utilized from the Catchment Attributes and Meteorology for Large-sample Studies – Brazil (CAMELS-BR) projects. This project offers daily historical discharge series for 3,679 streamflow stations and meteorological data, along with 65 attributes for 897 selected basins in Brazil (Chagas et al., 2020).
In this research, selecting streamflow stations for assessing water availability in the Iguaçu River Basin, priority was given to stations located at or near the outlets of sub-basins, as well as those with a significant period of consistent observed data discharge in common. In most cases, the selected stations coincide with the sub-basin outlets; however, in some cases, stations located in close proximity to the outlets were used due to data availability constraints. These stations were then used to define or approximate the sub-basin outlets adopted in this study.
Consequently, six stations were chosen from the Hidroweb Portal (Brazilian National Water and Sanitation Agency, 2022) for the eight sub-basins, with the remaining two sourced from the CAMELS-BR project (Chagas et al., 2020), as shown in Table 1. A 19-year period for analysis and modeling was defined, spanning from 1995 to 2014. Flow duration curves and hydrographs were generated for each of these stations, providing a reference for validating the modeling carried out in the study (Figure 1 - supplementary material).
Selected control stations for each sub-basin of the study, with data from ANA (Brazilian National Water and Sanitation Agency, 2022) and Chagas et al. (2020).
As sub-basins are numbered from upstream to downstream, flow magnitude increases towards the basin's outlet (sub-basin 8). Sub-basins 1, 2, and 3 lack hydroelectric developments; thus, from sub-basin 4 onward, flow duration curves reflect this in their data.
The hydrological model also uses temperature, relative humidity, wind speed, atmospheric pressure, and insolation data for evapotranspiration calculations. This data was obtained from the climatological database of 1961-1990 by the National Institute of Meteorology (INMET) for Brazil, using the stations listed in Table 2.
Climatological Stations Used, with data adapted from Inmet (National Institute of Meteorology of Brazil, 1992).
Hydrological model for the Iguaçu River Basin
The Large Basin Model (MGB-IPH) is a hydrological model based on conceptual equations to simulate the terrestrial hydrological cycle. It has been used for applications such as flood forecasting studies, reservoir operation, hydrological reanalysis for historical extremes, impact assessment due to LULC changes and climate changes, flow estimation for decision support systems, and water resources planning (Collischonn et al., 2020).
It is a distributed hydrological model that divides the watershed into smaller spatial units, a process known as discretization. This step is performed in a non-structured manner, considering small incremental watersheds, referred to as mini-catchment basins, in the current version of the model (see Figure 2 in the supplementary material). These unit catchment are further subdivided into Hydrological Response Units (HRUs) to represent the spatial variability within each mini-catchment (Collischonn et al., 2020). The HRU approach is applied to classify the areas within each cell that contain comparable compounds of soil and land cover (Collischonn et al., 2007).
Preprocessing was carried out using the IPH-Hydro Tools software package (Siqueira et al., 2016), which generates an input file containing the essential information required for simulations with the MGB model. In this study, the following datasets were used during the preprocessing stage:
-
Digital Elevation Model (DEM): derived from the Shuttle Radar Topography Mission (SRTM) Version 4 dataset, with a spatial resolution of 90 m, obtained from the Google Earth Engine platform (Jarvis et al., 2008).
-
Hydrological Response Units (HRUs): developed by Fan et al. (2015) for the entire South American continent. These HRUs were generated based on soil type information at different spatial scales, including global and continental datasets, and were complemented with land use and land cover (LULC) data from the GlobCover project of the European Space Agency (ESA) for the year 2009, with a spatial resolution of 400 m (Arino et al., 2012). Despite the outdated nature of these data, these HRUs, herein analyzed, are widely used because they are distributed together with the MGB model and facilitate the preprocessing procedures required by the model.
-
Updated HRUs: to generate HRUs with more recent information, LULC data from the MapBiomas project for the year 2021—the most up-to-date dataset available at the time of this study—were used, with a spatial resolution of 90 m (MapBiomas, 2022). These data were combined with soil type information from the pedology shapefile produced by the Brazilian Institute of Geography and Statistics (2021), which was classified according to soil depth classes following the criteria proposed by Fan et al. (2015).
Because the HRUs developed by Fan et al. (2015) already follow a classification scheme compatible with the requirements of the MGB user manual, the HRUs generated in this study were classified in a similar manner. As LULC is the component most subject to temporal changes, a specific nomenclature was adopted to distinguish the analyses: the HRUs from Fan et al. (2015) are referred to as “HRUs from GlobCover”, whereas the units generated in this study are referred to as “HRUs from MapBiomas”.
Calibration and simulation as surrogate for uncertainties analysis – experimental plan
The experimental plan conceived considers different calibration (for the 1995-2001 period) characteristics using the automatic calibration tool embedded in the MGB model, based on the MOCOM-UA algorithm (Yapo et al., 1998), with subsequent validation analysis (for period 2002-2007). These periods were selected due to the availability of consistent observed data with few gaps. In contrast, Paranhos (2023) used data from 1990 to 2010 for calibration and validation. All simulations were conducted from 1995-2015. This strategy represents a condition for comparing the results and assessing potential variability in the flow duration curves.
It is important to note that the streamflow observations used for calibration are influenced by reservoir operations for hydropower generation across the basin, whereas these reservoirs are not explicitly represented in the model structure. As a result, the calibrated parameters may implicitly incorporate the effects of flow regulation, compensating for processes not physically described by the model. This limitation introduces potential structural bias, particularly affecting the representation of flow variability and low-flow conditions. Consequently, the simulated flow duration curves may reflect a combination of natural hydrological processes and regulated flow signals embedded during calibration. Although the study aims to analyze natural flow conditions, the use of regulated observations was necessary due to data availability constraints, and this conceptual inconsistency is acknowledged as a limitation of the study.
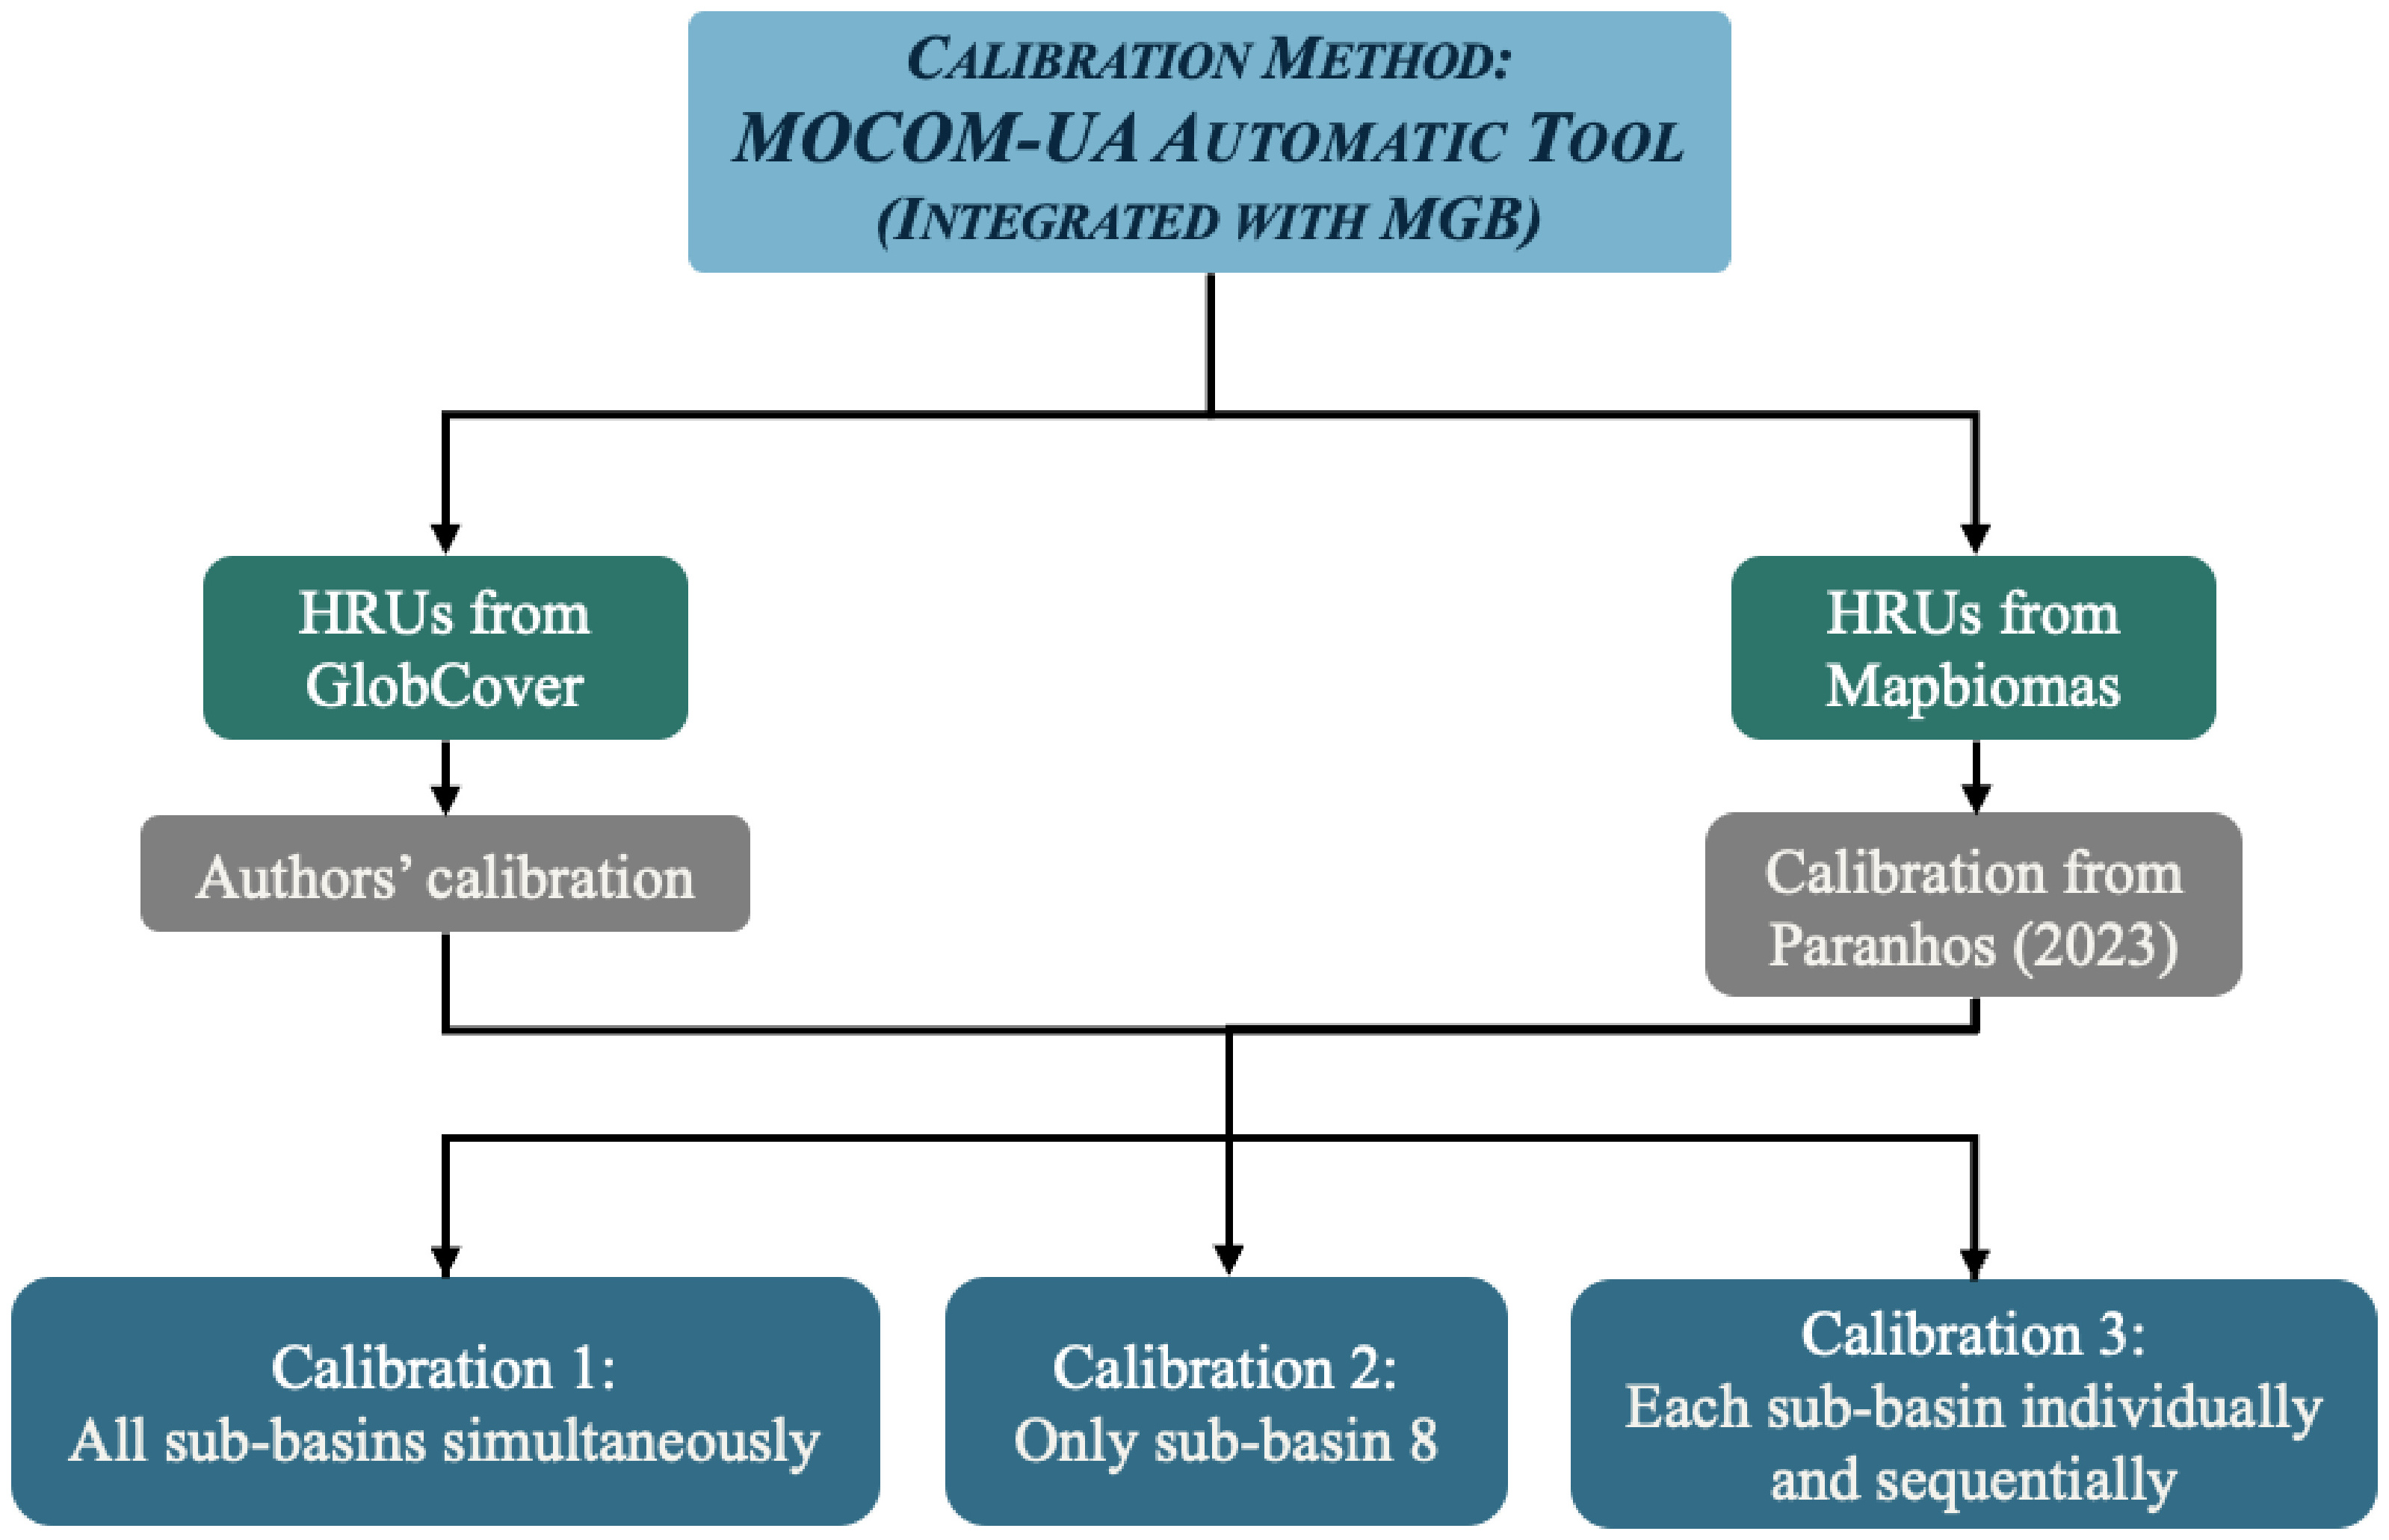
In this study, three calibrated parameter sets were considered (Figure 5), representing different calibration strategies and levels of spatial constraint. The first parameter set (Calibration 1) resulted from a global calibration in which a single parameter set was estimated and applied uniformly across all sub-basins using the HRUs derived from GlobCover. The calibration was performed simultaneously using streamflow observations from multiple gauging stations distributed along the basin. For each candidate parameter set, performance metrics (e.g., NSE and logNSE) were computed at each gauging station and automatically aggregated by the model into basin-wide objective functions, typically based on the arithmetic mean across stations. These aggregated metrics were then used within the multi-objective optimization procedure. This approach allows balancing model performance across different parts of the basin (Collischonn et al 2020; Paranhos, 2023).
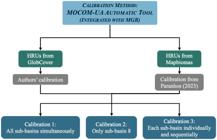
The second parameter set (Calibration 2) was also developed using the HRUs from GlobCover and applied uniformly across all sub-basins. However, in this case, calibration was performed considering only the outlet gauging station (sub-basin 8), where the outlet of the Iguaçu River basin is located. The optimization algorithm adjusted the global parameter set based exclusively on the performance at this station. In this case, no aggregation across stations was required, as the objective functions were computed solely at the outlet. This approach prioritizes reproducing discharge dynamics at the basin outlet, potentially at the expense of performance in upstream sub-basins and allows evaluating the trade-off between spatially distributed performance and outlet-focused calibration.
The third parameter set (Calibration 3) was adopted from Paranhos (2023) and represents an independent calibration previously developed for the same basin. In that study, the basin was subdivided into four sub-basins corresponding to groupings of the eight sub-basins considered here, which allowed the direct use of this parameter set. In this case, calibration was carried out individually for each sub-basin and subsequently combined.
The automatic calibration of the MGB model is based on multiple objective functions, including the Nash–Sutcliffe Efficiency (NSE), the logarithmic Nash–Sutcliffe Efficiency (logNSE), and the relative volume error (Bias). In this study, NSE and logNSE were prioritized in the objective function formulation to improve the representation of hydrograph dynamics and low-flow conditions, while Bias was used as an additional diagnostic metric to assess volumetric errors.
The use of these different parameter sets enabled an assessment of the model’s sensitivity to distinct calibration strategies, all of which are potentially applicable by water-resources managers depending on their experience with the model, available time and deadlines, required level of accuracy, and the specific objectives of the study. Rather than explicitly treating these strategies as formal uncertainty scenarios, they are used here to explore the variability in model responses associated with different plausible parameterizations.
In summary, we conducted six simulations as part of this experimental plan (Table 3), resulting from the combination of the three different calibrations strategies with two HRU configurations derived from different LULC datasets. This approach allowed a comparative analysis of the simulation results and their implications for flow duration curves.
Simulations conducted using different combinations of calibrations and LULC datasets for HRU Generation.
RESULTS
Preprocessing of spatial data
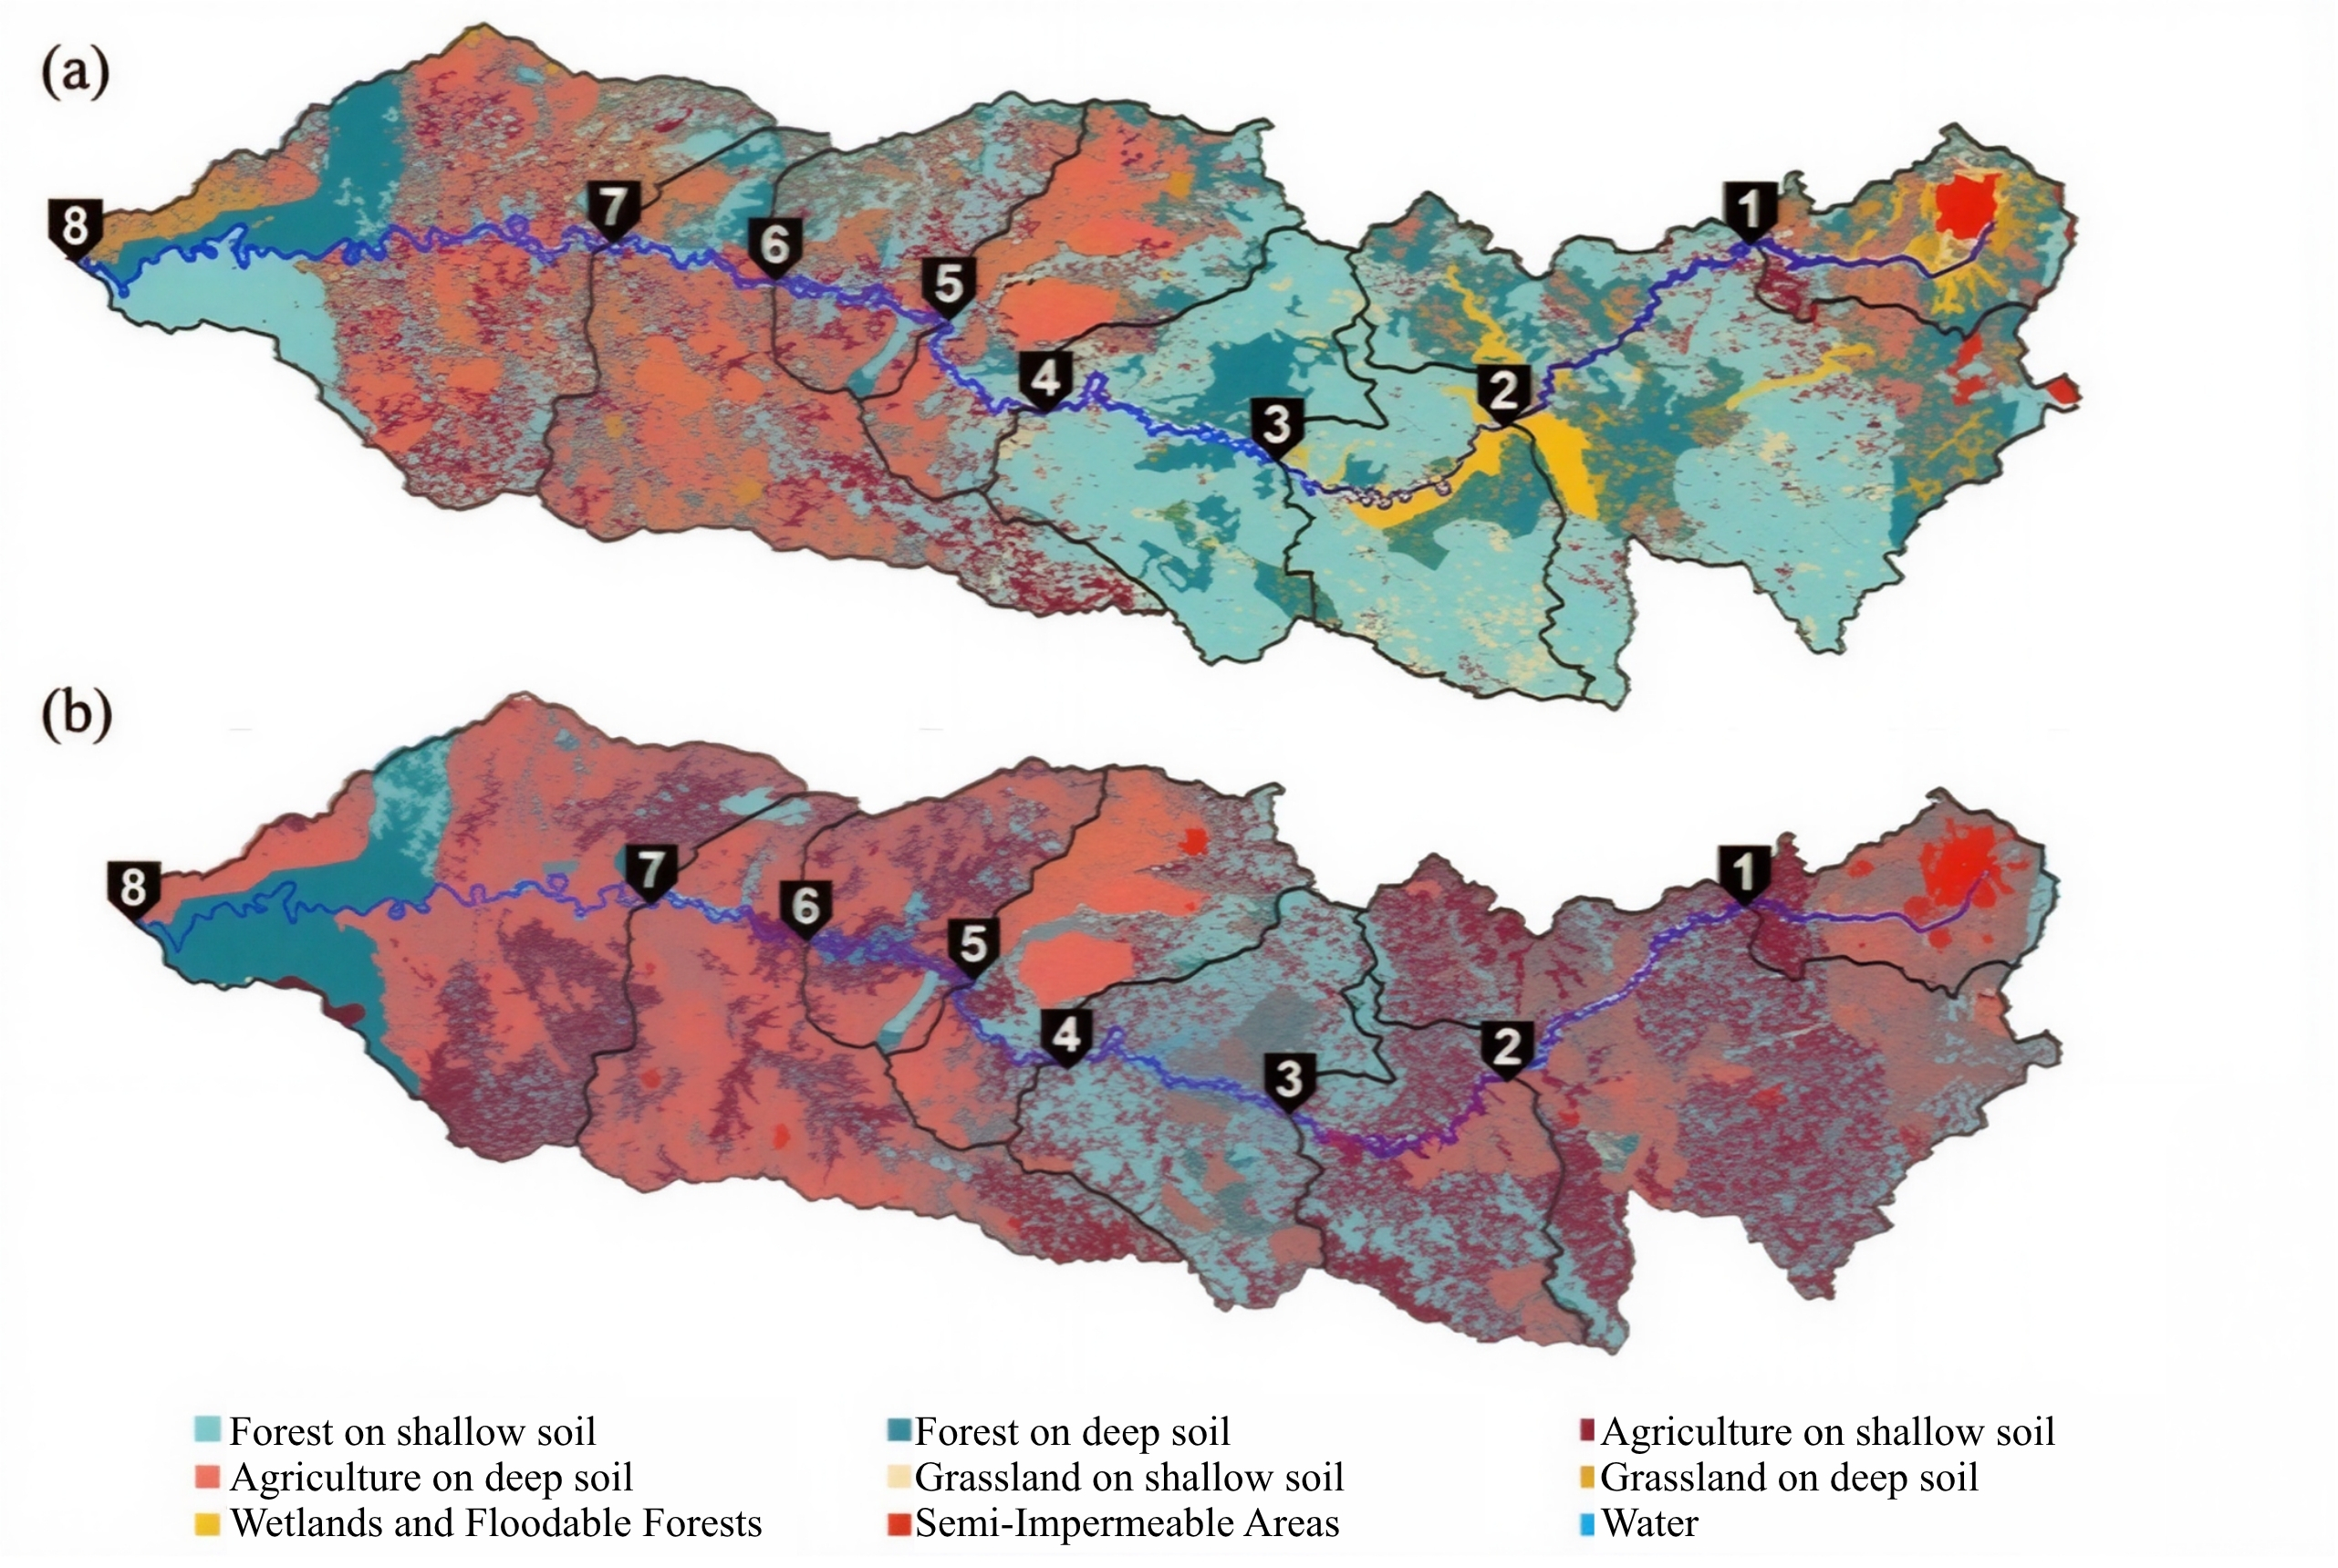
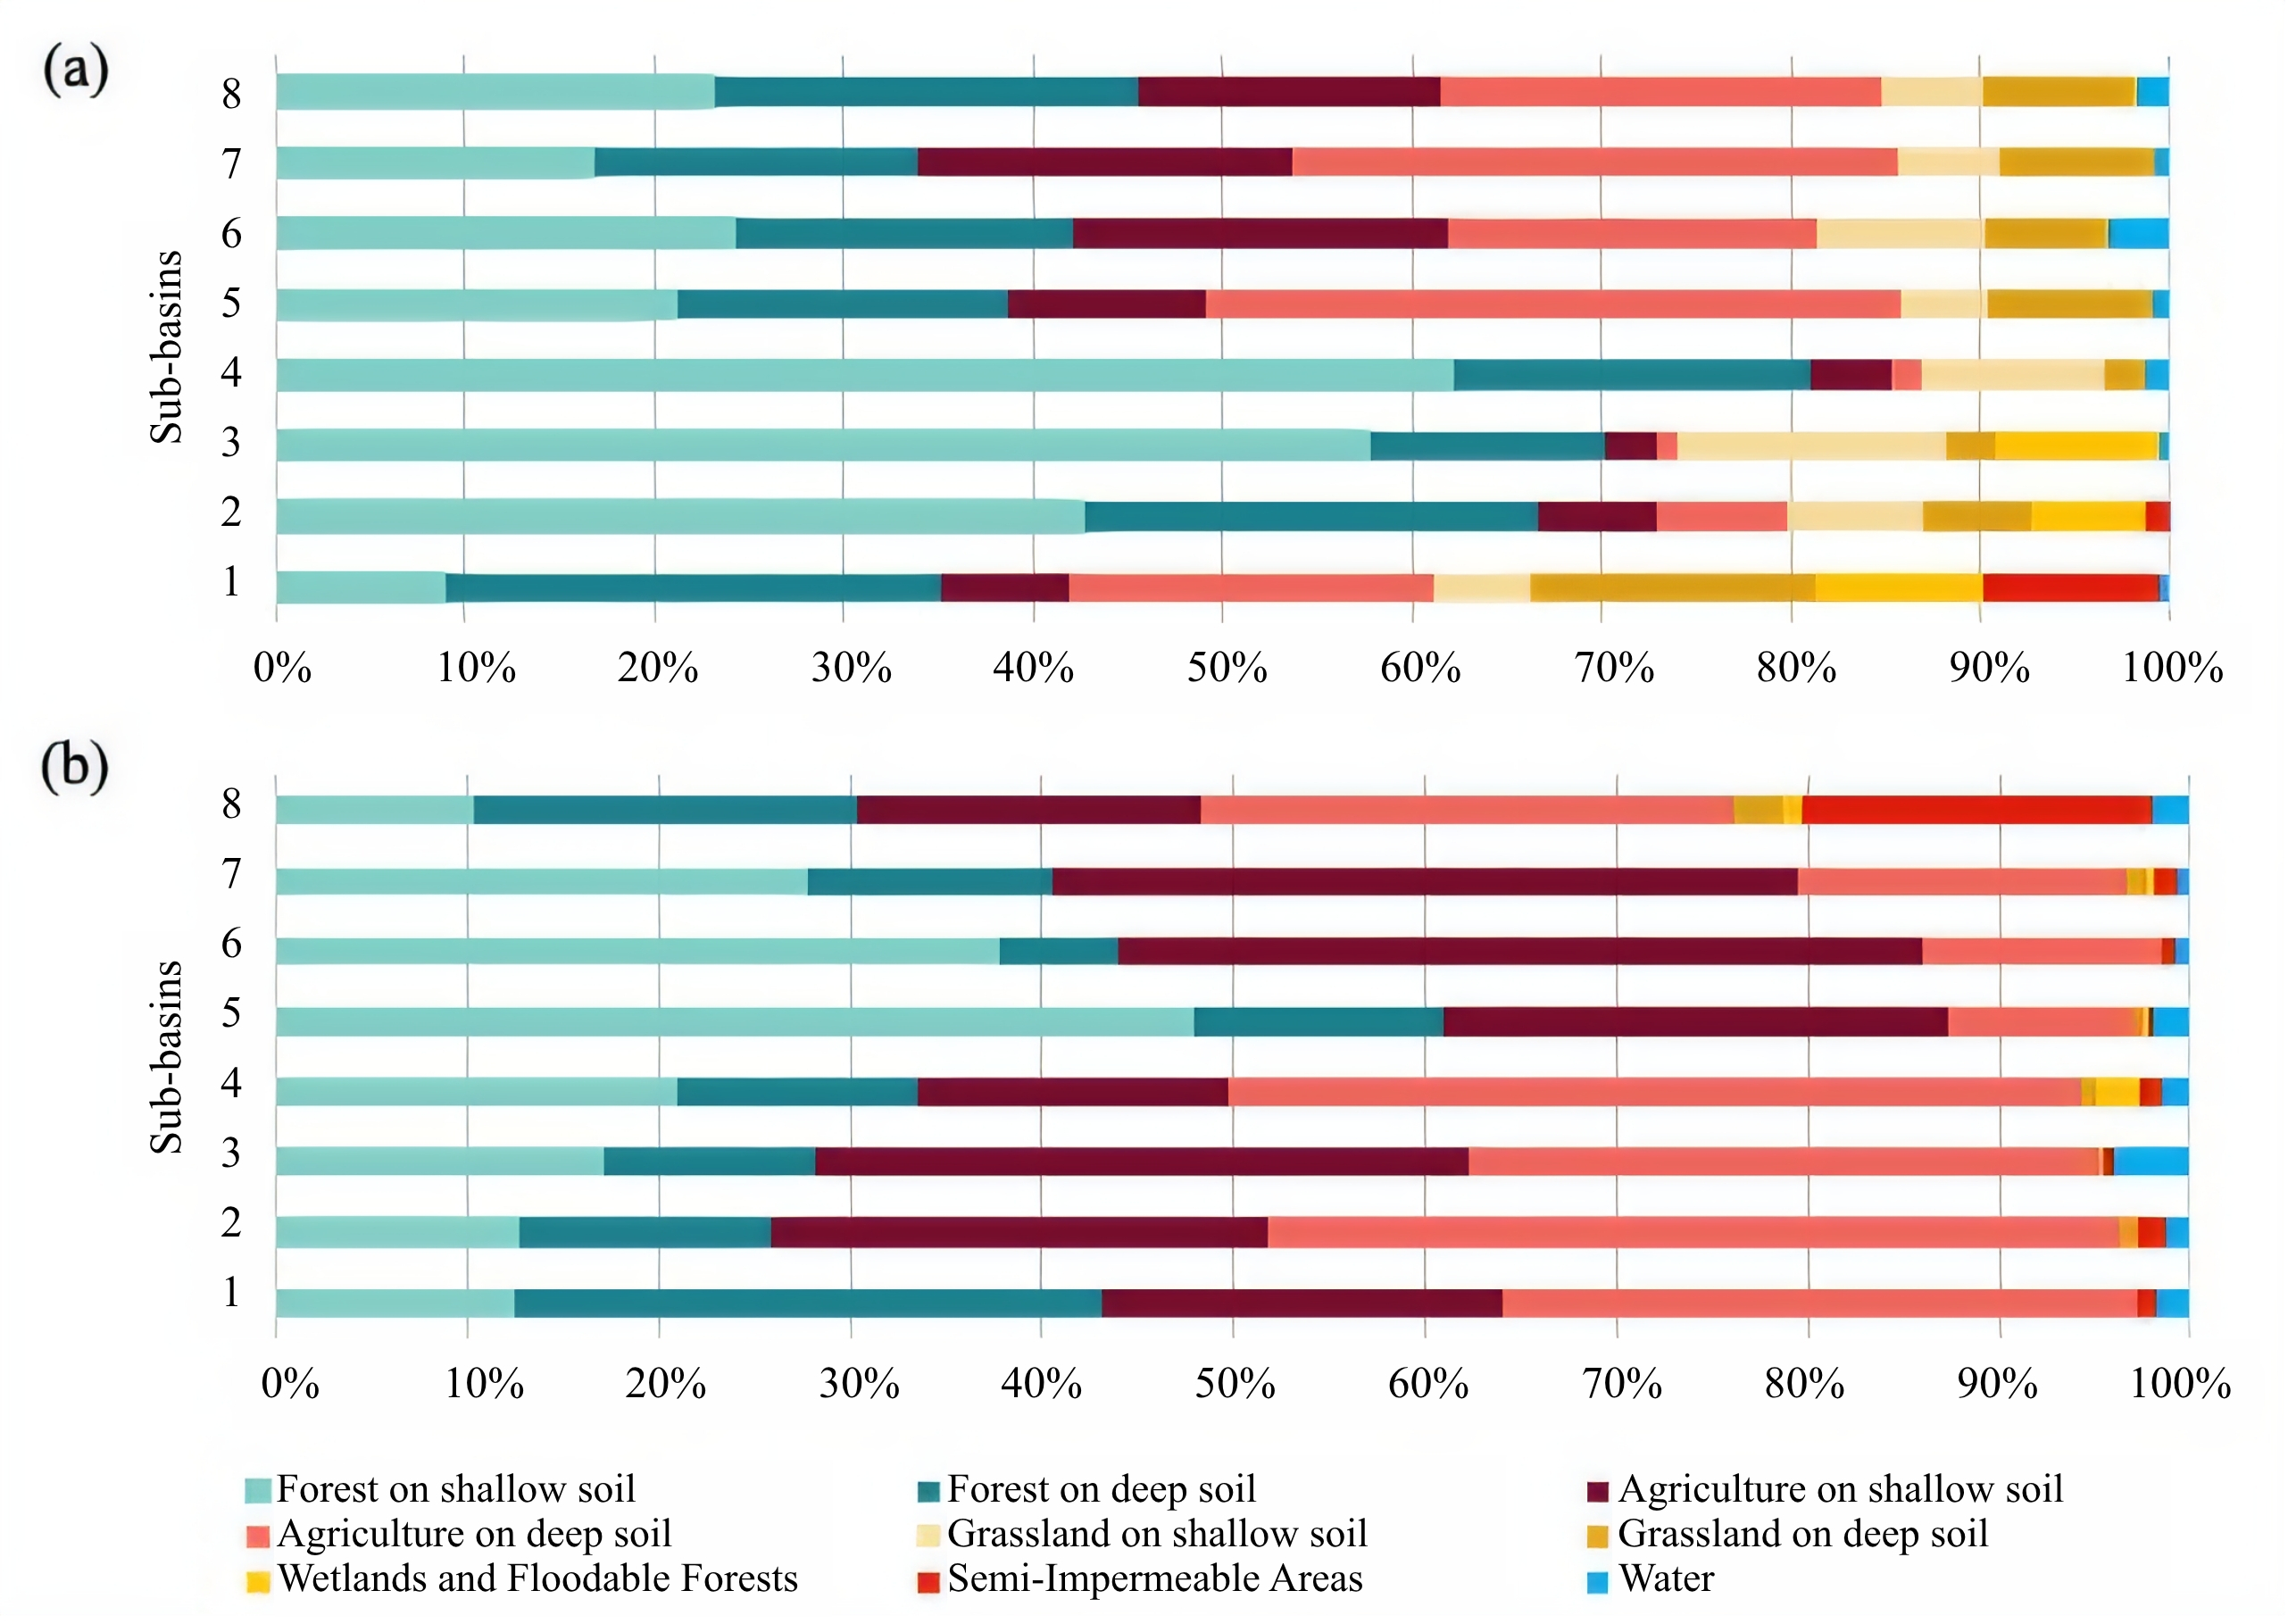
The processing of spatial datasets using IPH-Hydro Tools (Siqueira et al., 2016) resulted in the discretization of the Iguaçu River Basin. The DEM enabled basin delineation, drainage network definition, and mini-catchments determination (Figure 3 in supplementary material). Combined with land use and land cover (LULC) information and soil depth data, this processing led to the definition of HRUs for the entire basin (Figure 6) and the quantitative distribution of HRUs classes in each sub-basin (Figure 7).
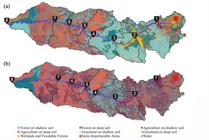
HRUs for the Iguaçu River Basin derived from different LULC datasets: (a) GlobCover (Arino et al., 2012); (b) MapBiomas (2022). Gauges are numbered from upstream (1) to downstream (8).
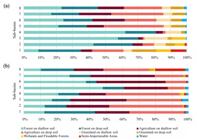
Distribution of HRU classes in each sub-basin according to: (a) GlobCover LULC (Arino et al., 2012), and (b) MapBiomas (2022) LULC.
Overall, the GlobCover (Figure 6a) exhibit greater spatial continuity and a predominance of classes associated with natural vegetation, reflecting a more generalized representation of LULC and a reduced level of detail in anthropogenic transitions. In contrast, MapBiomas (Figure 6b) show a higher contribution and stronger fragmentation of agricultural and other anthropogenic classes, forming more complex mosaics across the sub-basins, including headwater regions. These differences lead to a larger number of smaller and more heterogeneous HRUs from MapBiomas, whereas GlobCover tends to aggregate extensive areas under similar classes.
When the sub-basins are analyzed individually, considering their respective outlet gauges (1–8 in Figure 6), the spatial distribution of both HRUs shows the presence of agricultural areas on shallow and deep soils in the center-west portion of the basin (from gauges 4 to 7), as well as forests areas on shallow and deep soils in the central region (between gauges 3 and 4). However, marked differences are observed in the eastern sector of the basin (between gauges 1 and 3). In this area, HRUs from Mapbiomas indicate a predominance of agriculture areas on both shallow and deep soils, whereas HRUs from GlobCover are mainly characterized by forests on shallow soils. In addition, GlobCover (Arino et al., 2012) indicates the presence of wetlands and floodable forests in the vicinity of gauge 2, which are not represented in the HRUs derived from Mapbiomas (2022).
Additionally, Figure 7 presents the percentage of HRU classes within each sub-basin for both datasets. The quantitative differences observed between the two LULC datasets indicate substantial variations in the relative contribution of HRU classes across the sub-basins.
The distribution of HRU derived from GlobCover data (Figure 7a) shows a notable presence of semi-impermeable areas, including urban land uses, only in the first two sub-basins (9% in sub-basin 1, 1% in sub-basin 2). This pattern occurs despite the existence of cities with significant urban areas in others sub-basins, such as Guarapuava, União da Vitória, Palmas, Pato Branco, and Francisco Beltrão. Overall, forests areas account for 54% of the basin, whereas agriculture represents 23%.
In contrast, the HRU Mapbiomas-based (Figure 7b) indicates that forest areas cover 40% of the entire basin, while agricultural land occupies about 56%. Moreover, there is a presence of semi-impermeable areas in all sub-basins, which were not identifiable in the information from GlobCover (Arino et al., 2012), highlighting the influence of dataset choice on HRU representation.
It is important to note that the MapBiomas dataset represents LULC conditions for 2021, whereas GlobCover refers to 2009. However, an additional analysis using MapBiomas data for 2009 indicated that the overall spatial distribution of LULC classes in the basin remained largely consistent over time (see Figures 4 and 5 in the Supplementary Material). Furthermore, it is worth noting that the HRU parameterization developed by Fan et al. (2015) based on GlobCover (Arino et al., 2012), remains widely used in studies and operational water resources management applications involving the MGB model. Given the limited variation between these datasets, the most recent MapBiomas data (2022) was adopted in this study.
Therefore, the differences observed between the HRU configurations are primarily attributed to differences in dataset characteristics (e.g., classification methodology, spatial resolution, and thematic detail), rather than to significant temporal changes in land use and land cover within the study period. This reinforces that the uncertainty associated with HRU definition in this study is predominantly related to dataset selection rather than temporal variability in LULC.
Calibration and validation
The calibration results for the Nash–Sutcliffe Efficiency (NSE) coefficients for all sub-basins are presented in Table 4. Model performance was also evaluated using the logarithmic form of the NSE and the Bias index (see Tables 4 and 5 in the Supplementary Material). Overall, the best calibration results were obtained using the GlobCover-based HRUs, especially for CG3 with NSE values from 0.631 to 0.733 for the specific sub-basins. Among the MapBiomas-based HRUs, MB3 achieved the highest NSE values overall (NSE 0.214 to 0.563).
It is important to highlight that experimental design enables the assessment of calibration transferability between different LULC datasets. In this context, MB1 and MB2 were performed using parameter sets calibrated with GlobCover-based HRUs, whereas MB3 used a parameter set specifically calibrated with MapBiomas.
The results indicate that MB3 generally outperforms MB1 and MB2, particularly in sub-basin 1, demonstrating that the calibration consistent with the LULC dataset improves model performance. In the remaining sub-basins, MB3 shows performance comparable to MB1 and MB2, although with a slight overall improvement.
However, even when using a dedicated calibration, MapBiomas-based simulations still tend to present slightly lower performance than GlobCover-based simulations, especially when compared to GC3. This suggests that the observed differences are not solely related to calibration strategy, but also to intrinsic characteristics of the LULC datasets.
For the validation analysis (2002–2007) (Table 5), simulations based on GlobCover-derived HRUs continued to outperform those based on MapBiomas in most sub-basins, with GC3 showing the best overall predictive performance. Although NSE values decreased relative to the calibration analysis, the GlobCover-based configurations demonstrated higher spatial NSE compared to MapBiomas. For example, GC3 has a range of 0.421 to 0.527 across the sub-basins. Sub-basins 7 consistently showed poor performance across all configurations, whereas sub-basin 3 remained the most reliably simulated during validation (NSE = 0.757).
Notably, sub-basin 7 consistently exhibited the poorest performance across all calibration strategies, while sub-basin 3 showed, on average, the best model performance. This pattern may be associated with the spatial distribution of flow regulation within the basin. Up to sub-basin 3, there is no influence of reservoirs on the observed flows and are therefore closer to the naturalized flow conditions simulated by the model. In contrast, sub-basins 7 and 8 are affected by the cumulative operation of upstream reservoirs, which is not explicitly represented in the model structure. This likely contributes to the systematic reduction in model performance observed in downstream sub-basins, regardless of the calibration strategy or LULC dataset adopted.
Simulation results
The hydrographs and flow duration curves resulting from the six different simulations of all sub-basins are shown in Figure 6 in the supplementary material. These figures also include observed flows from ANA (Brazilian National Water and Sanitation Agency, 2022) and naturalized flows from the National Electric System Operator (2022) for comparison purposes. Naturalized flows correspond to the streamflows that would occur in the absence of anthropogenic influences and are estimated using different approaches depending on reservoir presence: prior to reservoir construction, they are derived from observed or regionally correlated streamflow records, adjusted by adding consumptive water uses; after reservoir implementation, and reconstructed through reservoir water balance calculations, in which inflows are obtained from outflows, diversions, and storage variations. Incremental flows between successive developments are then computed by incorporating consumptive uses, evaporation, and additional derivations, followed by consistency procedures to reduce artificial fluctuations. Finally, naturalized flows at each location are obtained by combining upstream contributions propagated under natural conditions with the adjusted incremental flows, ensuring spatial consistency along the river system.
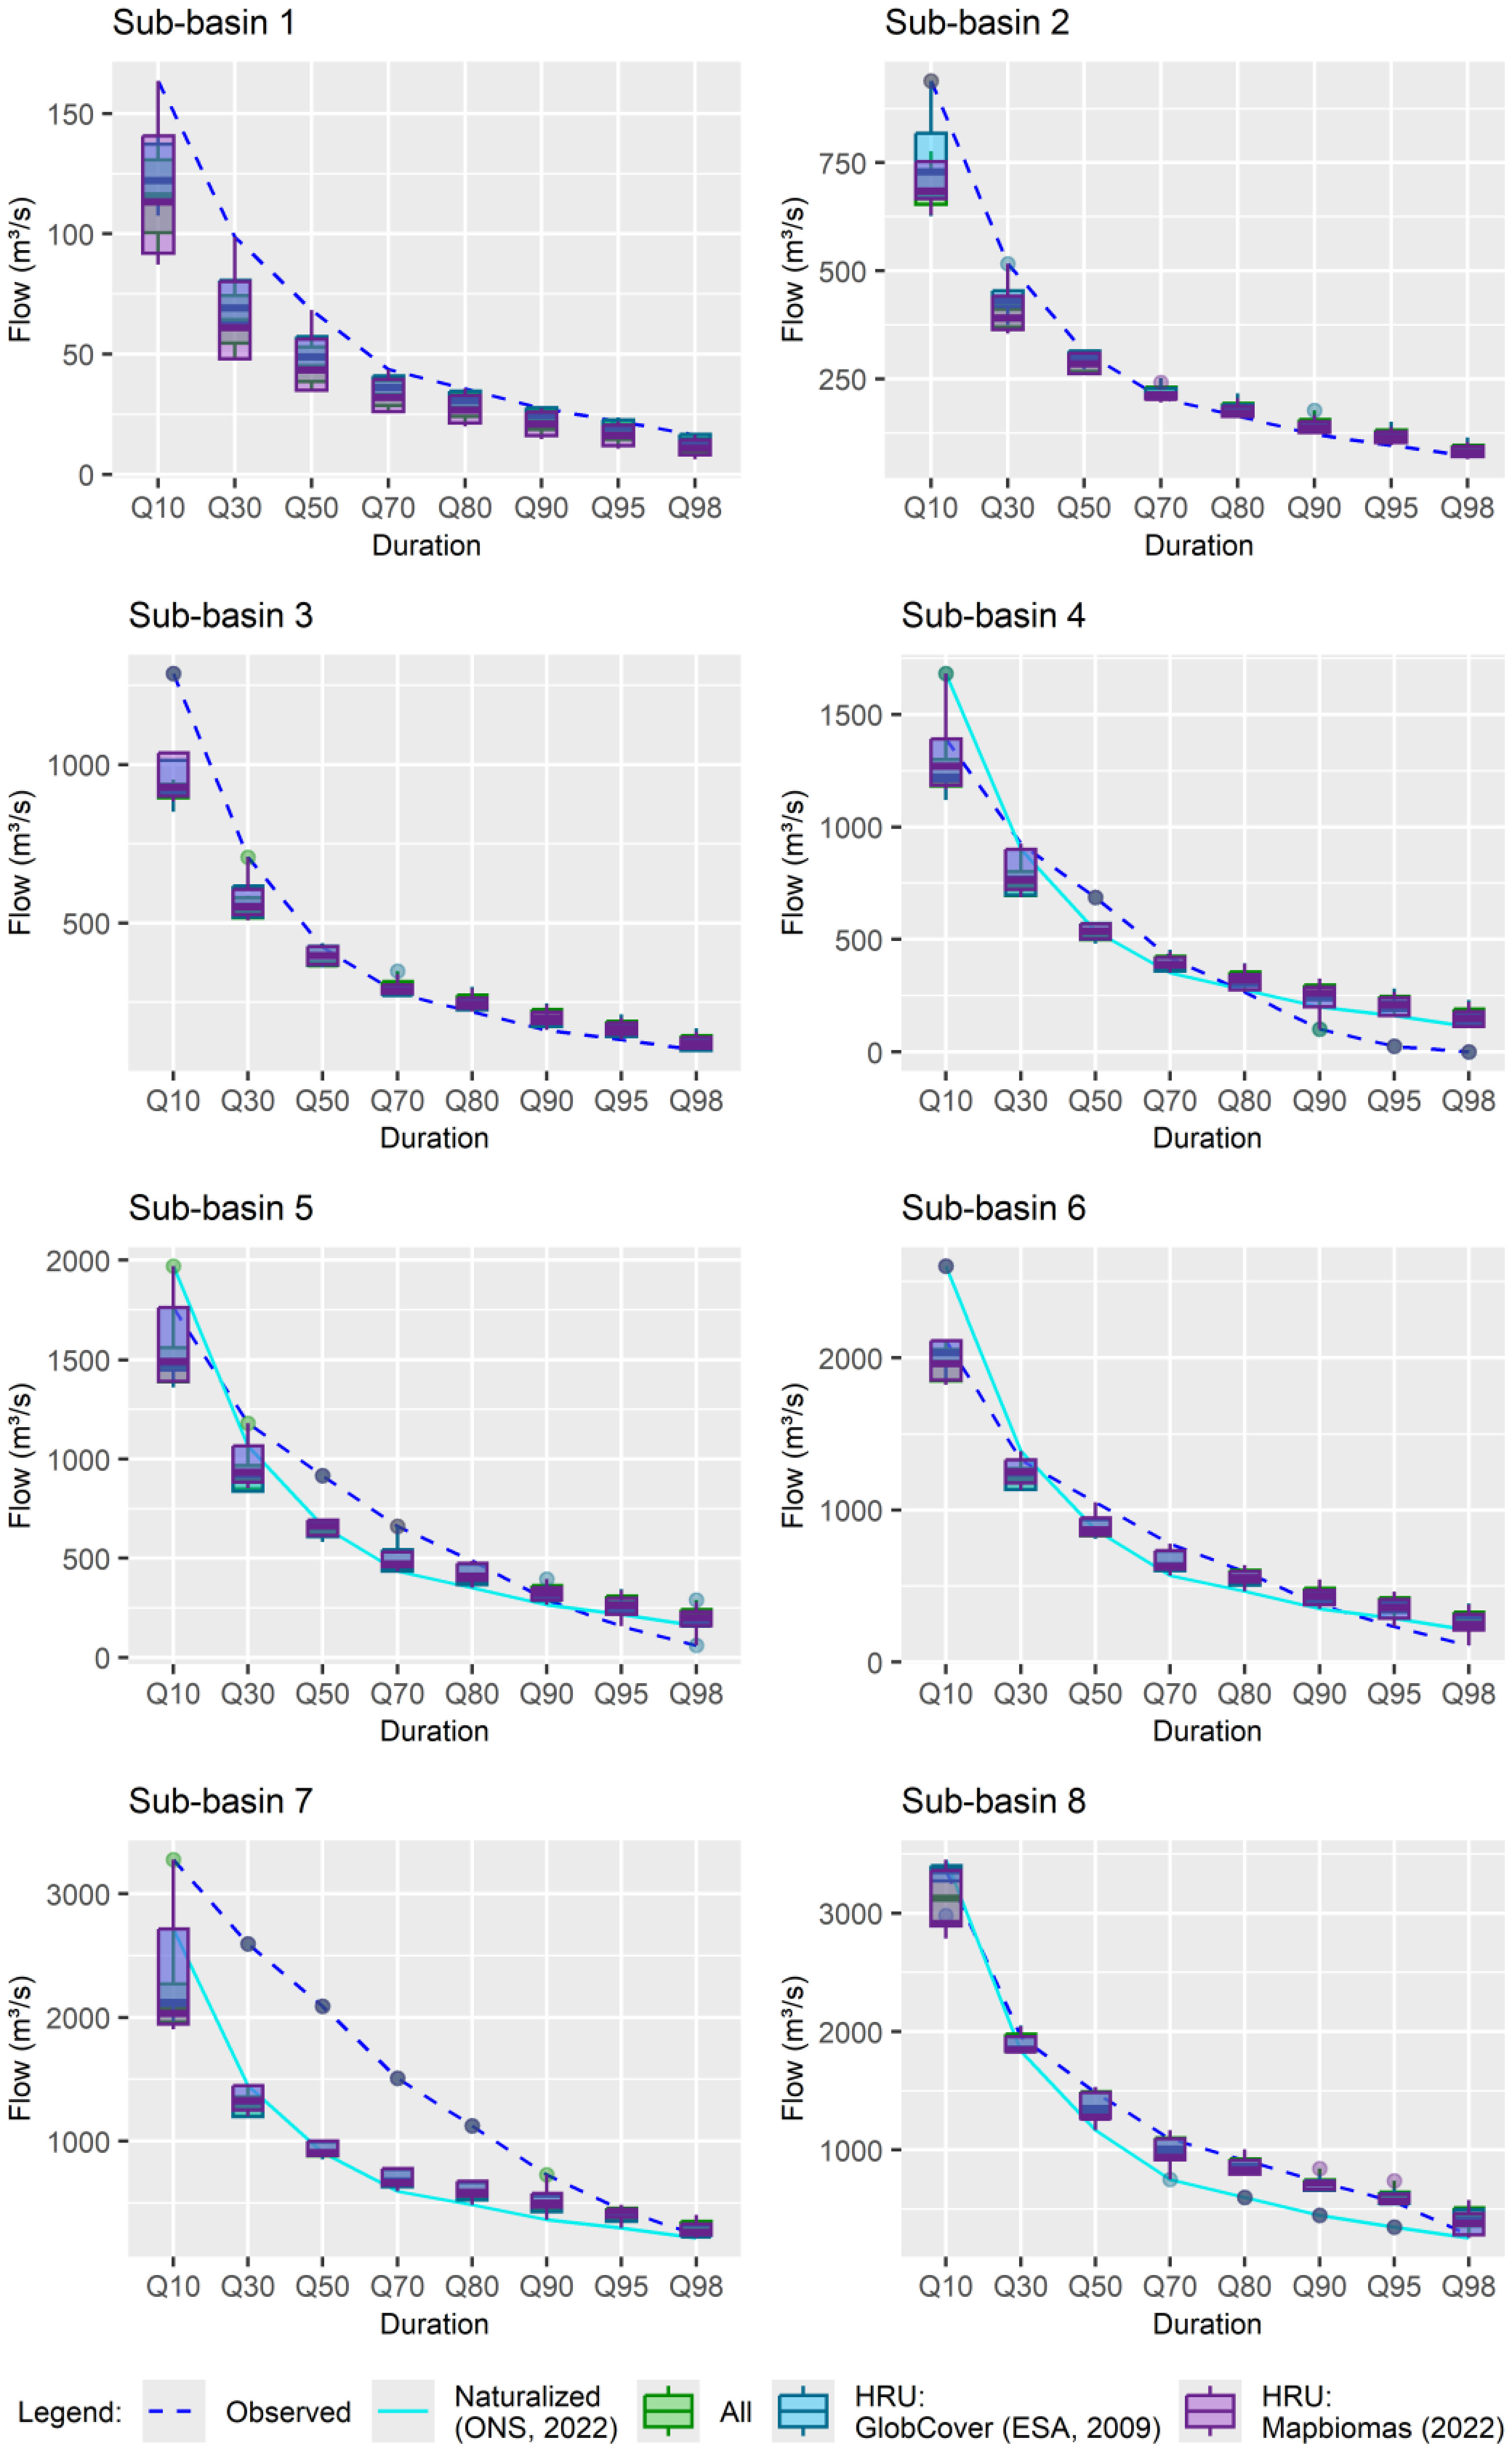
To more closely examine the effects of different simulations on flows with varying durations, box-plots were generated (Figure 8).
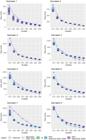
Flow variations are greatest in shorter durations (<Q50) and less significant in longer durations (>Q90). This is expected as long-duration flows, sustained by aquifer discharges, show less sensitivity to LULC changes. However, when in percentage terms, the most significant differences are in long-duration minimum flows. Table 6 presents the percentage difference between the highest and lowest values obtained among the results of the six simulations performed, for each of the reference flow durations. In the upper part of the table, these results are compared with the naturalized flows from NOS (National Electric System Operator, 2022), while in the lower part the comparison is made using the observed flows, which therefore include the influence of existing reservoirs. Interestingly, for Q90 as an example, the percentual difference between the highest (warmer colors) and lowest (cooler colors) for each sub-basin has 39% for SB4, 31% for SB5, 36% for SB6, 37% for SB7 and 47% for SB8, with an overall average for the whole basin of 38%. The same conditions are verified for observed and with reservoir influence. That difference indicates how relevant is for water resources planning and management, considering this uncertainty in terms of water availability.
Percentual difference between the highest (reddish colors) and lowest (greenish colors) simulated flows for each duration.
The average difference in key natural minimum flows (Q90 – 38%, Q95, – 42% and Q98 – 49%) for water management 43%, indicating small but significant absolute flow differences for decision-making, such as water use permits (Acreman & Dunbar, 2004; Smakhtin, 2001). Additionally, this shows that reproducing natural processes and estimating their effects is still challenging especially based on modeling simplifications and data limitations (Badham et al., 2019; Gupta et al., 2008).
Despite the study area encompassing a watershed with good hydrological monitoring and no history of drought events, the recent episode of water scarcity between 2018 and 2021 affected various economic sectors and the water supply for thousands of people, indicating the need for improved practices in terms of water resources management in response to extreme events.
One recommendation is to re-evaluate the use of a fixed value for water availability (e.g. Q95 is typically used). Estimating available water as an absolute value falls into a paradox, as it can vary based on the quantification methodology, the LULC database used in modeling, the calibration strategy, the analyzed period, and other factors.
When using water availability ranges, decision-making involves uncertainty. Consequently, decisions on water use permits should not rely solely on binary grant/deny outcomes. Instead, permit approval should be based on a probability threshold set by the manager and socio-hydrology concepts (Almeida et al., 2025). This approach requires support from a probabilistic weather forecasting system to assess whether future scenarios are likely to occur with a probability exceeding the defined threshold (Lopez & Haines, 2017). If the probability exceeds the threshold, the user is permitted to withdraw the originally requested amount of water; otherwise, the withdrawal is reduced.
Such a probabilistic decision-making process must be supported by a suitable regulatory framework. Ensuring the quality of weather forecasting systems (Pagano et al., 2024) and implementing short-term contractual arrangements are necessary. Multiple short-term contracts with varying levels of reliability, as proposed by Sankarasubramanian et al. (2009), could also be introduced. The authors advocate for a participatory approach in negotiating such contracts, which could apply here in defining the probability threshold. Adopting water availability ranges is valuable when integrated with water resources management instruments, such as water use permits and fees, which are closely linked to the preservation of water availability. This recommendation benefits water resources management and planning practitioners given the importance of these activities for the sustainability of the socio-environmental system.
The basin's water allocation criterion, based on 50% of Q95 after deducting upstream water use (Institute of Waters of Paraná, 2006), serves as the reference. The analysis focuses on the upstream sub-basin, where the largest population centers and cities within the basin are concentrated. In this sub-basin, the Q95 flow averages 17.5 m3/s, ranging from 10.6 to 23.8 m3/s. Although the 13.2 m3/s difference may appear relatively low, it represents a 55% variance between the highest and lowest simulated flows in this sub-basin (Table 6) and directly impacts the permitted water withdrawal in the region. Additionally, minimum flow variations, as seen in water use permits, can reduce ecological flow, potentially harming ecosystems dependent on this water body. Conversely, restricting water use could negatively impact the region’s socioeconomic development potential.
One possible approach is adopting risk levels based on the range of flows related to water availability, associating percentiles of this flow range with water resource management instruments. For instance, in the referenced sub-basin 1, when the total allocated flow reaches 5.3 m3/s—equivalent to 50% of 10.6 m3/s, the lower limit of the flow range obtained through simulations—water use charges could promote consumption rationalization. This charge could then be progressively increased as the required flow rises, up to a maximum of 11.9 m3/s (50% of 23.8 m3/s, the highest flow simulated), representing the highest allocable flow within the sub-basin.
CONCLUSIONS
Estimating water availability is a central element of water resources planning and management, being directly associated with regulatory instruments such as water permits and allocation rules. However, this study demonstrates that such estimates are strongly conditioned by methodological choices inherent to hydrological modeling, particularly land use and land cover (LULC) representation and the calibration strategies adopted.
The application of the distributed MGB hydrological model to the Iguaçu River basin, combining two contrasting LULC datasets and three calibration approaches, revealed substantial variability in simulated streamflows, especially for long-duration (low) flows. Average differences between simulations reached approximately 38% for Q90, 42% for Q95, and nearly 50% for Q98—values that are directly relevant to water allocation criteria widely used in management practice. These results indicate that the adoption of single, fixed water-availability indicators may conceal important structural uncertainties and lead to suboptimal decisions from hydrological, environmental, and socioeconomic perspectives.
Comparisons between the LULC products showed that more recent and detailed datasets, such as MapBiomas, tend to represent anthropogenic landscape fragmentation more realistically, although this does not necessarily translate into superior statistical model performance when assessed solely using traditional goodness-of-fit metrics. This finding reinforces that classical hydrological performance indicators, such as the Nash–Sutcliffe Efficiency, are insufficient on their own to evaluate the suitability of simulations intended for water-availability assessment, particularly in regulated basins with multiple water uses, and additional studies are required.
In this context, the study supports treating water availability as a range of plausible values rather than as a single deterministic number. The adoption of availability ranges derived from different combinations of datasets, time periods, and calibration strategies enables the explicit incorporation of uncertainty into decision-making and provides a more robust basis for adaptive and risk-informed water management. This approach is especially relevant in regions with limited hydrometric monitoring and under increasing climatic and anthropogenic pressures.
Finally, the results indicate that incorporating water-availability ranges into management instruments—such as water permits, abstraction charges, and environmental flow definitions—can contribute to greater water security, regulatory transparency, and socio-environmental system sustainability. Future research may extend this framework by integrating climate change scenarios, future land-use dynamics, and explicit reservoir management strategies, further strengthening the role of hydrological modeling as qualified support for decision-making in water resources management.
Supplementary Material
Supplementary material accompanies this paper.
Figure 1
Figure 2
Figure 3
Table 1
Table 2
Table 3
Figure 4
Figure 5
Table 4
Table 5
Figure 6
This material is available as part of the online article from https://doi.org/10.1590/2318-0331.312620250171
DATA AVAILABILITY STATEMENT
Research data is available in the body of the article.
ACKNOWLEDGEMENTS
The authors would like to thank the financial support for the research from CAPES and CNPq, Brazilian research funding agencies. We would like to thank for the anonymous reviewer who, through his positive and constructive thorough review, made this paper stronger.
REFERENCES
-
Acreman, M. C., & Dunbar, M. J. (2004). Defining environmental river flow requirements – a review. Hydrology and Earth System Sciences, 8, 861-876. http://dx.doi.org/10.5194/hess-8-861-2004
» http://dx.doi.org/10.5194/hess-8-861-2004 -
Almeida, C. de C., Kissula, J. C. J., Carvalho, J. M., Ferreira, D. M., Coelho, M., Detzel, D. H. M., & Fernandes, C. V. S. (2025). A socio-hydrology approach to domestic organic pollutant load removal: duration curve analysis for enhancing water quality management. RBRH, 30, e49. http://dx.doi.org/10.1590/2318-0331.302520250091
» http://dx.doi.org/10.1590/2318-0331.302520250091 -
Arino, O., Ramos Pérez, J. J., Kalogirou, V., Bontemps, S., Defourny, P., & Van Bogaert, E. (2012). Global land cover map for 2009 (GlobCover 2009). European Space Agency (ESA) & Université catholique de Louvain (UCL). https://doi.org/10.1594/PANGAEA.787668
» https://doi.org/10.1594/PANGAEA.787668 -
Arsenault, R., Brissette, F., & Martel, J. L. (2018). The hazards of split-sample validation in hydrological model calibration. Journal of Hydrology (Amsterdam), 566(September), 346-362. http://dx.doi.org/10.1016/j.jhydrol.2018.09.027
» http://dx.doi.org/10.1016/j.jhydrol.2018.09.027 -
Arsiso, B. K., & Mengistu Tsidu, G. (2023). Land use and land cover change modulates hydrological flows and water supply to Gaborone Dam Catchment, Botswana. Water (Basel), 15(19), 3364. http://dx.doi.org/10.3390/w15193364
» http://dx.doi.org/10.3390/w15193364 - Badham, J., Elsawah, S., Guillaume, J. H., Hamilton, S. H., Hunt, R. J., Jakeman, A. J., et al (2019). Effective modeling for Integrated Water Resource Management: a guide to contextual practices by phases and steps and future opportunities. Environmental Modelling & Software, 116, 40-56.
-
Baran-Gurgul, K., & Rutkowska, A. (2024). Water resource management: hydrological modelling, hydrological cycles, and hydrological prediction. Water (Basel), 16(24), 3689. http://dx.doi.org/10.3390/w16243689
» http://dx.doi.org/10.3390/w16243689 -
Blöschl, G., Bierkens, M. F. P., Chambel, A., Cudennec, C., Destouni, G., Fiori, A., et al (2019). Twenty-three unsolved problems in hydrology (UPH) – a community perspective. Hydrological Sciences Journal, 64(10), 1141-1158. http://dx.doi.org/10.1080/02626667.2019.1620507
» http://dx.doi.org/10.1080/02626667.2019.1620507 - Brazilian Institute of Geography and Statistics – IBGE. (2021). Continuous Cartographic Base of Brazil, 1:250,000 scale – BC250. Version 2021. Pedology Shapefile Rio de Janeiro: IBGE. (in Portuguese)
-
Brazilian National Water and Sanitation Agency – ANA. (2021a). Overview of Water Resources in Brazil 2021 Retrieved in 2025, October 15, from http://relatorio-conjuntura-ana-2021.webflow.io (in Portuguese)
» http://relatorio-conjuntura-ana-2021.webflow.io -
Brazilian National Water and Sanitation Agency – ANA. (2021b). Joint Technical Note No. 3/2021/SRE/SOE/SFI/SPR/SGH Retrieved in 2025, October 15, from https://www.gov.br/ana/pt-br/assuntos/monitoramento-e-eventos-criticos/eventos-criticos/salas-de-acompanhamento/parana/NTC_3_2021_ANA.pdf (in Portuguese)
» https://www.gov.br/ana/pt-br/assuntos/monitoramento-e-eventos-criticos/eventos-criticos/salas-de-acompanhamento/parana/NTC_3_2021_ANA.pdf -
Brazilian National Water and Sanitation Agency – ANA. (2021c). ANA Resolution No. 77 of June 1, 2021. Declares a critical situation of quantitative water scarcity in the Paraná River Basin. Retrieved in 2025, October 15, from https://www.gov.br/ana/pt-br/assuntos/monitoramento-e-eventos-criticos/eventos-criticos/salas-de-acompanhamento/parana/ResolucaoANA771junho2021.pdf (in Portuguese)
» https://www.gov.br/ana/pt-br/assuntos/monitoramento-e-eventos-criticos/eventos-criticos/salas-de-acompanhamento/parana/ResolucaoANA771junho2021.pdf -
Brazilian National Water and Sanitation Agency – ANA. (2022). Hydroweb Portal. National Water Resources Information System (SNIRH). Retrieved in 2025, October 15, from https://www.snirh.gov.br/hidroweb/apresentacao (in Portuguese)
» https://www.snirh.gov.br/hidroweb/apresentacao -
Brêda, J. P. L. F., Cauduro Dias de Paiva, R., Siqueira, V. A., & Collischonn, W. (2023). Assessing climate change impact on flood discharge in South America and the influence of its main drivers. Journal of Hydrology (Amsterdam), 619, 129284. http://dx.doi.org/10.1016/j.jhydrol.2023.129284
» http://dx.doi.org/10.1016/j.jhydrol.2023.129284 - Brunner, M. I., Gurung, A. B., Zappa, M., Zekollari, H., Farinotti, D., & Stähli, M. (2019). Present and future water scarcity in Switzerland: potential for alleviation through reservoirs and lakes. The Science of the Total Environment, 666, 1033-1047.
-
Chagas, V. B. P., Chaffe, P. L. B., Addor, N., Fan, F. M., Fleischmann, A. S., Paiva, R. C. D., & Siqueira, V. A. (2020). CAMELS-BR: hydrometeorological time series and landscape attributes for 897 catchments in Brazil. Earth System Science Data, 12, 2075-2096. http://dx.doi.org/10.5194/essd-12-2075-2020
» http://dx.doi.org/10.5194/essd-12-2075-2020 - Chatrabhuj, K. M., Mishra, U., & Omar, P. J. (2024). Integration of remote sensing data and GIS technologies in river management system. Discover Geoscience, 2(1), 67.
- Chow, V. T., Maidment, D. R., & Mays, L. W. (1988). Applied Hydrology New York: McGraw-Hill Book Company.
-
Collischonn, W., Allasia, D. D. A., Silva, B. C., & Tucci, C. E. (2007). The MGB-IPH model for large-scale rainfall: runoff modelling. Hydrological Sciences Journal, 52(5), 878-895. http://dx.doi.org/10.1623/hysj.52.5.878
» http://dx.doi.org/10.1623/hysj.52.5.878 -
Collischonn, W., Gama, C. H. A., Siqueira, V. A., Paiva, R. C. D., & Fleischmann, A. S. (2020). Theoretical Reference Manual for MGB UFRGS. Retrieved in 2025, October 15, from https://www.ufrgs.br/hge/mgb/downloads/mgb-4-6-2/
» https://www.ufrgs.br/hge/mgb/downloads/mgb-4-6-2 -
Dash, S. S., Naik, B., & Kashyap, P. S. (2024). Assessment of land use/ land cover change derived catchment hydrologic response: an integrated parsimonious hydrological modeling and alteration analysis based approach. Journal of Environmental Management, 356, 120637. http://dx.doi.org/10.1016/j.jenvman.2024.120637
» http://dx.doi.org/10.1016/j.jenvman.2024.120637 -
Dile, Y. T., Tekleab, S., Ayana, E. K., Gebrehiwot, S. G., Worqlul, A. W., Bayabil, H. K., Yimam, Y. T., Tilahun, S. A., Daggupati, P., Karlberg, L., & Srinivasan, R. (2018). Advances in water resources research in the upper blue nile basin and the way forward: a review. Journal of Hydrology (Amsterdam), 560, 407-423. https://doi.org/10.1016/j.jhydrol.2018.03.042
» https://doi.org/10.1016/j.jhydrol.2018.03.042 -
Fagundes, H. O., Paiva, R. C. D., Breda, J. P. L. F., Fassoni-Andrade, A. C., Borrelli, P., & Fan, F. M. (2023). An assessment of South American sediment fluxes under climate changes. The Science of the Total Environment, 879, 163056. http://dx.doi.org/10.1016/j.scitotenv.2023.163056
» http://dx.doi.org/10.1016/j.scitotenv.2023.163056 - Fan, F. M., Buarque, D. C., Pontes, P. R. M., & Collischonn, W. (2015). An hydrological response units map for all South America. In XXI Simpósio Brasileiro de Recursos Hídricos (pp. PAP019919). Brasília, DF: Simpósio Brasileiro de Recursos Hídricos. [in Portuguese]
-
Ferreira, D. B., Mühlenhoff, A. P., & Fernandes, C. V. S. (2018). Diffuse pollution models: challenges, strategies, and impact on water resources management. Latin America Water Management Journal, 15, e10. https://doi.org/10.21168/rega.v15e10. [in Portuguese]
» https://doi.org/10.21168/rega.v15e10. -
Fleischmann, A. S., Brêda, J. P. F., Passaia, O. A., Wongchuig, S. C., Fan, F. M., Paiva, R. C. D., Marques, G. F., & Collischonn, W. (2021). Regional scale hydrodynamic modeling of the river-floodplain-reservoir continuum. Journal of Hydrology (Amsterdam), 596, 126114. https://doi.org/10.1016/j.jhydrol.2021.126114
» https://doi.org/10.1016/j.jhydrol.2021.126114 -
Fleischmann, A., Papa, F., Hamilton, S., Fassoni-Andrade, A., Wongchuig, S., Espinoza, J., Paiva, R., Melack, J., Fluet-Chouinard, E., Castello, L., Almeida, R., Bonnet, M., Alves, L., Moreira, D., Yamazaki, D., Revel, M., & Collischonn, W. (2023). Increased floodplain inundation in the Amazon since 1980. Environmental Research Letters, 18, 034024. http://dx.doi.org/10.1088/1748-9326/acb9a7
» http://dx.doi.org/10.1088/1748-9326/acb9a7 - Food and Agriculture Organization of the United Nations – FAO. (2016). AQUASTAT Transboundary River Basin Overview – La Plata Rome, Italy: FAO.
-
Gbohoui, Y. P., Paturel, J. E., Tazen, F., Mounirou, L. A., Yonaba, R., Karambiri, H., & Yacouba, H. (2021). Impacts of climate and environmental changes on water resources: a multi-scale study based on Nakanb´ e nested watersheds in West African Sahel. Journal of Hydrology. Regional Studies, 35, 100828. http://dx.doi.org/10.1016/j.ejrh.2021.100828
» http://dx.doi.org/10.1016/j.ejrh.2021.100828 -
Goswami, M., & O’Connor, K. M. (2007). Real-time flow forecasting in the absence of quantitative precipitation forecasts: a multi-model approach. Journal of Hydrology (Amsterdam), 334(1-2), 125-140. https://doi.org/10.1016/j.jhydrol.2006.10.002
» https://doi.org/10.1016/j.jhydrol.2006.10.002 - Green, K., Kempka, D., & Lackey, L. (1994). Using remote sensing to detect and monitor land-cover and land-use change. Photogrammetric Engineering and Remote Sensing, 60(3), 331-337.
-
Gupta, H., Wagener, T., & Liu, Y. (2008). Reconciling theory with observations: elements of a diagnostic approach to model evaluation. Hydrological Processes, 22, 3802-3813. http://dx.doi.org/10.1002/hyp.6989
» http://dx.doi.org/10.1002/hyp.6989 - Haydar, S., Arshad, M., & Aziz, J. A. (2016). Evaluation of drinking water quality in urban areas of Pakistan: a case study of Southern Lahore, Pakistan. Journal of Engineering and Applied Sciences, 5, 16-23.
-
Huard, D., & Mailhot, A. (2008). Calibration of hydrological model GR2M using Bayesian uncertainty analysis. Water Resources Research, 44(2), http://dx.doi.org/10.1029/ 2007WR005949
» http://dx.doi.org/10.1029/ 2007WR005949 -
Institute of Waters of Paraná – IAT. (2006). Water Use Permit Manual. Retrieved in 2025, October 15, from https://www.iat.pr.gov.br/sites/agua-terra/arquivos_restritos/files/documento/2020-10/manual_outorgas_suderhsa_2006.pdf (in Portuguese)
» https://www.iat.pr.gov.br/sites/agua-terra/arquivos_restritos/files/documento/2020-10/manual_outorgas_suderhsa_2006.pdf -
Jarvis, A., Reuter, H. I., Nelson, A., & Guevara, E. (2008). Hole-filled SRTM for the globe Version 4, available from the CGIAR-CSI SRTM 90m Retrieved in 2025, October 15, from https://srtm.csi.cgiar.org
» https://srtm.csi.cgiar.org -
Javadinejad, S., Dara, R., & Jafary, F. (2019). Impacts of extreme events on water availability. Annals of Geographical Studies, 2(3), 16-24. http://dx.doi.org/10.22259/2642-9136.0203003
» http://dx.doi.org/10.22259/2642-9136.0203003 -
Kolling Neto, A., Siqueira, V. A., Gama, C. H. A., Paiva, R. C. D. d., Fan, F. M., Collischonn, W., Silveira, R., Paranhos, C. S. A., & Freitas, C. (2023). Advancing medium-range streamflow forecasting for large hydropower reservoirs in brazil by means of continental-scale hydrological modeling. Water (Basel), 15(9), 1693. http://dx.doi.org/10.3390/w15091693
» http://dx.doi.org/10.3390/w15091693 -
Koneti, S., Sunkara, S. L., & Roy, P. S. (2018). Hydrological modeling with respect to impact of land-use and land-cover change on the runoff dynamics in godavari river basin using the HEC-HMS model. ISPRS International Journal of Geo-Information, 7(6), 206. http://dx.doi.org/10.3390/ijgi7060206
» http://dx.doi.org/10.3390/ijgi7060206 -
Krajewski, W. F., Ghimire, G. R., Demir, I., & Mantilla, R. (2021). Real-time streamflow forecasting: AI vs. Hydrologic insights. Journal of Hydrology: X, 13, 100110. https://doi.org/10.1016/j.hydroa.2021.100110
» https://doi.org/10.1016/j.hydroa.2021.100110 -
Leong, C., & Yokoo, Y. (2021). A step toward global-scale applicability and transferability of flow duration curve studies: a flow duration curve review (2000–2020). Journal of Hydrology (Amsterdam), 603, 126984. https://doi.org/10.1016/j.jhydrol.2021.126984
» https://doi.org/10.1016/j.jhydrol.2021.126984 -
Liu, D., Guo, S., Wang, Z., Liu, P., Yu, X., Zhao, Q., & Zou, H. (2018). Statistics for sample splitting for the calibration and validation of hydrological models. Stochastic Environmental Research and Risk Assessment, 32(11), 3099-3116. https://doi.org/10.1007/s00477-018-1539-8
» https://doi.org/10.1007/s00477-018-1539-8 -
Lopez, A., & Haines, S. (2017). Exploring the usability of probabilistic weather forecasts for water resources decision-making in the United Kingdom. Weather, Climate, and Society, 9(4), 701-715. http://dx.doi.org/10.1175/WCAS-D-16-0072.1
» http://dx.doi.org/10.1175/WCAS-D-16-0072.1 -
MapBiomas (2022). MapBiomas Project. Collection 7.0 of the Annual Series of Land Use and Land Cover Maps of Brazil, for the years 2009 and 2021 Retrieved in 2025, October 15, from https://mapbiomas.org/colecoes-mapbiomas-1?cama_set_language=pt-BR (in Portuguese)
» https://mapbiomas.org/colecoes-mapbiomas-1?cama_set_language=pt-BR -
Mewded, M., Abebe, A., Tilahun, S., & Agide, Z. (2021). Impact of land use and land cover change on the magnitude of surface runoff in the endorheic Hayk Lake basin, Ethiopia. SN Applied Sciences, 3(8), 742. http://dx.doi.org/10.1007/s42452-021-04725-y
» http://dx.doi.org/10.1007/s42452-021-04725-y -
Montenegro, S. M. G. L., Fernandes, C. V. S., Reis Junior, D. S., Mendiondo, E. M., Martins, E. S. P. R., Souza Filho, F. A. S., Chaffe, P. B., Paiva, R. C. D., Johnsson, R. M. F., Souza, S. A., & Collischonn, W. (2025). The central role of water in resilience and adaptation to climate change. In A. Latgé, O. L. L. Moraes, I. C. G. Vieira, L. A. Elias, J. Marengo, & L. Davidovich (Eds.), Climate change in Brazil: State of the art and frontiers of knowledge Brasília, DF: Editora Ibict. https://doi.org/10.22477/9788570132468
» https://doi.org/10.22477/9788570132468 -
Munar, A. M., Cavalcanti, J. R., Bravo, J. M., Fan, F. M., da Motta-Marques, D., & Fragoso Junior, C. R. (2018). Coupling large-scale hydrological and hydrodynamic modeling: toward a better comprehension of watershed-shallow lake processes. Journal of Hydrology (Amsterdam), 564, 424-441. http://dx.doi.org/10.1016/j.jhydrol.2018.07.045
» http://dx.doi.org/10.1016/j.jhydrol.2018.07.045 - National Electric System Operator – ONS. (2022). Update of Historical Flow Series – Period 1931 to 2021 Rio de Janeiro: ONS. (in Portuguese).
-
National Electric System Operator – ONS. (2026). Brazilian National Interconnected System (SIN) Retrieved in 2025, October 15, from https://www.ons.org.br/paginas/sobre-o-sin/o-que-e-o-sin (in Portuguese).
» https://www.ons.org.br/paginas/sobre-o-sin/o-que-e-o-sin - National Institute of Meteorology of Brazil – INMET. (1992). Climatological Normals: 1961/1990 Brasília, DF: INMET. (in Portuguese)
-
Oliveira, R. F. D., Zolin, C. A., Victoria, D. D. C., Lopes, T. R., Vendrusculo, L. G., & Paulino, J. (2019). Hydrological calibration and validation of the MGB-IPH model for water resource management in the upper Teles Pires River basin in the Amazon-Cerrado ecotone in Brazil. Acta Amazonica, 49, 54-63. http://dx.doi.org/10.1590/1809-4392201800812
» http://dx.doi.org/10.1590/1809-4392201800812 -
Pagano, T. C., Casati, B., Landman, S., Loveday, N., Taggart, R., Ebert, E. E., Khanarmuei, M., Jensen, T. L., Mittermaier, M., Roberts, H., Willington, S., Roberts, N., Sowko, M., Strassberg, G., Kluepfel, C., Bullock, T. A., Turner, D. D., Pappenberger, F., Osborne, N., & Noble, C. (2024). Challenges of operational weather forecast verification and evaluation. Bulletin of the American Meteorological Society, 105(4), E789-E802. http://dx.doi.org/10.1175/BAMS-D-22-0257.1
» http://dx.doi.org/10.1175/BAMS-D-22-0257.1 -
Paraná. Instituto Água e Terra. (2023). Outorgas emitidas – Outorgas de captação do CRH Retrieved April 8, 2026, from https://geopr.iat.pr.gov.br/img/repositorio-de-dados/?id=fb7216074a5b4072b41e6a966b61d749 (in Portuguese).
» https://geopr.iat.pr.gov.br/img/repositorio-de-dados/?id=fb7216074a5b4072b41e6a966b61d749 - Paranhos, R. N. (2023). The influence of the number of rain gauge stations on the efficiency of the MGB model using soil parameter auto-calibration (Undergraduate thesis). Porto Alegre: Federal University of Rio Grande do Sul (UFRGS) (in Portuguese).
-
Phan, T. D., Baxter, G. S., Phan, H. A., Mai, L. S., & Trinh, H. D. (2019). An integrated approach for predicting the occurrence probability of an elusive species: the Southwest China serow. Wildlife Research, 46(5), 386-397. http://dx.doi.org/10.1071/WR18116
» http://dx.doi.org/10.1071/WR18116 -
Pontes, P. R. M., Fan, F. M., Fleischmann, A. S., de Paiva, R. C. D., Buarque, D. C., Siqueira, V. A., et al (2017). MGB-IPH model for hydrological and hydraulic simulation of large floodplain river systems coupled with open source GIS. Environmental Modelling & Software, 94, 1-20. http://dx.doi.org/10.1016/j.envsoft.2017.03.029
» http://dx.doi.org/10.1016/j.envsoft.2017.03.029 -
Reis, G. G. D., Paiva, R. C. D. D., Brêda, J. P. L. F., & Siqueira, V. A. (2023). SARDIM: a real-time hydrological monitoring platform of South American rivers. RBRH, 28, e10. https://doi.org/10.1590/2318-0331.282320220106
» https://doi.org/10.1590/2318-0331.282320220106 - Rippl, W. (1883). The capacity of storage-reservoirs for water-slpply (including plate). Minutes of the Proceedings of the Institution of Civil Engineers, 71(1883), 270-278.
-
Salehi, M. (2022). Global water shortage and potable water safety; Today’s concern and tomorrow’s crisis. Environment International, 158, 106936. https://doi.org/10.1016/j.envint.2021.106936
» https://doi.org/10.1016/j.envint.2021.106936 -
Salvadore, E., Bronders, J., & Batelaan, O. (2015). Hydrological modelling of urbanized catchments: a review and future directions. Journal of Hydrology (Amsterdam), 529, 62-81. http://dx.doi.org/10.1016/j.jhydrol.2015.06.028
» http://dx.doi.org/10.1016/j.jhydrol.2015.06.028 -
Sankarasubramanian, A., Lall, U., Souza Filho, F. A., & Sharma, A. (2009). Improved water allocation utilizing probabilistic climate forecasts: short-term water contracts in a risk management framework. Water Resources Research, 45, W11409. http://dx.doi.org/10.1029/2009WR007821
» http://dx.doi.org/10.1029/2009WR007821 -
Schlaepfer, D. R., Bradford, J. B., Lauenroth, W. K., Munson, S. M., Tietjen, B., Hall, S. A., et al (2017). Climate change reduces extent of temperate drylands and intensifies drought in deep soils. Nature Communications, 8(1), 14196. http://dx.doi.org/10.1038/ncomms14196
» http://dx.doi.org/10.1038/ncomms14196 -
Schuster, R. C., Fan, F. M., & Collischonn, W. (2020). Scenarios of climate change effects in water availability within the patos Lagoon’s Basin. RBRH, 25, e9. http://dx.doi.org/10.1590/2318-0331.252020190061
» http://dx.doi.org/10.1590/2318-0331.252020190061 -
Seyfried, M. S., & Wilcox, B. P. (1995). Scale and the nature of spatial variability: field examples having implications for hydrologic modeling. Water Resources Research, 31(1), 173-184. http://dx.doi.org/10.1029/94WR02025
» http://dx.doi.org/10.1029/94WR02025 -
Singh, V. P. (2018). Hydrologic modeling: progress and future directions. Geoscience Letters, 5(15), http://dx.doi.org/10.1186/s40562-018-0113-z
» http://dx.doi.org/10.1186/s40562-018-0113-z -
Siqueira, V. A., Fleischmann, A. S., Jardim, P. F., Fan, F. M., & Collischonn, W. (2016). IPH-Hydro Tools: a GIS coupled tool for watershed topology aquisition in open-source environment. Revista Brasileira de Recursos Hídricos, 21, 274-287. http://dx.doi.org/10.21168/rbrh.v21n1.p274-287 [in Portuguese]
» http://dx.doi.org/10.21168/rbrh.v21n1.p274-287 -
Smakhtin, V. U. (2001). Low flow hydrology: a review. Journal of Hydrology (Amsterdam), 240(3-4), 147-186. https://doi.org/10.1016/S0022-1694(00)00340-1
» https://doi.org/10.1016/S0022-1694(00)00340-1 -
Song, X. P., Hansen, M. C., Stehman, S. V., Potapov, P. V., Tyukavina, A., Vermote, E. F., & Townshend, J. R. (2018). Global land change from 1982 to 2016. Nature, 560, 639-643. http://dx.doi.org/10.1038/s41586-018-0411-9
» http://dx.doi.org/10.1038/s41586-018-0411-9 - Stedinger, J. R., Vogel, R. M., & Foufoula-Georgia, E. (1993). Frequency analysis of extreme events. In D.R. Maidment (Ed.), Handbook of Hydrology (Chapter 18, p. 18.1-18.66). New York: McGraw Hill.
-
Swain, S. S., Mishra, A., Sahoo, B., & Chatterjee, C. (2020). Water scarcity-risk assessment in data-scarce river basins under decadal climate change using a hydrological modelling approach. Journal of Hydrology (Amsterdam), 590, 125260. http://dx.doi.org/10.1016/j.jhydrol.2020.125260
» http://dx.doi.org/10.1016/j.jhydrol.2020.125260 -
Tallaksen, L. M., Hisdal, H., & Van Lanen, H. A. J. (2009). Space–time modelling of catchment scale drought characteristics. Journal of Hydrology (Amsterdam), 375(3-4), 363-372. https://doi.org/10.1016/j.jhydrol.2009.06.032
» https://doi.org/10.1016/j.jhydrol.2009.06.032 -
Tegos, A., Ziogas, A., Bellos, V., & Tzimas, A. (2022). Forensic hydrology: a complete reconstruction of an extreme flood event in data-scarce area. Hydrology, 2022(9), 93. http://dx.doi.org/10.3390/hydrology9050093
» http://dx.doi.org/10.3390/hydrology9050093 -
Todini, E. (2007). Hydrological catchment modelling: past, present and future. Hydrology and Earth System Sciences, 11(1), 468-482. https://doi.org/10.5194/hess-11-468-2007
» https://doi.org/10.5194/hess-11-468-2007 -
Toosi, A. S., Batelaan, O., Shanafield, M., & Guan, H. (2025). Land use-land cover and hydrological modeling: a review. WIREs. Water, 12, e70013. http://dx.doi.org/10.1002/wat2.70013
» http://dx.doi.org/10.1002/wat2.70013 -
Tu, T., Li, Y., Duan, K., & Zhao, T. (2024). Enhancing physically-based hydrological modeling with an ensemble of machine-learning reservoir operation modules under heavy human regulation using easily accessible data. Journal of Environmental Management, 359, 121044. http://dx.doi.org/10.1016/j.jenvman.2024.121044
» http://dx.doi.org/10.1016/j.jenvman.2024.121044 - United Nations – UN. (1987). Our Common Future: Report of the World Commission on Environment and Development Oxford: Oxford University Press.
-
van Vliet, M. T. H., Jones, E. R., Flörke, M., Franssen, W. H. P., Hanasaki, N., Wada, Y., & Yearsley, J. R. (2021). Global water scarcity including surface water quality and expansions of clean water technologies. Environmental Research Letters, 16(2), http://dx.doi.org/10.1088/1748-9326/abbfc3
» http://dx.doi.org/10.1088/1748-9326/abbfc3 -
Veettil, A. V., & Mishra, A. K. (2020). Multiscale hydrological drought analysis: role of climate, catchment and morphological variables and associated thresholds. Journal of Hydrology (Amsterdam), 582, 124533. https://doi.org/10.1016/j.jhydrol.2019.124533
» https://doi.org/10.1016/j.jhydrol.2019.124533 -
Vogel, R. M., & Fennessey, N. M. (1995). Flow duration curves. I: new interpretation and confidence intervals. Journal of Water Resources Planning and Management, 121(4), 485-493. http://dx.doi.org/10.1061/(ASCE)0733-9496(1995)121:4(485)
» http://dx.doi.org/10.1061/(ASCE)0733-9496(1995)121:4(485) -
Wang, J., Yun, X., Pokhrel, Y., Yamazaki, D., Zhao, Q., Chen, A., & Tang, Q. (2021). Modeling daily floods in the Lancang-Mekong river basin using an improved hydrological-hydrodynamic model. Water Resources Research, 57(8), 1-20. http://dx.doi.org/10.1029/2021WR029734
» http://dx.doi.org/10.1029/2021WR029734 - Whiteaker, T., & Maidment, D. R. (2004). Geographically Integrated Hydrologic Modeling Systems (Dissertation). The University of Texas at Austin, Austin.
-
Wongchuig, C. S., Paiva, R. C. D., Siqueira, V., & Collischonn, W. (2019). Hydrological reanalysis across the 20th century: A case study of the Amazon Basin. Journal of Hydrology (Amsterdam), 570, 755-773. http://dx.doi.org/10.1016/j.jhydrol.2019.01.025
» http://dx.doi.org/10.1016/j.jhydrol.2019.01.025 - World Meteorological Organization – WMO. (2021). State of Climate Services: Water Geneva: WMO.
-
Yapo, P. O., Gupta, H. V., & Sorooshian, S. (1998). Multi-objective global optimization for hydrologic models. Journal of Hydrology (Amsterdam), 204(1-4), 83-97. http://dx.doi.org/10.1016/S0022-1694(97)00107-8
» http://dx.doi.org/10.1016/S0022-1694(97)00107-8 -
Yokoo, Y., & Sivapalan, M. (2011). Towards reconstruction of the flow duration curve: development of a conceptual framework with a physical basis. Hydrology and Earth System Sciences, 15, 2805-2819. http://dx.doi.org/10.5194/hess-15-2805-2011
» http://dx.doi.org/10.5194/hess-15-2805-2011 -
Zhang, Y., Deng, J., Zhou, Y., Zhang, Y., Qin, B., Song, C., Shi, K., Zhu, G., Hou, X., Zhang, Y., He, S., Woolway, R. I., & Li, N. (2024). Drinking water safety improvement and future challenge of lakes and reservoirs. Science Bulletin, 69(22), 3558-3570. https://doi.org/10.1016/j.scib.2024.06.018
» https://doi.org/10.1016/j.scib.2024.06.018 -
Zheng, F., Maier, H. R., Wu, W., Dandy, G. C., Gupta, H. V., & Zhang, T. (2018). On lack of robustness in hydrological model development due to absence of guidelines for selecting calibration and evaluation data: demonstration for data-driven models. Water Resources Research, 54(2), 1013-1030. http://dx.doi.org/10.1002/2017WR021470
» http://dx.doi.org/10.1002/2017WR021470
Edited by
-
Editor-in-Chief:
Adilson Pinheiro
-
Associated Editor:
Iran Eduardo Lima Neto
Data citations
Arino, O., Ramos Pérez, J. J., Kalogirou, V., Bontemps, S., Defourny, P., & Van Bogaert, E. (2012). Global land cover map for 2009 (GlobCover 2009). European Space Agency (ESA) & Université catholique de Louvain (UCL). https://doi.org/10.1594/PANGAEA.787668