 Pluviometric patterns in the São Francisco River basin in Minas Gerais, Brazil
ABSTRACT
This work aimed to evaluate the spatial-temporal variability of precipitation in the Minas Gerais section of the São Francisco River basin, an area of substantial socio-environmental relevance for the country and which has presented recent events of water scarcity. Multivariate and non-parametric statistical analyses were applied to the monthly precipitation data from 131 pluviometric stations, covering a period from 1989 to 2018. The results indicated distinct homogeneous pluviometric regions with greater spatial variability in rainfall patterns in the southern regions of the basin. Results from the temporal analysis indicated seasonality in the rainfall patterns for all seasons, with the rainy period predominantly occurring between October and March for the entire Minas Gerais section of the São Francisco River basin. No rainfall trend was identified in 78% of the stations, with the other stations (22%) showing a trend toward a reduction in rainfall volume.
Keywords:
Pluviometric precipitation; São Francisco River; Cluster analysis; Seasonality; Temporal trend
RESUMO
O presente estudo teve como objetivo avaliar a variabilidade espaço-temporal da precipitação na porção mineira da bacia hidrográfica do rio São Francisco, área de grande relevância socioambiental para o país e que apresentou eventos recentes de escassez hídrica. Análises estatísticas multivariada e não paramétricas foram aplicadas aos dados de precipitação acumulada mensal de 131 estações pluviométricas, para o período de 1989 a 2018. Os resultados indicaram a existência de distintas regiões pluviométricas homogêneas com maior variabilidade espacial do regime de chuva no sul da bacia. Em relação à análise temporal, os resultados indicaram existência da sazonalidade para o regime de chuva em todas as estações analisadas, com predominância do período chuvoso entre os meses de outubro e março para toda a porção mineira da bacia do rio São Francisco. Para 78% das estações analisadas não foi identificada tendência pluviométrica, sendo constatada para as demais estações (22%) tendência de redução do volume de chuva.
Palavras-chave:
Precipitação pluviométrica; Rio São Francisco; Análise de agrupamentos; Sazonalidade; Tendência temporal
INTRODUCTION
Precipitation is an admittedly important variable in the hydrological cycle, as it the main source of supply for water systems. It also represents the most important element when it comes to understanding the climatic dynamics of a region due to its high variability (Maier et al., 2016). The rainfall pattern has a profound impact on environmental conditions and drives the planning and development of various sectors of society, such as water supply, agriculture, fishing, navigation, and stormwater management (Soares et al., 2016).
In this sense, knowing the patterns and predicting pluviometric behavior are necessary when it comes to the planning and management of water resources and decision-making with regard to productive and socio-environmental activities. However, these procedures are not trivial, given that precipitation fluctuates markedly in time and space (Delahaye et al., 2015), and is subject to extreme periods. Such variability may be associated with natural factors, such as the general dynamics of the atmosphere, the ecosystem, and the region’s relief features. However, the intensification of anthropogenic actions on the environment has influenced the terrestrial climate, resulting in a rise in temperature and a change in the annual rainfall cycle at the global level (Intergovernmental Panel on Climate Change, 2014; Piazza et al., 2016).
Several studies worldwide indicate that changes in rainfall are usually associated with climate change. The effects of the climate change on precipitation vary according to the region, which may be associated with an increase in the volume of precipitation (Tammets & Jaagus, 2013; Piazza et al., 2016), or a downward trend in rainfall (Jong et al., 2018; Kahsay et al., 2018; Campos & Chaves, 2020). Thus, these effects can be characterized in time and space.
The identification of homogeneous regions of rainfall (Amanajás & Braga, 2012; Santos & Morais, 2013; Chierice & Landim, 2014; Menezes et al., 2015; Azevedo et al., 2017) can contribute to assess the spatial effects of climate change. The temporal variation of the precipitation regime can be characterized from studies of seasonal behavior (Chierice & Landim, 2014; Mendes & Zukowski Júnior, 2019; Dias et al., 2020). Thus, the spatio-temporal characterization of precipitation series can contribute to the diagnosis and monitoring of the rainfall regime of hydrographic basins.
The São Francisco River Basin (SFRB) is drained by one of the main rivers in the country and has an important role in supplying water for irrigation and human consumption, tourism, and fishing (Silveira et al., 2016). The basin presented recent events of water scarcity attributed to climate change, it being the country’s most vulnerable basin to the lack of water (Ruffato-Ferreira et al., 2017; Lucas et al., 2020).
Silveira et al. (2016) identified an upward trend in temperature in the SFRB and projected anomalies between -20% and 20% for precipitation in each 30-year period. Jong et al. (2018) indicated that the average annual precipitation in the basin has been below its long-term average every year since 1992.
If this downward trend continues, the decline in rainfall in the catchment may be even more severe than the most pessimistic model projections, with the sharp drop in average rainfall projected for 2100 happening before 2050 (Jong et al., 2018). Possible unfavorable consequences would include intermittency in the water supply sector and risks of electricity shortages, affecting a population of around 14.3 million inhabitants (Jong et al., 2018).
In this context, this study aims to evaluate the spatio-temporal variability of precipitation in the São Francisco River basin in Minas Gerais. The results of this work may support policies for the management of local water resources and contribute to the planning of water resources in different sectors.
METHOD
Study area
The São Francisco River Basin (SFRB) has a drainage area of 639,219 km2 (Comitê da Bacia Hidrográfica do Rio São Francisco, 2016) and an estimated population of 14.3 million inhabitants (Instituto Brasileiro de Geografia e Estatística, 2010). It has great social and environmental importance for the six Brazilian states (Minas Gerais, Goiás, Bahia, Sergipe, Pernambuco, and Alagoas) and the Federal District (Comitê da Bacia Hidrográfica do Rio São Francisco, 2016). The São Francisco River flows northward, originating in the central-west region of the state of Minas Gerais (Serra da Canastra) and heading towards the Northeastern part of the country.
The Minas Gerais section of the SFRB occupies 37% of the basin's total drainage area, presenting distinct environmental characteristics between the high and medium stretches. It is divided into ten Hydrographic Circumscriptions (HC), or sub-basins: High São Francisco River (SF1); Pará River (SF2); Paraopeba River (SF3); Três Marias Reservoir (SF4); Velhas River (SF5); Jequitaí and Pacuí Rivers (SF6); Paracatu River (SF7); Urucuia River (SF8); Pandeiros River (SF9); and Verde Grande River (SF10) (Minas Gerais, 2020).
The study area includes fragments from different biomes, with the Cerrado being the most prevalent. Its predominant Köppen climate classification is Aw (hot and humid with summer rains) and small climatic variation of BShw (semi-arid) (Comitê da Bacia Hidrográfica do Rio São Francisco, 2016). Therefore, the climate in most HCs is considered semi-humid with two well-defined seasons, with the exception of the sub-basins located further north (SF9 and SF10), which are influenced by semi-arid climate (Instituto Mineiro de Gestão das Águas, 2020a) and the caatinga biome (Sistema Estadual de Meio Ambiente e Recursos Hídricos, 2020).
According to the São Francisco River Basin Committee (Comitê da Bacia Hidrográfica do Rio São Francisco, 2016), the average annual precipitation is between 800 and 1,000 mm in the regions located in the northern part of Minas Gerais and bordering the state of Bahia, while in other Hydrographic Circumscriptions located to the south, the average annual rainfall ranges between 1,100 and 1,400 mm.
There is also a notable socioeconomic diversity among the sub-basins, with predominantly urban uses and occupations in the highest part, and agricultural and mining activity scattered throughout the entire basin, in addition to a robust industrial park, covering metallurgical, textile, food, and chemical enterprises (Costa et al., 2017; Instituto Mineiro de Gestão das Águas, 2020b).
Database selection and organization
Data from pluviometric stations in the study area were obtained from the HidroWeb portal of the National Water Agency (Agência Nacional das Águas, 2020). Stations that have been providing such data for at least 30 years were selected (01/01/1989 to 31/12/2018), as recommended by the World Meteorological Organization (WMO) (World Meteorological Organization, 1989) and considered by other authors (Lemos et al., 2018; Mendes & Zukowski Júnior, 2019; Lira, 2019; Campos & Chaves, 2020). Based on this criterion, 131 pluviometric stations (Figure 1) and their respective monthly precipitation volumes were selected. The percentage of missing data in selected pluviometric stations is presented in Table 1. It is possible to observe the low percentage of missing data. Of 131 stations, 70 have no missing data and 47 have up to 5%, equivalent to less than 18 data. Table A1 (Attachment) shows the relationship between HidroWeb codes and the codes developed in the present study for pluviometric monitoring stations.

Location of selected pluviometric stations in Hydrographic Circumscriptions in the São Francisco River basin – Minas Gerais.
The frequency distribution of the selected data was verified using the Shapiro Wilk normality test (Shapiro & Wilk, 1965). As the monitoring data for all stations did not follow a normal distribution (p-value <0.05), non-parametric tests were employed for the comparisons set forth in the study. All statistical analyses were performed using the Statistica 10.0 software.
Spatial variability analysis
The Cluster Analysis (CA) was used to assess the spatial variability of rainfall in the São Francisco River basin in Minas Gerais to identify regions with similar pluviometric behavior. Such analysis aims to group objects (cases) into classes (clusters) based on similarities within a class and dissimilarities between different classes (Hair Junior et al., 2009). Ward Junior’s hierarchical grouping method (Ward Junior, 1963) was used, using the Euclidean Distance as a measure of dissimilarity. This analysis was also adopted by several authors in the identification of homogeneous pluviometric regions (Chierice & Landim, 2014; Gonçalves et al., 2016; Neves et al., 2017; Lira, 2019).
To better characterize the spatial behavior of rainfall in the São Francisco River basin in Minas Gerais state, the Kruskal-Wallis non-parametric test, followed by Dunn's multiple comparison test (α = 5%) – when a significant difference was identified in the Kruskal-Wallis test (Dunn, 1964) – was used to compare the monthly precipitation volumes among HCs.
Temporal variability analysis
For the analysis of rainfall variability among years in the SFRB, the Standard Precipitation Index (SPI) was used. Developed by McKee et al. (1993), SPI is a popular index that is used to characterize drought at different time scales (Juliani & Okawa, 2017; Kalisa et al., 2020). The Standardized Precipitation Index was applied with the 12-month cumulative time scale, considered by Tan et al. (2015) an adequate indicator to show the situation of water scarcity caused by a drought for one year. The analysis was performed using a script in the R programming language, using the monthly precipitation recorded in all 131 stations per year as input data.
Determining seasonality in the data and identifying the dry and rainy periods was done by comparing the precipitated volumes among all months by year, by Hydrographic Circumscription. Comparative analyses were performed using the Kruskal-Wallis test followed by Dunn's multiple comparison test, when applicable, at a 5% significance level. In addition, box-whisker graphs were prepared to identify the months comprising the region's dry and rainy periods. It should be noted that the length of the rainy season was limited to six consecutive months with the greatest amount of rainfall (Santos & Morais, 2013; Rao et al., 2016).
An upward or downward trend in the monthly precipitation from each monitoring station was evaluated using the Seasonal Mann-Kendall (SMK) test, a variation of the Mann-Kendall (MK) test that considers the influence of seasonality on the samples (Hirsch et al., 1982). The test is widely used in the analysis of temporal trends in pluviometric data, because it is robust and presupposes the non-normality of the data under analysis (Gonçalves & Back, 2018). A similar method for analyzing precipitation trends was also used by other authors like Mann-Kendall Seasonal and exploratory data analysis (Stipp et al., 2013) and Mann-Kendall Seasonal test (Jong et al., 2018).
RESULTS AND DISCUSSION
Characterization of pluviometric monitoring in the study area
There is an assorted number of pluviometric stations distributed throughout the study area, with a greater concentration in the southern section (Figure 1), a region that has the highest population density and includes Belo Horizonte, the capital of Minas Gerais. Hydrographic Circumscriptions (HCs) SF5 (Velhas River) and SF3 (Paraopeba River) have the largest number of pluviometric stations, 29 and 24 stations, respectively. The sub-basins with the lowest number of pluviometric stations are SF6 (Jequitaí and Pacuí Rivers) and SF10 (Verde Grande River), with five each. Table 2 summarizes the general information regarding the study area.
General characteristics of the ten Hydrographic Circumscriptions in the Minas Gerais section of the São Francisco River.
In general, there is a predominance of well-structured monitoring networks in the denser regions, aimed at meeting greater demands from demographic pressures and preparing for extreme pluviometric events. Regions with low population density are often considered unfeasible for the implementation of monitoring networks (World Meteorological Organization, 2008). The low density of pluviometric stations can cause significant uncertainties in understanding the different processes related to dynamic precipitation mechanisms.
The disparity in the number of pluviometric stations in each Hydrographic Circumscription is also related to the hydrological importance of the principal rivers in the sub-basins. According to Pereira et al. (2007), the Velhas River and the Paraopeba River, in the basin’s southern section, are among the largest tributaries responsible for the formation of the São Francisco River flow.
Spatial variability of precipitation
The map in Figure 2 shows the groups formed in CA according to the similarity of the monthly precipitation values, adopting different cut lines (Figure 3).

Results of the groups formed in the Cluster Analysis according to similarity in the precipitation values for different cut lines in the dendrogram.

Dendrogram of the Euclidean distance of the pluviometric stations of the São Francisco River basin (MG) and different cut lines used in the formation of the groups.
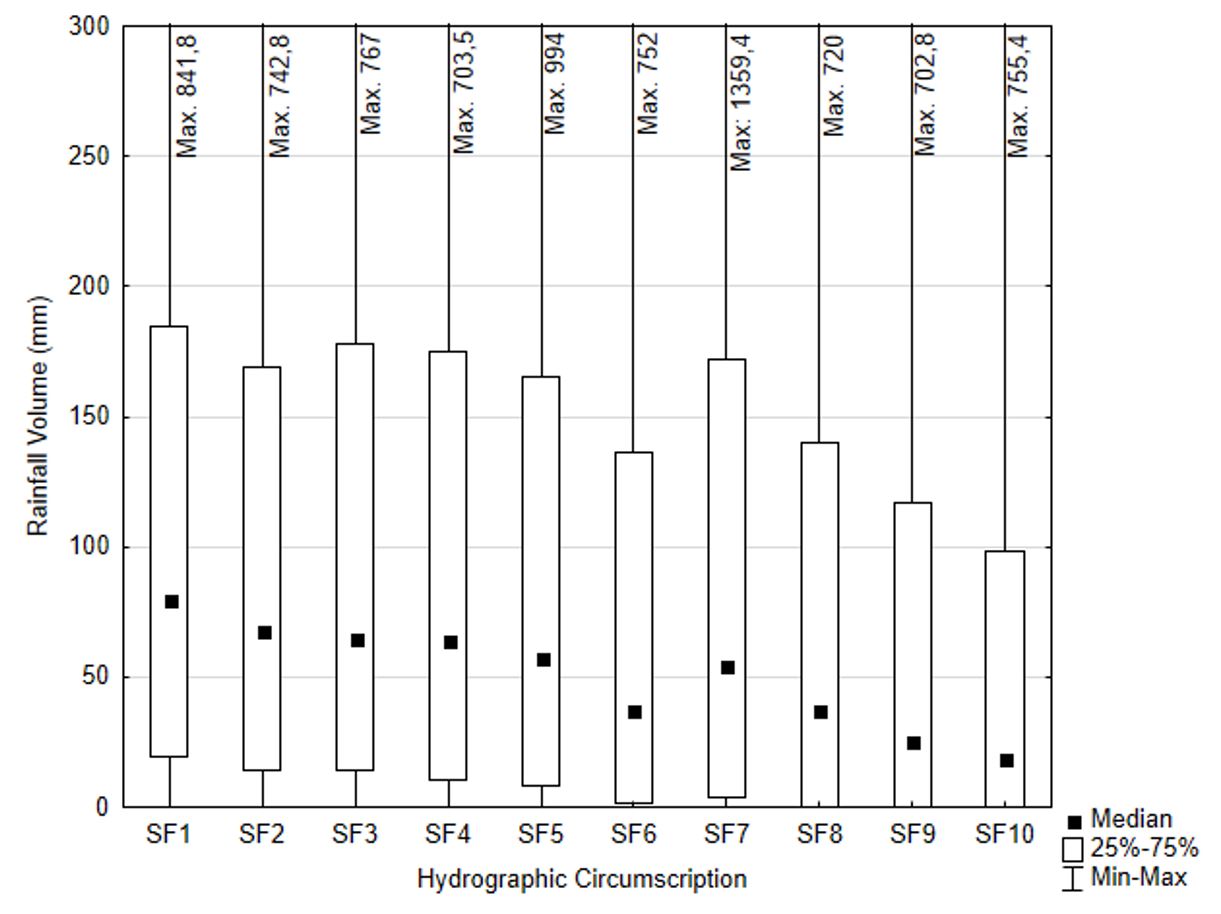
Cutting the dendrogram at the 2,800 Euclidian distance resulted in four clusters (Figures 2a and 3). It can be seen that the Hydrographic Circumscriptions located in the Middle São Francisco and under the influence of semiarid climate (SF9 and SF10) had similar rainfall patterns, with most of their stations comprising Group 1. As expected, as it is a semi-arid region, in these HCs the pluviometric volume is significantly lower than that of the other sub-basins (p-value of the KW test and multiple comparisons <0.05; Figure 4), with 75% of the monthly precipitation data under 117 mm. Group 2 represents a transition area between the northern and southern regions of the study area. The Groups 3 and 4 represent similarity in rainfall patterns of the stations located further south, where most of the monthly precipitation values were up to 165 mm, with emphasis on the HC SF1 (High São Francisco River), which showed significantly higher precipitation values than the other sub-basins (p-value of the KW test and multiple comparisons <0.05; Figure 4). According to Pruski et al. (2004) the rainfall decreases from the source to the mouth of the São Francisco river, that is, from the south to the north of the SFRB. Other studies corroborate these results by pointing to a lower average annual precipitation in the region of the Middle São Francisco in relation to the High São Francisco (Brasil, 2006; Pereira et al., 2007).

Cutting the dendrogram at the 1,900 Euclidian distance resulted in seven clusters (Figures 2b and 3). It can be seen that Group 1 and Group 3 (Group 1 and Group 2 - section 2,800) were largely maintained, reinforcing the uniformity of the rainfall pattern in the region defined by HCs SF9 and SF10 (Group 1) and the transition area (Group 3). For stations located in the southernmost sub-basins, there was a greater change in the groups formed, where Groups 3 and 4 formed previously (cut 2,800) were divided into several groups, indicating greater variability in the rainfall regime south of the basin.
The Group 5 formation (blue circles, Figure 2b) stands out as it concentrates the stations close to the urban area of the Metropolitan Region of Belo Horizonte (MRBH), located in the Paraopeba River, Pará River, and the Velhas River basins. This higher degree of urbanization, with its consequent increase in impermeable areas and atmospheric pollution and lower wind circulation, can cause the so-called “urban heat island” effect, interfering with the local microclimate and, consequently, the rainfall pattern in that region (Gartland, 2010), as noted by Wu et al. (2019), Azari et al. (2020) and Jiang et al. (2020).
It can be seen in all groups that the Velhas River basin (SF5) was the one that presented the greatest spatial variability in rainfall patterns (Figure 2a and 2b). This fact can be explained by the greater longitudinal expanse of this basin (divided into three stretches: High Velhas River, Middle Velhas River, and Low Velhas River), greater diversification of activities, and anthropic interference, as well as the presence of more monitoring stations in the area.
Temporal variability of precipitation
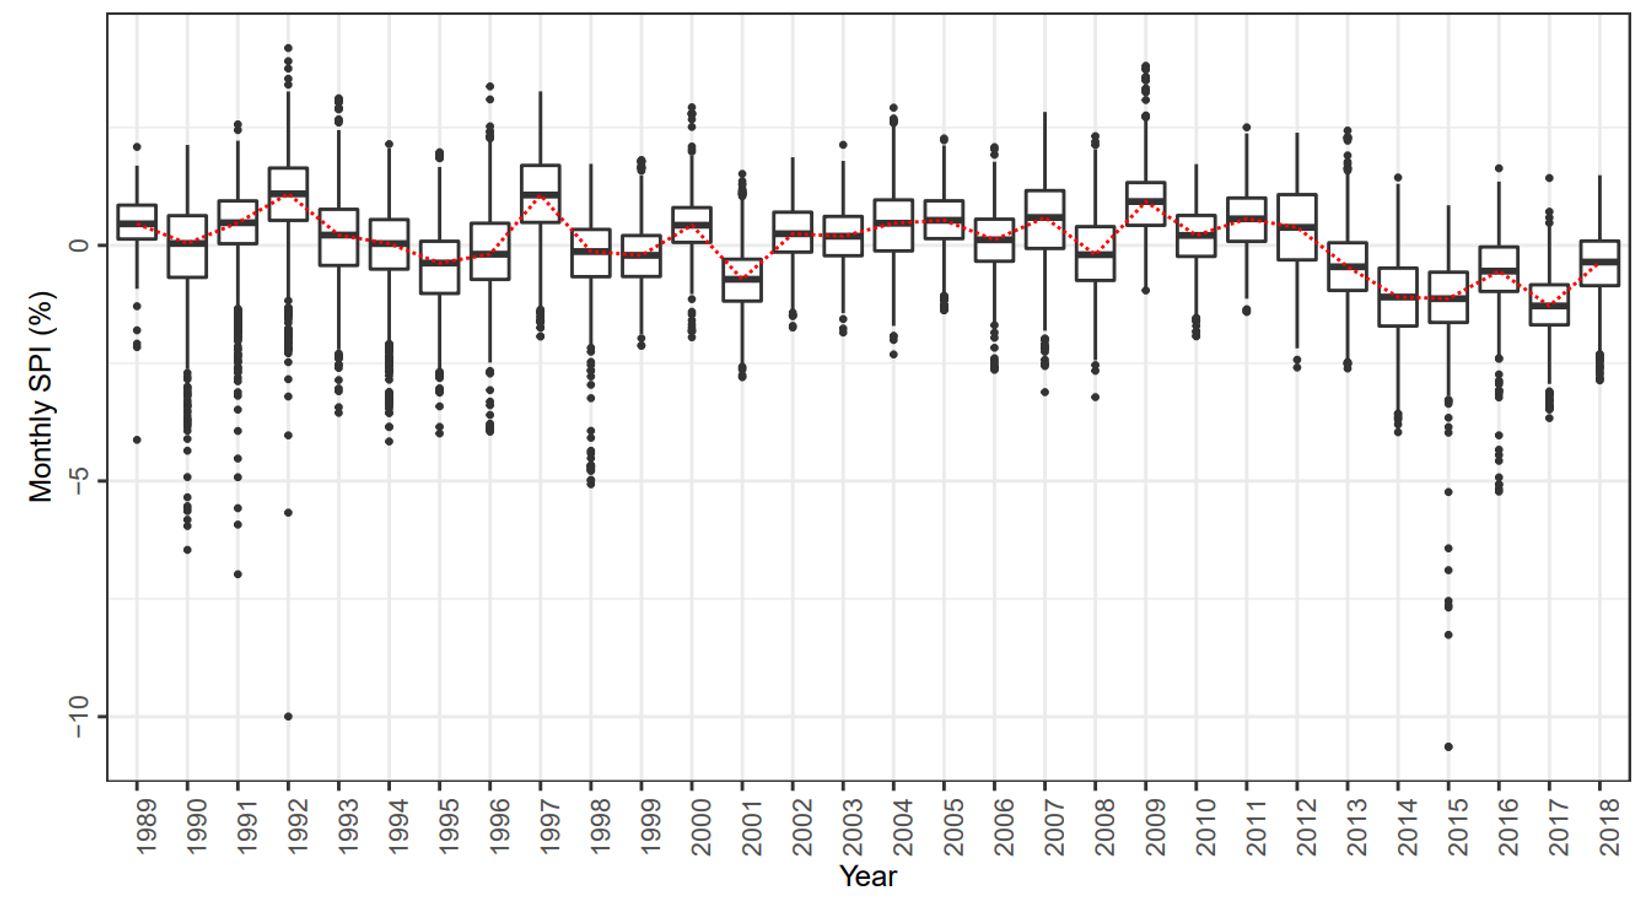
Figure 5 presents the box-whisker graphs of the SPI between the years of the historical series, considering the data from all Hydrographic Circumscriptions together.

A positive value of SPI represents the precipitation above average, and a negative SPI corresponds below average precipitation (Juliani & Okawa, 2017).
The SPI results highlight that between 1989 and 2012 the recorded precipitation anomaly varied alternately, that is, in some years it had a positive median (higher rainfall) and a negative median (lower rainfall) in others. Over the period 2012 to 2018, the median value registered on the SPI was below zero in all years. These results show that, in addition to the water crisis events that occurred between 2012 and 2014, widely discussed in the scientific literature, later years were also characterized by lower rainfall.
In the southeast region, in which the SFRB is located, the most severe drought occurred between 2014 and 2015, mainly caused by a persistent high-pressure system over southeastern South America that blocked the formation of South Atlantic Convergence Zone (SACZ). These atmospheric conditions blocked the passage of cold fronts from the south and moisture from the Amazon Basin (Coelho et al., 2016; Nobre et al., 2016). Additionally, at time scales of six and twelve months, if the climate conditions were severe drought or rainy, switching to another class would be unlikely in the short term (Santos et al., 2019).
The lowest median monthly SPI values were registered for the years 2014, 2015, and 2017 (Figure 5), coinciding with those in which there was a reduction in the useful volume of water supply reservoirs for human consumption in the basin in Minas Gerais, specifically in the Paraopeba system dedicated to the Metropolitan Region of Belo Horizonte. In 2014, the useful volume accumulated in the three reservoirs (Serra Azul, Vargem das Flores, and Manso River) fluctuated from 76.8% in January to 33.3% in December, while the Três Marias reservoir, which is involved in generating electricity, recorded an accumulated volume of only 3.4% of its useful capacity in October (Comitê da Bacia Hidrográfica do Rio São Francisco, 2014; Companhia de Saneamento de Minas Gerais, 2020).
The results of the Kruskal-Wallis tests and Dunn's multiple comparisons indicated that there was seasonality in the rainfall pattern for all the seasons throughout the historical series (p-value <0.05).
In Table 3, the percentage of rainy and dry periods identified by Hydrographic Circumscription is presented. For example, at HC SF1, 23 of the 30 years of the historical series (77% of the years) presented a rainy period between October and March and a dry period between April and September.
In most of the years the rainy period was found to be between October and March in the study area, as shown in Table 3. Furthermore, the period between November and April and, to a lesser extent, between September and February, was also recognized in certain years as a rainy season. The rainy period was more frequently identified between November and April in the northernmost section (SF9 and SF10) as compared to the other stretches, although the rainfall pattern from October to March still predominates (Table 3).
The variation in the rainy season months may be related to the influence of tropical climatic phenomena. According to Andreoli & Kayano (2005), the volume of rain in the southeastern region of Brazil is influenced by the El Niño phenomenon, which interferes in the rainy season between the years.
The result of the Mann-Kendall Seasonal test indicated that, for most of the monitoring stations (78%), there was no significant rainfall trend (p-value> 0.05) (Figure 6). The prominent absence of a significant trend in pluviometric data was also observed by Penereiro et al. (2018), when analyzing Brazilian municipalities located in several biomes. The authors specified that of the 70 municipalities studied in the Cerrado, 60 did not show significant trends of either reduction or increase.

Result of the pluviometric temporal trend identified by station in the Hydrographic Circumscriptions of the São Francisco River basin.
In the other stations under study (22%), there was a notable trend toward reduced precipitation in the studied period (Table 4). Jong et al. (2018) found anomalies regarding the precipitation volume in the São Francisco River basin, and when comparing the regional precipitation models estimated for 2071-2100 with the data recorded between 1961 and 1990, they found a depletion of between 10% to 40% in the amount of rain. When using IPCC climate forecasting models, Silveira et al. (2016) found a reduction in the pluviometric volumes registered in the SFRB between 2011 and 2100.
The HCs SF8 (Urucuia River), SF4 (around the Três Marias reservoir), and SF3 (Paraopeba River) had the highest percentages of reduction trend in pluviometric volume (Table 4).
A study by Pereira et al. (2007), which took into account the flow of the São Francisco River between 1979 and 2000, recognized that the Urucuia and Paraopeba Rivers were two of the five rivers responsible for the formation of 62.5% of the São Francisco River's flow between those years, together with the Paracatu, Velhas, and Pará Rivers. Thus, the downward trend in precipitation at stations located in these sub-basins could cause a variety of problems for the area downstream, including those outside the study area.
It is also noteworthy that in the region of the Paraopeba River, the stations with a reduction trend are located along the boundaries of two municipalities, Mateus Leme and Itaúna. The decline in rainfall in this region is a worrisome event for the water supply of the Metropolitan Region of Belo Horizonte, as both municipalities are located in the Serra Azul reservoir area, built exclusively for human supply purposes (Fernandes, 2012). The negative effects of the change in rainfall in this region were seen in the context of water supply and water security. According to data from the Minas Gerais Sanitation Company (COPASA), since January 2014, when the company began releasing data on the volume of water in the reservoirs it manages, the Serra Azul reservoir has consistently presented a low useful volume. During the water crisis between 2014 and 2016, the highest percentage recorded was 29.3% and the lowest 5.2% of the reservoir's useful capacity, in March 2016 and November 2014, respectively (Companhia de Saneamento de Minas Gerais, 2020).
The reduction in the rainfall pattern registered in the Três Marias reservoir (stations 2SF4, 3SF4, and 6SF4) may have significant socioeconomic impacts in the region, since it has an installed capacity of 396 MW (Cachapuz, 2006) and is also used for flood control, irrigation, and recreation.
The HC SF10 (the Verde Grande River region) was the only one that did not show a downward trend at any of its pluviometric stations. The probable cause of this event lies in the small number of monitoring stations to cover such a vast area (Table 2 and 4; Figure 6). The 4SF10 station presented inconclusive results, probably due to the fact that this station went through many months without precipitation volume, with constant repetition of the zero value, as discussed in Trindade (2013).
CONCLUSION
With regard to the pluviometric patterns in the São Francisco River Basin in Minas Gerais, it was found that there are distinct homogeneous regions with greater spatial variability in the rainfall pattern in the south of the basin. The northern region, where HCs SF9 (Pandeiros River) and SF10 (Verde Grande River) are located, is influenced by semi-arid climate with less rainfall than in the other sub-basins, where the climate is semi-humid.
Negative median SPI values were recorded in the period 2012-2018. The result confirms the events of water scarcity in the SFRB in the period, in which there was a reduction in the useful volume of water supply reservoirs for human consumption in the basin in Minas Gerais.
There was a statistically significant seasonality for the rainfall regime in all stations and HCs. The rainy period predominates between October and March and the dry period between April and September for all study area.
Lastly, it was shown that there is no temporal trend in most of the pluviometric monitoring stations with regard to recorded rainfall volumes (78%), despite recent water crisis events and the current climate change context. A trend toward a decline in rainfall was identified in 22% of all stations distributed throughout the basin in Minas Gerais, especially in HCs SF8 (Urucuia River), SF4 (Três Marias Reservoir), and SF3 (Paraopeba River), which had the highest percentage of stations with this trend. It is worth mentioning that no significant increase in rainfall was identified in any of the monitoring stations.
The variability in precipitation and the consequent water availability can impact socioeconomic, agricultural, and industrial activities. The assessment of patterns in precipitation in the SFRB, with the identification of regions and sub-basins with lower rainfall and with temporal trends, can assist in the management and planning of local water resources and support the development of projects by the public and private sectors in more diverse segments.
Attachment
ACKNOWLEDGEMENTS
The authors would like to thank the CEMIG/ANEEL Research and Development Program – Project GT629 – “Application of Multivariate Chemometric Methods in Watershed Management: Validation and Access to Data” and Coordination for the Improvement of Higher Education Personnel (CAPES) for financial support throughout the development of this research.
REFERENCES
-
Agência Nacional das Águas – ANA. (2020). Apresentação. Retrieved in 2020, July 13, from http://www.snirh.gov.br/hidroweb/apresentacao
» http://www.snirh.gov.br/hidroweb/apresentacao -
Amanajás, J. C., & Braga, C. C. (2012). Padrões espaço-temporal pluviométricos na Amazônia oriental utilizando análise multivariada. Revista Brasileira de Meteorologia, 27(4), 423-434. http://dx.doi.org/10.1590/S0102-77862012000400006
» http://dx.doi.org/10.1590/S0102-77862012000400006 -
Andreoli, R. V., & Kayano, M. T. (2005). ENSO-related rainfall anomalies in South America and associated circulation features during warm and cold Pacific decadal oscillation regimes. International Journal of Climatology, 25(15), 2017-2030. http://dx.doi.org/10.1002/joc.1222
» http://dx.doi.org/10.1002/joc.1222 -
Azari, M., Billa, L., & Chan, A. (2020). Modeling of land-use/land-cover change and your impact on local climate of Klang River Basin. IOP Conference Series: Earth and Environmental Science, 489, 012017. http://dx.doi.org/10.1088/1755-1315/489/1/012017
» http://dx.doi.org/10.1088/1755-1315/489/1/012017 -
Azevedo, F. T. M., Souza, E. B., Franco, V. S., & Souza, P. F. S. (2017). Prognóstico sazonal de precipitação regionalizada na Amazônia Oriental. Revista Brasileira de Geografia Física, 10(5), 1520-1534. http://dx.doi.org/10.26848/rbgf.v.10.5.p1520-1534
» http://dx.doi.org/10.26848/rbgf.v.10.5.p1520-1534 -
Brasil. Ministério do Meio Ambiente – MMA. Secretaria de Recursos Hídricos. (2006). Caderno da região hidrográfica do São Francisco. Brasília: MMA. Retrieved in 2020, May 22, from https://www.yumpu.com/pt/document/read/50565523/caderno-da-regiao-hidrografica-do-sao-francisco-ministerio-do-
» https://www.yumpu.com/pt/document/read/50565523/caderno-da-regiao-hidrografica-do-sao-francisco-ministerio-do- - Cachapuz, P. B. B. (Ed.). (2006). Usinas da Cemig: 1952-2005 (304 p.). Rio de Janeiro: Centro da Memória da Eletricidade no Brasil. Retrieved in 2020, October 4, from https:// www.cemig.com.br/pt-br/a_cemig/nossos_negocios/usinas/Documents/livro_usinas.pdf
-
Campos, J. O., & Chaves, H. M. L. (2020). Tendências e Variabilidades nas Séries Históricas de Precipitação Mensal e Anual no Bioma Cerrado no Período 1977-2010. Revista Brasileira de Meteorologia, 35(1), 157-169. http://dx.doi.org/10.1590/0102-7786351019
» http://dx.doi.org/10.1590/0102-7786351019 - Chierice, R. A. F., & Landim, P. M. B. (2014). Variabilidade espacial e temporal de precipitação pluviométrica na bacia hidrográfica do rio Mogi Guaçu. Geociências, 33(1), 157-171.
-
Coelho, C. A. S., Oliveira, C. P., Ambrizzi, T., Reboita, M. S., Carpenedo, C. B., Campos, J. L. P. S., Tomaziello, A. C. N., Pampuch, L. A., Custódio, M. S., Dutra, L. M. M., Rocham, R. P., & Rehbein, A. (2016). The 2014 southeast Brazil austral summer drought: regional scale mechanisms and teleconnections. Climate Dynamics, 46(11-12), 3737-3752. http://dx.doi.org/10.1007/s00382-015-2800-1
» http://dx.doi.org/10.1007/s00382-015-2800-1 - Comitê da Bacia Hidrográfica do Rio São Francisco – CBHSF. (2014). Revista Chico, (5), 1-44.
- Comitê da Bacia Hidrográfica do Rio São Francisco – CBHSF. (2016). Plano de Recursos Hídricos da Bacia Hidrográfica do rio São Francisco 2016-2025 (Resumo Executivo, 300 p.). Belo Horizonte: CBHSF.
-
Companhia de Saneamento de Minas Gerais – COPASA. (2020). Nível dos reservatórios. Retrieved in 2020, December 2, from http://copasa.com.br/wps/portal/internet/abastecimento-de-agua/nivel-dos-reservatorios
» http://copasa.com.br/wps/portal/internet/abastecimento-de-agua/nivel-dos-reservatorios -
Costa, E. P., Pinto, C. C., Soares, A. L. C., Melo, L. D. V., & Oliveira, S. M. A. C. (2017). Evaluation of violations in water quality standards in the monitoring network of São Francisco River Basin, the third largest in Brazil. Environmental Monitoring and Assessment, 189(11), 1-16. PMid:29086029. http://dx.doi.org/10.1007/s10661-017-6266-y
» http://dx.doi.org/10.1007/s10661-017-6266-y -
Delahaye, F., Kirstetter, P. E., Dubreuil, V., Machado, L. A. T., Vila, D. A., & Clark 3rd, R. A. (2015). consistent gauge database for daily rainfall analysis over the Legal Brazilian Amazon. Journal of Hydrology), 527, 292-304. http://dx.doi.org/10.1016/j.jhydrol.2015.04.012
» http://dx.doi.org/10.1016/j.jhydrol.2015.04.012 - Dias, L. C., Valente, A. M. C., & Fenandes, L. L. (2020). Análise e correlação de variáveis climatológicas com os fenômenos climáticos e a urbanização na Cidade de Belém, no Estado do Pará, região Norte do Brasil. Research Social Development, 9(8), 1-22.
-
Dunn, O. J. (1964). Multiple comparisons using rank sums. Technometrics, 6(3), 241-252. http://dx.doi.org/10.1080/00401706.1964.10490181
» http://dx.doi.org/10.1080/00401706.1964.10490181 -
Fernandes, D. P. (2012). Indícios de degradação ambiental em um reservatório oligotrófico (reservatório de Serra Azul, MG – Brasil): avaliação limnológica, morfometria, batimetria e modelagem hidrodinâmica (Dissertação de mestrado). Instituto de Ciências Biológicas, Universidade Federal de Minas Gerais, Belo Horizonte. Retrieved in 2020, September 28, from https://repositorio.ufmg.br/handle/1843/BUOS-92YP4X
» https://repositorio.ufmg.br/handle/1843/BUOS-92YP4X - Gartland, L. (2010). Ilhas de calor: como mitigar zonas de calor em áreas urbanas (200 p.). São Paulo: Oficina de Textos.
- Gonçalves, F. N., & Back, A. J. (2018). Análise da variação espacial e sazonal e de tendências na precipitação da região sul do Brasil. Revista de Ciências Agrárias, 41(3), 592-602.
-
Gonçalves, M. F., Blanco, C. J. C., Santos, V. C., Oliveira, L. L. S., & Pessoa, F. C. L. (2016). Identification of Rainfall Homogenous Regions taking into account El Niño and La Niña and Rainfall Decrease in the state of Pará, Brazilian Amazon. Acta Scientiarum, 38(2), 209-216. http://dx.doi.org/10.4025/actascitechnol.v38i2.26534
» http://dx.doi.org/10.4025/actascitechnol.v38i2.26534 - Hair Junior, J. F., Black, W. C., Babin, B. J., Anderson, R. E., & Tatham, R. L. (2009). Análise multivariada de dados (6. ed., 688 p.). Porto Alegre: Bookman.
-
Hirsch, R. M., Slack, J. R., & Smith, R. A. (1982). Techniques for trend assessment for monthly water quality data. Water Resources Research, 18(1), 107-121. http://dx.doi.org/10.1029/WR018i001p00107
» http://dx.doi.org/10.1029/WR018i001p00107 -
Instituto Brasileiro de Geografia e Estatística – IBGE. (2010). Pesquisa Nacional de Saneamento Básico – 2008. Retrieved in 2020, February 18, from https:// biblioteca.ibge.gov.br/visualizacao/livros/liv45351.pdf
» https:// biblioteca.ibge.gov.br/visualizacao/livros/liv45351.pdf -
Instituto Mineiro de Gestão das Águas – IGAM. (2020a). Bacia do São Francisco. Retrieved in 2020, February 13, from http://portalinfohidro.igam.mg.gov.br/unidades-de-planejamento/bacia-do-rio-sao-francisco
» http://portalinfohidro.igam.mg.gov.br/unidades-de-planejamento/bacia-do-rio-sao-francisco -
Instituto Mineiro de Gestão das Águas – IGAM. (2020b). Bacia Hidrográfica do Rio São Francisco. Retrieved in 2020, December 15, from http://www.igam.mg.gov.br/component/content/154?task=view
» http://www.igam.mg.gov.br/component/content/154?task=view - Intergovernmental Panel on Climate Change – IPCC. (2014). Climate Change 2014: Synthesis Report: contribution of Working Groups I, II and III to the Fifth Assessment Report of the Intergovernmental Panel on Climate Change (151 p.). Geneva: IPCC.
-
Jiang, X., Luo, Y., Zhang, D.-L., & Wu, M. (2020). Urbanization enhanced summertime extreme hourly precipitation over the Yangtze River Delta. Journal of Climate, 33(13), 5809-5826. http://dx.doi.org/10.1175/JCLI-D-19-0884.1
» http://dx.doi.org/10.1175/JCLI-D-19-0884.1 -
Jong, P., Tanajura, C. A. S., Sánchez, A. S., Dargaville, R., Kiperstok, A., & Torres, E. A. (2018). Hydroelectric production from Brazil’s São Francisco River could cease due to climate change and inter-annual variability. The Science of the Total Environment, 634, 1540-1553. PMid:29710652. http://dx.doi.org/10.1016/j.scitotenv.2018.03.256
» http://dx.doi.org/10.1016/j.scitotenv.2018.03.256 - Juliani, B. H. T., & Okawa, C. M. P. (2017). Application of a standardized precipitation index for meteorological drought analysis of the semi-arid climate influence in Minas Gerais, Brazil. Hydrology, 4(2), 1-14.
-
Kahsay, K. D., Pingale, S. M., & Hatiye, S. D. (2018). Impact of climate change on groundwater recharge and base flow in the sub-catchment of Tekeze basin, Ethiopia. Groundwater for Sustainable Development, 6, 121-133. http://dx.doi.org/10.1016/j.gsd.2017.12.002
» http://dx.doi.org/10.1016/j.gsd.2017.12.002 -
Kalisa, W., Zhang, J., Igbawua, T., Ujoh, F., Ebohon, O. J., Namugize, J. N., & Yao, F. (2020). Spatio-temporal analysis of drought and return periods over the East African region using Standardized Precipitation Index from 1920 to 2016. Agricultural Water Management, 237, 1-13. http://dx.doi.org/10.1016/j.agwat.2020.106195
» http://dx.doi.org/10.1016/j.agwat.2020.106195 -
Lemos, A. C. C., Saldanha, D. L., & Mafra, A. L. (2018). Comportamento da precipitação pluviométrica nas porções alta e média da bacia hidrográfica do Rio Canoas/SC: análise temporal de 1986-2016. Revista Brasileira de Geografia Física, 11(4), 1264-1274. http://dx.doi.org/10.26848/rbgf.v11.4.p1264-1274
» http://dx.doi.org/10.26848/rbgf.v11.4.p1264-1274 - Lira, B. R. P. (2019). Avaliação do comportamento e da tendência pluviométrica na Amazônia Legal no Período de 1986 a 2015 (Dissertação de mestrado). Instituto de Tecnologia, Universidade Federal do Pará, Belém.
-
Lucas, M. C., Kublik, N., Rodrigues, D. B. B., Meira Neto, A. A., Almagro, A., Melo, D. C. D., Zipper, S. C., & Oliveira, P. T. S. (2020). Significant Baseflow Reduction in the São Francisco River Basin. Water (Basel), 13(1), 1-17. http://dx.doi.org/10.3390/w13010002
» http://dx.doi.org/10.3390/w13010002 -
Maier, E. L. B., Costi, J., Barreira, S., & Simões, J. C. (2016). Precipitação na América do Sul: médias climáticas e padrões da variabilidade no período entre 1979 e 2008. Revista Brasileira de Geografia Física, 9(1), 32-46. http://dx.doi.org/10.26848/rbgf.v9.1.p032-046
» http://dx.doi.org/10.26848/rbgf.v9.1.p032-046 - McKee, T. B., Doesken, N. J., & Kleist, J. (1993). The relationship of drought frequency and duration to time scales. In Eighth Conference on Applied Climatology (pp. 179-184). Anaheim: American Meteorology Society.
-
Mendes, A. T., & Zukowski Júnior, J. C. (2019). Caracterização do Regime Pluviométrico do Município de Araguaína – TO. Revista Brasileira de Meteorologia, 34(4), 449-458. http://dx.doi.org/10.1590/0102-7786344056
» http://dx.doi.org/10.1590/0102-7786344056 -
Menezes, F. P., Fernandes, L. L., & Rocha, E. J. P. (2015). O uso da estatística para regionalização da precipitação no Estado do Pará, Brasil. Revista Brasileira de Climatologia, 16, 64-71. http://dx.doi.org/10.5380/abclima.v16i0.40023
» http://dx.doi.org/10.5380/abclima.v16i0.40023 -
Minas Gerais. Conselho Estadual de Recursos Hídricos de Minas Gerais – CERH. (2020, 21 de novembro). Deliberação Normativa CERH-MG n. 66, de 17 de dezembro de 2020. Estabelece as Unidades Estratégicas de Gestão do Estado de Minas Gerais. Diário do Executivo “Minas Gerais”, Belo Horizonte. Retrieved in 2021, February 17, from http://www.siam.mg.gov.br/sla/download.pdf?idNorma=52900
» http://www.siam.mg.gov.br/sla/download.pdf?idNorma=52900 - Neves, R. R., Gonçalves, E. D., Pessoa, F. C. L., Fernandes, L. L., Gómez, Y. D., & Santos, J. I. N. (2017). Identificação de regiões pluviometricamente homogêneas na sub bacia Trombetas. Revista AIDIS, 10(2), 125-135.
-
Nobre, C. A., Marengo, J. A., Seluchi, M. E., Cuartas, L. A., & Alves, L. M. (2016). Some Characteristics and Impacts of the Drought and Water Crisis in Southeastern Brazil during 2014 and 2015. Journal of Water Resource and Protection, 8(2), 252-262. http://dx.doi.org/10.4236/jwarp.2016.82022
» http://dx.doi.org/10.4236/jwarp.2016.82022 -
Penereiro, J. C., Badinger, A., Maccheri, N. A., & Meschiatti, M. C. (2018). Distribuições de Tendências Sazonais de Temperatura Média e Precipitação nos Biomas Brasileiros. Revista Brasileira de Meteorologia, 33(1), 97-113. http://dx.doi.org/10.1590/0102-7786331012
» http://dx.doi.org/10.1590/0102-7786331012 -
Pereira, S. B., Pruski, F. F., Silva, D. D., & Ramos, M. M. (2007). Estudo do comportamento hidrológico do Rio São Francisco e seus principais afluentes. Revista Brasileira de Engenharia Agrícola e Ambiental, 11(6), 615-622. http://dx.doi.org/10.1590/S1415-43662007000600010
» http://dx.doi.org/10.1590/S1415-43662007000600010 -
Piazza, G. A., Torres, E., Moser, P., Gotardo, R., Kaufmann, V., & Pinheiro, A. (2016). Análise espacial e temporal dos dados de precipitação das estações de entorno da bacia do Ribeirão Concórdia, Lontras (SC), visando sua inserção no contexto de mudanças climáticas. Revista Brasileira de Meteorologia, 31(4, Suppl.), 580-592. http://dx.doi.org/10.1590/0102-7786312314b20150087
» http://dx.doi.org/10.1590/0102-7786312314b20150087 -
Pruski, F. F., Pereira, S. B., Novaes, L. F., Silva, D. D., & Ramos, M. M. (2004). Precipitação média anual e vazão específica média de longa duração, na Bacia do São Francisco. Revista Brasileira de Engenharia Agrícola e Ambiental, 8(2-3), 247-253. http://dx.doi.org/10.1590/S1415-43662004000200013
» http://dx.doi.org/10.1590/S1415-43662004000200013 -
Rao, V. B., Franchito, S. H., Santo, C. M., & Gan, M. A. (2016). An update on the rainfall characteristics of Brazil: seasonal variations and trends in 1979–2011. International Journal of Climatology, 36(1), 291-301. http://dx.doi.org/10.1002/joc.4345
» http://dx.doi.org/10.1002/joc.4345 -
Ruffato-Ferreira, V., Barreto, R. C., Oscar Júnior, A., Silva, W. L., Viana, D. B., Nascimento, J. A. S., & Freitas, M. A. V. (2017). A foundation for the strategic long-term planning of the renewable energy sector in Brazil: hydroelectricity and wind energy in the face of climate change scenarios. Renewable & Sustainable Energy Reviews, 72, 1124-1137. http://dx.doi.org/10.1016/j.rser.2016.10.020
» http://dx.doi.org/10.1016/j.rser.2016.10.020 -
Santos, C. A. G., & Morais, B. S. (2013). Identification of precipitation zones within São Francisco River basin (Brazil) by global wavelet power spectra. Hydrological Sciences Journal, 58(4), 789-796. http://dx.doi.org/10.1080/02626667.2013.778412
» http://dx.doi.org/10.1080/02626667.2013.778412 -
Santos, E. A. B., Stosic, T., Barreto, I. D. C., Campos, L., & Silva, A. S. A. (2019). Application of Markov chains to Standardized Precipitation Index (SPI) in São Francisco River Basin. Ambiente e Água, 14(3), 1-15. http://dx.doi.org/10.4136/ambi-agua.2311
» http://dx.doi.org/10.4136/ambi-agua.2311 -
Shapiro, S. S., & Wilk, M. B. (1965). An analysis of variance test for normality. Biometrika, 52(3-4), 591-599. http://dx.doi.org/10.1093/biomet/52.3-4.591
» http://dx.doi.org/10.1093/biomet/52.3-4.591 -
Silveira, C. S., Souza Filho, F. A., Martins, E. S. P. R., Oliveira, J. L., Costa, A. C., Nobrega, M. T., Souza, S. A., & Silva, R. F. V. (2016). Mudanças climáticas na bacia do rio São Francisco: uma análise para precipitação e temperatura. Revista Brasileira de Recursos Hídricos, 21(2), 416-428. http://dx.doi.org/10.21168/rbrh.v21n2.p416-428
» http://dx.doi.org/10.21168/rbrh.v21n2.p416-428 -
Sistema Estadual de Meio Ambiente e Recursos Hídricos – SISEMA. (2020). Infraestrutura de dados espaciais do Sistema Estadual de Meio Ambiente e Recursos Hídricos. Belo Horizonte: IDE-Sisema. Retrieved in 2020, July 20, from http://idesisema.meioambiente.mg.gov.br
» http://idesisema.meioambiente.mg.gov.br - Soares, A. S. D., Paz, A. R., & Piccilli, D. G. A. (2016). Avaliação das estimativas de chuva do satélite TRMM no Estado da Paraíba. Revista Brasileira de Recursos Hídricos, 21(2), 288-299.
- Stipp, R. D., Buchir, L. M. S., & Mine, M. R. M. (2013). Tendência sazonal da precipitação na bacia do Iguaçu. In Anais XX Simpósio Brasileiro de Recursos Hídricos. Porto Alegre: ABRH.
-
Tammets, T., & Jaagus, J. (2013). Climatology of precipitation extremes in Estonia using the method of moving precipitation totals. Theoretical and Applied Climatology, 111(3-4), 623-639. http://dx.doi.org/10.1007/s00704-012-0691-1
» http://dx.doi.org/10.1007/s00704-012-0691-1 -
Tan, C., Yang, J., & Li, M. (2015). Temporal-spatial variation of drought indicated by SPI and SPEI in Ningxia Hui Autonomous Region, China. Atmosphere, 6(10), 1399-1421. http://dx.doi.org/10.3390/atmos6101399
» http://dx.doi.org/10.3390/atmos6101399 -
Trindade, A. L. C. (2013). Aplicação de técnicas estatísticas para avaliação de dados de monitoramento de qualidade das águas superficiais da porção mineira da Bacia do Rio São Francisco (Dissertação de mestrado). Escola de Engenharia, Universidade Federal de Minas Gerais, Belo Horizonte. Retrieved in 2020, July 15, from http://www.smarh.eng.ufmg.br/defesas/1037M.PDF
» http://www.smarh.eng.ufmg.br/defesas/1037M.PDF -
Ward Junior, J. H. (1963). Hierarchical Grouping to Optimize an Objective Function. Journal of the American Statistical Association, 58(301), 236-244. http://dx.doi.org/10.1080/01621459.1963.10500845
» http://dx.doi.org/10.1080/01621459.1963.10500845 - World Meteorological Organization – WMO. (1989). Calculation of monthly and annual 30-year standard normals (WMO-TD, No. 341). Geneva: WMO.
-
World Meteorological Organization – WMO. (2008). Guide to hydrological practices: volume I hydrology: from measurement to hydrological information (6th ed.). Geneva: Chairperson, Publications Board. Retrieved in 2020, September 20, from http://www.whycos.org/chy/guide/168_Vol_I_en.pdf
» http://www.whycos.org/chy/guide/168_Vol_I_en.pdf -
Wu, M., Luo, Y., Chen, F., & Wong, W. K. (2019). Observed link of extreme hourly precipitation changes to urbanization over Coastal South China. Journal of Applied Meteorology and Climatology, 58(8), 1799-1819. http://dx.doi.org/10.1175/JAMC-D-18-0284.1
» http://dx.doi.org/10.1175/JAMC-D-18-0284.1
Edited by
-
Editor-in-Chief: Adilson Pinheiro
-
Associated Editor: Carlos Henrique Ribeiro Lima