 Development of an upper envelope curve of frequency factors for Probable Maximum Precipitation (PMP) estimation in tropical regions under convective regimes: a deterministic approach
ABSTRACT
This study revisits and adapts the Hershfield Statistical Method to estimate the point Probable Maximum Precipitation (PMP) for a tropical climate region in northern Brazil, focusing on durations from 24 hours to 30 days. To improve the representativeness of PMP estimates, regional upper envelopes of frequency factors () were developed based on 52 rainfall stations, capturing the distinct climatic behavior of convective systems typical of equatorial regions. The results indicate a decreasing trend in frequency factor () values as rainfall duration increases, consistent with the predominance of short-duration, high-intensity events in the region. Additionally, local frequency factors () exhibited significant variability and positive skewness, reflecting the spatial heterogeneity of extreme precipitation events. This approach can support hydrological risk assessments and infrastructure projects in tropical environments, specifically in part of the state of Pará, Brazil. This article is the first part of a two-part study on frequency factors for PMP estimation.
Keywords:
Probable Maximum Precipitation; Frequency factor; Upper envelope; Extreme rainfall; Tropical climate
RESUMO
Este estudo revisita e adapta o Método Estatístico de Hershfield para estimar a Precipitação Máxima Provável (PMP) pontual para uma região de clima tropical no Norte do Brasil, com foco em durações de 24 horas a 30 dias. Para melhorar a representatividade das estimativas de PMP, foram desenvolvidas envoltórias regionais dos fatores de frequência () com base em 52 estações pluviométricas, capturando o comportamento climático distinto de sistemas convectivos típicos de regiões equatoriais. Os resultados indicam uma tendência decrescente nos valores de à medida que a duração da chuva aumenta, o que é consistente com a predominância de eventos de curta duração e alta intensidade na região. Além disso, os fatores de frequência locais () apresentaram variabilidade significativa e assimetria positiva, refletindo a heterogeneidade espacial de eventos extremos de precipitação. Essa abordagem pode dar suporte em avaliações de risco hidrológico e projetos de infraestrutura em ambientes tropicais, especificamente em parte do estado do Pará, no Brasil. Este artigo constitui a primeira parte de um estudo em duas etapas sobre fatores de frequência para estimativa de PMP.
Palavras-chave:
Precipitação Máxima Provável; Fator de frequência; Envoltória; Precipitação extrema; Clima tropical
INTRODUCTION
Estimating the Probable Maximum Precipitation (PMP) is a critical task for hydrological safety assessments and infrastructure design, particularly for large dams and high-risk hydraulic structures. Several technical and regulatory frameworks explicitly recommend the consideration of PMP or the associated Probable Maximum Flood (PMF) in safety evaluations (Centrais Elétricas Brasileiras, 2003; Szymanski & Davies, 2004; International Commission on Large Dams, 2011, 2022; CBDB as cited in Pinheiro, 2011; Agência Nacional de Águas e Saneamento Básico, 2016; Associação Brasileira de Normas Técnicas, 2017; Agência Nacional de Mineração, 2022; Salgado et al., 2025).
According to the World Meteorological Organization (World Meteorological Organization, 2009) PMP is defined as the maximum theoretical precipitation that can occur over a given region, during a specific duration, and under particular meteorological conditions. It represents an upper-bound estimate intended to support conservative design and risk mitigation strategies.
The conceptual foundation of PMP is rooted in the early recognition that extreme hydrometeorological processes are bounded by physical constraints. Horton (1936) argued that storms and floods within a given basin must be subject to upper physical limits, establishing a conceptual basis for subsequent theoretical developments. Later discussions refined this understanding, emphasizing that the principal difficulty of PMP lies not in its conceptual validity, but in its quantification, which is inherently constrained by observational data, methodological assumptions, and epistemic uncertainty (Dooge, 1986; Berod et al., 1992).
Historically, two main approaches have been employed for PMP estimation: a physical approach and a statistical approach. The physical approach is based on storm maximization techniques, moisture maximization, and atmospheric analyses aimed at approximating a physically plausible upper limit. The statistical approach, in contrast, extrapolates extreme precipitation records using frequency analysis and envelope curves of frequency factors.
Within the statistical framework, the Hershfield Statistical Method (Hershfield, 1961a, 1961b, 1965) became one of the most widely adopted deterministic/empirical procedures for PMP estimation. Developed using precipitation records from the United States, its formulation assumes the applicability of an upper envelope of frequency factors () derived predominantly from temperate and cold-climate stations. This envelope has frequently been applied, often without regional recalibration, as a reference for diverse climatic contexts.
Although PMP has traditionally been interpreted as a physical upper bound, subsequent studies demonstrated that statistical implementations implicitly correspond to extremely low but finite probabilities of exceedance. Revisiting Hershfield’s formulation, Koutsoyiannis (1999) showed that the fixed value for 24-hour PMP estimation is statistically equivalent to a quantile associated with a return period on the order of 60,000 years under a Generalized Extreme Value (GEV) distribution. Similar interpretations were reinforced by Pinto (2001). Later, World Meteorological Organization (2009) and Salas et al. (2014) explicitly distinguished between the theoretical definition of PMP as a physical limit and its operational interpretation as a methodological construct for estimating extremely rare events. More recently, NASEM (National Academies of Sciences Engineering and Medicine, 2024) formalized the probabilistic interpretation of PMP and highlighted the need to reconcile deterministic formulations with non-stationary climate conditions.
Empirical quantifications of this implicit probability have produced return periods spanning several orders of magnitude. In the United States, National Research Council (1994) suggested that statistical PMP estimates may correspond to return periods ranging from to years, depending on regional and methodological assumptions. Nathan & Weinmann (2001, as cited in Fernandes, 2009) reported values on the order of to years, while Ball et al. (2019) obtained recurrence intervals equal to or exceeding 2,000 years, illustrating the strong methodological dependency of such estimates. More recently, Kappel et al. (2024) estimated median return periods between to years for 24 and 72 hours PMP in the Wasatch–Uinta Mountains region (USA), with possible ranges extending from to years. In South America, Sugai (1989) reported average return periods of approximately years for 24-hour PMP in southern Brazil. These studies collectively demonstrate that the probabilistic interpretation of PMP is neither recent nor geographically restricted, but rather reflects methodological assumptions, sample length, and climatic characteristics.
Subsequent investigations in different climatic regions revealed that the direct transposition of Hershfield’s Upper Envelope or WMO-recommended correction factors may lead to inconsistencies outside their original development context. Rezacova et al. (2005) reported substantial overestimation of daily PMP values in the Czech Republic when applying WMO procedures, prompting regional methodological adjustments. Similarly, Casas-Castillo et al. (2018), using 258 stations across the Iberian Peninsula, derived a regional envelope curve for 24-hour PMP estimation, reinforcing the necessity of climatic adaptation in statistical PMP methods.
In Brazil, several studies have questioned the indiscriminate application of Hershfield’s original envelope, particularly in tropical and subtropical environments characterized by intense convective activity (Sugai, 1989; Burger, 2014; Cavalcanti et al., 2018; Conceição & Fontes, 2019; Silva Neto et al., 2020; Barbosa et al., 2023). These investigations consistently identified frequency factors lower than those proposed by Hershfield, reinforcing the importance of a regional approach.
However, although regional adaptations have been proposed in temperate and Mediterranean climates, studies explicitly focused on genuinely tropical, equatorial, hot, and humid regions — such as northern Brazil — remain limited. Unlike extra-tropical regimes, equatorial environments are dominated by persistent deep convection, high precipitable water content, weak thermal seasonality, and strong moisture recycling, factors that may influence the statistical behavior of annual precipitation maxima and, consequently, the estimation of frequency factors.
One notable tropical application is the regional adaptation proposed by Sarkar & Maity (2020) in India, where frequency factors were reassessed under monsoon-dominated convective conditions. Their approach provides an important methodological reference for tropical environments and will be evaluated in this study.
The objective of this study is therefore to reassess and adapt the Hershfield Statistical Method to support the estimation of frequency factors in a genuinely tropical, equatorial, hot, and humid region of northern Brazil characterized by intense convective activity. The analysis is based on historical series of annual maximum precipitation for durations from 24 hours to 30 days.
MATERIAL AND METHODS
Study area and dataset
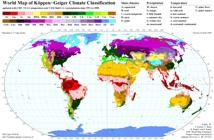
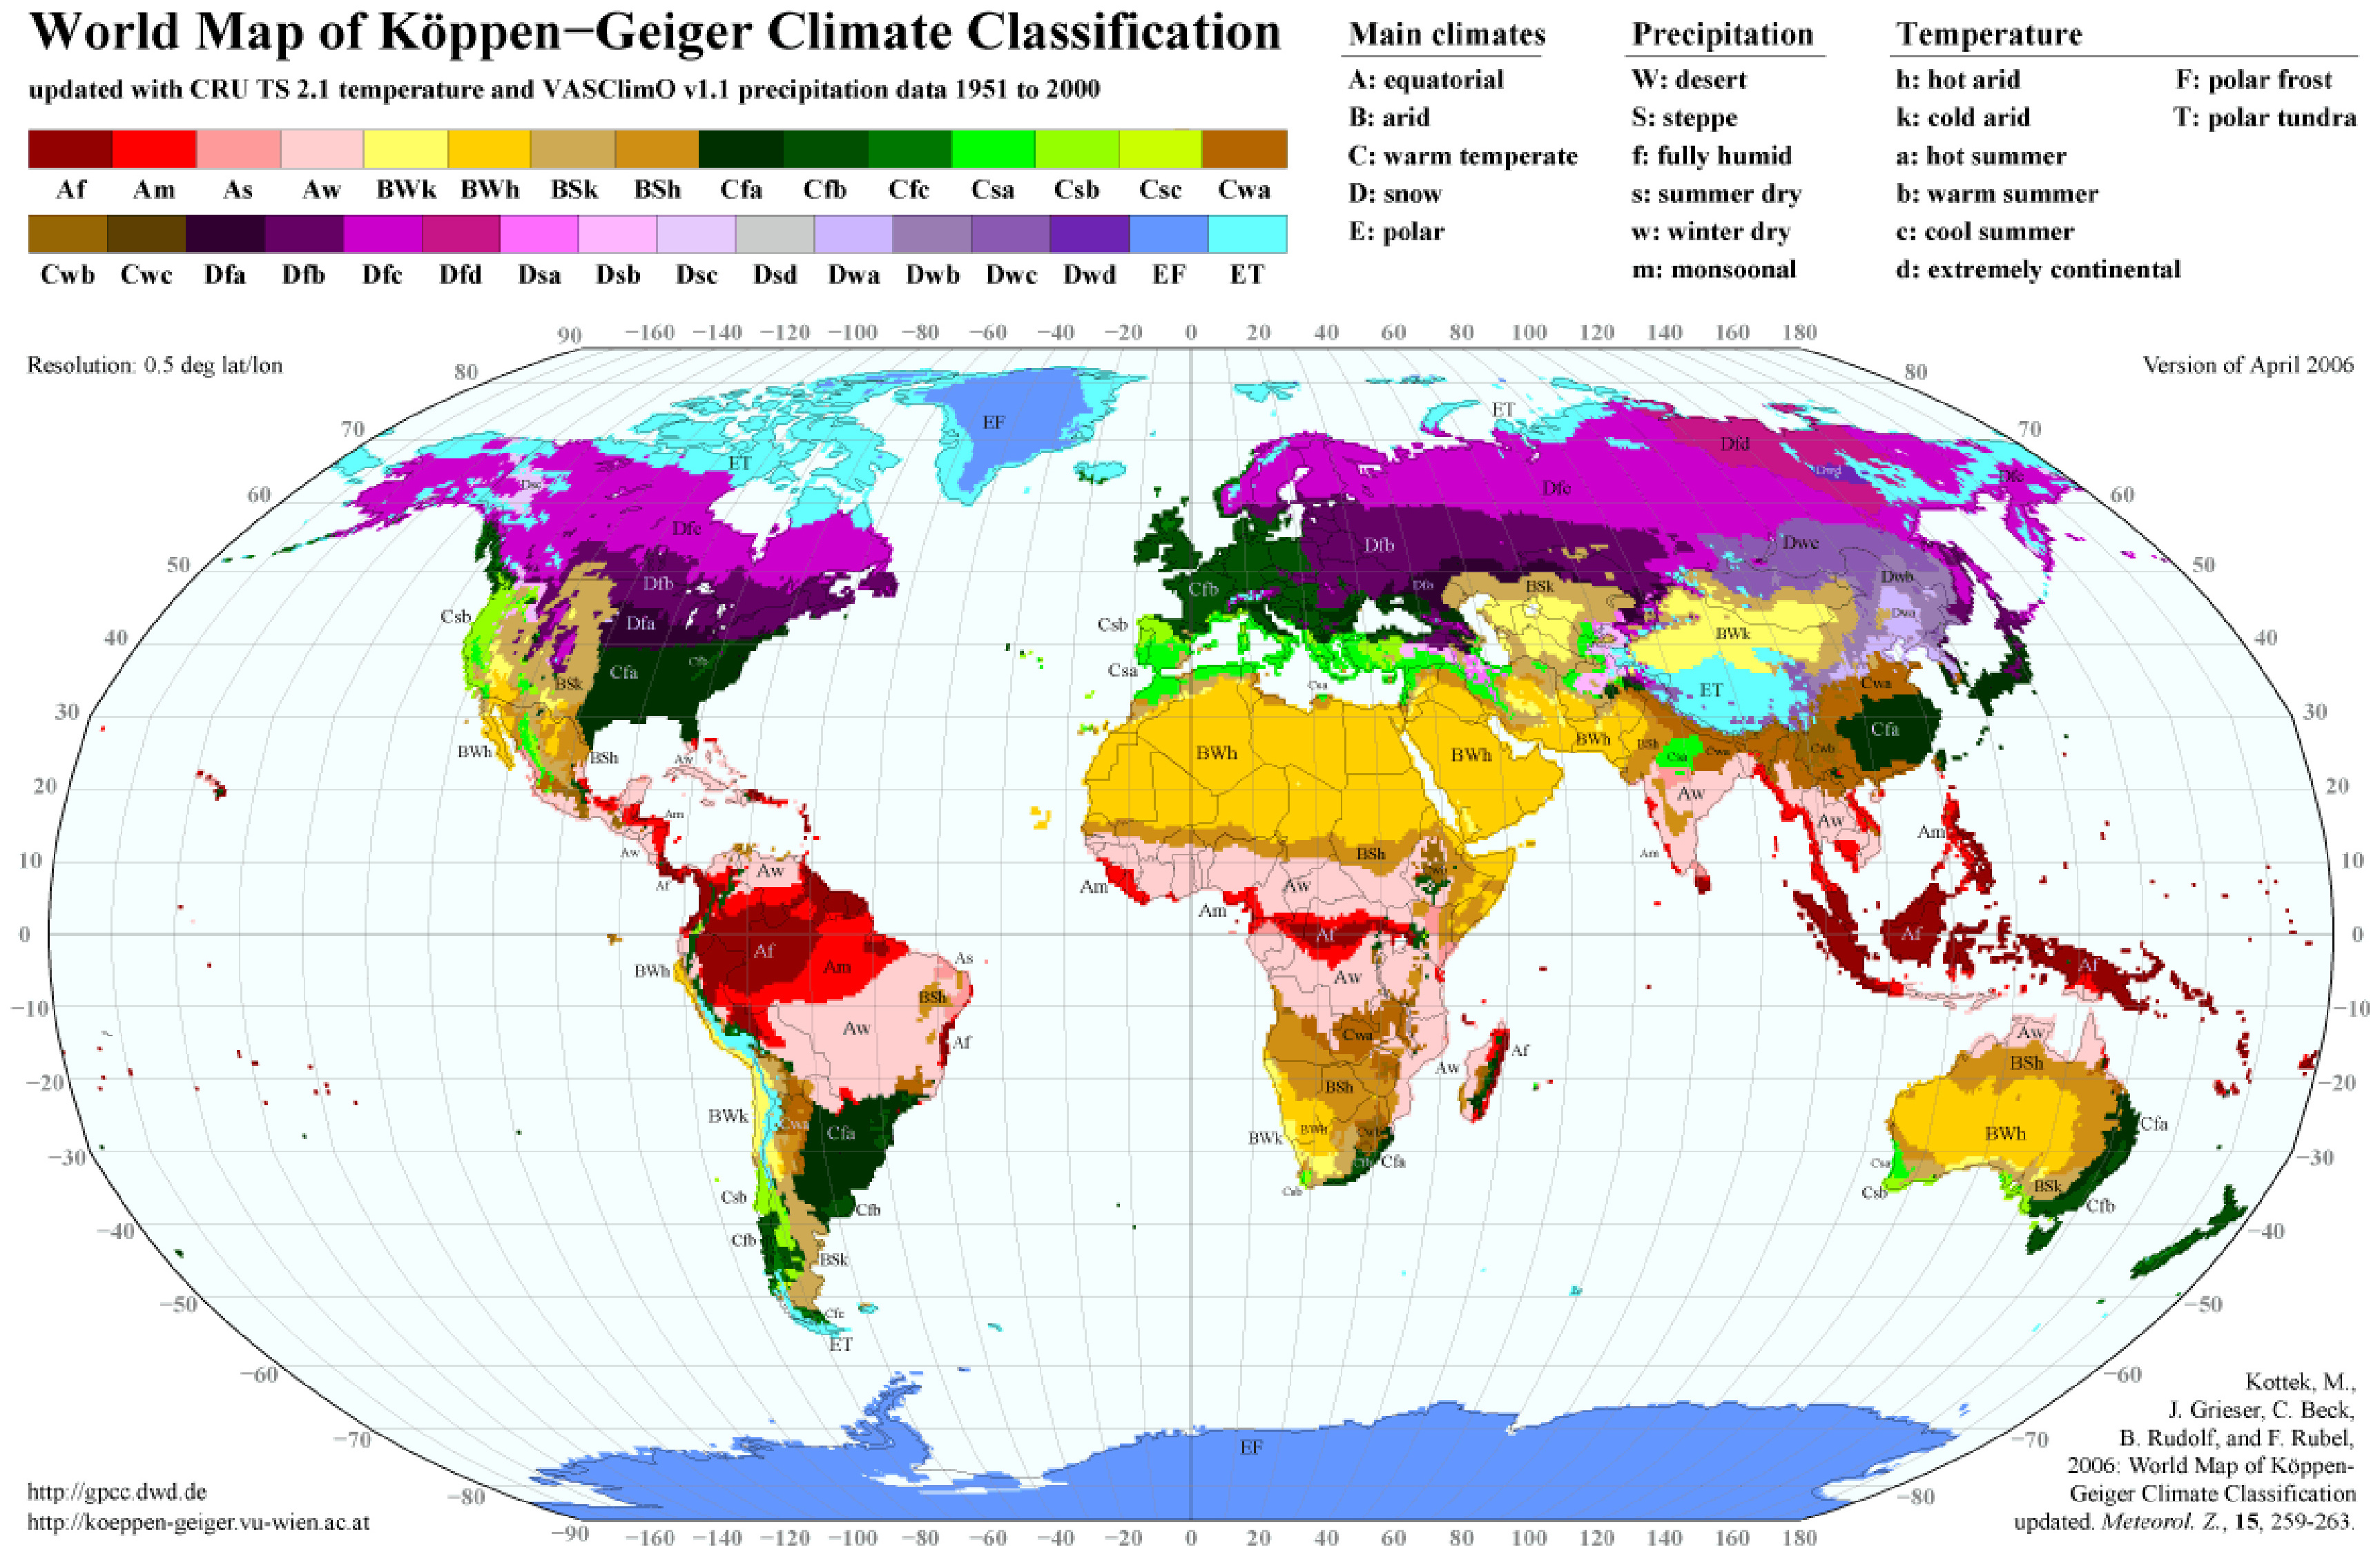
Figure 1 presents the global Köppen–Geiger climate classification according to Kottek et al. (2006, as cited in Nascimento et al., 2017), based on data from 1951 to 2000 and a spatial resolution of 0.5° × 0.5°. The map highlights the marked climatic contrast between the United States — which served as the basis for Hershfield’s original formulation and is predominantly characterized by temperate and snow climates — and northern Brazil, which is classified as equatorial, with persistently high temperatures and humidity. Additionally, hemispheric climatic asymmetries reinforce the need for region-specific analyses.
Given this climatic divergence, a study area was selected in the northern portion of the state of Pará, Brazil, characterized by strong convective activity and classified as having a tropical/equatorial climate (Instituto Brasileiro de Geografia e Estatística, 2002; Alvares et al., 2013). Beyond its meteorological relevance, the region has strategic socio-economic importance. It comprises major infrastructure such as refineries, reservoirs, hydroelectric and mining facilities, as well as export ports, particularly in the municipalities of Belém (the state capital) and Barcarena, a prominent industrial and logistical hub.
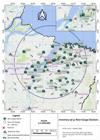
To construct a Regional Upper Envelope of frequency factors suitable for this climate, 52 rain gauge stations (listed in Table 1) were selected based on convective climatology criteria. The selected area was defined by a 200 km radius centered at latitude -1.5058° and longitude -48.6271° (SIRGAS 2000), covering data from 1949 to 2023, with an average record length of approximately 34 years.
Basic characteristics of the 52 rain gauge stations. The hydrological year considered was from January to December. [1]Climate Classification based in Alvares et al. (2013) and Instituto Brasileiro de Geografia e Estatística (2002). [2]Geographical coordinates in SIRGAS 2000.
Some rainfall stations have record lengths shorter than 20 years. These shorter series were retained to enhance spatial coverage in areas with limited gauge density, while acknowledging the higher uncertainty associated with limited sample size.
The durations analyzed were: 24 hours, 3 days, 5 days, 10 days, 15 days, and 30 days. In addition, the research was performed using daily rainfall data for each station. A factor of 1.14 was applied to daily rainfall to obtain 24-hour rainfall depths (Weiss, 1964, as cited in World Meteorological Organization, 2009).
The study area lies entirely within the Amazon biome (Instituto Brasileiro de Geografia e Estatística, 2019), primarily in the Tocantins–Araguaia Hydrographic Basin, bordering the Amazon Basin and the Western Northeast Atlantic Basin (Instituto Brasileiro de Geografia e Estatística, 2021).
From a climatic perspective, the region is strongly influenced by large-scale atmospheric circulation patterns, including the Hadley and Walker cells (Ferreira & Mello, 2005; Liberto, 2014). The Intertropical Convergence Zone (ITCZ) plays a central role in seasonal rainfall modulation, while Mesoscale Convective Complexes (MCCs) are responsible for high-intensity precipitation events, especially in the North and Northeast of Brazil. These convective systems, typically covering areas between 120,000 and 150,000 km2, are frequent during summer and autumn and significantly influence the regional precipitation regime (Maddox, 1980; Machado et al., 1994; Salio et al., 2007; Lyra et al., 2020). Machado et al. (1994) confirmed MCCs in South America with radii of approximately 240 km, reinforcing the relevance of convective phenomena in the precipitation regime of the study area.
According to Lima et al. (2025), the study area is predominantly located in zone 2 of homogeneous climate risk. The authors mention that zone 2 is a region “directly influenced by the ITCZ and, in its coastal part, by the Easterly Wave Disturbances. There is an out-of-phase relationship with the ONI, PDO, and AMO climate indices, influencing its interannual (ONI) and decadal/multidecadal (PDO/AMO) variability”. Lima et al. (2025) divided the Brazilian territory into 7 zones to facilitate the design of a climate risk management strategy.
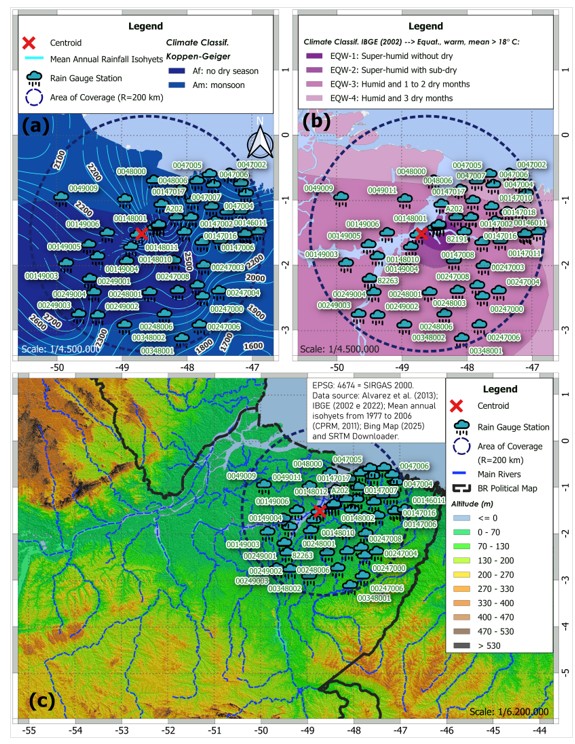
Figure 2 and Figure 3 illustrate the spatial distribution of the 52 rain gauge stations and provide a geographic and climatic characterization of the region, which is dominantly tropical, warm, and humid. For more detailed descriptions of the regional climatic system and its variability, see Martins (2024).
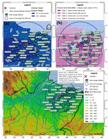
(a) Köppen-Geiger climate characterization (Alvares et al., 2013) in the region. The image also shows the mean annual rainfall isohyets, as well as the 52 rainfall stations considered in the study; (b) Instituto Brasileiro de Geografia e Estatística (2002) climate characterization of the study region; and (c) hypsometric map of the region with hydrography.
Table 1 summarizes the main attributes of each station, including coordinates (SIRGAS 2000), climate classification, elevation, and data availability. The hydrological year was defined from January to December.
Theoretical basis
Hershfield (1961a, 1961b, 1965), building upon the statistical formulation proposed by Chow (1951), proposed that the Probable Maximum Precipitation (PMP) could be represented by a theoretical upper limit, i.e., a precipitation value that would not be exceeded under given climatic conditions. Based on this assumption, he proposed the following formulation in Equation (1):
where is the estimate of the Probable Maximum Precipitation (PMP) for a given location and duration; is the mean of the series of n values of maximum annual rainfall, for a given duration; is the corresponding standard deviation; (or simply is the hydrological frequency (or recurrence) factor.
Adapting Equation (1) and determining , Hershfield calculated the frequency factors for each of the rainfall series from the stations studied (also known as local frequency factors). It should also be noted that the maximum value was excluded when calculating the mean and standard deviation.
where is the local frequency factor; is the maximum value of the time series; is the mean of the series excluding the value of maximum annual rainfall (); is the standard deviation of the series excluding the value of maximum annual rainfall ().
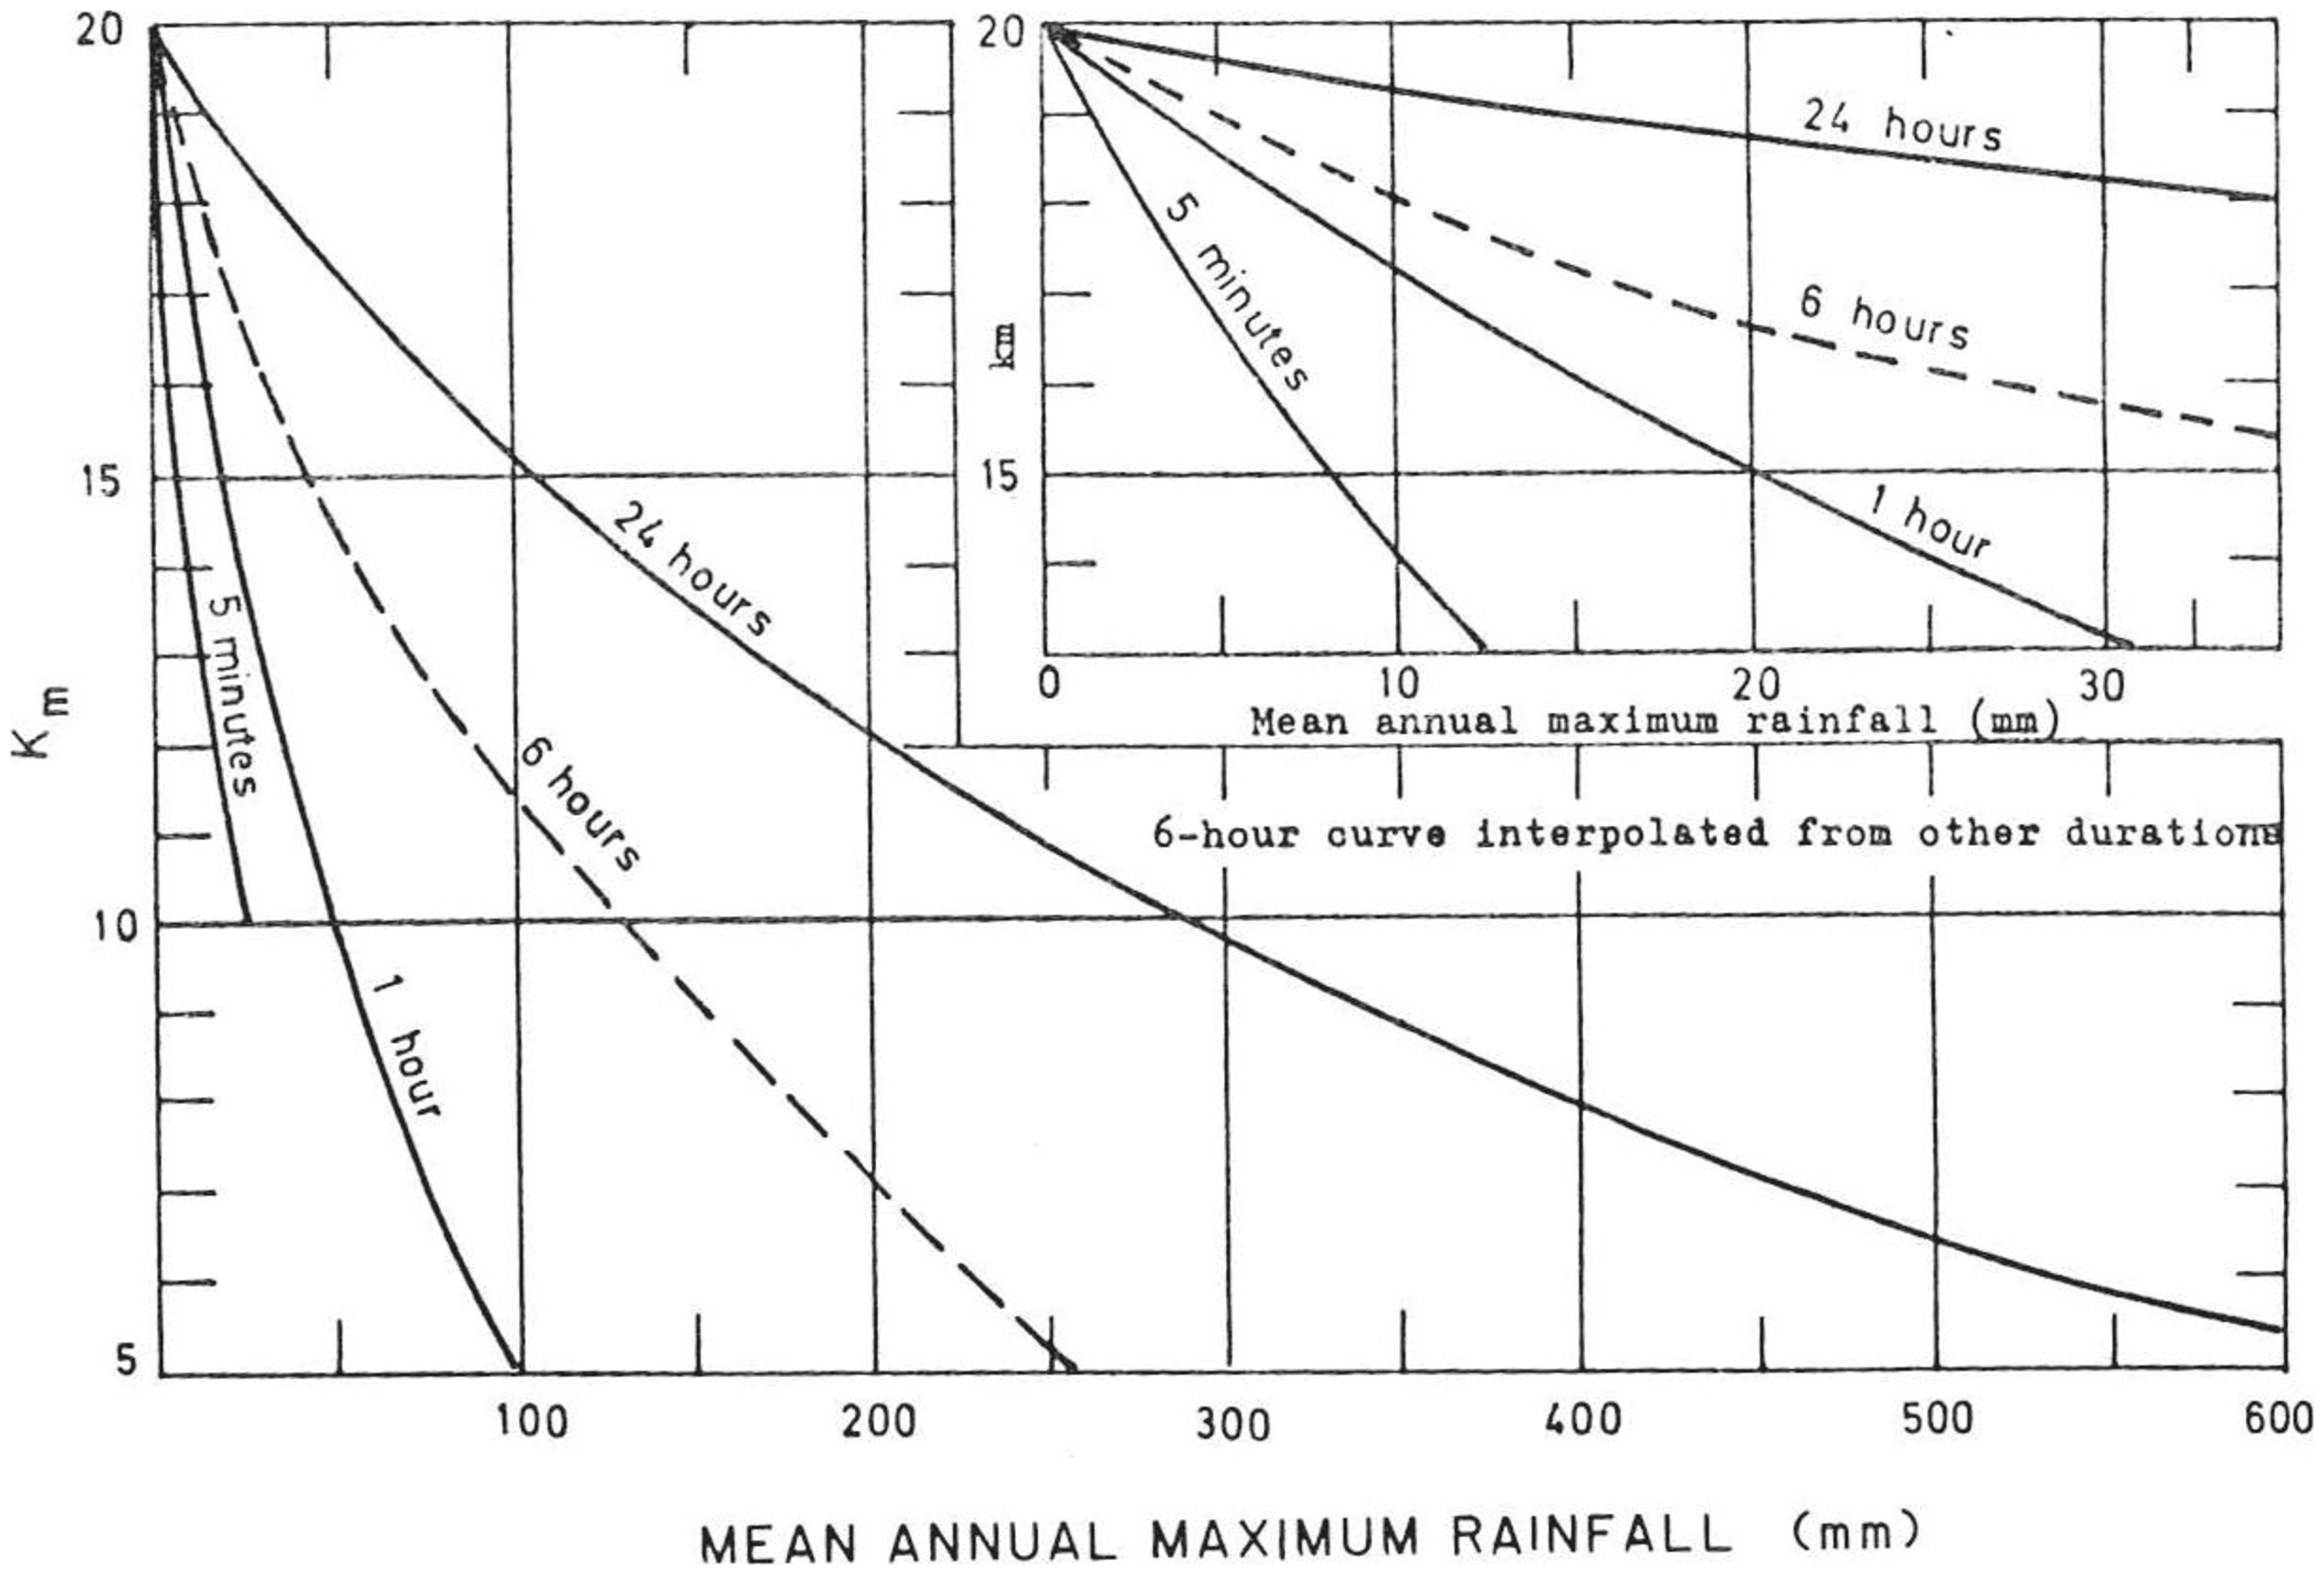
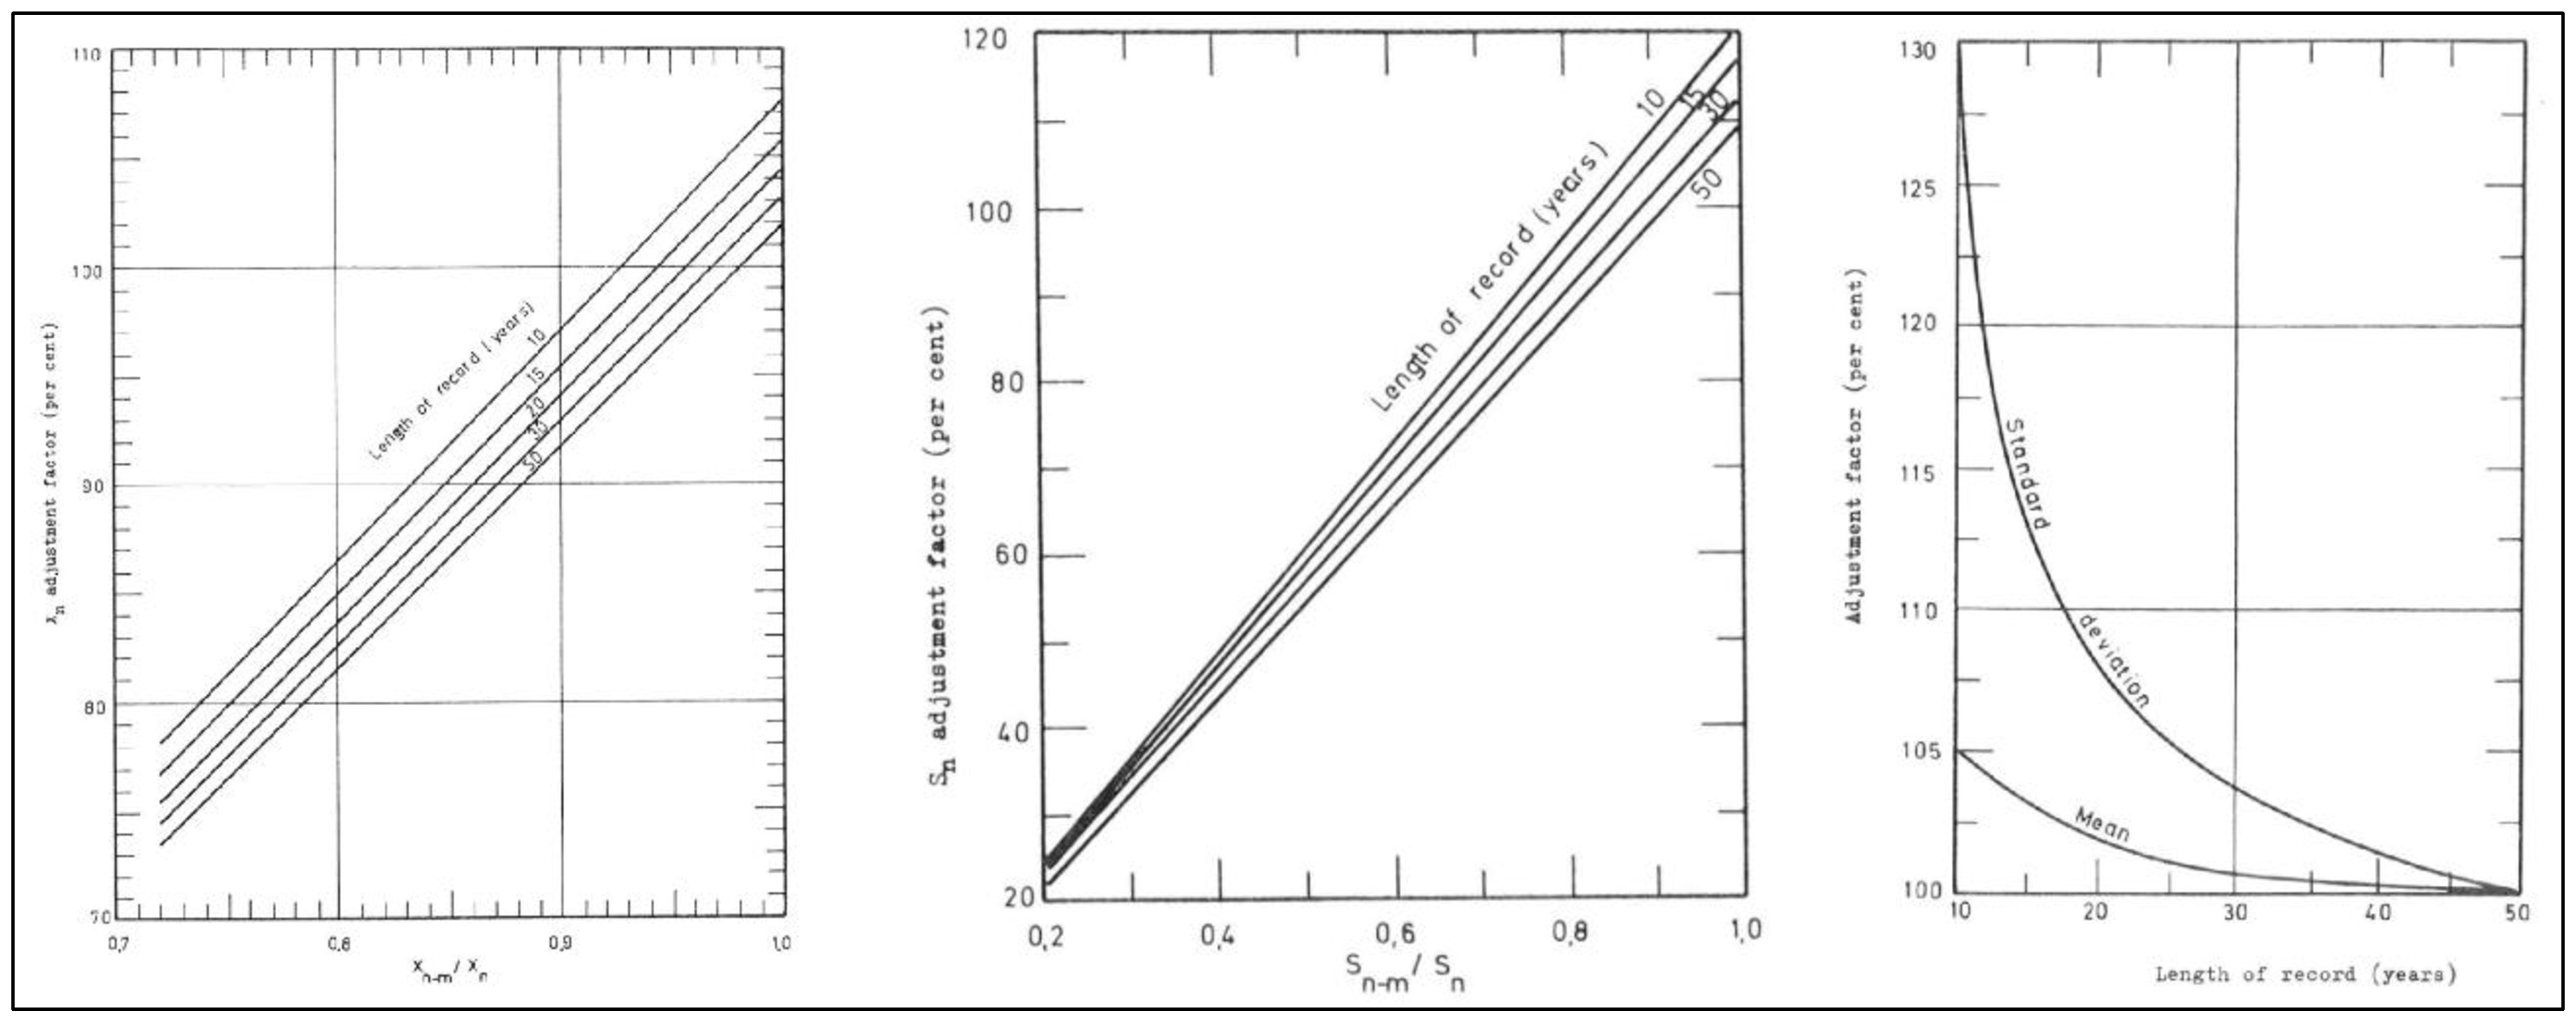
After computing local factors for multiple stations, Hershfield constructed a general upper envelope of values as a function of the mean annual maximum precipitation, allowing the derivation of a generalized upper-bound beyond the original dataset. This procedure is illustrated in Figure 4. To account for sampling variability and the influence of extreme values, additional adjustments were introduced to the estimation of the mean and standard deviation as functions of sample size and dispersion characteristics (Figure 5).
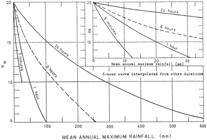
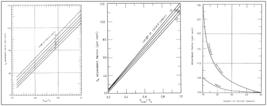
Adjustment of the mean and standard deviation based on the maximum value observed and the sample size.
It is important to note that the empirical basis for Hershfield's Upper Envelope was derived predominantly from rainfall stations located in temperate and cold climates, primarily in the United States, with records available up to the early 1960s. Consequently, the original envelope does not explicitly incorporate more recent precipitation records nor climatic regimes dominated by persistent deep convection, such as tropical and equatorial regions.
Reboita et al. (2010) emphasize that South America, especially Brazil, experiences high precipitation rates influenced by the complex interaction of upper-level and lower-level atmospheric systems. Such climatic characteristics may affect the statistical properties of annual precipitation maxima and, consequently, the representativeness of the generalized upper envelope when directly transferred to different climatic contexts.
The estimation of a representative value is sensitive to record length, dispersion, and climatic heterogeneity relative to the stations used to construct the original envelope. Overestimation of leads to inflated PMP values and potentially overconservative design parameters, whereas underestimation may reduce safety margins by understating the hydrometeorological hazard (World Meteorological Organization, 2009). Consequently, careful regional assessment of frequency factors is required when applying the Hershfield methodology outside its original development context.
Methodological framework
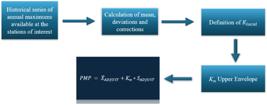
In general, a simplified flowchart summarizing the statistical PMP estimation procedure is presented in Figure 6.
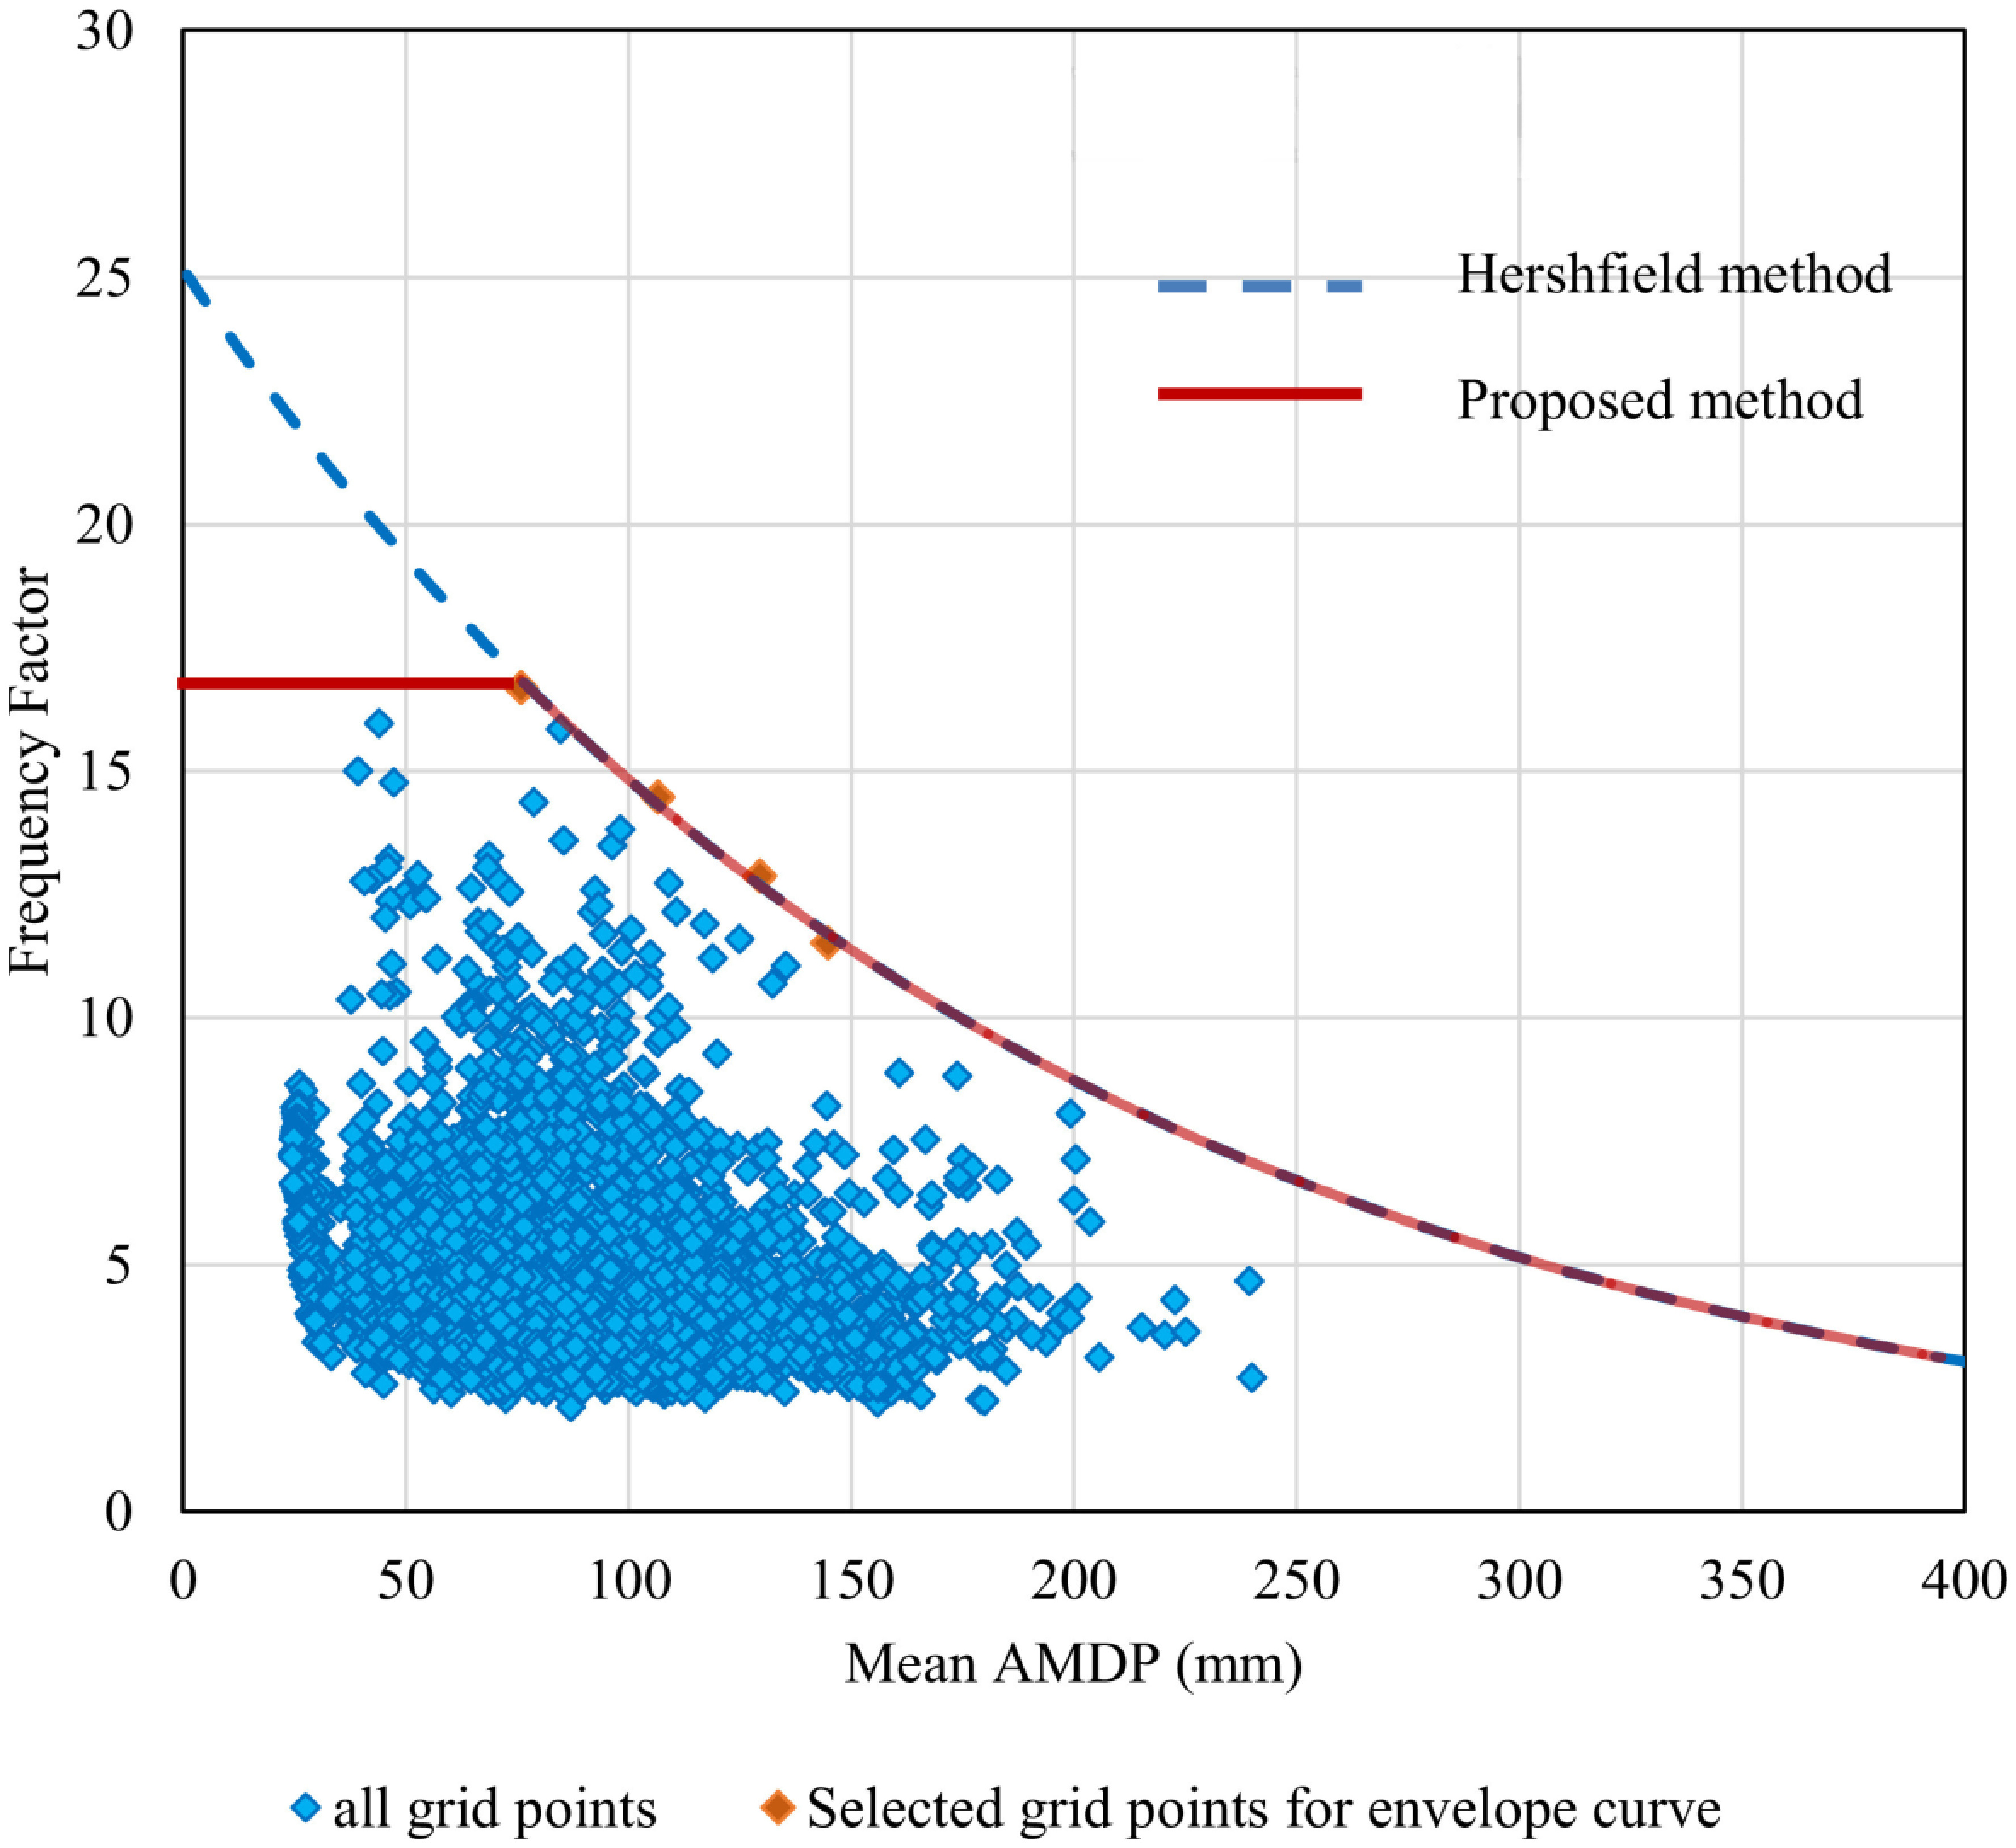
Sarkar & Maity (2020) proposed a modification to Hershfield’s methodology in which the Regional Upper Envelope is defined by two segments: (i) a constant plateau corresponding to the maximum observed , extending over the range of lower adjusted mean values; and (ii) an exponential decay segment beyond a transition mean, preserving the decreasing tendency of the original Hershfield envelope (see Figure 7).
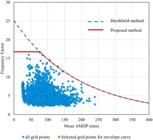
Relationship between mean annual maximum daily rainfall, the original Hershfield Upper Envelope, and the modified envelope proposed by Sarkar & Maity (2020).
The steps to estimate the PMP, using the statistical methodology presented by Sarkar & Maity (2020), are as follows:
-
Statistical characterization of annual maxima: For each analyzed duration, the mean () and standard deviation () of the annual maximum precipitation series were computed for all selected stations.
-
Adjustment for sample size and outliers: The mean and standard deviation were adjusted to account for the influence of extreme values and limited record length, following the adjustment procedures originally proposed by Hershfield (1961b) (see Figure 5). The resulting statistics are referred to as adjusted mean and adjusted standard deviation.
-
Computation of local frequency factors and regional envelope construction: Local frequency factors () were computed using Equation (2). A Regional Upper Envelope was then constructed according to the formulation proposed by Sarkar & Maity (2020), consisting of:
-
A constant plateau corresponding to the maximum observed;
-
Followed by an exponential decay function as a function of the adjusted mean.
The upper envelope was considered valid within the interval defined by the minimum and maximum adjusted means of the regional dataset. In summary, the plateau extends from the minimum adjusted mean to the transition mean , which is determined through numerical fitting of Equation (3). After that, exponential decay occurs.
-
PMP estimation: The PMP was finally estimated using Equation (1), with obtained from the Regional Upper Envelope defined in Step 3.
Equation (3) shows the formulation of Sarkar & Maity (2020) for the mathematical adjustment of regional upper envelopes:
where: is the regional frequency factor; is the maximum observed defining the constant plateau segment of the upper envelope; is the regional upper envelope adjustment coefficient, obtained through numerical optimization procedures; is the adjusted mean of the annual maximum precipitation series, for a given duration; is the adjusted mean corresponding to the transition point between the constant plateau and the exponential decay segment; and is the adjusted mean among all stations for the analyzed duration.
Brief discussions on Probable Maximum Precipitation (PMP) and associated return periods (RPs) were also included in this study. The following probability distributions were evaluated using parameter estimation by the method of L-moments: Exponential (exp), Gamma (gam), Generalized Pareto (gpa), Generalized Logistic (glo), GEV (gev), Gumbel (gum), Log-Normal (ln2), Log-Normal-3P (ln3), Log-Pearson-III (lp3) and Pearson-III (pe3).
The goodness-of-fit between the theoretical and empirical distributions was assessed through the non-parametric Kolmogorov–Smirnov test at a 5% significance level, complemented by the Root Mean Square Error (RMSE) between theoretical and empirical quantiles, along with visual inspection of the graphical fit. The procedures are detailed in Hosking & Wallis (1997) and Naghettini & Pinto (2007). It is important to note that all statistical adjustments were performed using daily rainfall data for each station.
RESULTS AND DISCUSSIONS
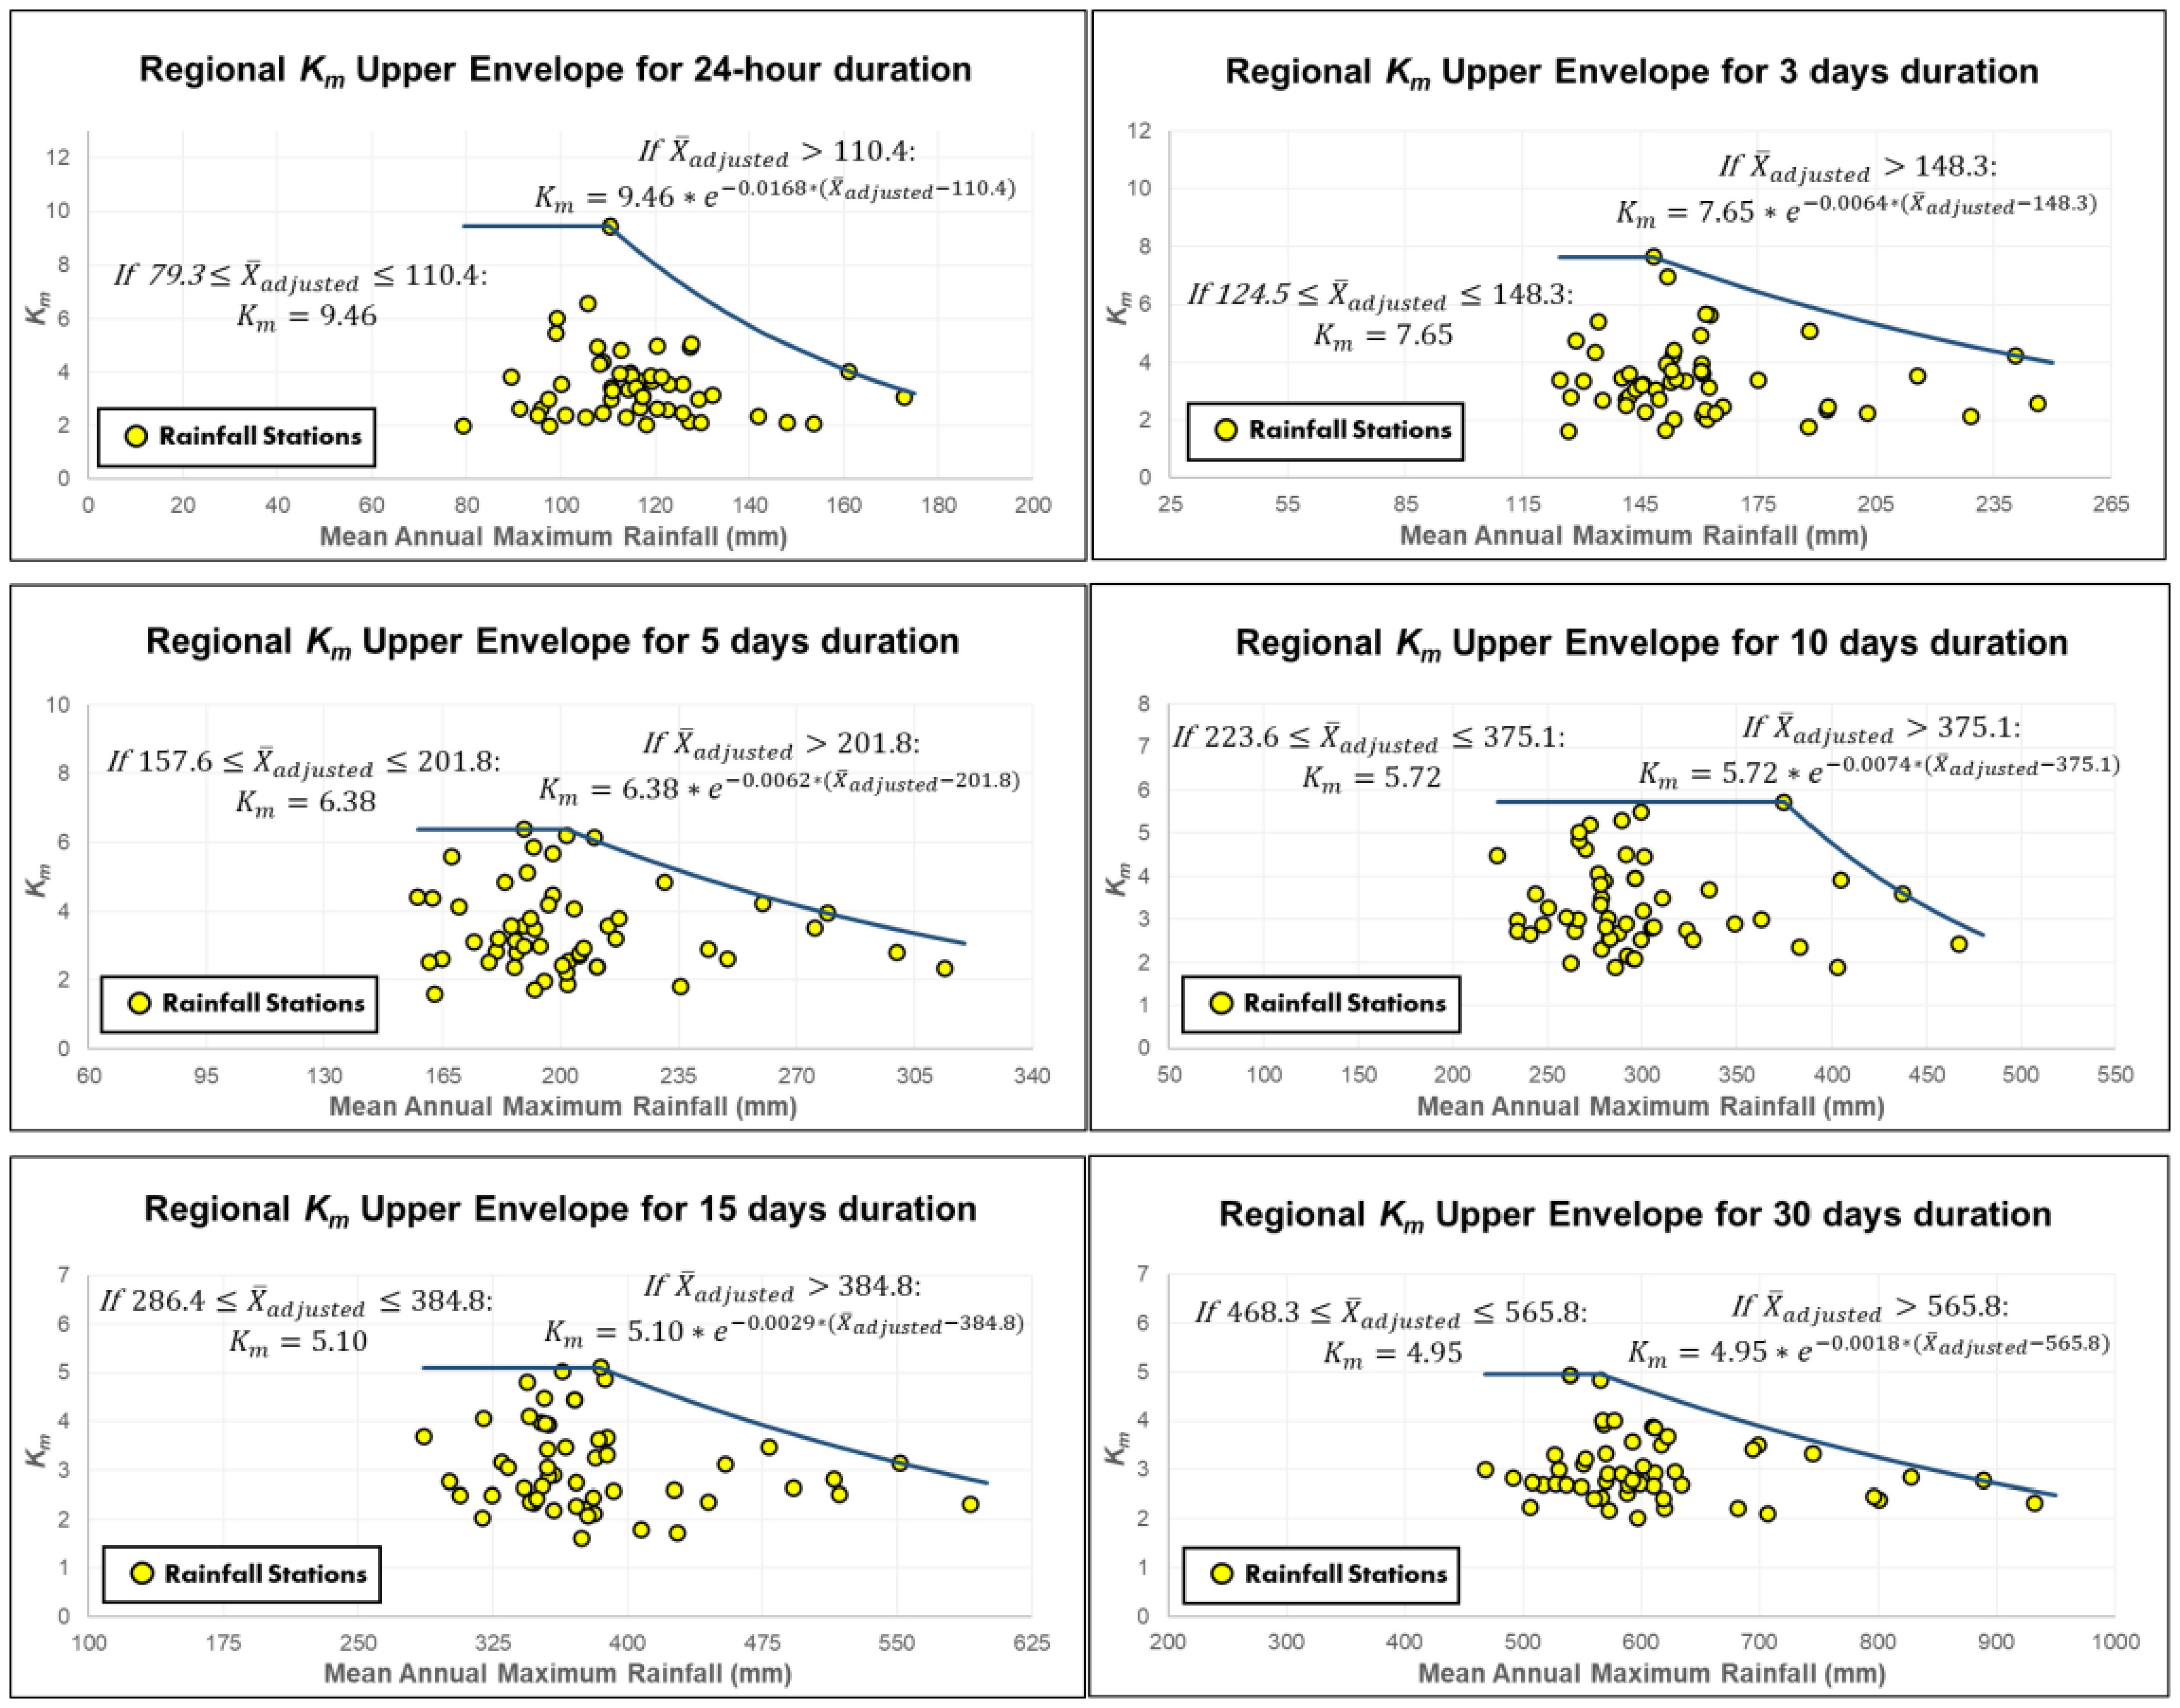
Figure 8 displays the Regional Upper Envelopes constructed for all six durations analyzed, as described in the Materials and Methods section. The results suggest a negative correlation between the magnitude of the mean annual maximum rainfall and , both within individual durations and across different durations. This inverse relationship was also identified by Burger (2014) in the southern region of Brazil.
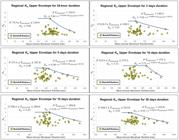
Regional Upper Envelopes as a function of mean maximum annual rainfall from 24 hours to 30 days. Yellow points represent values at rainfall stations.
The introduction of a constant plateau in the regional upper envelope, following Sarkar & Maity (2020), may modify the implicit exceedance probability associated with PMP estimates, particularly for lower mean rainfall values. While this structure limits unrealistically large frequency factors in low-mean regimes, it may produce PMP values lower than those derived from Hershfield’s Upper Envelope. Consequently, the resulting PMP estimates should be interpreted as regionally calibrated upper-bound estimates rather than absolute physical limits. Any implications regarding safety levels must therefore be evaluated within the broader framework of engineering criteria and regulatory standards applicable to critical infrastructure.
It is important to emphasize that the adoption of a plateau-based envelope is not motivated by economic considerations or by the intention to reduce design values. Rather, the objective is to avoid statistical inflation of frequency factors when the classical Hershfield envelope is extrapolated beyond the climatic conditions under which it was originally derived. In tropical regimes characterized by different precipitation dynamics, regional recalibration seeks to improve climatic representativeness while preserving the conservative intent inherent to PMP estimation.
Thus, the proposed regional envelope should be understood as a data-driven adaptation grounded in the statistical structure of the analyzed dataset. Its application requires professional judgment and must be integrated with existing safety regulations and risk management practices, particularly in contexts involving high-consequence hydraulic infrastructure.
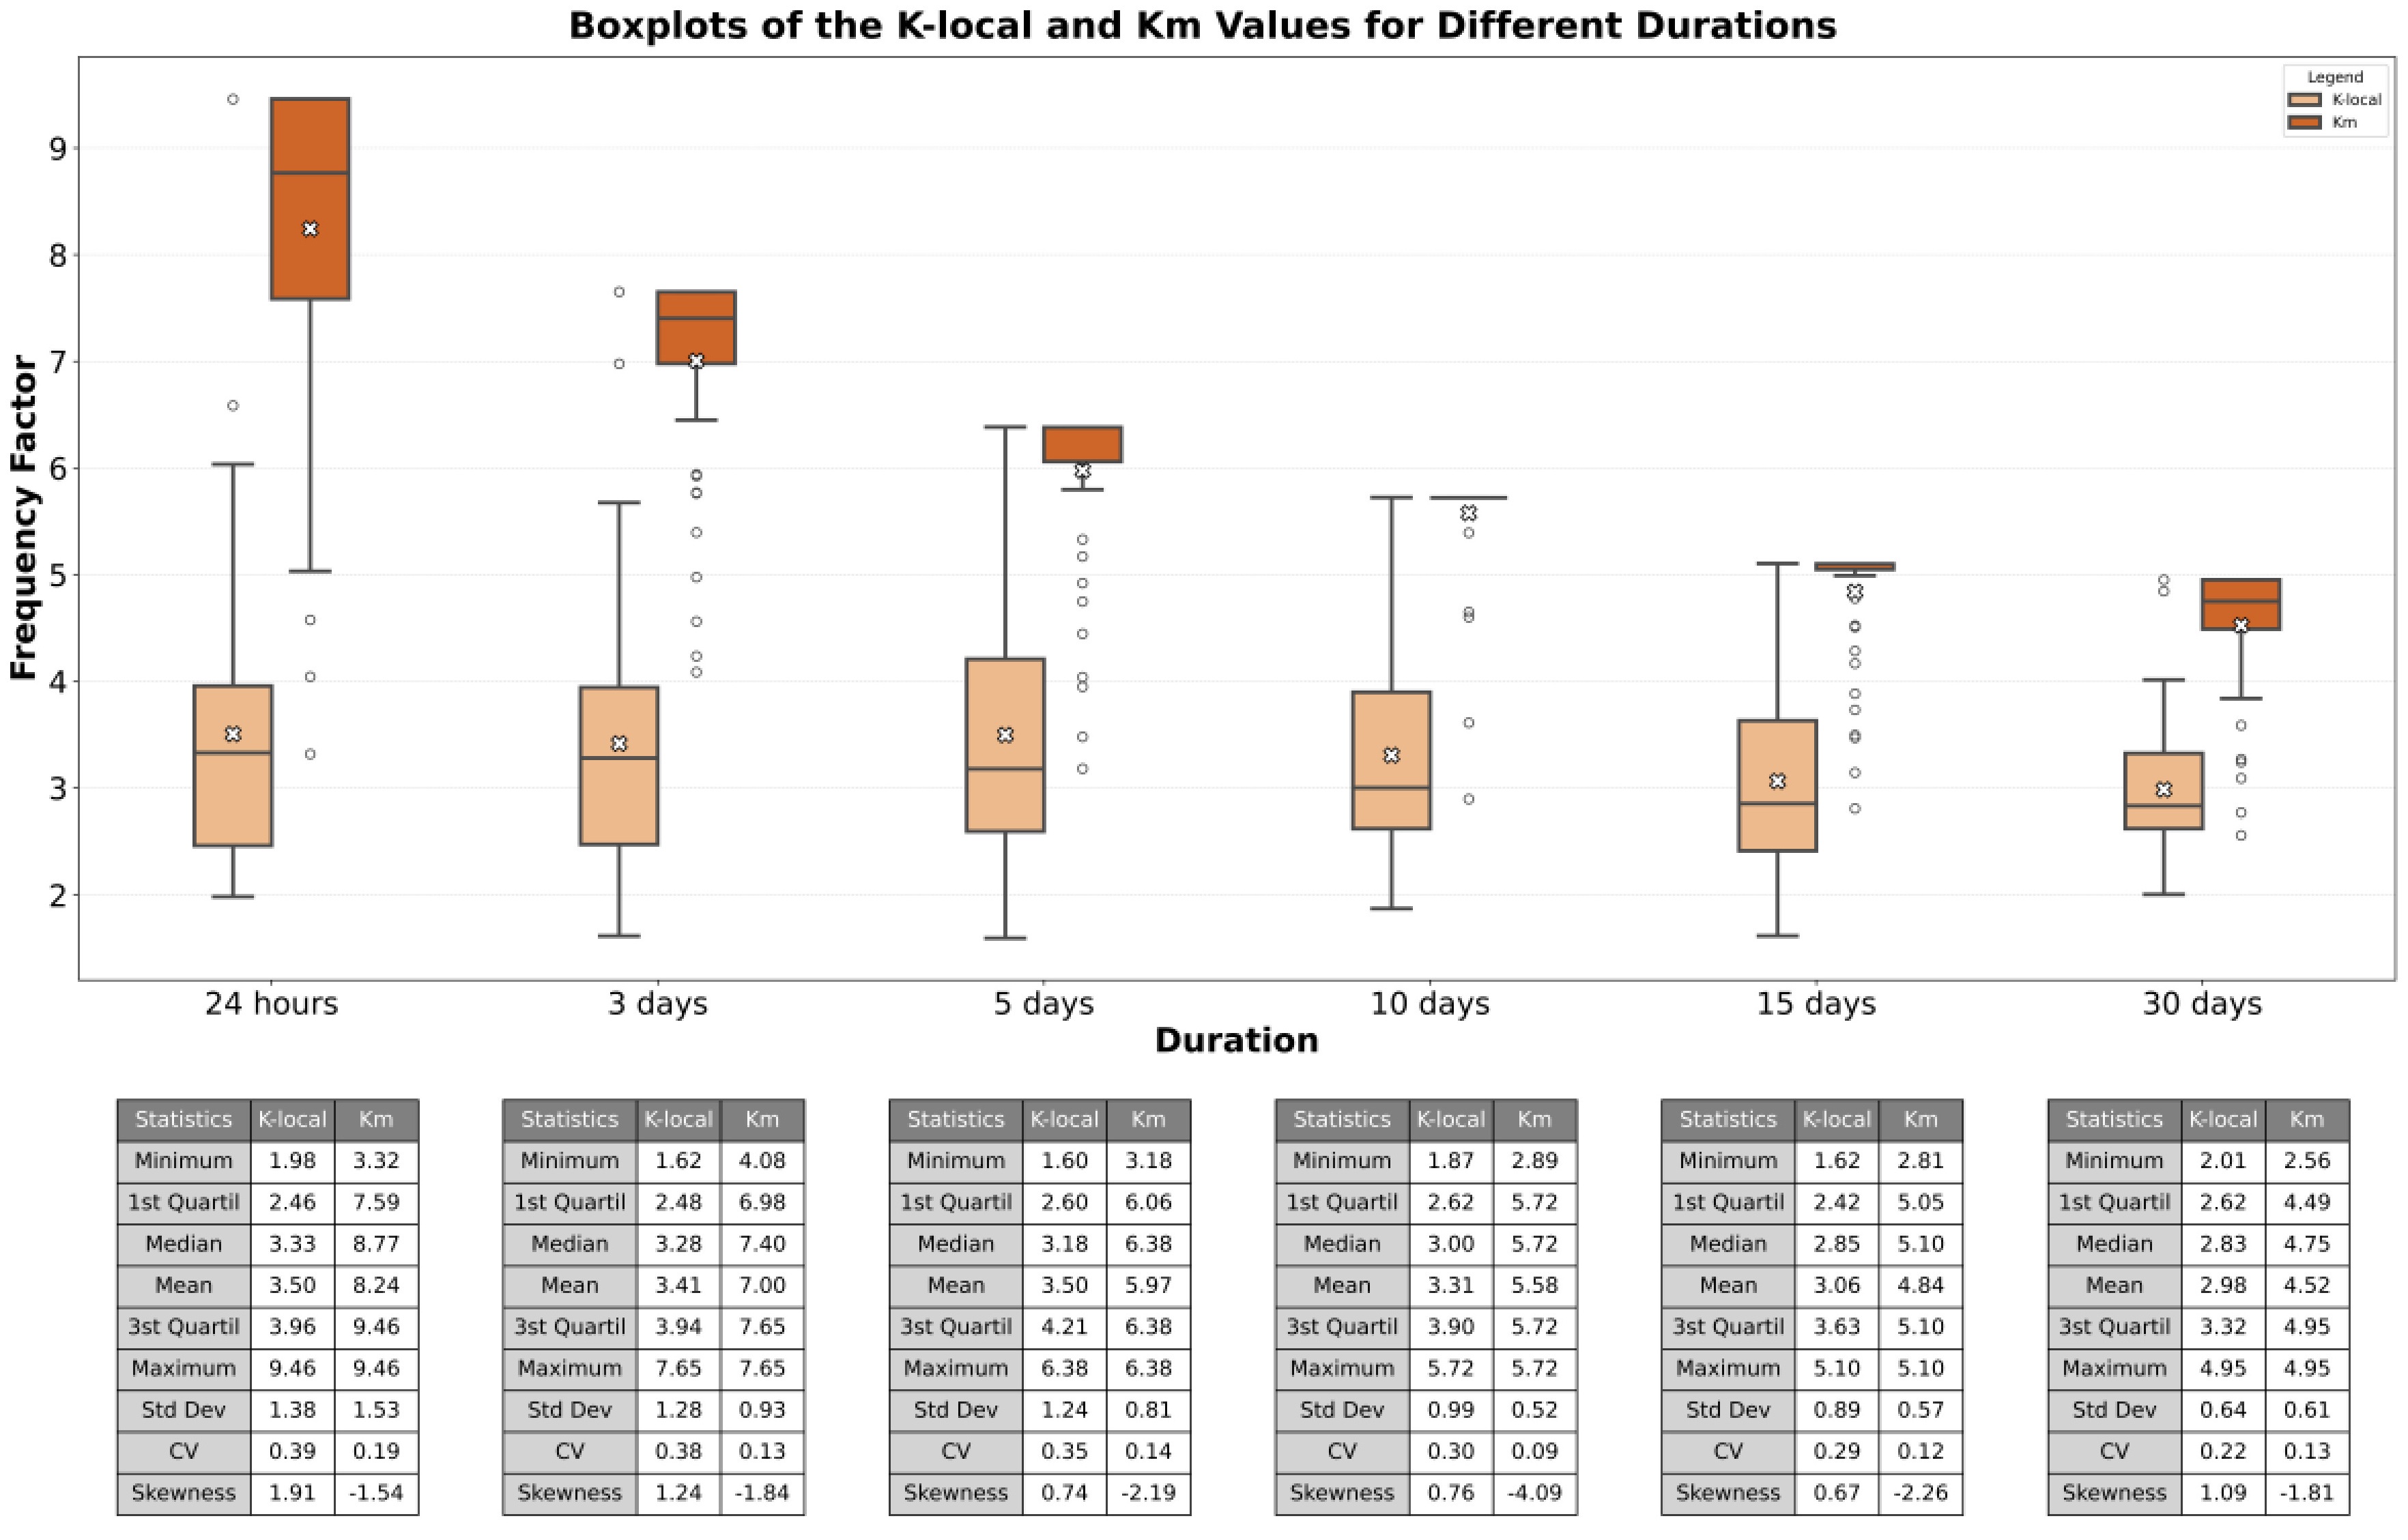
Figure 9 presents boxplots illustrating the variation in magnitude of both the 52 values of and the resulting across rainfall durations ranging from 24 hours to 30 days, accompanied by supporting statistical tables. Analyzing the behavior of , a clear decreasing trend is observed as the rainfall duration increases.
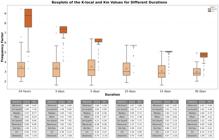
For all durations, the distribution of exhibits positive skewness, a typical feature of extreme-value-related statistics. A notable feature of the dataset analyzed is the progressive reduction in the standard deviation of values as duration increases, particularly evident for the 10-, 15-, and 30-day periods. This behavior may be associated with the convective-dominated rainfall regime of the region. Short-duration extremes are often controlled by isolated high-intensity convective events, which can generate substantial inter-station variability. In contrast, longer accumulation periods integrate the effects of multiple rainfall systems (e.g., ITCZ influence and mesoscale convective activity), leading to greater spatial coherence and reduced dispersion of regional frequency factors.
Additionally, the coefficient of variation for also shows a consistent decreasing pattern, suggesting reduced relative dispersion of the parameter as the duration increases.
Table 2 presents a synthesis of contributions from various authors, both in Brazil and globally, regarding the estimation of frequency factors. The discrepancies between Hershfield’s values and those observed in tropical regions such as Brazil are evident. Brazilian studies tend to yield lower s, reflecting updated data and regional climatic differences. This suggests that constructing a regional upper envelope could lead to more realistic and technically sound PMP estimates.
In general, Barbosa et al. (2023), in a nationwide study across Brazil, identified a maximum of approximately 9.6 for the 24-hour duration, very close to the value obtained in the present study (9.46). In southern Brazil, Sugai (1989) reported a maximum of 9.0 for the same duration, within a humid subtropical climate. Similarly, Desa et al. (2001), in Selangor, Malaysia — a region characterized by a hot and humid equatorial/tropical climate (Af in the Köppen–Geiger classification) — found a maximum of 8.7.
Some studies, such as Chavan & Srinivas (2015), adopt a simplified approach by applying a single value (typically the regional maximum) to estimate the deterministic statistical PMP across a set of stations. However, in the context of this study, such generalization is inadequate. Given the convective nature of rainfall systems in the region, which are highly localized and intense, it is necessary to preserve the association between the station-specific adjusted mean precipitation values and their corresponding derived from the Upper Envelope. The joint variability of mean precipitation, standard deviation, and frequency factors reflects the intrinsic spatial structure of extreme rainfall in the region and should therefore be explicitly maintained in regional analyses.
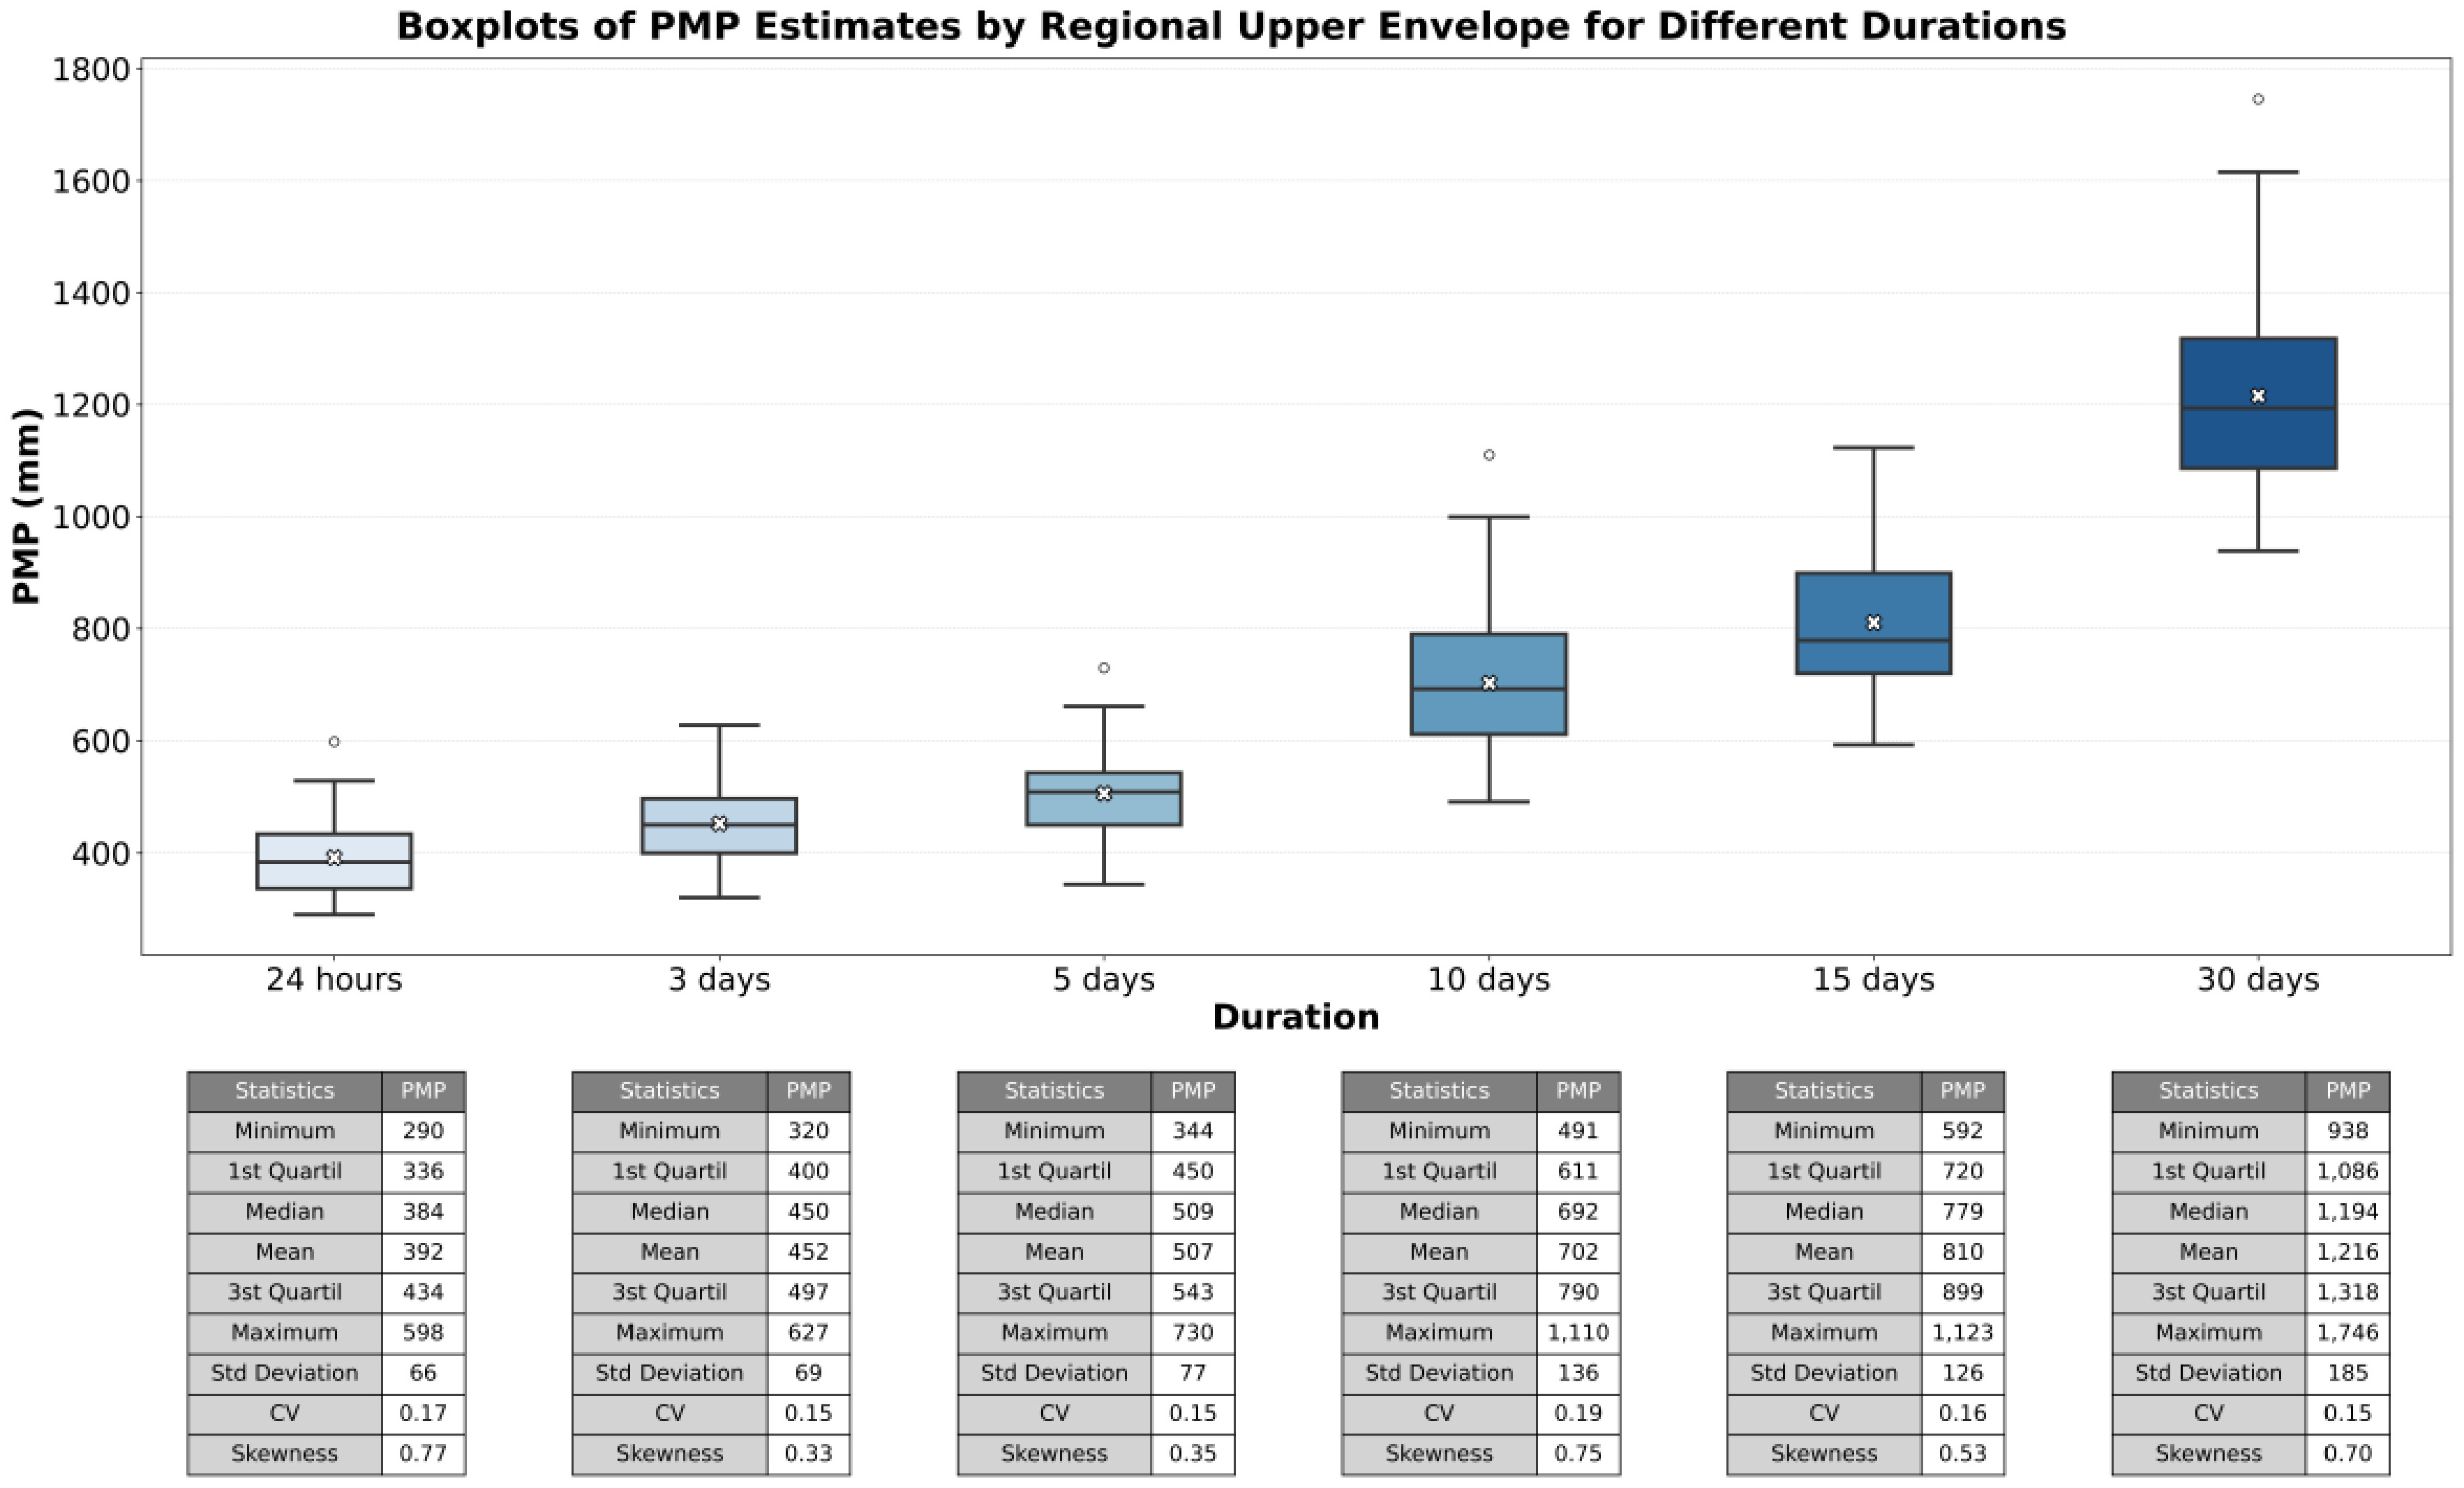
Figure 10 presents the statistical attributes of PMP estimates based on the regional upper envelope and Equation (1) using boxplots and supporting statistical tables. The medians increased from 384 mm (24-h) to 1,194 mm (30 days), following the expected behavior of accumulated precipitation. The coefficient of variation remains low throughout the durations (between 0.15 and 0.35), and the skewness is moderate, indicating a statistically robust and stable result.
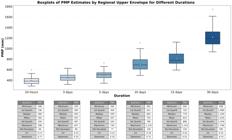
The relative consistency in PMP values, particularly for longer durations, suggests that the envelope performs well in attenuating local anomalies while preserving regional trends, fulfilling the methodological expectations of deterministic point PMP estimation.
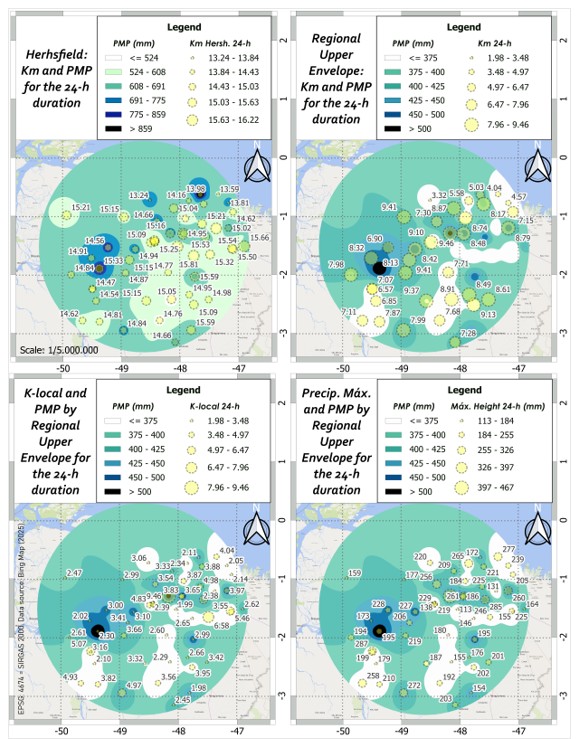
Figure 11 illustrates the spatial distribution of the 24-hour PMP, estimated using Hershfield’s Upper Envelope and the Regional Upper Envelope. Overlaid on the map are the corresponding values from both methods, the values, and the highest observed 24-hour rainfall at each station.
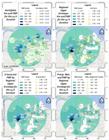
Spatial distribution of the 24-hour PMP using Hershfield’s method and Regional Upper Envelope method. Frequency factors are represented by scaled symbols, and the highest 24-hour rainfall records at each station are also indicated.
To spatially interpolate the PMP estimates, the Inverse Distance Weighting (IDW) method was applied with a power parameter , based on the evaluation by Ly et al. (2013). These authors reviewed several interpolation methods for hydrological variables and found IDW to be suitable for daily precipitation data.
PMP values for 24-hour estimated via the Hershfield method are consistently higher and more homogeneous, with ranging from 13.24 to 16.22 and PMP exceeding 850 mm in several locations (ranging from 440.0 to 959.1 mm).
In contrast, the regional method produces more spatially diverse and climatically coherent PMP values, with values predominantly ranging from 300 to 600 mm and values between 2.0 and 9.5. The resulting spatial pattern exhibits a more gradual transition across the domain, which aligns more closely with known regional rainfall mechanisms, including the influence of mesoscale convective systems and the Intertropical Convergence Zone (ITCZ) (Salio et al., 2007; Reboita et al., 2010; Lyra et al., 2020; Martins, 2024).
On average, the PMP values estimated by the two methods differed by 60%, with a minimum difference of 43% and a maximum of 135%. Furthermore, the values are directly influenced by the precipitation records at each station. The highest observed of 9.46 was associated with the station that recorded the highest historical 24-hour rainfall within the study area.
The consistent spatial patterns observed across all four panels of Figure 11 underscore both methodological distinctions and physically meaningful regional contrasts. The spatial distribution of higher PMP estimates is not random; rather, it delineates a coherent NE–SW-oriented corridor. This corridor encompasses stations in historically convection-prone zones, such as the Salgado coastal region (northeastern Pará, including Marapanim, Magalhães Barata, and Maracanã), the Pará River estuary (the Belém Metropolitan Area, Barcarena, and Santo Antônio do Tauá), and the confluence area of the Pará and Tocantins rivers (Muaná, Limoeiro do Ajuru, and Ponta de Pedras).
This observed pattern is consistent with the dominant atmospheric circulation features over northern Brazil. The northeasterly trade winds, which strike the coast at an average angle of 30° relative to the equator, constitute the primary vector for moisture influx from the Atlantic. This oceanic supply is augmented by local evapotranspiration from the Amazon. The region's weather is further modulated by the large-scale Hadley and Walker circulations and the seasonal southward migration of the ITCZ, which collectively create a favorable environment for deep convection. Within this context, MCCs can serve as the triggering mechanism for the most extreme events. Additionally, a local physiographic factor may amplify this effect: the natural channel of the Pará River and Marajó Bay, oriented NE–SW in alignment with the trade winds, may facilitate persistent moisture advection. This water body likely functions as a preferential moisture transport corridor: its smooth surface reduces friction and provides a continuous local source of humidity, enhancing convection in adjacent areas.
Therefore, the concentration of high PMP estimates in these areas directly reflects the local climatology of extremes. The annual maximum precipitation series for these stations exhibit a higher frequency and greater magnitude of extreme events. This is corroborated by mean annual rainfall totals ranging from 2,500 to 3,100 mm, with a notable maximum in the Belém Metropolitan Area (Companhia de Pesquisas de Recursos Minerais, 2011). The region's inherent vulnerability to extreme precipitation is further supported by its climatic classification. As detailed by IBGE (Instituto Brasileiro de Geografia e Estatística, 2002), the Belém Metropolitan Area, Barcarena, and their surroundings form the core of a Hot/Super-humid Equatorial climate (), distinguished by the complete absence of a dry season. This core is itself surrounded by a broader belt (~50 km radius) of a related but slightly drier subtype: Hot/Super-humid Equatorial sub-dry. This nested climatic structure highlights the area's persistent and intense humidity, rendering it inherently susceptible to the extreme events captured by the PMP analysis.
All point PMP estimation results, as well as the corresponding frequency factor values for all rainfall stations and durations, are available in the following public repository: https://doi.org/10.5281/zenodo.15103909.
Regarding the evaluation of return periods (RP), different probabilistic distributions exhibited varying performance across stations, as summarized in Table 3. The results highlight the statistical heterogeneity of rainfall behavior within the study area, with no single distribution consistently providing the best fit for all stations.
Number of rainfall stations associated with each of the probabilistic distributions included in the study.
Although several three-parameter distributions achieved satisfactory goodness-of-fit according to the Kolmogorov–Smirnov test and RMSE criteria, their application to high return periods revealed limitations associated with instability or upper-bound constraints imposed by the shape parameter. Such behavior is problematic in PMP estimation, which requires stable extrapolation to very low exceedance probabilities.
Therefore, the final selection was guided not solely by goodness-of-fit ranking, but by theoretical suitability for high-return-period extrapolation. The Gumbel distribution was adopted because it provided adequate fit at all stations, demonstrated low RMSE values and presents an unbounded upper tail, ensuring greater numerical stability in extreme quantile estimation. Its application in large-scale extreme rainfall analyses, such as those reported by Fernandes Juste et al. (2023), further supports its suitability for this purpose.
The Equations (4), (5) and (6) show the cumulative probability function of Gumbel, and the and parameters estimated by the L-moments method.
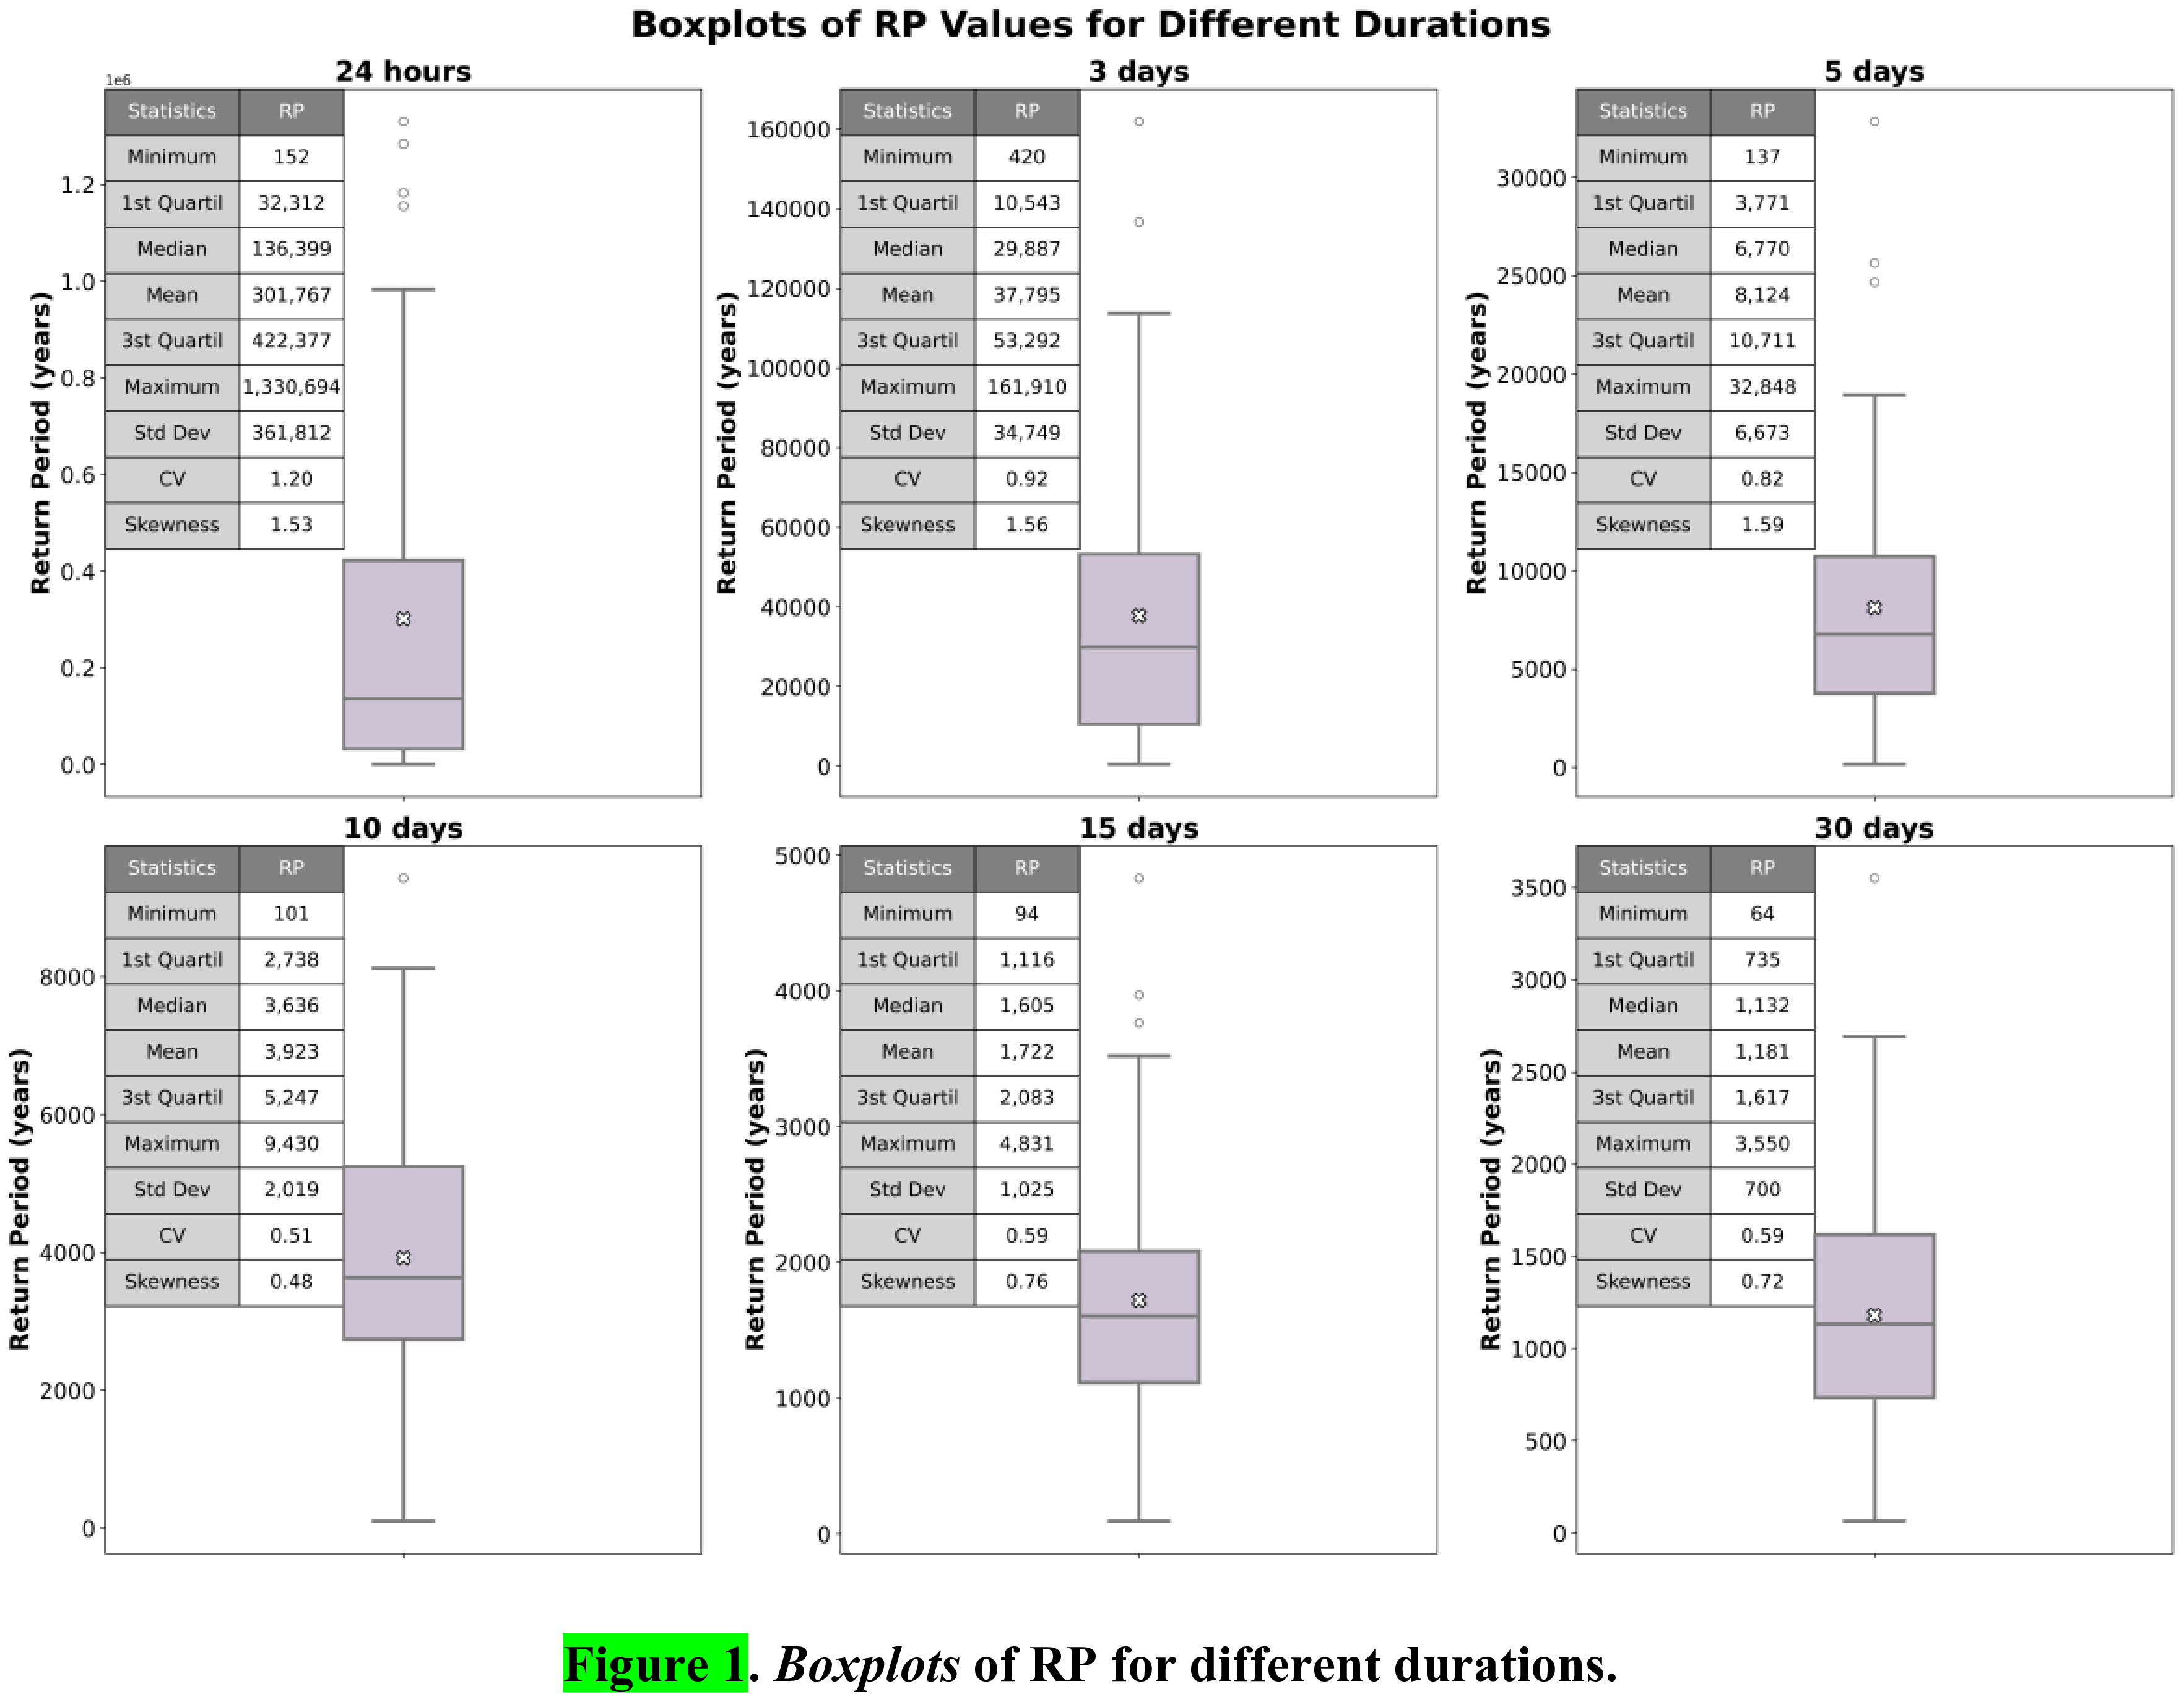
Lastly, Figure 12 presents the return periods (RP) associated with the PMP estimates for all rainfall stations and durations, displayed as boxplots.
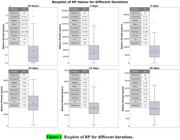
There is significant variability in the RP values, as indicated by the high standard deviations. For instance, for the 24-hour duration, RP estimates ranged from a minimum on the order of 100 years to values exceeding 1 million years. The median and mean RP values for 24 hours were approximately 140,000 and 300,000 years, respectively. This is consistent with the values reported by Sugai (1989) in southern Brazil, who obtained similar magnitudes using the Gumbel and Exponential distributions.
In terms of average or median values across the analyzed durations, RP values ranged from to years, characterizing the events as extreme. All the references cited in this study, such as National Research Council (1994), Nathan & Weinmann (2001, apud Fernandes, 2009), Ball et al. (2019), and Kappel et al. (2024), partially cover this range.
Overall, there was a decreasing trend in return periods magnitudes with increasing duration. This behavior is consistent with the rainfall dynamics of tropical convective systems, which are more likely to generate extreme events in short periods. This further supports the notion that return periods associated with PMP estimates should not be viewed as immutable values; rather, they represent statistical constructs contingent upon both the selected frequency factor and the specific distribution applied to the dataset.
Regarding skewness, values are elevated for durations between 24 hours and 5 days (1.53 to 1.59), reflecting the influence of localized extremes in a few stations.
Finally, this study constitutes the deterministic component of a broader research framework. A complementary study (Martins & Pinto, 2026) extends this analysis through Monte Carlo simulation and extreme value theory, providing probabilistic insights into point-specific PMP estimates.
CONCLUSIONS
This study demonstrates that the traditional Hershfield envelope — originally derived from temperate and cold climates in the Northern Hemisphere (Kottek et al., 2006, as cited in Nascimento et al., 2017) — is not directly transferable to hot, humid, equatorial regions such as northern Brazil. The regional envelope developed here captures distinct meteorological mechanisms of rainfall generation, climatic regulators, and geographical positioning, yielding PMP estimates that are both spatially coherent and physically plausible. These findings underscore that regionalization is not merely a statistical exercise, but a climatic necessity.
A key methodological insight is the consistent decreasing trend of values of the Regional Upper Envelope with increasing rainfall duration, a pattern likely generalizable to other tropical regions governed by convective systems. The high variability and positive skewness of further reinforce the spatial heterogeneity of extreme rainfall in such environments. Notably, the highest (9.46) corresponded to the station with the most extreme 24-hour rainfall record.
The adoption of a plateau-based regional envelope improves climatic representativeness but may alter the implicit exceedance probability of PMP estimates relative to the Hershfield formulation. This trade-off between regional specificity and conservative design must be carefully weighed against applicable safety margins and regulatory frameworks for critical infrastructure. Return period estimates, while confirming the extremity of the events (ranging from to years), exhibited sensitivity to the chosen probabilistic distribution — reinforcing the need for distributional assumptions to be physically and statistically justified.
Despite these sensitivities, the regional upper envelope methodology proved consistent and appropriate for representing the climatological and statistical structure of the study area. It offers a transferable framework for point PMP estimation in data-scarce tropical regions, where convective processes dominate and where the direct application of Hershfield's original parameters may lead to overestimation or misrepresentation of risk.
Future research may integrate probabilistic methods or non-stationary climate modeling to refine PMP estimates under evolving climatic conditions. A companion study (Martins & Pinto, 2026, under revision) advances this agenda by associating frequency factors with probabilities of non-exceedance through Monte Carlo simulation and extreme value theory, thereby bridging the gap between deterministic and probabilistic PMP frameworks.
ACKNOWLEDGEMENTS
The authors are grateful to the Postgraduate Program in Sanitation, Environment and Water Resources of the Universidade Federal de Minas Gerais (UFMG), where this research was developed. The authors also thank the reviewer and the editorial board for their constructive comments, which contributed to improving the quality of the manuscript.
DATA AVAILABILITY STATEMENT
Research data is available in a repository: https://doi.org/10.5281/zenodo.15103909
REFERENCES
-
Afzali-Gorouh, Z., Bakhtiari, B., & Qaderi, K. (2018). Probable maximum precipitation estimation in a humid climate. Natural Hazards and Earth System Sciences, 18(11), 3109-3119. https://doi.org/10.5194/nhess-18-3109-2018
» https://doi.org/10.5194/nhess-18-3109-2018 - Agência Nacional de Águas e Saneamento Básico – ANA. (2016). Manual do empreendedor sobre segurança de barragens – Volume V: diretrizes para a elaboração de projeto de barragens Brasília, DF: Ministério do Meio Ambiente e Mudança do Clima.
- Agência Nacional de Mineração – ANM. (2022). Resolução ANM nº 95, de 07 de fevereiro de 2022. Consolida os atos normativos que dispõem sobre segurança de barragens de mineração Brasília, DF: Ministério de Minas e Energia.
-
Alvares, C. A., Stape, J. L., Sentelhas, P. C., Gonçalves, J. L. M., & Sparovek, G. (2013). Köppen’s climate classification map for Brazil. Meteorologische Zeitschrift, 22(6), 711-728. https://doi.org/10.1127/0941-2948/2013/0507
» https://doi.org/10.1127/0941-2948/2013/0507 - Associação Brasileira de Normas Técnicas – ABNT. (2017). NBR 13028: Mineração — Elaboração e apresentação de projeto de barragens para disposição de rejeitos, contenção de sedimentos e reservação de água — Requisitos Rio de Janeiro: ABNT.
- Ball, J., Babister, M., Nathan, R., Weeks, W., Weinmann, E., Retallick, M., & Testoni, I. (2019). Australian rainfall and runoff: a guide to flood estimation Canberra: Commonwealth of Australia.
- Barbosa, A. G., Silva, A. F. R., & Costa, V. A. F. (2023). Estimativa espacial da Precipitação Máxima Provável com duração de 24 horas para o território brasileiro. In XXV Simpósio Brasileiro de Recursos Hídricos (pp. 10). Porto Alegre: ABRHidro.
- Berod, D., Devred, D., Laglaine, V., Chaix, O., Altinakar, M., & Delley, P. (1992). Calcul des crues extrèmes par dés methodes deterministes du type pluie maximale probable (PMP)/crue maximale probable (PMF): application au cas de la Suisse Lausanne: École Polytechnique Fédérale de Lausanne.
- Burger, L. C. (2014). Adaptação e análise do método de Hershfield para estimativa da precipitação máxima provável (PMP) (Dissertação de mestrado). Universidade Federal do Paraná, Curitiba.
-
Casas-Castillo, M. C., Rodríguez-Solà, R., Navarro, X., Russo, B., Lastra, A., González, P., & Redaño, A. (2018). On the consideration of scaling properties of extreme rainfall in Madrid (Spain) for developing a generalized intensity-duration-frequency equation and assessing probable maximum precipitation estimates. Theoretical and Applied Climatology, 131(1-2), 573-580. https://doi.org/10.1007/s00704-016-1998-0
» https://doi.org/10.1007/s00704-016-1998-0 -
Cavalcanti, R. L. C., Silva, C. H. D. S., Jesus, E. S. D., Filho, M. C., & Stošić, T. (2018). Estudo da Precipitação Máxima Provável e tempo de retorno em Recife (PE). In III Congresso Internacional das Ciências Agrárias – COINTER, João Pessoa. Recife: Instituto IDV. https://doi.org/10.31692/2526-7701.IIICOINTERPDVAGRO.2018.00125
» https://doi.org/10.31692/2526-7701.IIICOINTERPDVAGRO.2018.00125 -
Chavan, S. R., & Srinivas, V. V. (2015). Probable maximum precipitation estimation for catchments in Mahanadi river basin. Aquatic Procedia, 4, 892-899. https://doi.org/10.1016/j.aqpro.2015.02.112
» https://doi.org/10.1016/j.aqpro.2015.02.112 - Centrais Elétricas Brasileiras – Eletrobras. (2003). Critérios de projeto civil de usinas hidrelétricas Rio de Janeiro: Eletrobras.
-
Chow, V. T. (1951). A general formula for hydrologic frequency analysis. Transactions - American Geophysical Union, 32(2), 231-237. https://doi.org/10.1029/TR032i002p00231
» https://doi.org/10.1029/TR032i002p00231 - Conceição, M. P. D. A. S., & Fontes, A. S. (2019). Risco hidrológico associado à Precipitação Máxima Provável em Barragens do semiárido baiano. In XXIII Simpósio Brasileiro de Recursos Hídricos Porto Alegre: ABRHidro.
- Companhia de Pesquisas de Recursos Minerais – CPRM. (2011). Levantamento da geodiversidade: projeto atlas pluviométrico do Brasil: isoietas anuais médias: período 1977 a 2006 Brasília: CPRM.
-
Desa, M. N., Noriah, A. B., & Rakhecha, P. R. (2001). Probable maximum precipitation for 24 h duration over southeast Asian monsoon region - Selangor, Malaysia. Atmospheric Research, 58(1), 41-54. https://doi.org/10.1016/S0169-8095(01)00070-9
» https://doi.org/10.1016/S0169-8095(01)00070-9 -
Desa, M. N., & Rakhecha, P. R. (2007). Probable maximum precipitation for 24-h duration over an equatorial region: Part 2-Johor, Malaysia. Atmospheric Research, 84(1), 84-90. https://doi.org/10.1016/j.atmosres.2006.06.005
» https://doi.org/10.1016/j.atmosres.2006.06.005 -
Dooge, J. C. L. (1986). Looking for hydrologic laws. Water Resources Research, 22(9S), 46S-58S. https://doi.org/10.1029/WR022i09Sp0046S
» https://doi.org/10.1029/WR022i09Sp0046S - Fernandes, W. S. (2009). Método para a estimação de quantis de enchentes extremas como o emprego conjunto de análise bayesiana, de informações não sistemáticas e de distribuições limitadas superiormente (Tese de doutorado). Universidade Federal de Minas Gerais, Belo Horizonte.
-
Fernandes Juste, T., de Miranda Reis, M., & da Silva Rocha Paz, I. (2023). Uma Aplicação da distribuição de Gumbel para valores extremos de precipitação em municípios com dados de chuva em todo Brasil. Revista Militar de Ciência e Tecnologia, 39(3), 95-214. Retrieved in 2026, April 30, from http://www.ebrevistas.eb.mil.br/CT/article/view/10517
» http://www.ebrevistas.eb.mil.br/CT/article/view/10517 -
Ferreira, A. G., & Mello, N. G. D. S. (2005). Principais sistemas atmosféricos atuantes sobre a região nordeste do brasil e a influência dos oceanos pacífico e atlântico no clima da região. Revista Brasileira de Climatologia, 1(1), https://doi.org/10.5380/abclima.v1i1.25215
» https://doi.org/10.5380/abclima.v1i1.25215 - Hershfield, D. M. (1961a). Technical Paper Nº. 40: Rainfall Frequency Atlas of the United States, Department of Commerce Washington, DC: Weather Bureau.
-
Hershfield, D. M. (1961b). Estimating the probable maximum precipitation. Journal of the Hydraulics Division, 87(5), 99-106. https://doi.org/10.1061/JYCEAJ.0000651
» https://doi.org/10.1061/JYCEAJ.0000651 -
Hershfield, D. M. (1965). Method for estimating probable maximum rainfall. Journal - American Water Works Association, 57(8), 965-972. https://doi.org/10.1002/j.1551-8833.1965.tb01486.x
» https://doi.org/10.1002/j.1551-8833.1965.tb01486.x - Horton, R. E. (1936). Hydrologic conditions as affecting the results of the application of methods of frequency analysis to flood records. U.S. Geological Survey Water-Supply Paper, (771), 433-449.
-
Hosking, J. R. M., & Wallis, J. R. (1997). Regional Frequency Analysis - an approach based on L-moments (224 p.). Cambridge: Cambridge University Press. https://doi.org/10.1017/CBO9780511529443
» https://doi.org/10.1017/CBO9780511529443 - Instituto Brasileiro de Geografia e Estatística – IBGE. (2002). Mapa de Clima do Brasil, Escala 1:5.000.000 Rio de Janeiro: IBGE.
- Instituto Brasileiro de Geografia e Estatística – IBGE. (2019). Biomas e Sistema Costeiro-Marinho do Brasil, Escala 1:50.000 Rio de Janeiro: IBGE.
- Instituto Brasileiro de Geografia e Estatística – IBGE. (2021). Bacias e Divisões Hidrográficas do Brasil, Escala 1:5.000.000 Rio de Janeiro: IBGE.
- Instituto Brasileiro de Geografia e Estatística – IBGE. (2022). Mapa Político do Brasil versão 2021, Escala 1:250.000 Rio de Janeiro: IBGE.
- International Commission on Large Dams – ICOLD. (2011). Tailings dam safety (Bulletin, No. 194). Chatou: ICOLD.
- International Commission on Large Dams – ICOLD. (2022). Improving tailings dam safety: critical aspects of management, design, operation and closure (Bulletin, No. 139). Chatou: ICOLD.
- Kappel, B., Hultstrand, D., & Small, A. (2024). Meteorological inputs to tailings storage facility assessments and risk assessments – Experience and lessons learned. In Proceedings of Tailings and Mine Waste 2024, Colorado. Fort Collins: Colorado State University.
-
Koutsoyiannis, D. (1999). A probabilistic view of Hershfield’s method for estimating probable maximum precipitation. Water Resources Research, 35(4), 1313-1322. https://doi.org/10.1029/1999WR900002
» https://doi.org/10.1029/1999WR900002 -
Lan, P., Lin, B., Zhang, Y., & Chen, H. (2017). Probable maximum precipitation estimation using the revised Km-Value method in Hong Kong. Journal of Hydrologic Engineering, 22(8), 05017008. https://doi.org/10.1061/(ASCE)HE.1943-5584.0001517
» https://doi.org/10.1061/(ASCE)HE.1943-5584.0001517 -
Liberto, T. D. (2014). The Walker Circulation: ENSO's atmospheric buddy Retrieved in 2022, December 13, from https://www.climate.gov/news-features/blogs/enso/walker-circulation-ensos-atmospheric-buddy
» https://www.climate.gov/news-features/blogs/enso/walker-circulation-ensos-atmospheric-buddy -
Lima, C. E. S., Souza Filho, F. A., & Rocha, R. V. (2025). Homogeneous climate risk zones in Brazil. RBRH, 30, e36. https://doi.org/10.1590/2318-0331.302520240102
» https://doi.org/10.1590/2318-0331.302520240102 - Ly, S., Charles, C., & Degre, A. (2013). Different methods for spatial interpolation of rainfall data for operational hydrology and hydrological modeling at watershed scale: a review. Biotechnologie, Agronomie, Société et Environnement, 17(2), 392-406.
-
Lyra, M. J. A., Fedorova, N., Levit, V., & Freitas, I. G. F. (2020). Características dos complexos convectivos de mesoescala no Nordeste Brasileiro. Revista Brasileira de Meteorologia, 35(spe), 727-734. https://doi.org/10.1590/0102-7786355000001
» https://doi.org/10.1590/0102-7786355000001 - Machado, L. A. T., Guedes, R. L., Silveira, J. M. B., Waltz, R. C., & Alves, M. A. S. (1994). Ciclo de vida de sistemas convectivos. InAnais do VIII Congresso Brasileiro de Meteorologia e II Congresso Latino-Ibérico de Meteorologia(Vol. 2, pp. 323-326). Rio de Janeiro: SBMET.
-
Maddox, R. A. (1980). Mesoscale convective complexes. Bulletin of the American Meteorological Society, 61(11), 1374-1387. https://doi.org/10.1175/1520-0477(1980)061<1374:MCC>2.0.CO;2
» https://doi.org/10.1175/1520-0477(1980)061<1374:MCC>2.0.CO;2 - Martins, V. M. P. (2024). Emprego da simulação de Monte Carlo na estimativa do fator de frequência adotado no cálculo da Precipitação Máxima Provável (PMP) pontual em uma região de clima equatorial sujeita a atuação convectiva (Dissertação de mestrado). Universidade Federal de Minas Gerais, Belo Horizonte.
- Martins, V. M. P., & Pinto, E. J. A. (2026). Derivation of frequency factors for Probable Maximum Precipitation (PMP) estimation through stochastic simulation of annual precipitation maxima in tropical convective regions. Revista Brasileira de Recursos Hídricos, 31, e22. https://doi.org/10.1590/2318-0331.312620250148.
- Naghettini, M., & Pinto, E. J. A. (2007). Hidrologia estatística Belo Horizonte: CPRM.
- Nascimento, D. T. F., De Oliveira, I. J., & Luiz, G. C. (2017). Panorama dos sistemas de classificação climática e as diferentes tipologias climáticas referentes ao estado de Goiás e ao Distrito Federal/Brasil. Élisée, 5(2), 59-86.
-
National Academies of Sciences Engineering and Medicine – NASEM. (2024). Modernizing Probable Maximum Precipitation Estimation Washington, DC: The National Academies Press. https://doi.org/10.17226/27460
» https://doi.org/10.17226/27460 - National Research Council – NRC. (1994). Estimating bounds on extreme precipitation events – A brief assessment, report of the committee on meteorological analysis, prediction and research (28 p.). Washington, DC: National Academy Press.
- Pinheiro, M. C. (2011). Diretrizes para elaboração de estudos hidrológicos e dimensionamentos hidráulicos em obras de mineração (1. ed., 171 p.). Porto Alegre: ABRHidro.
- Pinto, E. J. A. (2001). Abordagem probabilística da estimativa da precipitação máxima provável pelo método de Hershfield. In XIV Simpósio Brasileiro de Recursos Hídricos e V Simpósio de Hidráulica e Recursos Hídricos do Países de Língua Portuguesa, Aracaju. Porto Alegre: ABRHidro.
-
Reboita, M. S., Gan, M. A., Da Rocha, R. P., & Ambrizzi, T. (2010). Regimes de precipitação na América do Sul: uma revisão bibliográfica. Revista Brasileira de Meteorologia, 25(2), 185-204. https://doi.org/10.1590/S0102-77862010000200004
» https://doi.org/10.1590/S0102-77862010000200004 -
Rezacova, D., Pesice, P., & Sokol, Z. (2005). An estimation of the probable maximum precipitation for river basins in the Czech Republic. Atmospheric Research, 77(1–4), 407-421. https://doi.org/10.1016/j.atmosres.2004.10.011
» https://doi.org/10.1016/j.atmosres.2004.10.011 -
Salas, J. D., Gavilán, G., Salas, F. R., Julien, P. Y., & Abdullah, J. (2014). Uncertainty of the PMP and PMF. In S. Eslamian (Ed.), Handbook of engineering hydrology (Vol. 2, pp. 575-603). Boca Raton: CRC Press. https://doi.org/10.1201/b16683
» https://doi.org/10.1201/b16683 -
Salgado, S. R. T., Carvalho, E., Viseu, M. T., & Oliveira, O. F. (2025). Evaluating dam safety in Brazil: a comparative analysis of international classification systems. RBRH, 30, e46. https://doi.org/10.1590/2318-0331.302520250024
» https://doi.org/10.1590/2318-0331.302520250024 -
Salio, P., Nicolini, M., & Zipser, E. J. (2007). Mesoscale convective systems over southeastern South American low-level jet. Monthly Weather Review, 135(4), 1290-1309. https://doi.org/10.1175/MWR3305.1
» https://doi.org/10.1175/MWR3305.1 -
Sarkar, S., & Maity, R. (2020). Estimation of Probable Maximum Precipitation in the context of climate change. MethodsX, 7, 100904. https://doi.org/10.1016/j.mex.2020.100904
» https://doi.org/10.1016/j.mex.2020.100904 - Silva Neto, V. L., Viola, M., Mello, C. R. D. E., Silva, D. D., & Giongo, M. V. (2020). Precipitação Máxima Provável no estado do Tocantins: primeira aproximação pelo método estatístico de Hershfield. Revista Brasileira de Climatologia, 27 http://dx.doi.org/10.5380/abclima.v27i0.69590.
- Sugai, M. R. B. (1989). Tempo de Recorrência associado a Precipitação Máxima Provável na Região Sul do Brasil (Dissertação de mestrado). Universidade Federal do Paraná, Curitiba.
-
Szymanski, M. B., & Davies, M. P. (2004). Tailings dams design criteria and safety evaluations at closure. In British Columbia Mine Reclamation Symposium Fort St. John: The British Columbia Technical and Research Committee on Reclamation. https://doi.org/10.14288/1.0042456
» https://doi.org/10.14288/1.0042456 - World Meteorological Organization – WMO. (2009). Manual on estimation of probable maximum precipitation (PMP) (3rd ed., No. 1045, 257 p.). Geneva: WMO.
Edited by
-
Editor-in-Chief:
Adilson Pinheiro
-
Associated Editor:
Carlos Henrique Ribeiro Lima

 Source: Kottek et al. (2006, apud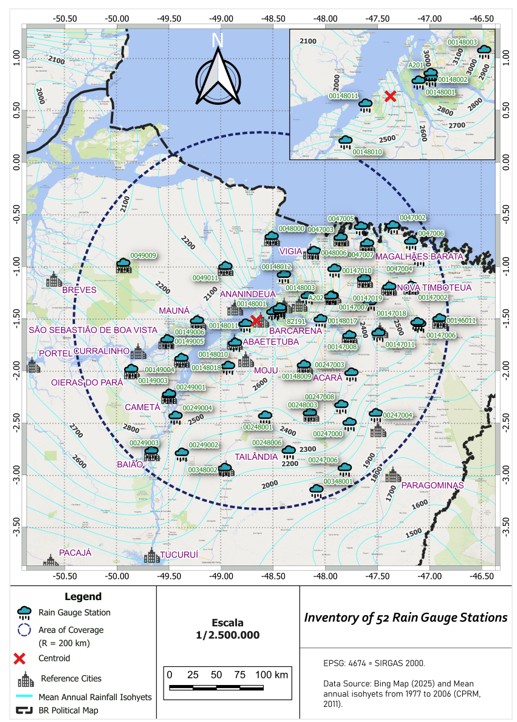
 Source:
  Source: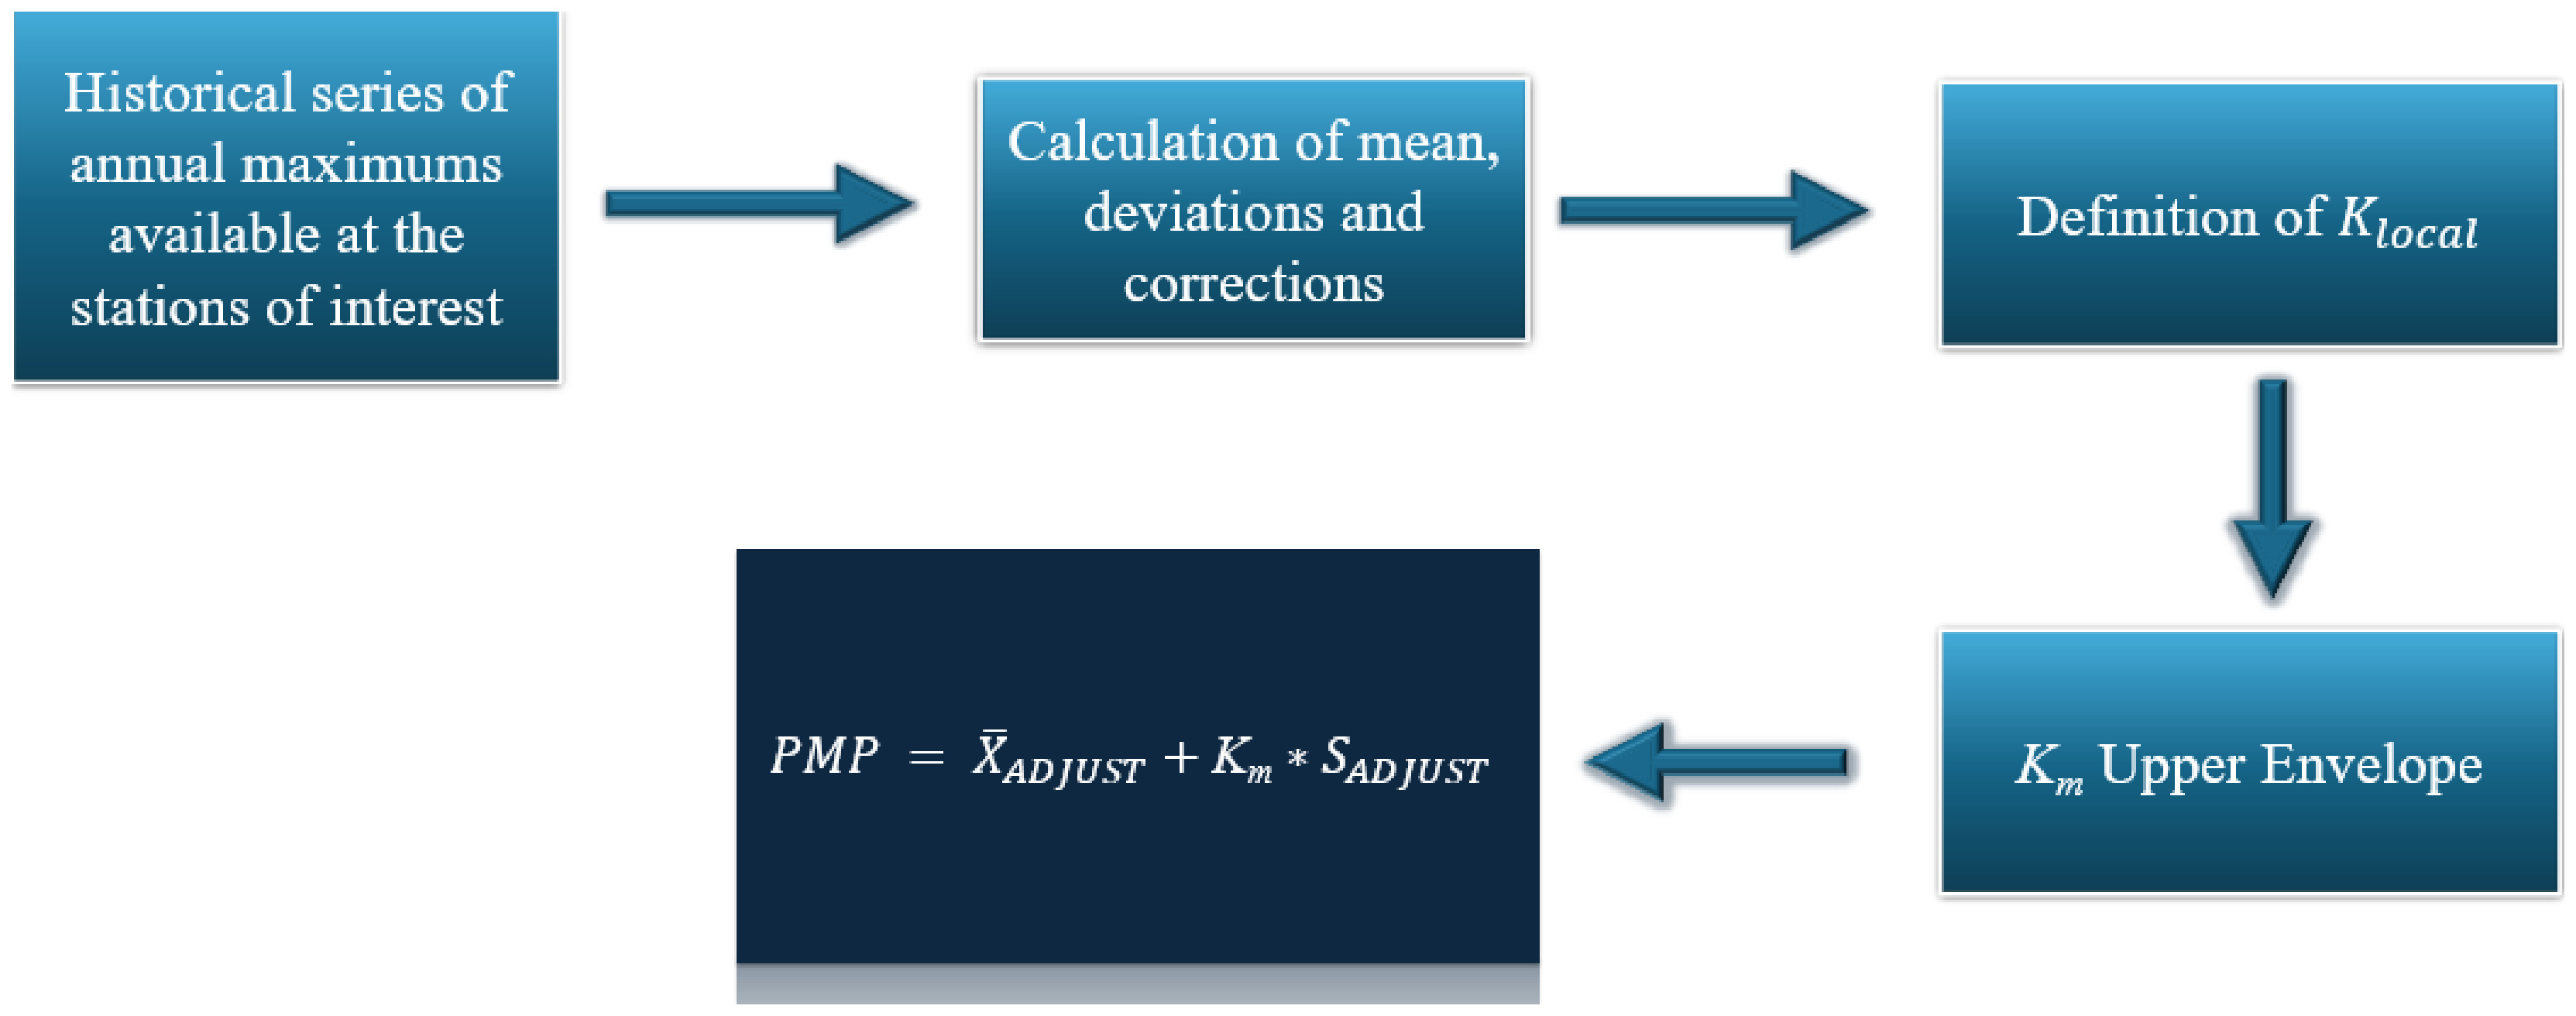
 Source: Adapted from