
 Spatiotemporal rainfall patterns in a semiarid region in Brazil
ABSTRACT
Water scarcity is a growing concern globally, driven by uneven spatial and temporal distribution of water resources. This is especially true in semi-arid regions. This study investigated rainfall variability in the Minas Gerais portion of the Atlântico Leste Hydrographic Region (RHAL-MG), which overlaps partly with Brazil's semi-arid region and areas at risk of desertification. We analyzed precipitation data from 33 stations between 1980 and 2022 using statistical methods and the Standardized Precipitation Index (SPI). The results revealed distinct rainfall patterns in RHAL-MG, closely aligning with the boundaries of polygons corresponding to semiarid and desertification prone zones within the study area. Rainfall exhibited a seasonal pattern, with the rainy season predominantly occurring between October and March. However, the amount and intensity of rainfall varied across the regions segmented in the spatial analysis. No statistically significant pluviometric trends were identified in 76% of the stations, while 24% showed a significant trend of decreasing rainfall volume.
Keywords:
Pluviometric precipitation; Atlântico Leste Hydrographic Region; Desertification; Seasonality; Temporal trend
RESUMO
A escassez de água é uma preocupação crescente a nível mundial, impulsionada pela distribuição espaço-temporal desigual dos recursos hídricos. Essa situação se agrava em regiões semiáridas. O objetivo deste estudo foi avaliar a variabilidade espaço-temporal da precipitação na Região Hidrográfica Atlântico Leste (RHAL-MG), que se sobrepõe parcialmente à região semiárida do Brasil e às áreas em risco de desertificação. Analisamos dados de precipitação de 33 estações entre 1980 e 2022 usando métodos estatísticos e o Índice de Precipitação Padronizada (SPI). Os resultados revelaram padrões de chuva distintos no RHAL-MG que refletiram as delimitações dos polígonos correspondentes às regiões semiáridas e susceptíveis à desertificação da área de estudo. A precipitação apresentou um padrão sazonal, com a estação chuvosa ocorrendo predominantemente entre outubro e março. No entanto, a escala e intensidade dos níveis de chuva foram diferentes dentre as regiões segregadas na análise espacial. Não foi identificada tendência pluviométrica estatisticamente significativa em 76% das estações, enquanto 24% apresentam tendência significativa de redução do volume de chuvas.
Palavras-chave:
Precipitação; Região Hidrográfica Atlântico Leste; Desertificação; Sazonalidade; Tendência temporal
INTRODUCTION
The developmental dynamics of contemporary times, characterized by demographic growth, technological advancement, intensification of industrial activities, and expansion of urban centers, are responsible for exerting pressure on the environment (Liu et al., 2017; Yang et al., 2023). These and other anthropogenic activities have led to changes in the Earth's climate, resulting in an increase in global temperature and changes in rainfall patterns worldwide (World Meteorological Organization, 2021).
In recent decades, sustainable development and the pursuit of environmental preservation have become major priorities. Precipitation, as a central component of the hydrological cycle, plays a fundamental role in the climatic dynamics of a region and profoundly affects environmental conditions (Ferreira et al., 2021). Rainfall patterns directly influence the quality of surface waters by modifying their chemical composition, transporting pollutants, and influencing the physical, chemical, and biological processes in aquatic ecosystems (Liu et al., 2017). Additionally, precipitation is crucial for various human activities, such as agriculture, fishing, and navigation, and represents the main supply source for aquifer systems, influencing water availability for essential activities such as electricity generation and public supply (Verburg et al., 2022; World Meteorological Organization, 2021).
The high variability in rainfall distribution among different study regions and historical series has raised significant concerns (Ramkar & Yadav, 2018). Extreme hydrometeorological events, such as heavy precipitation, pose substantial threats to human life and property in certain regions (World Meteorological Organization, 2021). However, climate change associated with increased water demand owing to progressively higher living standards has led some regions worldwide to face severe periods of water scarcity (Verburg et al., 2022; United Nations Educational, Scientific and Cultural Organization, 2021).
According to Verburg et al. (2022), drought is a worsening global phenomenon. Climate change is increasing the extent, frequency, intensity, and duration of droughts worldwide. In this context, understanding the spatial and temporal patterns of rainfall has become a central objective for various scientific studies, many of which are focused on notoriously dry areas recognized as semi-arid regions (Melo Júnior et al., 2006; Mehta & Yadav, 2021; Moradpoor et al., 2023; Ramkar & Yadav, 2018; Gebrechorkos et al., 2019). Ganguly et al. (2023), highlight the importance of regional studies related to the analysis of precipitation trends with observed datasets, to combat climate change and validate global data assessments.
In addition, one of the Sustainable Development Goals (SDGs) defined during the United Nations Summit in 2015 was to take urgent action to combat climate change and its impacts (SDG 13). This goal is closely related to other SDGs that cannot be achieved without a stable and predictable climate (Artaxo, 2022; United Nations, 2023).
Despite its relative abundance of water resources, which account for approximately 12% of the flow of all rivers in the world, Brazil has faced problems of water scarcity and conflicts over water use in parts of its territory, mainly due to the spatial and temporal distribution of its water resources. While some regions have a large volume of water, high flow, and low population density, others have irregular rainfall, which reduces the water availability (Instituto de Pesquisa Econômica Aplicada, 2022).
Although Brazil's average annual rainfall is estimated to be 1,760 mm, less than 500 mm of rain is observed in semi-arid regions and more than 3,000 mm in the Amazon region. Significant variations in rainfall occurred even within basins.
In addition, the last decade in Brazil has been characterized by long periods of drought, leading to water scarcity in various localities. This directly affects a country's development and negatively affects production, economic activities, public health, and the environment (Tucci & Chagas, 2017; Neves et al., 2020). Another major impact was the collapse of water supply systems in the cities of the Brazilian semi-arid region, known for its low water availability, which drove the search for new water sources and the adoption of various emergency actions (Neves et al., 2020; Instituto de Pesquisa Econômica Aplicada, 2022).
These regions are especially affected by variability in rainfall patterns, as they have many watercourses with intermittent flow resulting from typical drought periods in this special area. Historically, these regions have suffered the most droughts and dry spells (Instituto Mineiro de Gestão das Águas, 2020). They are also areas affected or threatened by desertification (Brasil, 2006), a form of degradation that impacts the dynamics of water resources and soil quality, constituting a global problem resulting from various factors, including climate variations and human activities (Macêdo, 2021).
According to Obermaier & Rosa (2013), the semi-arid areas of Brazil are the most vulnerable to global warming. The combination of climate change, in the form of reduced or low rainfall accompanied by high temperatures and high evaporation rates, along with competition for water resources, can lead to potentially severe environmental and socioeconomic crises in these regions. As desertification intensifies, crises become increasingly frequent, causing internal migration and ethnic and political tensions in arid lands. To overcome the challenges of these increasingly extreme situations, the implementation of sustainable water policies aimed at preserving water resources and combating water scarcity is urgent (Verburg et al., 2022; Taoufik et al., 2017).
In this context, statistical tools, sometimes associated with the use of indices, are widely used to understanding the spatiotemporal variations of rainfall conditions in watersheds (Ferreira et al., 2021; Melo Júnior et al., 2006; Mehta & Yadav, 2021; Moradpoor et al., 2023; Ramkar & Yadav, 2018; Yang et al., 2023).
The objective of this study is to evaluate the spatiotemporal variability of precipitation in the Minas Gerais portion of the East Atlantic Hydrographic Region, Minas Gerais (RHAL-MG), Brazil. RHAL-MG includes part of its territory within the polygon defined by the Brazilian semi-arid region and buffer zones of areas susceptible to desertification.
The results of this study can support local and/or regional water resource management policies and contribute to water resource planning in various sectors.
METHOD
Study area
The East Atlantic Hydrographic Region (RHAL) is located between the coordinates 9° 40’ to 19° 00’ S and 36° 40’ to 44° 00’ W, covering approximately 388,160 km2—about 3.9% of Brazil’s national territory. Of this total area, 26% lies within the state of Minas Gerais, encompassing 101,087.80 km2.
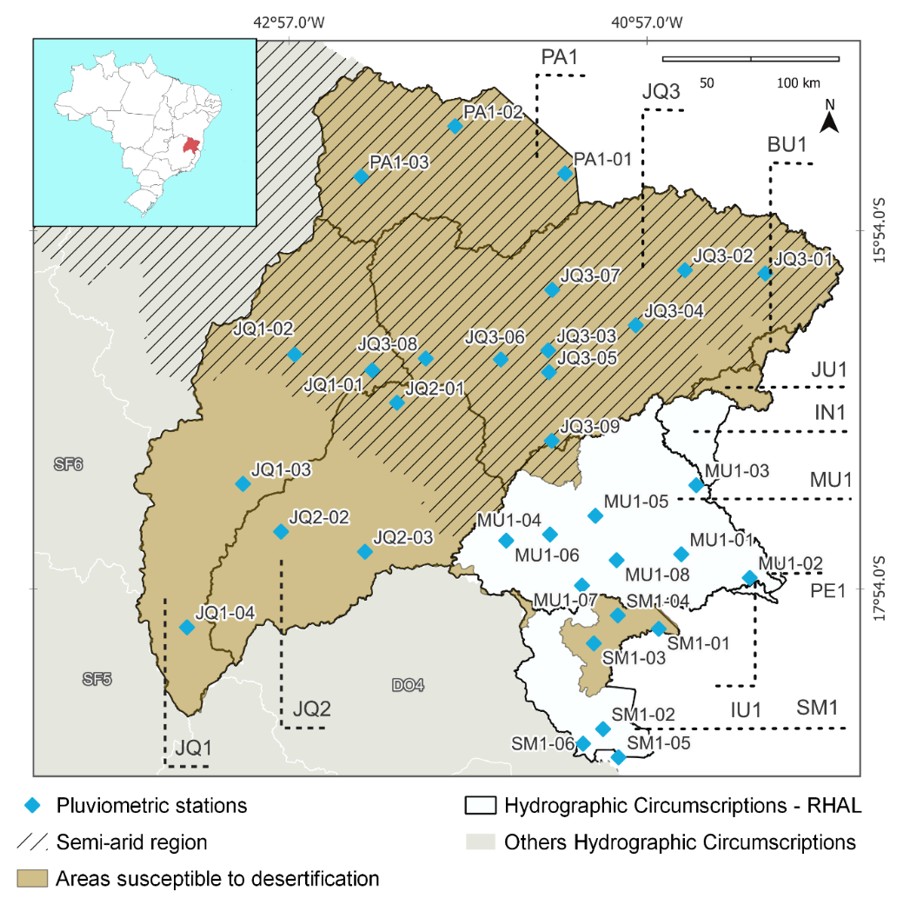
The portion of RHAL situated in Minas Gerais, the focus of this study, is composed of 11 sub-basins: BU1 – Buranhém river, IN – Itanhém river, IU – Itaúnas river, JQ1 - Alto Jequitinhonha, JQ2 – Araçuaí river, JQ3 - Médio e Baixo Jequitinhonha, JU1 – Jucuruçu river, MU1 – Mucuri river, PA1 – Pardo river, PE1 – Peruípe river and SM1 – São Mateus river (Figure 1).

According to the Brasil (2006), the Minas Gerais portion of the RHAL can be characterized by dry sub-humid climates, which represent the majority of the basin, and semi-arid climates, which are identified in the northern portion of the hydrographic region.
The dry sub-humid climate is characterized by an average annual precipitation ranging between 800 mm and 1,600 mm, a reflection of continentality that becomes prominent in climatic patterns from this domain onwards. In this range, the water deficit and evapotranspiration are higher compared to more humid climates, and the average temperature fluctuates between 24 °C and 25 °C. It runs parallel to the Atlantic Belt, serving as a transition between humid and drier areas, and encompasses almost the entire western coast of the Atlantic East region (Brasil, 2006).
The semi-arid climate in the Minas Gerais portion of the RHAL occurs most prominently in the sub-basins of the Pardo River (PA1) and the Middle and Lower Jequitinhonha (JQ3) but is also present in parts of the sub-basins of the Upper Jequitinhonha (JQ1), the Araçuaí River (JQ2), and Mucuri (MU1). In general, this climate is characterized by a water deficit, high temperatures (above 25 °C), and low precipitation (below 800 mm) (Bahia, 2005; Instituto Mineiro de Gestão das Águas, 2020).
As a result of the typical drought periods associated with this climatic zone, these regions feature numerous intermittent watercourses and have historically been among the areas most affected by water scarcity and prolonged dry spells within the state (Instituto Mineiro de Gestão das Águas, 2020). This scenario underscores the importance of studying both the quantity and quality of surface water in these regions.
However, despite the presence of areas with this climatic pattern, which requires a tailored approach due to the unique characteristics it imparts to the regions where it occurs (Brasil, 2006), few studies have specifically focused on the state of Minas Gerais.
In general, climatic research on semiarid regions in Brazil predominantly focuses on the Northeast (Montenegro & Ragab, 2012; Brito et al., 2018; Alvalá et al., 2019; Medeiros et al., 2021; Sousa et al., 2023), whose characteristics may not necessarily reflect the conditions observed in the study area.
While some studies consider the entire Brazilian semiarid region as their area of investigation, including areas in Minas Gerais (Tinôco et al., 2018; Santos et al., 2024), such an approach often provides a more generalized view of the region, as the state itself is not the exclusive focus of these investigations.
Database selection and organization
Data from pluviometric stations in the study area were obtained using the HidroWeb Portal (Brasil 2024), a tool linked to the National Water Resources Information System (SNIRH) (Brasil, 2023). The selection of monitoring stations followed the recommendation of the World Meteorological Organization (World Meteorological Organization, 1989), which suggests that to ensure greater representativeness in monitoring, pluviometric studies should cover a uniform and relatively long period comprising at least three consecutive ten-year periods.
The spatial-temporal definition consisted of analyzing the stations and periods that contained the longest series of reported data, considering the aforementioned premise. Daily data generated between 1980 and 2022 from 33 pluviometric stations were used in this study. The locations and descriptions of the monitoring stations are shown in Figure 2 and Table S1 (Supplementary Material).

Geographical location of the 33 pluviometric stations of the National Water Agency selected according to the premises recommended by the World Meteorological Organization (1989).
Station density was analyzed using sub-basin. Considering the most critical situation, given the mountainous regions and monitoring through equipment without recorders, the minimum density would be 0.0040 stations/km2. For flat or undulating regions, the minimum density was 0.0017 stations/km2 (World Meteorological Organization, 2017).
Evaluation of spatial and temporal variations in pluviometric indices in the Minas Gerais portion of the East Atlantic Hydrographic Region
Preliminary statistics
The Shapiro-Wilk test (Shapiro & Wilk, 1965), at a significance level of 5%, was applied to the monthly rainfall data of each station to verify adherence to the normal frequency distribution.
Evaluation of spatial variations in pluviometric indices
The Cluster Analysis (CA) was used for the spatial evaluation of the data, Cluster Analysis (CA) was used, with Euclidean distance as the measure of dissimilarity and the entropy truncation method. This was performed at group stations with similar pluviometric behavior. CA was used for the exploratory analysis with daily pluviometric data as the input variable. The hierarchical agglomerative method, known as the Weighted Pair-Group Average, was used to generate the dendrogram and was validated by calculating the cophenetic correlation coefficient (CCC). CCC values close to 1 indicate a more accurate representation of the results, while values below 0.7 suggest that the clustering method should be questioned (Rohlf, 1970).
Next, the non-parametric Kruskal-Wallis (KW) test (Kruskal & Wallis, 1952) was conducted, followed by Dunn's multiple comparison test when applicable at a significance level of 5% (Dunn, 1964). The KW test aimed to compare the monthly precipitation volumes among the clusters formed in CA. When a significant difference was detected, Dunn's test was used to identify groups of pluviometric stations the difference occurred.
Evaluation of temporal variations in pluviometric indices
In the temporal analysis, the evaluation of seasonality in the data and identification of dry and rainy periods were conducted by comparing the precipitation volumes across all months of the year using data from 33 pluviometric stations and by cluster formed in the spatial analysis. Comparative analyses were also performed using the Kruskal–Wallis test, followed by Dunn's multiple comparison test, when applicable, at a significance level of 5%.
To understand the possible existence of a trend in monthly precipitation increase or decrease at each pluviometric station, the Seasonal Mann-Kendall (SMK) test was applied to the monthly precipitation data. This test is a variation of the Mann-Kendall (MK) test (Mann, 1945; Kendall, 1955), which generally determines whether the central tendency of the variable of interest Y (in this case, the precipitation data) tends to increase or decrease monotonically as time T progresses (Helsel et al., 2020).
Unlike the MK or modified MK tests (MKm), the SMK test or modified SMK (SMKm) considers seasonality by separately calculating the test for each variable and then combining the results. The advantage of the SMK approach is that it avoids comparisons across different timescales (i.e., daily, monthly, and quarterly). For instance, when conducting monthly evaluations, January data are only compared with January data, February only with February data, and so on, thereby eliminating the possibility of trends being expressed as a result of inherent differences between months of the year (Helsel et al., 2020).
The MK (or SMK) test is one of the most widely used nonparametric hypothesis tests for detecting significant trends in a time series (Santos et al., 2020). A key assumption for these tests to return reliable results is the absence of autocorrelation in the analyzed data (Cox & Stuart, 1955; Santos et al.; 2020). Therefore, autocorrelation verification was performed using an Autocorrelation Function (ACF). For positive autocorrelation results, the tests were replaced with their modified versions (MKm or SMKm) as proposed by Hamed & Rao (1998). All statistical tests were conducted using the XLSTAT® 2022.3.2 software.
The Standardized Precipitation Index (SPI) is the most widely used meteorological drought index and relies solely on precipitation data as input. In this study, the SPI was applied by spatial cluster, using a 12-month accumulation scale (Ferreira et al., 2021; Ramkar & Yadav, 2018), to represent water scarcity associated with year-long drought events. The analysis was performed using a script written in R programming language, with monthly precipitation data recorded at all 33 stations each year as the input.
RESULTS AND DISCUSSION
Database selection and organization
Some hydrographic areas whose territorial extensions within the border region of the State of Minas Gerais are relatively small, such as Buranhém, Jucuruçu, Itanhém, Peruípe, and Itaúnas, did not have pluviometric stations within their respective geographic boundaries (Figure 1). Table 1 presents the station density in the RHAL-MG, considering both the initial and selected sampling networks.
Density of pluviometric stations in the Minas Gerais portion of RHAL before and after database selection.
Considering the 33 pluviometric stations selected for the present study, the minimum density suggested by the World Meteorological Organization (2017) for both conditions mentioned earlier was not met. Most arid and semiarid regions of the world have a sparse distribution of pluviometric stations, which reduces the reliability of the generated spatiotemporal fields (Morsy et al., 2021). The absence of pluviometric stations in the East Atlantic Hydrographic Region was also noted by Melo Junior et al. (2006), who investigated the spatial distribution of rainfall frequency in the RHAL, including the Southeast Atlantic Hydrographic Region, using ordinary kriging interpolation. According to the authors, the low density of pluviometric stations in RHAL resulted in the highest kriging variance values in this study, indicating a greater uncertainty in the predictions.
Despite this, a study was conducted to identify spatiotemporal patterns related to rainfall measurements at these stations without analyzing the individual representative areas covered.
To achieve Sustainable Development Goal 13 - Climate Action, such as raising awareness and enhancing human and institutional capacity for climate change mitigation and impact reduction (Instituto de Pesquisa Econômica Aplicada, 2022), accurate data are necessary, making the expansion of pluviometric station networks imperative. Additionally, the availability of daily precipitation observation data in a continuous time series obtained through pluviometric stations is essential for conducting hydrological studies and flood forecasting (Ella et al., 2024).
Evaluation of spatial and temporal variations in pluviometric indices in the Minas Gerais portion of the East Atlantic Hydrographic Region
Preliminary statistics
The data from the 33 pluviometric stations did not follow a normal frequency distribution (Shapiro-Wilk, p < 0.05), validating the use of the non-parametric statistical methods employed in the study. Nonparametric tests do not require data to fit a specific frequency distribution and are less influenced by outliers (Helsel et al., 2020; Zar, 2010).
Evaluation of spatial variations in pluviometric indices
In the Cluster Analysis, the calculation of the cophenetic correlation coefficient for the dendrogram generated by the weighted pair-group average method resulted in a CCC of 0.91, indicating excellent adequacy; values close to 1 signified that the clusters were formed with a good degree of fit and low distortions in the measurements between the original matrix and the generated matrix (Rohlf, 1970). Three clusters were formed with three stations (MU1-07, MU1-08, and SM1-01) remaining isolated (Figure 3 and 4).

Dendrogram of the cluster analysis generated from the pluviometric monitoring data in the Minas Gerais portion of the RHAL, covering the period from 1980 to 2023, for 33 monitoring stations.
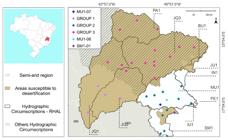
Group 1 comprised four pluviometric stations located in CH, JQ1, and JQ2. As shown in the map (Figure 4), these points correspond to those located within the boundaries of areas susceptible to desertification in the Minas Gerais portion of the RHAL but outside the semi-arid region. According to the results of the non-parametric tests, the monthly rainfall volumes in Group 1 differed significantly from those in all other clusters. The median obtained for this group (monthly rainfall of 38 mm) was higher than that observed in Group 3 (30 mm) and lower than that observed in Group 2 (48 mm) (Figure 5 and Table 2).

Compiled results of the multiple comparison test for the monthly rainfall data (mm), by grouping formed in the AC.
Group 2, consisting of 11 rain gauge stations located in the SM1 and MU1 basins, was statistically different from all other groups (Groups 1 and 3), showing the highest median. However, it did not differ significantly from stations MU1-08 and SM1-01, which are also located in the same basins. This implies that although the Cluster Analysis identified a discrepancy among the monthly precipitation values in these groups (Group 2 vs. MU1-08 vs. SM1-01), with generally lower results in Group 2, this difference was not significant enough to be considered statistically relevant.
Group 3, in turn, covers pluviometric stations located in the sub-basins PA1 and JQ3 as well as stations near the border of these CH in JQ1 and JQ2. All stations mentioned were located within the semi-arid region of Minas Gerais and were also included in the buffer of areas susceptible to desertification. It can be seen, from the boxplot and Table 2, that the monthly rainfall volumes in these stations were, in general, significantly below the volumes observed in the other groups, corroborating other studies that inform that the planning regions of Jequitinhonha, Pardo and part of Mucuri have water deficit with high temperatures (above 25 °C) and low rainfall (below 800 mm) (Bahia, 2005; Melo Júnior et al., 2006; Instituto Mineiro de Gestão das Águas, 2020), resulting in many watercourses with an intermittent regime, as a result of the typical dry periods of this special range, and, historically, they are the regions of the state that suffer the most from droughts and droughts (Instituto Mineiro de Gestão das Águas, 2020).
Station MU1-07 had the highest median volumes measured, which was not statistically different only from station MU1-08, both of which were located in sub-basin MU1.
Thus, in relation to the measure of central tendency, the following relationships were established between the clusters formed: MU1-07 (Md = 63.00 mm), MU1-08 (Md = 52.50 mm), SM1-01 (Md = 50.00 mm), Group 2 (Md = 48.00 mm), Group 1 (Md = 38.00 mm), and Group 3 (Md = 30.00 mm). There was a significant spatial component influencing the results, driven by differences in precipitation patterns across the various regions of RHAL-MG. Since semi-arid areas and zones susceptible to desertification are defined based on the Aridity Index (AI), calculated as the ratio between precipitation and potential evapotranspiration (Brasil, 2007), the spatial distribution of precipitation patterns observed in this study reflects the boundaries of these regions within the state of Minas Gerais.
Evaluation of temporal variations in pluviometric indices
Regarding temporal variability, the monthly rainfall patterns identified across the clusters formed through the spatial analysis exhibit consistent behavior (Figure 6). Overall, the results align with the seasonal division widely recognized in Brazil’s Southeast Region, including the state of Minas Gerais, where the rainy season typically occurs between October and March and the dry season extends from April to September, as reported by the National Institute of Meteorology – INMET (Instituto Nacional de Meteorologia, 2017). This seasonal division is therefore adopted in the discussion of the results presented below.

Medians of monthly rainfall volumes observed over the 20-year study period, by cluster formed in the spatial analysis.
Rainfall frequency begins to increase in October, a transitional month, and intensifies in November and December. According to Tinôco et al. (2018), this pattern originates in the northwest of Minas Gerais and extends into the state of Bahia. The November–January trimester often records the highest rainfall levels of the year, playing a critical role in the replenishment of water reservoirs in the Southeast Region (Instituto Nacional de Meteorologia, 2017).
However, although the rainfall patterns identified across the different clusters are similar, the precipitation levels recorded for corresponding months of the year vary in both scale and intensity.
Stations MU1-07 and MU1-08 exhibited the highest median rainfall values for most of the months analyzed, indicating a more intense hydrological response, with transitional periods marked by sharper increases and decreases in rainfall indices.
In contrast, cluster G3, which represents the semi-arid region of Minas Gerais, recorded the lowest median rainfall values, with an even more pronounced difference during the rainy season. The precipitation levels observed in this cluster are consistent with those reported by Oliveira et al. (2017) for the Southern Semi-arid region of Northeast Brazil and resemble the patterns described by Tinôco et al. (2018) for the central-southern portion of Bahia. This area is among those with the lowest average accumulated precipitation within the Brazilian Semi-arid Region (SAB), with annual rainfall levels around 748.46 mm.
Cluster G1, composed of stations located in areas susceptible to desertification but outside the officially designated semi-arid zone, exhibited a dichotomous behavior between the seasonal periods. During the rainy season, it ranked among the clusters with the highest median rainfall values, whereas during the dry season, it recorded some of the lowest. These findings suggest that regions outside the semi-arid zone but vulnerable to desertification may experience rainfall patterns that reflect complex seasonal sensitivities.
This characteristic underscores the importance of targeted climate policies to mitigate the impacts of such extremes. According to Santos et al. (2024), areas more susceptible to extreme precipitation events require the implementation of adaptive strategies to address challenges related to floods, droughts, and other climate- and weather-related hazards. In such contexts, understanding climate trends plays a key role in formulating mitigation and adaptation strategies, contributing to risk reduction in the face of climate change.
Finally, among the three distinct regions identified through the spatial analysis, cluster G2, comprising stations located outside the buffer zones delimiting areas of higher rainfall vulnerability, recorded the highest median precipitation values during the dry months. During the rainy season, however, its median values were lower than those observed in G1, indicating reduced dispersion between seasonal periods. This pattern suggests that drought conditions in cluster G2 were less severe compared to the other clusters.
The KW test, followed by a post-hoc multiple comparisons test, confirmed a consistent pattern between certain months across the spatially defined clusters (Figure 7).

Boxplots with the results of the multiple comparisons test obtained between almost all months of the year, by cluster formed in the spatial analysis.
Rainfall values recorded in November and December did not show statistically significant differences, representing the highest precipitation levels in the historical series analyzed, which coincides with the peak of the rainy season in Brazil’s Southeast Region (Instituto Nacional de Meteorologia, 2017). Likewise, no significant differences were found in the indices measured during June, July, and August, which are typically characterized by the lowest rainfall volumes, consistent with the dry season.
Exclusively in cluster G2, the rainfall volume recorded in September did not differ significantly from those observed in July and August. This pattern reflects the lower variability identified in this cluster throughout the seasonal periods, as highlighted in the descriptive analysis. Such stability may indicate greater climatic resilience in this region, potentially reducing the impacts of prolonged droughts or seasonal transitions.
Furthermore, the transitional months between the wet and dry seasons—April and October—exhibited intermediate behavior, with rainfall patterns distinct from those observed in other months of the year. In cluster G2, these months also did not present statistically significant differences, suggesting that rainfall indices in this less vulnerable region remain relatively consistent during both seasonal transitions: from wet to dry and from dry to wet.
In the second stage of the temporal variability analysis, the objective was to assess whether there was a trend of decreasing or increasing rainfall during the analyzed period, or if the amount of rainfall remained statistically constant over the years. The autocorrelation analysis indicated that all rainfall stations exhibited autocorrelation at some point in the lag interval (the relationship of the variable at time tx with itself at time tx-1). Thus, the SMKm test was applied to all rainfall stations in this study to account for the serial dependence of the variables, as proposed by Hamed & Rao (1998). The trend results generated by the statistical test can be visualized and analyzed spatially, as shown in Figure 8.
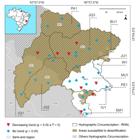
The SMK test did not identify significant trends in monthly rainfall volumes for the majority of the analyzed pluviometric stations (approximately 76%). This indicates that the differences found between the same months (January vs. January, February vs. February) over the years may have occurred by chance. The predominance of the absence of significant trends in rainfall data was also observed by Ferreira et al. (2021) when analyzing monthly precipitation data in the mining section of the São Francisco River Basin, which occurred in 78% of the 131 analyzed rainfall stations. Noteably, part of the São Francisco River Basin borders the western region of the RHAL, specifically the sub-basins PA1 and JQ.
At the other stations (24%), a significant monthly precipitation reduction trend was observed over the historical series. These results were observed at spatially distributed rain gauge stations, totaling three stations in sub-basin JQ3, two each in MU1 and SM1, and one station in JQ1. The sub-basins JQ2 and PA1, on the other hand, did not show a reduction trend. However, these were the sub-basin with the fewest monitoring points within their defined areas. The low and varied density of stations among the sub-basin complicates the identification of spatial behavior patterns in the obtained results.
Nevertheless, the detection of a decreasing pattern at some stations, combined with the absence of an increasing trend at others, raises concerns, especially considering that the study region is characterized by low rainfall rates, reduced river flow, and a considerable number of intermittent rivers (Brasil, 2015).
Finally, Figure 9 presents boxplots of the SPI over the years of the historical series, considering the data from all sub-basins. A positive SPI value indicates above-average precipitation, whereas a negative SPI value indicates below-average precipitation.

The Standardized Precipitation Index (SPI) revealed an alteration in precipitation anomalies over the years, with positive medians in certain periods and negative medians in others. The highest SPI peaks tended to be preceded and succeeded by considerably lower values, suggesting that the highest precipitation events occurred sporadically throughout the historical series. On the other hand, periods of negative SPI tended to extend over time, as evidenced between 1986 and 1990 and again between 2015 and 2019.
The negative results recorded between 2015 and 2019 indicate that, in addition to the widely discussed water crisis events in the scientific literature that occurred between 2012 and 2014, which were mainly attributed to a persistent high-pressure system over southeastern South America that blocked the formation of the South Atlantic Convergence Zone (SACZ) and the passage of cold fronts from the south (Coelho et al., 2016), subsequent years were characterized by even lower levels of precipitation in the mining region of the East Atlantic Hydrographic Region (RHAL).
When the results were analyzed separately by cluster, a pattern similar to that observed in the general graph emerged, albeit with some noteworthy particularities (Figure 10).

Annual SPI between 1980 and 2022, in the Minas Gerais portion of RHAL, by cluster formed in the spatial analysis.
In the G1 cluster, median SPI values showed more frequent and intense fluctuations throughout the historical series, reflecting a less uniform behavior. This variability suggests that rainfall conditions in the G1 region are marked by rapid and irregular changes in precipitation intensity from year to year. It indicates greater interannual instability, with alternating periods of drought and excess rainfall occurring more unpredictably, potentially due to the influence of dynamic climatic factors. Once again, this frequent alternation highlights a region where precipitation patterns are less predictable, complicating water resource management.
The first prolonged period of negative SPI values in this cluster began one year after the period identified in the general analysis, occurring between 1987 and 1990. Notably, the year 2008 stood out, as more than 75% of the monthly SPI values fell below -1.25.
During the 2015–2019 drought period, SPI values were even lower than those observed in the general analysis, particularly in the earlier years. In 2015, all monthly values were below -1.25. Conversely, the occurrence of extreme outliers was relatively limited across the historical series, with only a few months registering SPI values ≤ -2.0, indicative of extreme drought conditions.
In the G2 cluster, a more balanced behavior was observed, with SPI medians remaining relatively stable over longer time spans, indicating lower interannual variability. However, transitions between stable periods were more abrupt, marked by sharp differences in median values. This pattern suggests that, although precipitation in the G2 region tends to be stable over time, transitions between wet and dry conditions are more intense, possibly reflecting climate events of greater magnitude or sudden shifts in rainfall regimes. While this stability may facilitate water resource planning during normal periods, transitional phases require special attention due to the potential impact of extreme events.
Additionally, the annual SPI values showed a more symmetrical distribution, with most medians centered within the boxplots. This pattern indicates that, within each year, precipitation was more evenly distributed, reflecting lower intra-annual variability. Such behavior suggests greater regularity in the rainfall regime in this cluster, with rainfall occurring more consistently throughout the year compared to the others, corroborating previous findings.
Despite this regularity, the G2 cluster exhibited a higher frequency of extreme negative values (SPI ≤ -2.0), pointing to severe drought episodes during specific periods. The year 1998 was particularly notable, contributing to the lowest SPI medians observed in the general analysis for that period. This finding suggests that, while the cluster maintains a stable annual rainfall pattern, extreme drought events can still occur locally, significantly affecting water availability and environmental systems.
A station-level analysis revealed that the extreme SPI values recorded in 1998 were almost entirely associated with station SM1-04, indicating that this specific locality was especially affected during that year. This highlights that, even within clusters characterized by overall rainfall regularity, local conditions and meteorological processes can significantly influence precipitation behavior.
Finally, the G3 cluster exhibited less pronounced interannual variation in SPI values, suggesting that rainfall behavior in this semi-arid region has remained relatively stable throughout the historical series. Despite this apparent stability, G3 showed the highest frequency of extreme negative SPI values (≤ -2.0) among all clusters, indicating greater vulnerability to severe droughts. This trend may be linked to regional or global atmospheric changes contributing to reduced rainfall in several semi-arid regions of Brazil (Tinôco et al., 2018). Such extreme events can negatively impact agriculture, reservoir recharge, and water supply, underscoring the need for targeted mitigation strategies.
These extreme events were primarily recorded in 1994, 1995, and 2019. The results indicate that, although the overall rainfall regime is less variable over time, intense drought episodes can still occur in this region, leading to critical water shortages. A station-level analysis identified the most extreme SPI outliers at stations JQ3-01, JQ3-03, and JQ3-07, all located in the upper-middle Jequitinhonha sub-basin. This suggests that specific local characteristics of this sub-region may amplify the impacts of adverse climatic events.
CONCLUSION
The results revealed a significant spatial influence, primarily driven by variations in precipitation patterns across the distinct regions of RHAL-MG. As a reflection of these findings, the spatial boundaries of the analyzed areas correspond closely with the delineation of semi-arid and desertification-susceptible regions in the state of Minas Gerais.
Although the rainfall patterns identified across the clusters were similar, the precipitation levels recorded for corresponding months varied in both scale and intensity.
The SMK test did not detect significant trends in monthly rainfall volumes for the majority of the pluviometric stations analyzed. However, at 24% of the stations, a statistically significant decreasing trend in monthly precipitation was observed throughout the historical series. The presence of a downward trend at some stations, combined with the absence of increasing trends elsewhere, is particularly concerning given the region's already low rainfall levels, reduced river discharge, and the prevalence of intermittent watercourses.
The differences in rainfall patterns among the clusters—particularly the high vulnerability observed in G3 and the contrasting behavior of G1—have important implications for water resource management. These findings emphasize the need for targeted strategies to mitigate the impacts of drought, especially in semi-arid and desertification-prone areas. The results also provide valuable input for the development of climate adaptation policies and hydrological planning in the East Atlantic Hydrographic Region of Minas Gerais.
Furthermore, the study highlights the importance of strategic planning and infrastructure development focused on risk management, water storage, and the efficient use of water resources, while ensuring the ecological sustainability of aquatic ecosystems.
Supplementary Material
Supplementary material accompanies this paper.
Table S1
This material is available as part of the online article from https://doi.org/10.1590/2318-0331.302520240136
DATA AVAILABILITY STATEMENT
Research data is available in a repository (http://repositorioigam.meioambiente.mg.gov.br/).
ACKNOWLEDGEMENTS
The authors thank the Instituto Mineiro de Gestão das Águas (IGAM) for providing the monitoring data.
REFERENCES
-
Alvalá, R. C. S., Cunha, A. P. M. A., Brito, S. S. B., Seluchi, M., Marengo, J. A., Moraes, O. L. L., & Carvalho, M. A. (2019). Drought monitoring in the Brazilian Semiarid region. Anais da Academia Brasileira de Ciências, 91(Suppl 1), e20170209. http://doi.org/10.1590/0001-3765201720170209
» http://doi.org/10.1590/0001-3765201720170209 -
Artaxo, P. (2022). Mudanças climáticas: caminhos para o Brasil: a construção de uma sociedade minimamente sustentável requer esforços da sociedade com colaboração entre a ciência e os formuladores de políticas públicas. Ciência e Cultura, 74(4), 1-14. http://doi.org/10.5935/2317-6660.20220067
» http://doi.org/10.5935/2317-6660.20220067 - Bahia. Secretaria do Meio Ambiente e Recursos Hídricos – SEMARH. (2005). Plano Estadual de Recursos Hídricos do Estado da Bahia. Salvador: SEMARH.
- Brasil. Agência Nacional de Águas e Saneamento Básico – ANA. (2015). Conjuntura dos recursos hídricos no Brasil: regiões hidrográficas brasileiras: edição especial (163 p.). Brasília: ANA.
- Brasil. Ministério do Meio Ambiente e Mudança do Clima – MMA. Secretaria de Recursos Hídricos. (2006). Caderno da região hidrográfica Atlântico Leste (156 p.). Brasília: MMA.
- Brasil. Ministério do Meio Ambiente e Mudança do Clima – MMA. Secretaria de Recursos Hídricos. (2007). Atlas das áreas susceptíveis à desertificação do Brasil (134 p.). Brasília: MMA.
- Brasil. Agência Nacional de Águas e Saneamento Básico – ANA. (2023). Conjuntura dos recursos hídricos no Brasil 2023: informe annual (133 p.). Brasília: ANA.
-
Brasil. Agência Nacional de Águas e Saneamento Básico – ANA. (2024). Hidroweb v3.3.8361.0: séries históricas de estações. Brasília: ANA. Retrieved in 2024, December 10, from https://www.snirh.gov.br/hidroweb/serieshistoricas
» https://www.snirh.gov.br/hidroweb/serieshistoricas -
Brito, S. S. B., Cunha, A. P. M. A., Cunningham, C. C., Alvalá, R. C., Marengo, J. A., & Carvalho, M. A. (2018). Frequency, duration and severity of drought in the Semiarid Northeast Brazil region. International Journal of Climatology, 38(2), 517-529. http://doi.org/10.1002/joc.5225
» http://doi.org/10.1002/joc.5225 -
Coelho, C. A. S., Oliveira, C. P., Ambrizzi, T., Reboita, M. S., Carpenedo, C. B., Campos, J. L. P. S., Tomaziello, A. C. N., Pampuch, L. A., Custódio, M. S., Dutra, L. M. M., Rocha, R. P., & Rehbein, A. (2016). The 2014 southeast Brazil austral summer drought: regional scale mechanisms and teleconnections. Climate Dynamics, 46(11-12), 3737-3752. http://doi.org/10.1007/s00382-015-2800-1
» http://doi.org/10.1007/s00382-015-2800-1 - Cox, D. R., & Stuart, A. (1955). Some quick sign tests for trend in location and dispersion. Biometrika, 2(1), 85-95.
-
Dunn, O. J. (1964). Multiple comparisons using rank sums. Technometrics, 6(3), 241-252. http://doi.org/10.1080/00401706.1964.10490181
» http://doi.org/10.1080/00401706.1964.10490181 -
Ella, E. M. A. E., Abbas, A. A., & Mohamed, H. I. (2024). Applicability of utilizing remote sensing rainfall products data in arid and semi-arid poorly gauged catchments: study of Wadi Ghoweiba Watershed, Egypt. Photonirvachak, 52(1), 219-234. http://doi.org/10.1007/s12524-023-01801-1
» http://doi.org/10.1007/s12524-023-01801-1 - Ferreira, D. B., Rodrigues, G. B., Salim, M. D., Oliveira, K. L., Christofaro, C., & Oliveira, C. S. (2021). Pluviometric patterns in the São Francisco river basin in minas gerais, Brazil. Revista Brasileira de Recursos Hidricos, 26(27), 13.
-
Ganguly, T., Arya, D. S., & Paul, P. K. (2023). Spatio-temporal patterns of precipitation in arid and semi-arid regions in western India. Journal of Earth System Science, 132(2), 71. http://doi.org/10.1007/s12040-023-02084-3
» http://doi.org/10.1007/s12040-023-02084-3 -
Gebrechorkos, S. H., Hülsmann, S., & Bernhofer, C. (2019). Long-term trends in rainfall and temperature using high-resolution climate datasets in East Africa. Scientific Reports, 9(1), 11376. http://doi.org/10.1038/s41598-019-47933-8
» http://doi.org/10.1038/s41598-019-47933-8 -
Hamed, K. H., & Rao, A. R. (1998). A modified Mann-Kendall trend test for autocorrelated data. Journal of Hydrology , 204(1-4), 182-196. http://doi.org/10.1016/S0022-1694(97)00125-X
» http://doi.org/10.1016/S0022-1694(97)00125-X - Helsel, D. R., Hirsch, R. M., Ryberg, K. R., Archfield, S. A., & Gilroy, E. J. (2020). Statistical methods in water resources. In U.S. Geological Survey (Ed.), Statistical analysis: book 4, hydrologic analysis and interpretation (Chap. 3, Section A, 484 p). Reston: USGS.
- Instituto de Pesquisa Econômica Aplicada – IPEA. (2022). Água, problemas complexos e o Plano Nacional de Segurança Hídrica (Vol. 1). Rio de Janeiro: IPEA.
- Instituto Mineiro de Gestão das Águas – IGAM. (2020). Gestão e situação das águas de Minas Gerais 2020 (230 p.). Belo Horizonte: IGAM.
- Instituto Nacional de Meteorologia – INMET. (2017). Nota técnica 004/17. Brasília.
- Kendall, M. G. (1955). Rank correlation methods (2nd ed., 196 p.). London: Griffin.
-
Kruskal, W. H., & Wallis, W. A. (1952). Use of ranks in one- criterion variance analysis. Journal of the American Statistical Association, 47(260), 583-621. http://doi.org/10.1080/01621459.1952.10483441
» http://doi.org/10.1080/01621459.1952.10483441 -
Liu, J., Zhang, X., Wu, B., Pan, G., Xu, J., & Wu, S. (2017). Spatial scale and seasonal dependence of land use impacts on riverine water quality in the Huai River basin, China. Environmental Science and Pollution Research International, 24(26), 20995-21010. http://doi.org/10.1007/s11356-017-9733-7
» http://doi.org/10.1007/s11356-017-9733-7 - Macêdo, T. H. J. (2021). Monitoramento da desertificação e do balanço hidrológico de bacias hidrográficas (Dissertação de mestrado). Universidade Estadual do Sudoeste da Bahia, Vitória da Conquista.
-
Mann, H. B. (1945). Nonparametric tests against trend. Econometrica, 13(3), 245-259. http://doi.org/10.2307/1907187
» http://doi.org/10.2307/1907187 -
Medeiros, F. J., Oliveira, C. P. D., Gomes, R. D. S., Silva, M. L. D., & Cabral Júnior, J. B. (2021). Hydrometeorological conditions in the semiarid and east coast regions of Northeast Brazil in the 2012-2017 period. Geociences. Anais da Academia Brasileira de Ciências, 93(1), 1-15. http://doi.org/10.1590/0001-3765202120200198
» http://doi.org/10.1590/0001-3765202120200198 -
Mehta, D., & Yadav, S. (2021). An analysis of rainfall variability and drought over Barmer District of Rajasthan, Northwest India. Water Science and Technology: Water Supply, 21(5), 2505-2517. http://doi.org/10.2166/ws.2021.053
» http://doi.org/10.2166/ws.2021.053 - Melo Júnior, J. C. F., Sediyama, G. C., Ferreira, P. A., Leal, B. G., & Minusi, R. B. (2006). Distribuição espacial da frequência de chuvas na região hidrográfica do Atlântico, Leste de Minas Gerais. Revista Brasileira de Engenharia Agrícola e Ambiental, 10(2), 417-425.
-
Montenegro, S., & Ragab, R. (2012). Impact of possible climate and land use changes in the semi arid regions: a case study from North Eastern Brazil. Journal of Hydrology, 434–435, 55-68. http://doi.org/10.1016/j.jhydrol.2012.02.036
» http://doi.org/10.1016/j.jhydrol.2012.02.036 - Moradpoor, N., Najarchi, M., & Hezave, S. M. M. (2023). Spatiotemporal analysis of long-term rainfall in semi-arid area using artificial intelligence models (case study: Ilam Province, Iran). Water, 15(19), 1-15.
-
Morsy, M., Taghizadeh-Mehrjardi, R., Michaelides, S., Scholten, T., Dietrich, P., & Schmidt, K. (2021). Optimization of rain gauge networks for arid regions based on remote sensing data. Remote Sensing, 13(21), 4243. http://doi.org/10.3390/rs13214243
» http://doi.org/10.3390/rs13214243 - Neves, K. M. M., Vieira, L. C. M., Ribas, L. P. R., Fraga, M. S., & Souza, P. P. (2020). Eventos extremos e segurança hídrica: monitoramento, reflexos e impactos. In C. M. C. Correia (Ed.). Gestão e situação das águas de Minas Gerais 2020 (pp. 96-112). Belo Horizonte: Instituto Mineiro de Gestão das Águas.
- Obermaier, M., & Rosa, L. P. (2013). Mudança climática e adaptação no Brasil: uma análise crítica. Estudos Avançados, 27(78), 155-176.
-
Oliveira, P. T., Silva, C. S., & Lima, K. C. (2017). Climatology and trend analysis of extreme precipitation in subregions of Northeast Brazil. Theoretical and Applied Climatology, 130(1-2), 77-90. http://doi.org/10.1007/s00704-016-1865-z
» http://doi.org/10.1007/s00704-016-1865-z -
Ramkar, P., & Yadav, S. (2018). Spatiotemporal drought assessment of a semi-arid part of middle Tapi River Basin, India. International Journal of Disaster Risk Reduction, 28, 414-426. http://doi.org/10.1016/j.ijdrr.2018.03.025
» http://doi.org/10.1016/j.ijdrr.2018.03.025 -
Rohlf, F. J. (1970). Adaptive hierarchical clustering schemes. Systematic Zoology, 19(1), 5882. http://doi.org/10.2307/2412027
» http://doi.org/10.2307/2412027 -
Santos, T. V., Freitas, L. A., Gonçalves, R. D., & Chang, H. K. (2020). Teste de Mann-Kendall aplicado à dados hidrológicos: desempenho dos filtros TFPW e CV2 na análise de tendências. Ciência e Natura, 42(87), e87. http://doi.org/10.5902/2179460X41928
» http://doi.org/10.5902/2179460X41928 -
Santos, A. L. M., Gonçalves, W. A., Andrade, L. M. B., Rodrigues, D. T., Batista, F. F., Lima, G. C., & Silva, C. M. S. (2024). Space-time characterization of extreme precipitation indices for the semiarid region of Brazil. Climate, 12(3), 43. http://doi.org/10.3390/cli12030043
» http://doi.org/10.3390/cli12030043 -
Sousa, L. B., Montenegro, A. A. A., Silva, M. V., Almeida, T. A. B., Carvalho, A. A., Silva, T. G. F., & Lima, J. L. M. P. (2023). Spatiotemporal analysis of rainfall and droughts in a semiarid basin of Brazil: land use and land cover dynamics. Remote Sensing, 15(10), 2550. http://doi.org/10.3390/rs15102550
» http://doi.org/10.3390/rs15102550 -
Shapiro, S. S., & Wilk, M. B. (1965). An analysis of variance test for normality. Biometrika, 52(3-4), 591-599. http://doi.org/10.1093/biomet/52.3-4.591
» http://doi.org/10.1093/biomet/52.3-4.591 -
Taoufik, G., Khouni, I., & Ghrabi, A. (2017). Assessment of physico-chemical and microbiological surface water quality using multivariate statistical techniques: a case study of the Wadi El-Bey River, Tunisia. Arabian Journal of Geosciences, 10(7), 181. http://doi.org/10.1007/s12517-017-2898-z
» http://doi.org/10.1007/s12517-017-2898-z - Tinôco, I. C. M., Bezerra, B. G., Lucio, P. S., & Barbosa, L. M. (2018). Characterization of rainfall patterns in the semiarid Brazil. Anuário Instituto de Geociências, 41(2), 397-409.
- Tucci, C. E. M., & Chagas, M. F. (2017). Segurança hídrica: conceitos e estratégia para Minas Gerais Revista de Gestão de Água da América Latina, 14, e12.
- United Nations Educational, Scientific and Cultural Organization – UNESCO. (2021). The United Nations world water development report: valuing water. Paris.
- United Nations. (2023). Synergy solutions for a world in crisis: tackling climate and SDG action together. New York.
- Verburg, P. H., Metternicht, G., Aynekulu, E., Deng, X., Herrmann, S., Schulze, K., Akinyemi, F., Barger, N., Boerger, V., Dosdogru, F., Gichenje, H., Kapović-Solomun, M., Karim, Z., Lal, R., Luise, A., Masuku, B. S., Nairesiae, E., Oettlé, N., Pilon, A., Raja, O., Ravindranath, N. H., Ristić, R., & von Maltitz, G. (2022). The contribution of integrated land use planning and integrated landscape management to implementing land degradation neutrality: entry points and support tools. A report of the science-policy interface. Bonn: United Nations Convention to Combat Desertification.
- World Meteorological Organization – WMO. (1989). Calculation of monthly and annual 30-year standard normals (WMO-TD, No. 341). Geneva: WMO.
- World Meteorological Organization – WMO. (2017). Guide to the global observing system Geneva: WMO.
- World Meteorological Organization – WMO. (2021). Atlas of mortality and economics losses from weather, climate and water extremes (1970-2019). Geneva: WMO.
-
Yang, F., Wang, X., Zhou, X., Wang, Q., & Tan, X. (2023). Effects of urbanization on changes in precipitation extremes in Guangdong-Hong Kong-Macao Greater Bay Area, China. Water, 15(19), 22p. http://doi.org/10.3390/w15193438
» http://doi.org/10.3390/w15193438 - Zar, J. H. (2010). Biostatistical analysis (5th ed.). New Jersey: Pearson.
Edited by
-
Editor-in-Chief:
Adilson Pinheiro
-
Associated Editor:
Carlos Henrique Ribeiro Lima




 Different letters indicate p-value < 0.05 and, therefore, a statistically significant difference between the groups.

 Different letters indicate p-value < 0.05 and, therefore, a statistically significant difference between the groups.


