 The exceptional hydrological disaster of April-May 2024 in southern Brazil
ABSTRACT
We present an overview of the unprecedent hydrological event that occurred in Rio Grande do Sul state in late April and early May 2024, causing floods and landslides in a scale that was not seen before in Brazil. The rainfall that caused the disaster is incomparable to any recent event in Brazil at large spatial and temporal scale. The intense and long-lasting precipitation led to record floods from small rivers with drainage areas below 1000 km2 to the Patos Lagoon, which drains more than 180,000 km2. The rainfall also led to landslides that rank first in Brazil in terms of spatial scale and number of occurrences. Mountain rivers experienced flash floods with extreme water levels, while in the lowlands the large rivers and the Patos Lagoon experienced long duration flooding, with stage remaining high for about 30 days. The flood event is probably ranked first in terms of displaced people and damage to property and infrastructure in Brazil. Almost 200 fatalities occurred due to the disaster and protection structure failures. The April-May hydrological event show a glimpse of what can be expected along the coming decades due to climate change in a region that covers South Brazil, and parts of the neighboring countries.
Keywords:
Natural disaster; Extreme hydrological events; Exceptional floods
RESUMO
Apresentamos uma visão geral do evento hidrológico sem precedentes que ocorreu no estado do Rio Grande do Sul no final de abril e início de maio de 2024, causando inundações e movimentos de massa em uma escala nunca vista no Brasil. A precipitação que causou o desastre é incomparável a qualquer evento recente no país em termos de escala espacial e temporal. A intensa e prolongada precipitação resultou em enchentes recordes, desde pequenos rios com áreas de drenagem abaixo de 1.000 km2 até a Laguna dos Patos, que drena mais de 180.000 km2. As chuvas também levaram a movimentos de massa que ocupam o primeiro lugar no Brasil em termos de extensão espacial e número de ocorrências. Enchentes rápidas com níveis extremos de água ocorreram em regiões montanhosas, enquanto nas áreas mais baixas as cheias tiveram longa duração, com os níveis de água permanecendo elevados por cerca de 30 dias. Este desastre provavelmente ocupa a primeira posição no Brasil em número de pessoas deslocadas e danos a propriedades e infraestruturas. Quase 200 fatalidades ocorreram devido ao desastre e falhas em estruturas de proteção. O evento hidrológico de abril e maio oferece um vislumbre do que pode ser esperado nas próximas décadas devido às mudanças climáticas em uma região que abrange o Sul do Brasil e partes dos países vizinhos.
Palavras-chave:
Desastre natural; Eventos hidrológicos extremos; Enchentes excepcionais
INTRODUCTION
Between the end of April and the beginning of May 2024, heavy rains caused extraordinary flooding in southern Brazil. The largest floods and landslides ever observed occurred along several rivers in the state of Rio Grande do Sul, such as the Jacuí, Taquari, Caí, Sinos and Guaíba (New York Times, 2024). The Patos Lagoon, which ultimately receives the water of all those rivers, also reached the highest levels ever recorded.
In the state´s capital, Porto Alegre, the Guaíba flood exceeded the maximum level observed during the traumatic flood of 1941 (Possa et al., 2022b; Silveira et al., 2023), with even more devastating consequences because the flood protection system, built in 1970 decade, was unable to prevent the water from entering the city.
The hydrological disaster occurred in four forms: 1) mass movements in the mountains, 2) flash flood in rivers in the transition between the mountains and the plains, 3) relatively slower and long-lasting flooding along the densely populated areas close to the lowland rivers, where the failure of the flood protection systems intensified the impacts, 4) slow flooding throughout the margins of the Patos Lagoon.
The exceptional hydrological disaster of April-May 2024 in southern Brazil not only marks new records of flooding in several rivers in the region. It also is the most extensive landslide event ever observed in Brazil (Brasil, 2024a; Andrades Filho et al., 2024).
Hundreds of thousands of people were directly affected by the floods, that inundated more than 15,000 km2. Fatal victims are at least 183, and 27 people are still reported missing, five months after the disaster (Rio Grande do Sul, 2024d).
The 2024 extreme hydrological event occurred a few months after other noteworthy rainfall related disasters in Brazil (Marengo et al., 2023a, 2023b, 2024), and only eight months after a catastrophic flood hit the same southern brazilian region in September 2023 (Alvalá et al., 2024; Moraes et al., 2024), suggesting that the region is passing through a particular flood rich period. This recent flood rich period in southern Brazil seems to be in accordance with already reported trends in observed rainfall and floods during the last decades (Chagas et al., 2022) and with projections of possible hydrological impacts of climate change in southern Brazil for the XXI century (Brêda et al., 2023; Hodnebrog et al., 2022).
Given its profound, widespread and long-lasting impacts, the disaster of April-May 2024 can be considered the biggest natural hydrological disaster in the history of Brazil. It also gives an example of an event that can be called an “impossible flood”, as suggested by Montanari et al. (2024), because it exceed the expectations based on historical experience, and because it exposed the consequences of the occurrence of an event whose probability of occurrence was considered too small to act, even by the flood managers (Allasia et al., 2015).
The objective of this study is to document this exceptional hydrological event and the disaster that followed. We aimed to describe the process chain of the April-May 2024 hydrological disaster in South Brazil, from causes to impacts, focusing on what made the impacts to be so exceptional.
In our understanding, adequately documenting extraordinary hydrological events helps society to learn from those events, by understanding patterns and causes. And this learning process helps reducing vulnerability and increasing resilience to future disasters (Zanandrea et al., 2023). Other examples of papers that describe extraordinary floods are given by Gaume et al. (2004), Dimitriou et al. (2024), Mohr et al. (2023), Nanditha et al. (2023) and Kreibich et al. (2017). In the Brazilian context, accounts of other extraordinary hydrological events have been recently organized by Zanandrea et al. (2023).
We also understand that a detailed description and study of such extraordinary flood event is not of exclusive interest of the affected region, because the lessons that can be drawn from it are not limited to the basin or river in which it occurred but can be extremely relevant to an entire large region, as suggested by Merz et al. (2024).
The paper is structured as follows: Section 2 describes the river basin and the impacted region and introduces the different data sets and methods used. Section 3 describes the event in terms of meteorological and hydrological aspects. Section 4 describes the event in terms of impacts. Finally, Section 5 discusses and summarizes the main results, draws conclusions.
DATA AND METHODS
The region impacted by the disaster
The April and May 2024 hydrological disaster occurred over the Rio Grande do Sul (RS) state, which is the southernmost state of Brazil, at latitudes close to 30 S (Figure 1a).

Main attributes of the Rio Grande do Sul region. (a) location, topography and main water bodies of the Rio Grande do Sul state; (b) landscape units of Rio Grande do Sul; (c) major watersheds, with highlight to the Guaíba drainage area; (d) populated places (municipalities) and population size across the state.
Rio Grande do Sul has a geography shaped by a diversity of geological and climatic features that define its four major geomorphological regions: the Coastal Plain, the Southern Plateau, the Central Depression, and the Pampas (Rambo, 2005), as shown in Figure 1b.
The Coastal Plain is characterized by an extensive Quaternary plain along the Atlantic Ocean, formed by marine and fluvial sedimentary processes from the last marine transgressions, featuring two very large lagoons (Laguna dos Patos and Lagoa Mirim), and several other smaller lakes.
The Southern Plateau, located to the north, forms the highest area of the state, with elevations that exceed 1,000 m in the eastern part, and are close to 500 m in the western part, and geologically belongs to the Paraná Basin, which consists of layered basaltic flows from the Upper Cretaceous period. The region is characterized by rugged terrain and deep canyon valleys.
The Central Depression, situated between the Southern Plateau and the Pampas, is composed of sedimentary terrains from the Paraná Basin. This region is characterized by gently rolling hills and alluvial valleys, with fertile soils derived from fluvial deposits, making it an important area for agriculture, especially rice cultivation in irrigated areas.
The Pampas, to the south, is part of the “South Rio-Grandense Shield”, of Precambrian origin, with a gentle relief composed of low hills and plains, formed by crystalline and metamorphic rocks. This region is dominated by natural grasslands, primarily used for extensive livestock farming.
Climate in the State Rio Grande do Sul is classified as Humid subtropical (Cfa), according to Köppen, without significant precipitation difference among seasons (Peel et al., 2007). Mean annual precipitation in the regions of the Rio Grande do Sul State varies between 1,200 mm, in the extreme south of the state, close to the Chuí River, and 2,000 mm, in the northern region of the state (Pinto et al., 2011). In summer, the Tropical Atlantic Air Mass results in high temperatures and intense convective rains. During the winter and transition months, rainfall is influenced by the convergence of cold fronts and extratropical cyclones that affect southern Brazil as a whole.
Most of the rivers within Rio Grande do Sul contribute to one of two drainage systems: the Uruguay river basin, which drains to the Atlantic through the La Plata river, and the Patos Lagoon basin, which drains directly to the Atlantic, as shown in Figure 1c.
While the extreme event of April and May 2024 impacted both the Uruguay River basin and the basin draining into Patos Lagoon, it was in the Patos Lagoon basin that the event was most remarkable. Therefore, here we focus on what happened in the Patos Lagoon drainage basin, and especially in the northern part, where the most intense rainfall occurred (Figure 2).

The Guaíba river drainage basin. This watershed includes the Jacuí river valley lowlands and the most important tributaries: Vacacaí, Pardo, Taquarí, Caí, Sinos and Gravataí. The figure also depicts reference cities and dams (a: Dona Francisca dam; b: Itauba dam; c: Passo Real dam; d: Rastro de Auto dam; e: Salto Forqueta dam; f: 14 de Julho dam; g: Castro Alves dam).
The Patos Lagoon is characterized as a barrier-lagoon system, a type of water body that develops in areas where sandy barriers formed by marine and wind-driven sediment deposition isolate an area of freshwater or brackish water from the ocean (Villwock et al., 2020). The water body has approximately 250 km in length and 40 km in average width, with a surface of about 10 thousand km2 and an average depth of 6 meters (Toldo Junior et al., 2006). The Patos Lagoon extends in a north-northeast to south-southwest direction parallel to the Atlantic Ocean, from which it is separated by a sandy barrier (Figure 1a). At its southern end, the Patos Lagoon Estuary is connected to the Atlantic Ocean by a 22 km long channel. The total drainage area of Patos Lagoon is 182,000 km2 and includes a part in Brazil (82%) and a part in Uruguay (18%), as shown in Figure 1c. The mean outflow of Patos Lagoon to the sea is expected to be around 2,000 to 4,000 m3/s (Lopes et al., 2018).
In its southern portion, the Patos Lagoon is connected to the Mirim Lagoon, through the São Gonçalo Channel. In its northern portion, the Patos Lagoon is connected to the Guaíba River, on the banks of which the capital city of Porto Alegre is located.
The state is home to about 11 million people, and is subdivided into 497 municipalities (Instituto Brasileiro de Geografia e Estatística, 2023). The distribution of municipalities in Rio Grande do Sul reflects its historical process of occupation and economic-geographic development (Figure 1d). The northern half of the state is generally more densely populated than the southern half. Within the Patos Lagoon basin, the most densely populated region is the Porto Alegre Metropolitan Region (RMPA), which extends nearly 50 km from Porto Alegre to the North.
The most intense rainfall during the April-May 2024 flood occurred over the area that drains to the Guaíba River, therefore special emphasis is given to this part of the Patos Lagoon drainage system, even though flooding also occurred at cities located on the shores of the Lagoon, as we report further. The drainage area that converges to the Guaíba River is shown in Figure 1c, in the northern part of the Patos Lagoon drainage area.
This northern part is drained by the Jacuí River and its tributaries, that ultimately flow to the Guaíba River, as shown in Figure 2. Very close to Porto Alegre, the Jacuí (drainage area of 72,000 km2) joins with the Caí (4,983 km2), Sinos (3,694 km2) and Gravataí (2,015 km2) rivers, to form the Guaíba River, as can be seen in Figure 2. About 65 km upstream of Porto Alegre, the Jacuí River receives water from its most important tributary, the Taquarí River (26,430 km2). The Jacuí river also receives water from the Pardo (3,638 km2) and Vacacaí (9,995 km2) rivers, respectively 155 km and 284 km upstream of Porto Alegre.
The Jacui river basin can be divided into its Upper and Lower parts. The Upper Jacuí and the other rivers that drain from the North are steep, while the Lower Jacuí, the Vacacaí and Sinos rivers have milder slopes. The Taquari river is called Antas river upstream of the city of Muçum.
Within the Guaíba river basin shown in Figure 2, there are 63 dams of hydropower plants and four navigation dams with locks. The location of seven of the hydropower dams with relevant information during the flood is shown in Figure 2. The main characteristics of those dams are informed in Table 1.
Soils in the Northern part of the Jacuí and Taquari basins are relatively deep and have high clay content. Along the incised valleys, the most common soils are Leptosols, which are relatively shallow. Both kinds of soils of the northern part of the basin are formed on basalt and have relatively low water storage capacity (Paiva et al., 2024a). These characteristics drive the behavior of the rivers, which typically show relatively low base flows and very high flows during floods.
Along the lower Jacuí, downstream of Dona Francisca dam, there is a wide and relatively flat floodplain, where the predominant soils are Planosols formed mostly in clayey alluvial deposits. The same occurs along the other rivers in the Central Depression, as the Vacacaí, Gravataí and parts of the Sinos.
Most of the cities in the lower part of the basin shown in Figure 2 are located close to the rivers, due to the historical dependence on inland fluvial navigation transport routes, that lasted until the mid-20th century. The original urban settlements were generally located over higher ground at the river shores but increasing population and new rail and road infrastructure boosted the urban occupation of lower areas (Scheibe et al., 2015; Altafini et al., 2023; Schutz & Graebin, 2024).
The most extensive occupation of the lowlands occurs in the Porto Alegre Metropolitan Area (RMPA – Região Metropolitana de Porto Alegre), which is formed by 34 municipalities, where 4.4 million of the state's 11 million inhabitants live. Historically, the lowlands around Porto Alegre were subject to flooding, with textual information about floods dating back to 1847 (Roche, 1955). Until early May 2024, the most remarkable flood occurred in 1941 (Tucci, 1999; Silveira, 2020; Possa et al., 2022b). This flood was not only remarkable in the city of Porto Alegre but remained until recently as the record flood event in several places throughout the drainage basin of the Jacuí and Guaíba rivers (Torres, 2012; Moraes et al., 2024).
After the 1941 flood, an extensive flood defense system composed by levees, walls and pumping stations was projected and built to protect the cities of Porto Alegre, Canoas, São Leopoldo and Novo Hamburgo from floods. The protection system was designed in the late 1960s and built over the following two decades (1970 and 1980). In the central region of Porto Alegre, the protection system was designed with a crest elevation of 6.00 meters, 3 meters above the reference floor level of the main city harbor. The value was obtained by adding the maximum elevation of the 1941 flood measured at the gauge in the port of Porto Alegre, which was estimated at 4.75 meters, to a freeboard of 1.25 meters (Rauber, 1992).
The total length of levees and concrete walls in the RMPA is approximately 120 km (68 km in Porto Alegre), served by a total of 38 pumping stations (23 in Porto Alegre). In the port region of Porto Alegre the flood defense wall has 14 floodgates that remain open most of the time to enable vehicle access to the port, and are closed only during major floods.
After the flood defense system was built, a relatively long period with only minor floods occurred. During the 50 years of functioning of the flood defense system, before the May 2024 flood, the floodgates in Porto Alegre had only been closed three times. The first in 2015, when the Guaíba River level approached 3.00 m, and more recently two times in 2023: once in September, when the level reached 3.18 m, and again in November, when it rose to 3.46 m.
Despite experiencing few major floods over most of its history, the flood protection system has encouraged urban development within the floodplain across the metropolitan region (Miranda, 2016). The long period without significant floods, from the 1970´s to 2015, motivated people to discuss whether the protection system was necessary, even proposing the removal of part of the system in the city center (Tucci, 1999; Allasia et al., 2015; Possa et al., 2022b).
The long period without major floods also motivated urban settlement in floodplain areas that are not protected by the flood defense system, like the archipelago of islands in the delta region in the transition from the Jacuí river to the Guaíba river, and in the cities of Eldorado do Sul and Guaíba.
Measured precipitation
To analyze the precipitation that resulted in floods and landslides, hourly precipitation totals at ground-based observational stations were taken from the network operated by the National Water and Sanitation Agency (ANA), the Center for Monitoring and Alert of Natural Disasters (CEMADEN), the Geological Survey of Brazil (SGB) and the National Meteorological Institute (INMET). Initially we selected all automatic rain-gauges within the drainage area, and its surroundings, with data during the period from April 1, 2024 to May 15, 2024, and then discarded gauges with observation failures during periods of heaviest rainfall. Gauges with large discrepancies in relation to the values measured at neighboring stations were also discarded, based on expert inspection.
Finally, 79 automatic rain gauges were selected. From all those gauges we obtained rainfall data for the period from April 1, 2024 to May 15, 2024, at hourly time step. To calculate spatially average precipitation, and define isohyets, we interpolated gauge data using the Natural Neighbor method, as further described by Collischonn et al. (2024a).
Rainfall estimates from radar are not available in this region and conventional daily pluviometer data from April and May 2024 were still not available at the national ANA database at the time we prepared this manuscript.
River stage and streamflow
Information about the flood along the rivers were obtained from automatic and manually operated river gauges and from dam operation data. Systematically measured river data were provided by the National Water Agency (ANA) and the Geological Survey of Brazil (SGB). Data about dam operations were obtained from the National System Operator (Operador Nacional do Sistema Elétrico, 2024) and directly from the hydropower companies. Data from Patos Lagoon was obtained from “HidroSens” research group from Universidade Federal de Pelotas (Contreira Pereira et al., 2024).
SGB also provided information on high-water marks that were obtained by leveling after the occurrence of the floods (Marcuzzo et al., 2024; Germano et al., 2024).
In some sites where no gauges and no measured water marks are available, we used information provided by eyewitnesses that were contacted by the authors.
Weather forecasts
Meteorological forecasts of rainfall issued prior to the flood were evaluated with the aim of verifying whether the precipitation that occurred was adequately predicted. Quantitative Precipitation Forecasts (QPFs) issued by ECMWF (Roberts et al., 2018; Frnda et al., 2022) and GFS (National Oceanic and Atmospheric Administration, 2011) global NWP models at days April 27 12pm and April 29 12pm were checked. Local information from the warnings issued from the Brazilian National Weather Institute (INMET) and the state Rio Grande do Sul meteorological service were also assessed.
ECMWF and GFS forecasts were retrieved from the TIGGE database (Bougeault et al., 2010; Swinbank et al., 2016). ECMWF and GFS models were selected for analysis since they are the main models used by the local institutions and decision makers, including their availability by smartphone apps (Slavovsky, 2017).
Data for the estimation of flooded areas
The flooded areas were identified based on official information released by the government of the state of Rio Grande do Sul (Rio Grande do Sul, 2024b). These areas resulted from a mosaic of various parallel initiatives carried out during the crisis, covering both overlapping and distinct regions across the state. For the floods, mapping in the Guaíba watershed involved integrating optical remote sensing images (Planet, SkySat, and WorldView-2), captured on 05/06/2024, with the Digital Terrain Model of Functional Region 1 (MDT-RF1) and the FABDEM Digital Elevation Model (Hawker et al., 2022). Field data points collected during or near the peak of the flood were used to determine flood elevations, which were interpolated and subtracted from the elevation obtained through the Digital Elevation Model, resulting in estimated water depths and the delineation of the flood area boundaries. Additionally, Sentinel-2 satellite images from 05/06/2024 and 05/08/2024 were used to classify flooded areas and mud-covered regions, applying water (NDWI) and mud (BSI) indices, with manual validation of the flooded areas (Possantti et al., 2024). To refine the affected areas in the southern region of the state, contiguous to Patos Lagoon, flood mapping based on Planet images from 05/17/2024 was used. Specifically, in the urban areas of Rio Grande and Pelotas, an object-oriented approach was employed, segmenting Planet images from 05/15/2024. In the municipalities of Rio Grande, São José do Norte, and São Lourenço do Sul, the flooded area was delineated based on the maximum elevation reached on 05/27/2024. A government-contracted initiative produced complementary flood maps using daily imaging from the Planet satellite constellation. The images from the Dove and SuperDove satellites were orthorectified and have a spatial resolution of 3 meters. The final product consisted of vectorized affected areas, classified by flood and landslide regions, based on Planet images from May 5 to 8, 2024.
Landslide data
The identification and recognition of the occurred landslides were conducted through: (i) satellite imagery analysis; (ii) field surveys; (iii) helicopter and UAV overflights; and (iv) landslide scars mapping conducted by different working groups. Initially, Sentinel and PlanetScope satellite images were used for the preliminary recognition of areas with a higher number of landslide occurrences and a larger affected area to guide the planning of field activities. Field surveys were conducted in priority locations according to preliminary analysis of satellite images, guidance from the state government, and demands presented by the affected municipalities. During the field surveys, inspection was carried out at landslide scarp points (landslide crowns), areas dominated by sediment transport (checking for landslide dam formation), and deposition areas where most of the damage occurred. Furthermore, interviews with local residents were carried out in order to obtain detailed information about landslide time, triggering rainfall, signals and effects. In locations where access was hindered due to road obstructions, bridge collapses, or remote areas, helicopter overflights were conducted for visual recognition, photo-taking, and later access to the landslides. UAV photo and video footage were also taken to recognize the areas, as well as aerial photogrammetric surveys to reconstruct Digital Terrain Models (DTM) of some of the landslides that occurred. Finally, landslide inventories prepared by the NASA Disaster Program (National Aeronautics and Space Administration, 2024), the National Center for Monitoring and Early Warning of Natural Disasters (Brasil, 2024b) and Andrades Filho et al. (2024), along with Citizen Mapping based on the Citizen Science perspective, were considered. For Citizen Mapping, a communication channel was established with the affected population to enable them to share information about the location and timing of the landslides, characteristics of the events, and the resulting damage, as well as photos and videos related to the occurrences.
Data on impacts
The information regarding the loss of lives, including the number of deaths and missing people during the disaster, was obtained from official bulletins released by the Civil Defense of the State of Rio Grande do Sul. These bulletins were accessed through the official Civil Defense website, with the most recent report retrieved on August 20, 2024. The listing of victims was organized by municipalities, allowing for a detailed analysis of the impact on each affected locality. Displaced people estimates were also obtained from the official information released by the government of the state of Rio Grande do Sul (Rio Grande do Sul, 2024a). This estimate was based on geoprocessing techniques, evaluating the spatial overlap of mapped flooded and landslide areas with the latest population survey conducted by the 2020 Demographic Census (Instituto Brasileiro de Geografia e Estatística, 2023). To ensure greater accuracy in the estimate of affected individuals, the resident population in each census tract was downscaled using additional information beyond the sector grid, such as the official household address registry (Instituto Brasileiro de Geografia e Estatística, 2023).
The information on impacts to housing, vehicles, infrastructure, production, human health was obtained from news websites, reports released by official state agencies, the Federation of Industries of Rio Grande do Sul, and by the National Confederation of Municipalities.
To estimate the number of buildings within the flooded area we combined the official map of flooded areas with the Google Open Buildings database (Google, 2024), that was obtained by remote sensing using high resolution images (Sirko et al., 2021). This database consists of one polygon describing the footprint of each building and a confidence score that relates to the uncertainty whether the polygon is actually a building or not. To count the affected buildings in the flooded area we considered only buildings with a confidence level greater than 0.75 (on a scale from 0 to 1).
To describe the failures of the flood defense infrastructure in the RMPA we relied on visits to sites during and after the flood, statements from civil defense agents and city hall employees, newspaper reports and videos and photos posted by witnesses on the internet.
EVENT DESCRIPTION AND ANALYSIS
Meteorological aspects
The heavy rains from late April to early May 2024 were caused by a combination of factors, including a mass of hot air over the central region of Brazil. This hot air mass blocked the cold front in the south, leading to prolonged instability and resulting in intense and continuous rainfall over the state (Brasil, 2024d).
Reboita et al. (2024) conducted a multi-scale analysis of the meteorological conditions that led to the intense rainfall. According to those authors, high surface water temperatures of the oceans, notably the tropical Atlantic, played a significant role in generating the intense precipitation in South Brazil, despite the warm phase (El Nino) of the ENSO phenomenon was weakening in late April. Moisture was transported mostly from the tropical Atlantic over the Amazon, and from there to south and southeast, by the Low-Level Jet east of the Andes. Two cold fronts were generated in the extreme south of the continent and passed over Rio Grande do Sul from 27 April to 2 May. Finally, several Mesoscale Convective Systems with deep clouds developed over Rio Grande do Sul and contributed to the formation of winds, tornados, lightning´s and, above all, heavy rain.
Observed precipitation
The hydrological disaster that occurred in RS was caused by very intense and prolonged rain events that hit a vast region almost simultaneously. Until the 28th, the month of April had already experienced above-average rainfall in much of RS, particularly in the western portion of the Jacuí River basin. From April 29th onwards, the rainfall intensified and continued until May 5th. A week later, on May 11th and 12th, another intense rainfall event affected nearly the entire region of the Jacuí, Taquari, Caí, and Sinos basins.
The highest rainfall amount in 24 hours was recorded by the automatic rain gauge of CEMADEN in the town of Segredo (CEMADEN code 432026301A) and reached 386.2 mm, between 6:00 p.m. on April 29 and 6:00 p.m. on April 30.
The highest rainfall intensity over 48 hours was recorded by the rain gauge located next to the PCH Rastro de Auto dam (ANA code 86743800), reaching 575.4 mm. This intense 48-hours precipitation occurred from 06:00 a.m. on April 30 to 06:00 a. m. May 2. The maximum 72-hours precipitation was measured at the same place, and reached 729.6 mm, from 29 April 02 p.m. to 02 May 02:00 p.m. This gauge also measured the highest 14-day rainfall, with 1008.2 mm from April 29 to May 12.
To characterize the temporal distribution of rainfall during the critical days of intense precipitation, three rain gauges were selected along a straight line extending approximately 130 km in the Jacuí and Taquari river basins. The westernmost rain gauge among the three is in the municipality of Segredo (CEMADEN code 432026301A). Approximately 80 km northeast in a straight line is the rain gauge PCH Rastro de Auto Barramento (ANA code 86743800), operated by the company CERTEL. Continuing another 46 km in the northeast direction, the third selected rain gauge for the temporal distribution analysis is PCH Linha Emília Jusante (ANA code 86505500), operated by Linha Emília Energética S.A.
Figure 3 shows the graph of the accumulated precipitation over time in the three selected rain gauge stations, from April 27, 2024 to May 13, 2024.Over this 17-day period, the accumulated precipitation exceeded 1000 mm at two gauges and reached 936 mm at the other. The graph shows that the most intense rainfalls occurred during the four days from April 29 to May 2. A secondary rainfall event occurred in 11 and 12 May.

Accumulated precipitation from April 27th to May 13th measured at 3 representative rain gauges.
The spatial distribution of accumulated rainfall during the five days with most intense precipitation, from 28 April 00h00min to 02 May 24h00min, is shown in Figure 4. The spatial distribution shows that rainfall was concentrated over the watersheds of Jacuí and Taquari rivers, precisely in the transition zone between the plateau and the plain, where the steepest terrain is located. More than 700 mm of rainfall were observed in just five days in some places. The intense precipitation in those five days occurred over an extensive area. The 500 mm isohyet extends over 250 km, and covers an area of almost 16,000 km2, while the 300 mm isohyet covers an area of approximately 60,000 km2.

Accumulated rain in the Guaíba drainage area. (a) Maps of accumulated rain gauge observation data and natural neighbor interpolation selected over 3-day, 5-day, 7-day and 14-day time windows; (b) Map of the 5-day accumulated rain from April 28 to May 2, 2024.
The extraordinary aspect of the precipitation that occurred in the April – May 2024 event in Rio Grande do Sul is its magnitude in large spatial and temporal scales, especially in durations of two days or more. The observed precipitation during this event in Rio Grande do Sul was further analyzed by Collischonn et al. (2024a), who concluded that it largely exceeded the most intense large-scale precipitation events historically observed in Brazil, from 1961 to 2022, at least for affected areas in the range from 2,000 to 100,000 km2 and rainfall durations of 3 to 14 days.
These authors also concluded that if it had occurred in the United States, the April - May 2024 rainfall in Rio Grande do Sul would only be less than the rainfall resulting from Hurricane Harvey in 2016 in Texas, considering an area affected of 50,000 km2 in 4 days (Collischonn et al., 2024a; Kunkel & Champion, 2019). In the authors words, the observed rainfall set a new record.
Weather forecasts
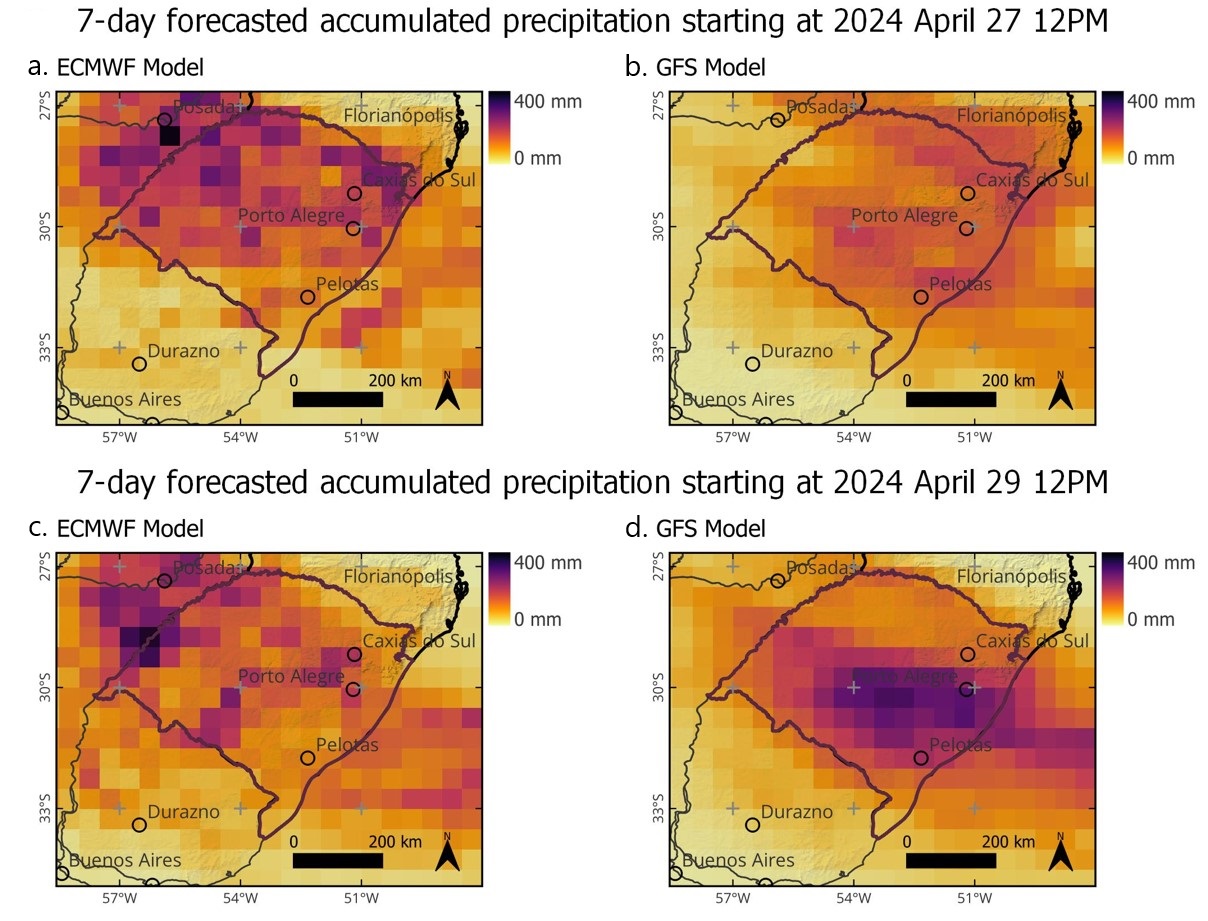
Figure 5 presents QPFs issued by ECMWF (Roberts et al., 2018; Frnda et al., 2022) and GFS (National Oceanic and Atmospheric Administration, 2011) global NWP models at days April 27 12:00 UTC and April 29 12:00 UTC. The figure show the reference deterministic forecast of the NWP models.

QPFs issued by global NWP models from: (a) ECMWF at April 27 12pm; (b) GFS at April 27 12pm; (c) ECMWF at April 29 12pm; and (d) GFS at April 29 12pm.
The ECMWF QPF on the 27th for the following 7 days predicted 174 mm of rainfall in average over the Guaíba river basin. Using observed precipitation data, described in the previous section, the actual average rainfall over the basin was 422 mm over the same 7 days. The ECMWF model forecast on the 29th remained spatially displaced from the actual zones of rainfall occurrence. Forecasted rainfall on the next seven days over the Guaibar river basin was 165 mm, while the observed value over the same period was 340 mm. In other words, the ECMWF forecasts underestimated the rainfall by a factor of 2.
The GFS model forecasts were more accurate in terms of location, but they also underestimated the total amount of rainfall. GFS forecasts for the 7 days starting at April 27th 12:00 UTC predicted an average of 153 mm over the Guaíba river basin, which is less than half what really occurred. Two days later, the GFS forecast of April 29th predicted 231 mm over the next seven days, which was more than what was forecast by ECMWF, but still much less than the actual values observed of 340 mm. In summary, the GFS model forecasts were relatively well-positioned over the basin, but the precipitation volumes were also largely underestimated.
Regarding institutional national information and warnings, INMET issued official forecasts. On April 26th, INMET issued a warning of heavy rain over the next few days in RS, with rainfall that could reach 200 mm over the 7 days until May 2 (Instituto Nacional de Meteorologia, 2024a). This warning suggested that a severe event would occur, however the degree of severity was greatly underestimated, since the rainfall observed during this period exceeded 600 mm in some regions, as shown in Figure 4.
After the intense rains had already started, INMET issued a new notice on April 30 18:00, warning that more 200 mm of rainfall would fall on the affected region within the 48 hours from April 30 12:00 to May 2 12:00 (Instituto Nacional de Meteorologia, 2024b). This second warning, based on the regional meteorological models run by INMET, was more accurate. In fact, 227 mm were observed on average over the whole Guaiba river basin during those 48 hours, while some areas received much more rain during the same period.
The meteorological service of the Rio Grande do Sul state provides weather forecasts using global meteorological models and a regional model based on WRF (Weather Research and Forecasting; Skamarock et al., 2008). This service issued a forecasting bulletin on April 29th warning about orange level precipitation over practically the whole State. An orange level warning means high values of rainfall, in a scale that goes up to red, which would be even higher. The 29th afternoon bulletin predicted that around 30 mm to 60 mm would occur on 29 April, 40 to 60 mm on 30 April and 60 to 80 mm on 1 May, and it warned that more intense rainfall could occur at some localities. Detailed information on the QPFs is not publicly available, inhibiting a quantitative analysis. Based on these QPF scenarios, the Civil Defense and the state government issued warnings of intense precipitation over the state on April 29th and 30th (Rio Grande do Sul, 2024h), including pronouncements from the state governor itself.
We recognize that the performance of the different forecasting models in predicting rainfall for the period April 29 to May 5 in Rio Grande do Sul requires further in-depth analysis. However, the first analysis presented here suggests that, in general, the models tended to significantly underestimate the precipitation that occurred. Additionally, some forecasts exhibited a location bias. Despite these issues, the models still indicated the potential for high rainfall intensities and enabled broad warnings to be issued.
Antecedent moisture conditions
Floods and landslides can be caused both by heavy rain falling on soils under normal conditions, and by relatively moderate rain reaching extremely saturated soils. Therefore, it is very important to analyze the initial conditions of a basin to understand the rain event that generates the peak of the flood begins.
To characterize the initial conditions of the basin, we calculated the accumulated rainfall from April 1 to April 27, preceding the heaviest rainfall. In the eastern part of the Guaiba river basin the accumulated rainfall is close to 100 mm, which is near average for April. However, in the western part of the basin, the cumulative rainfall from April 1 to April 27 exceeded 200 mm, reaching up to 300 mm in Santiago (INMET A833), a condition well above average.
Landslides
The mass movements occurred along the escarpments of the Southern Plateau, in a region covering approximately 25,000 km2 in an irregular polygon. This region extends about 350 km from west to east, and around 100 km from south to north. The landslide scar mapping by Centro Nacional de Monitoramento e Alertas de Desastres Naturais (Brasil, 2024c) recognized approximately 14,000 scars and 15,000 slope rupture points. Field activities, however, identified numerous small scars that were hidden by vegetation or shaded terrain areas, and that remote sensing failed to detect, suggesting that the actual number of scars is likely much higher than the estimates provided by Centro Nacional de Monitoramento e Alertas de Desastres Naturais (Brasil, 2024c), the NASA Disaster Program (National Aeronautics and Space Administration, 2024), and Andrades Filho et al. (2024).
Average landslide scar area is about 6,500 m2, with some scars exceeding 100,000 m2. The total area affected by landslides, calculated from the Centro Nacional de Monitoramento e Alertas de Desastres Naturais (Brasil, 2024c) mapping, is close to 92 km2. The predominant soil depth in the mass movement scars is around 1 m. The three most affected municipalities are Agudo, Fontoura Xavier, and Veranópolis in terms of the number of landslides; and Bento Gonçalves, Veranópolis, and Cotiporã in terms of affected area.
When analyzing scar density in relation to the spatial distribution of rainfall, high-density scar clusters coincide with areas of higher precipitation totals, where rainfall exceeded 600 mm between April 28 and May 2, 2024 (Figure 6). This indicates the significant influence of hydrological processes in triggering the landslides that occurred.
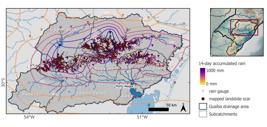
Landslide scars documented by remote sensing by Centro Nacional de Monitoramento e Alertas de Desastres Naturais (Brasil, 2024c) overlaid with the rainfall accumulated over 14 days from 28 April to 2 May.
In terms of lithology, the affected region lies within the magmatic domain of the Serra Geral Formation, with a predominance of rhyodacites at higher elevations and basalts at relatively lower elevations (Wildner et al., 2008). Furthermore, sandstones from the Botucatu and Pirambóia Formations are observed at even lower elevations than those where basalt occurs. This region contains various soil types, including Ferralsols, Alisols, Chernozems, Nitisols, and Leptosols, with the latter being more associated with the steeper areas (Streck et al., 2018) where landslides occurred.
Field activities identified different types of mass movements, mainly shallow landslides, rotational landslides (slump), and debris flows, with translational slides being the most numerous (Figure 7a and 7b). Complex mass movements (Varnes, 1978; Hungr et al., 2014) were observed, formed by the spatial coincidence of processes occurring at different times or evolving at different stages throughout the rainfall event. Slope failures that were not fully completed were also identified, displaying long transverse fissures along slopes and the formation of subsidence steps (Figure 7c).

(a) Numerous shallow translational slides (in yellow) connected to the Guaporé River (in blue); (b) Large slope failure and subsidence step (in green) in the municipality of Travesseiro, associated with rotational slide crowns (in pink); (c) Large shallow translational slide in the city of Roca Sales (in yellow); (d) Houses with fractures induced by the subsidence steps; (e) Houses destroyed by the impact of a debris flow.
Numerous damages to roads, residences, and other structures were observed in the areas visited. The main damages relate to the formation of fractures in buildings located near the crown of the mass movements, where there was soil resettlement and the formation of subsidence steps (Figure 7d), and the total or partial destruction of houses that were in the runout path of debris flows (Figure 7e).
Floods along the river-lagoon system
The development of floods is described in this section, with subsections for the main regions, a subsection for a summary view of the flood in the entire drainage system that ultimately drains to the Atlantic Ocean through the Patos Lagoon, and a subsection describing the flood early warning.
Pardo and Pardinho rivers
Intensive rainfall over the western part of the basin started on April 29 and became particularly intense during the early hours of April 30. The most affected areas were the headwaters of the Pardo and Pardinho rivers, as well as the Jacuí river region, especially downstream of the Passo Real dam. Flooding was first reported in the Pardinho river, a relatively small tributary of the Pardo river, which flows into the Jacuí from the north.
In Sinimbu, a town of 10,000 people located on the Pardinho River, where the drainage area is 600 km2, the flood occurred on April 30. Witnesses reported a first flood peak between 8 and 10 a.m., after which the river stage dropped by about one meter. However, around 1 p.m., the river began to rise again, reaching a second and higher peak at 4 p.m. The high-water marks in Sinimbu indicate that the April 30, 2024, flood exceeded the previous record, with a peak stage 2 meters higher than the previous mark set during the 1919 flood. Therefore, although there are no systematic measurements of the level or flow of the Pardinho River in Sinimbu, it is possible to assert that the flood of April 30, 2024, was the largest in over 100 years.
At the gauging station 85830000, located in the city of Santa Cruz do Sul, 30 km downstream of Sinimbu, on the same Pardinho river, the maximum river stage during the 2024 flood was measured by leveling water marks. The value that was found was 8.99 m, which is 1.59 meters above the previous record at the gauge, considering the observation time series that started in December 1978.
In Candelária, a town with a population of 30,000 inhabitants on the Pardo River, at a place where the drainage area is 1,330 km2, the flood on May 30 was also reported as the most intense ever observed. At the gauging station 85735000 located there, the maximum river stage during the 2024 flood was also measured by leveling water marks, and a value of 10.24 m was found. This mark is 2.44 meters higher than the previous maximum, considering a time series that started in 2001.
Jacuí river
The Jacuí river basin can be divided in two parts: the upper and lower Jacuí. In the upper part, several hydropower dams exist, as shown in Figure 2. Two of these dams, Passo Real and Ernestina, have flow regulation capacity, while the others are run-of-the-river dams. Among these, the most significant for the context of the April and May 2024 floods is the Passo Real dam, located where the basin's drainage area is 8,190 km2, forming a reservoir with a live storage capacity of 3,357 million m3. Downstream from Passo Real, there are three additional hydropower dams on the Jacuí River: Salto do Jacuí, Itaúba and Dona Francisca. Itaúba is located nearly halfway from Passo Real to Dona Francisca, which is the furthest downstream, situated 99 km from the Passo Real at a point where the drainage area is 13,285 km2, but with little live storage capacity.
The Dona Francisca dam can also be used to mark the end of the Upper Jacuí basin, where river slope is generally higher, and the start of the lower Jacuí basin, where the main river has a milder slope, and where it is surrounded by extensive floodplains.
The inflow and outflow hydrographs of the Passo Real, Itaúba and Dona Francisca reservoirs, from April 29 to the end of May 4, 2024, are shown in Figure 8. The graph was generated from hourly time interval data provided by the National System Operator (Operador Nacional do Sistema Elétrico, 2024).

Inflow and outflow hydrographs at the main dams located on the Jacuí river: Passo Real, Itaúba and Dona Francisca (inflow is estimated indirectly by water balance, which causes some noise in the calculated values).
Within the Upper Jacuí basin the heaviest rainfall occurred initially on April 29 and 30, mostly in the part of the river basin located downstream of Passo Real, with daily values exceeding 300 mm in at least two locations on April 30. On the other hand, in the highest part of the basin, upstream of Passo Real, rainfall on these two days was relatively low. Therefore, although the outflow of Passo Real remained below 500 m3.s-1 throughout the period from April 28 to May 1, the heavy rainfall in the incremental basin between Passo Real and Dona Francisca resulted in a rapid increase in the water level at the Dona Francisca dam, as can be seen in Figure 8.
Figure 8 shows that on April 30th the inflow and outflow at Dona Francisca increased rapidly, from below 2,000 m3.s-1 to above 12,000 m3.s-1. The highest value of Dona Francisca's outflow occurred at 3:00 pm on April 30th, and was 12,048 m3.s-1, which is more than the dam's spillway design discharge capacity of 10,600 m3.s-1 (Table 1), estimated to have a return time of 10,000 years (Dona Francisca Energética S.A., 2022). Due to the rapid rise and high discharge, the Emergency Action Plan was activated at Dona Francisca, and people residing in the area located downstream of the dam were warned about the risk of the dam breaking and flooding (Agência Nacional de Energia Elétrica, 2024).
On the same day, April 30th, the outflow of Passo Real was zero. This means that the flow of 12,048 m3.s-1 in Dona Francisca was entirely the result of precipitation in the incremental area between Passo Real (8,190 km2) and Dona Francisca (13,285 km2). Furthermore, Figure 8 shows that the outflow from Itaúba was only slightly over 2,000 m3.s-1 during this day. This suggests that almost the entire flood hydrograph that reached Dona Francisca was generated in the incremental area between Itaúba and Dona Francisca. In other words, the additional 10,000 m3.s-1 of peak flow was formed in the incremental basin between Itauba and Dona Francisca, which has an area of just 2,577 km2. This suggests that a specific maximum flow of approximately 3.9 m3.s-1.km-2 occurred in this region, which is mostly drained by the Jacuizinho river, a 2,128 km2 tributary of the Jacuí. This information is consistent with rainfall data, which show that the most intense rainfall occurred in this region between the 29th and 30th of April, with 386.2 mm in 24 hours measured in the town of Segredo (raingauge code 432026301A), and 309.4 mm in 24 hours measured at the Itaúba dam.
These data show that the decision to minimize the outflow at the Passo Real dam on April 30th was right, as additional releases in Passo Real could have further increased the inflow and outflow in Dona Francisca, which would further increase the risk of dam overtopping.
The hydrographs in Figure 8 also show that there was a second flood peak, which almost reached 12,000 m3.s-1 on May 2nd at the Dona Francisca dam. This second peak had a greater contribution from the upper part of the Jacuí River basin, since the peak flow in Passo Real and Itaúba reached about 2,000 and 5,000 m3.s-1, respectively.
The Dona Francisca Dam marks the transition between the upper and lower parts of the Jacuí River. Downstream of the dam, the Jacuí River's slope decreases, and extensive plains stretch out alongside it. In the 244 km stretch between the Dona Francisca dam and the city of Rio Pardo, where the confluence of the Jauí and Pardo rivers is located, the Jacuí receives inflow from several rivers that flow from west to east. The Soturno and Vacacaí-Mirim, draining about 1,000 km2 each, join the Jacuí 37 and 110 km downstream of the dam, respectively. The Vacacaí river, with a drainage area of 9,995 km2, joins the Jacui about 130 km downstream of the Dona Francisca dam.
The Vacacaí River has a relatively low slope and drains the Central Depression, an extensive floodplain area. Despite their significant smaller size, the Vacacaí-Mirim and Soturno rivers drain the mountainous area near Santa Maria city, where steep slopes and extreme rainfall lead to disastrous floods that were not measured at river gauges.
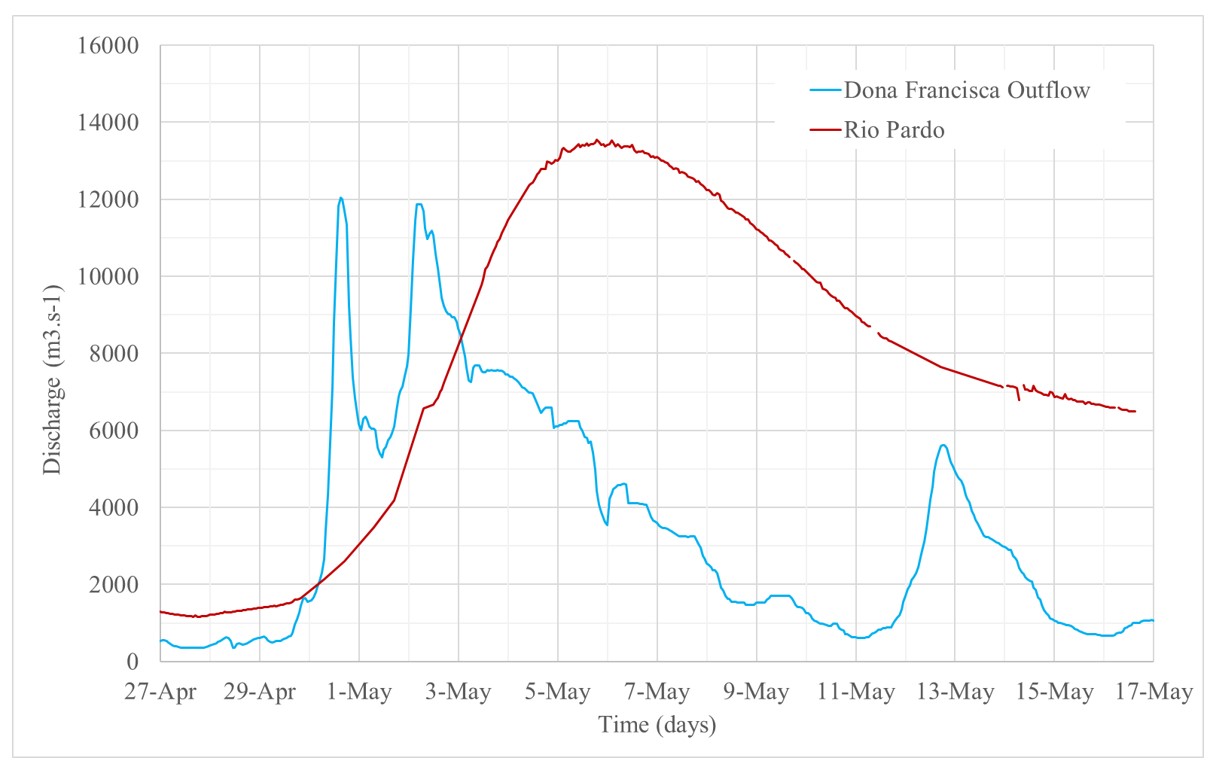
Despite the inflow of those rivers, the low slope and extensive floodplain areas along the Jacuí itself and its tributaries in the Central Depression acted as natural storage areas, delaying and partly attenuating flood waves. Figure 9 shows the discharge hydrographs of the Dona Francisca outflow, and at the gauge located on the Jacuí river at the city of Rio Pardo, just downstream of the confluence of the Pardo and Jacuí rivers. The overall hydrograph volume increased noticeably, due to the inflow of the tributaries, while the peak flow only increased slightly. While at the Dona Francisca dam, two outflow peaks were observed on April 30th and May 2th, at the gauge in Rio Pardo the flood occurred as a single, and much slower peak, with its maximum occurring at May 5th.

Observed outflow of the Dona Francisca dam (blue line) and discharge at the Jacuí river gauge located in Rio Pardo (red line).
A preliminary assessment suggests that the April-May 2024 flood, affecting the entire reach of the Jacuí River from the Passo Real Dam down to Porto Alegre, is the largest flood ever recorded in a historical series beginning in the mid-20th century. This series includes the significant flood that occurred in May 1941.
Taquari river
The Taquari river is the most important single tributary to the Jacuí river. Furthermore, floods of the Taquari affected several cities located along its valley, from the town of Muçum downstream to its mouth at the Jacuí (Figure 2). Upstream of Muçum the Taquari is called Antas river, and runs through a deeply incised valley, with no floodplains.
There are 7 hydropower dams on the Antas river. The three largest, and located most downstream, are called 14 de Julho, Monte Claro and Castro Alves, and are respectively 33, 36, and 48 meters high, with installed capacity of 100, 130 and 130 MW. The Castro Alves dam is the most upstream of those 3 dams, at a point where the drainage area is 7,742 km2. At this point, inflow to the dam is regularly estimated in hourly time steps, based on water stage change and estimated outflow. The maximum streamflow during the April-May 2024 flood occurred on May 1, at 17:00, reaching 9,353 m3.s-1 (Figure 10). The peak flow specific discharge reached 1.21 m3.s-1.km-2. The peak flow of 9,353 m3.s-1 exceeded the value of the estimated ten-thousand-years flood (9,011 m3.s-1) (Cia Energética Rio das Antas, 2024). However, although it was an extremely high flow, the peak of the May 2024 flood is only the third largest in the historical record at this location. The largest flow ever recorded occurred on September 4, 2023, reaching 9,783 m3.s-1. The second largest flow is 9,412 m3.s-1 and occurred on November 18 2023.

Discharge hydrographs along the Taquari-Antas river during the April-May 2024 flood (red line: Castro Alves Dam on the Antas river; black line: Muçum gauge on the Taquari river; blue line: gauge located between Lajeado and Estrela, on the Taquari river).
About 76 km downstream of the Castro Alves dam, the April-May 2024 flood caused the partial rupture of the 14 de Julho dam, at a point where the drainage area is 12,758 km2. Due to landslides that affected power supply and road access to the dam, the floodgates of one of the dam's spillways were not opened during the flood. Thus, the flow, prevented from passing through the gate-controlled spillway, passed entirely over the free overflow spillway, exceeding its capacity. As a result, at some point before 1:40 p.m. on May 2, a partial rupture damaged the 14 de Julho dam (Exame, 2024). Evacuation warnings for people living downstream were issued by the government, but the effect of the partial rupture on the maximum flows and levels downstream was relatively small when compared to the magnitude of the flood that was already occurring (Lima & Paiva, 2024).
At Santa Teresa gauging station (code 86472600), approximately 34 km downstream of the 14 de Julho dam, only river stage data are available. The data shows that river stage increased from 3,45 m at April 29 02:00 p.m. to 22,33 m at May 02 08:15 a.m., which is about 19 m in less than 72 hours. The stage hydrograph in Santa Teresa shows four peaks in the period from April 30 to May 2. The first and lower peak of 12.89 m occurred at 20:15 on April 30. After that peak, the river stage decreased for about 8 hours, but started to rise again during the morning of May 1th, reaching a second peak of 21.98 m at 19:15 on the same day. The stage receded slightly less than 1 m up to midnight, and then started to rise again reaching the third and highest peak of 22.33 m at 08:15 a.m. on May 2. After a recession of about 7 hours a fourth peak of 22.32 m occurred at 4:30 p.m. on the same day (May 2). This fourth flood peak may have been partly caused by the failure of the 14 de Julho dam, since it occurred about three hours after the reported rupture, which is consistent with the kinematic wave celerity in this river reach. The apparent effect of the dam failure on the stage hydrograph at Santa Teresa is an increase of 77 cm, in two hours, from 2:30 p.m. to 4:30 p.m.. However, this fourth peak, that may have been partially caused by the dam failure, was not higher than the main peak, that occurred at 8:15 a.m..
In Muçum, a town located 26 km downstream of Santa Teresa, on the right bank of the Taquari river, the gauge data (code 86510000) show that the water level increased from 3.46 m on April 29 4:00 p.m. to 25.57 m on May 2 07:30 a.m., an increase of more than 21 meters in 62 hours. In parts of the city located more upstream, the maximum stage during the 2024 flood was slightly lower than during the September 2023 flood, while in parts of the city located more downstream, closer to the confluence of the Taquari river with the Guaporé river, the inverse occurred: the May 2024 flood exceeded the September 2024 flood.
The peak discharge of the Taquari river in Muçum is estimated at 13,241 m3.s-1, based on a rating curve that was defined with field measurements up to 8,380 m3.s-1. The drainage area in Muçum is 16,000 km2, therefore the specific peak discharge is estimated at 0.83 m3.s-1.km-2 at this place. The discharge hydrograph in Muçum is also shown in Figure 10.
In Encantado, a town located 12 km further downstream of Muçum, along the Taquari river, the maximum stage during the May 2024 flood was half a meter higher than during the September 2023 flood, making the May 2024 the highest flood ever observed.
The fact that the May 2024 flood was clearly higher than the September 2023 flood in Encantado, while less than 20 km upstream, in the upstream parts of Muçum, the inverse occurred (May 2024 lower than September 2023) suggests that a massive inflow of the tributaries occurred between those two points. The two main tributaries along this reach are the Guaporé (2,487 km2) and the Jacaré (538 km2) rivers, and both were not gauged during the last floods, however the analysis of rainfall shows that the catchment of the Jacaré and the lower part of the Guaporé river basin was the region with the highest three-day accumulated precipitation (30 April to 02 May) of the whole State, with accumulated values above 600 mm at two rain gauges.
The most populated region along the Taquari River valley is located approximately 50 km downstream from the city of Encantado. At this point a main highway bridge over the river connects the cities of Estrela and Lajeado, with two other cities a few kilometers upstream (Arroio do Meio) and downstream (Cruzeiro do Sul). Automatic and manual readings at a gauging station located between Estrela and Lajeado measured water level rising from 13.00 m, at 13:30 on April 29, to 33.66 m at 13:30 on May 2. This means that the water level rose 20,66 meters in 72 hours.
The stage hydrograph at this point actually shows two peaks during the period from April 29 to May 2. A first peak of 27.07 m occurred at 02:15 May 1th, and was followed by eight hours of a slight recession, decreasing the stage 66 cm. At 10:30 on the same day the water level started to increase again, reaching 33.66 m at 13:30 on May 2, as mentioned before. The discharge hydrograph of the Taquari river at the Lajeado/Estrela gauge are also shown in Figure 10. Two other lower peaks occurred a few days after the main peak of May 2, on May 5 and May 13 due to further rainfall on the watershed.
At this gauge the previous record setting floods reached 29.53 m in 2023 and 28.87 m in 1941 (Moraes et al., 2024). This means that the maximum level reached during the May 2024 flood in this location exceeded the previous record by more than 4 meters. Systematic monitoring and flood mark data compiled by Moraes et al. (2024) allow us to conclude that, in Lajeado, the Taquari River flood in May 2024 was the largest flood in at least the last 150 years.
Water levels that much higher than during previous floods resulted not only in the flooding of areas close to the river, but also in high-speed flow across the plain. This high velocity in the inundated area made this flood very different from the previous Taquari river floods. Due to the high velocity, and the transport of woody debris, the damaging power of the water increased manyfold resulting in the destruction of hundreds of houses, as will be described in chapter 4.
The maximum discharge of the river Taquari at the Estrela gauging station was estimated at 23,472 m3.s-1 (Figure 10). Considering that the drainage area at the site is 22,472 km2, the maximum specific flow is 1.04 m3.s-1.km-2. However, the uncertainty of this estimate is high, due to the extrapolation of the rating curve, since the peak water level of 33.66 m was well beyond the maximum level at which actual discharge measurements have been taken (about 25 m).
The sharp increase in peak discharge of the river Taquari between Muçum (13,241 m3.s-1) and Estrela (23,472 m3.s-1) is somewhat uncertain, due to inaccuracies of the two rating curves. Nevertheless, this increase may be explained by the fact that the most intense rainfall observed in the whole state Rio Grande do Sul occurred over a region to the North and East of the Taquari, on the catchments of the right bank tributaries of the Taquari between Muçum and Estrela, notably the Forqueta, Jacaré and Guaporé rivers.
Unfortunately, these three rivers were almost not gauged during the whole flood, except for a single point on the Forqueta river, at a small hydropower dam called Rastro de Auto. At this place, where the drainage area is 564 km2, the hydrograph actually shows four flow peaks. The first occurred during the afternoon of 30 April, and reached 700 m3.s-1. The second occurred around noon on May 1th, and exceeded 1,900 m3.s-1. The third occurred at 05 a.m. on May 2, and reached the maximum of 2,626 m3.s-1. After a few days of recession, a further peak of 735 m3.s-1 ocurred on the early hours of May 5.
The peak of 2,626 m3.s-1 at Rastro de Auto dam exceeded the design flow of the dam´s spillway (2,561 m3.s-1), which was defined considering the 1,000-year return period maximum discharge. At the Salto Forqueta dam, located just 8 km downstream of the Rastro de Auto dam, the flood resulted in overtopping, and the right abutment of the dam was completely eroded, forming a breach.
The specific maximum discharge at the Rastro de Auto dam was 4.66 m3.s-1.km-2, which is the maximum specific discharge that was measured during the flood in any place within the whole affected area (Figure 11).

Outflow hydrograph at the Rastro de Auto dam on the Forqueta river during the April-May 2024 flood.
Along the Forqueta river the 2024 flood undoubtedly set a record, overcoming the 2010 flood, that had already overcome the 1941 flood (Oliveira, 2023). In Pouso Novo, for example, the maximum water level in 2024 was 1.16 meters higher than in 2010, while in Marques de Souza, downstream, the maximum water level in 2024 was 1.10 meters higher than in 2010, according to residents.
Downstream of Estrela and Lajeado, the next gauging station is located at Bom Retiro do Sul, just downstream of a dam with a navigation lock. At this gauge, which has no validated rating curve, the water stage raised from 5.50 m on April 29 17:00 to 21,74 m on May 2 19:00. This increase of about 16 meters in 74 hours is slightly less than the increase observed in Muçum and Estrela/Lajeado. A comparison of flood marks in the town reveals that the 2024 flood was 1.71 m above the previous record, that occurred in September 2023. In the district of Mariante, in the city of Venâncio Aires, the flood of May 2024 was 2.86 m higher than the flood of September 2023.
The last gauging station on the Taquari river is located 30 km upstream of the confluence with the Jacuí river, at a town called Taquari. At this point the automatic gauge failed after having registered a 10 m rise in the water level. According to residents and flood marks, the 2024 flood peak was 1.91 m higher than the 1941 flood, the previous record flood in this final reach of the Taquari river. This information is still being verified by levelling of the flood marks with the local river gauge.
Caí river
The Caí river has a catchment of nearly 5000 km2, and its confluence with the Jacuí river is very close to Porto Alegre. During the days that preceded the flood, the Caí river basin received less rainfall than the Taquari, but the observed precipitation values were still very high, with 400 to 450 mm occurring in five days, from 28 April to 02 May.
All automatic river gauges on the Caí river failed to measure the whole flood. At the gauge located most downstream, in the city of Montenegro, the Caí river stage increased from 1.3 m on 27 April to about 3.5 meters on 29 April. Then, after very intense rainfall on 30 April, on steep parts of the basin, reaching more than 190 mm in 24 hours at two rain gauges, the river stage increased 5.5 meters more, until the automatic river gauge failed, on May 1th, at 7:30 in the morning. Flood marks have been collected and leveled, revealing that the maximum stage reached 10,02 meters in Montenegro, which is a new flood record, nearly 80 cm higher than the May 1941 flood stage (Serviço Geológico do Brasil, 2024).
In other locations along the Caí River, the May 2024 flood also reached the highest levels ever observed, surpassing historical floods in the region such as the May 1941 flood and the November 2023 flood (Serviço Geológico do Brasil, 2024).
Sinos river
The drainage area of the Sinos River, with 3,690 km2, is even smaller than the drainage area of the Caí River. On the other hand, the confluence of the Sinos River with the Jacui River is even closer to Porto Alegre. This is why this river is important for the flooding of the Guaíba River in Porto Alegre. In addition, the Sinos River valley is a densely populated region. A large part of the RMPA is located in the Sinos River valley, including urban areas of Canoas, Esteio, São Leopoldo and Novo Hamburgo.
During the days that preceded the flood, the Sinos river basin received less rainfall than the basins of the larger tributaries of the Jacuí. Nevertheless, the observed precipitation values over the basin were in the range of 300 to 400 mm in five days, from 28 April to 02 May, which is still a very high amount.
Floods along the Sinos river are also delayed and attenuated by its extensive floodplains, despite its relatively smaller basin area. For instance, in São Leopoldo the flood peak occurred after 6 days from the start of the event, in May 4, followed by a second peak in May 15 and a slow recession.
Along the Sinos river, at least in its downstream part, from Campo Bom to its confluence with the Jacuí river, the April-May 2024 flood also marks the highest flood ever observed.
Guaíba river
In previous sections we describe the floods that occurred along the Jacuí river and its main tributaries, that join to form the Guaíba river, which is wide and relatively shallow, being called a lake by some authors. Here we describe the flood as it was observed at the Guaíba river.
In the Guaíba river there is no gauging station with a valid rating curve, therefore no discharge hydrographs are available. Nevertheless, the peak flow of the Guaíba river can be guessed by considering the contributions of the different rivers that join to form the Guaíba. The main two contributors to the unprecedent levels of the Guaiba river were the inflows from the Taquari River and from the Jacuí River. Based on discharge data estimated at Lajeado/Estrela, the maximum flow of the Taquari was above 20,000 m3.s-1, and considering data from gauging station in Rio Pardo, the Jacuí had a peak discharge above 10,000 m3.s-1. Considering that the Guaíba river received the sum of those peak discharges, as well as the inflow of the other minor rivers (Caí, Sinos and Gravataí), it is reasonable to expect the peak discharge of the Guaíba river to be close to 30,000 m3.s-1. Single measurements taken just one day after the flood peak in Porto Alegre, using an acoustic doppler profiler, suggested that the flow peak was even higher than 30,000 m3.s-1, although the exact value is not known because the flow over the islands of the delta that exists between the Jacuí and Guaíba rivers (Figure 12) and over the floodplain could not be measured appropriately (Silva et al., 2024).

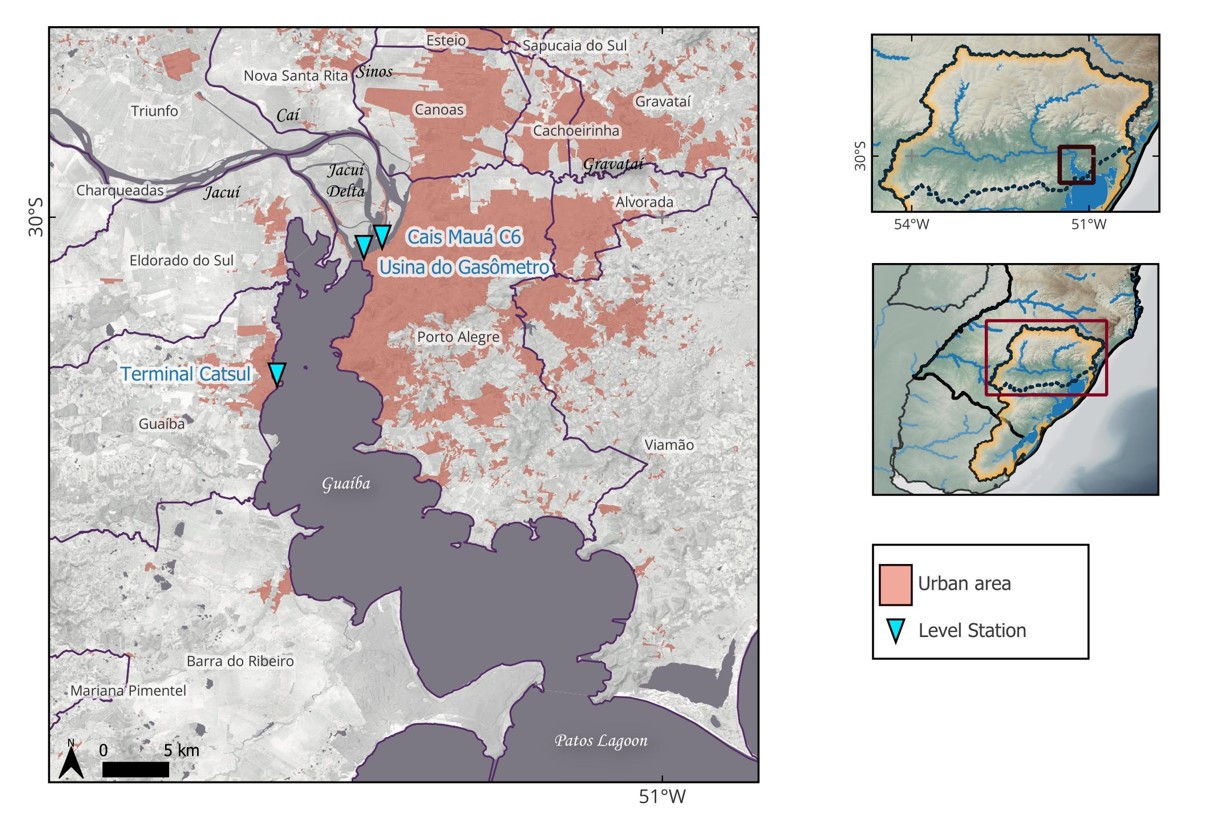
The Jacuí and Guaiba rivers in the RMPA, with gauges Cais Mauá C6 and Usina do Gasômetro, in downtown Porto Alegre, and Terminal Catsul in the municipality Guaíba, on the right margin (river flows from north to south).
River stage was measured during the April-May 2024 flood at three gauging stations in the transition region between the Jacuí and Guaíba rivers, as shown in Figure 12. The “Terminal Catsul” gauge located on the right margin, at the city of Guaíba, operated during the whole flood. The gauging station “Cais Mauá C6,” located on the left bank in downtown Porto Alegre, operated until it was damaged by flooding at 11:15 PM on May 2nd. In response to the widespread flooding at the “Cais Mauá C6” site, that prevented the reestablishment of the damaged gauge, a new gauge, called “Gasometro,” was urgently installed 2.5 km downstream on the same left bank. Measurements were resumed at the “Gasometro” gauge in the afternoon of May 3rd.
Figure 13 shows the stage hydrographs at the three gauging stations shown in Figure 12. It is worth noting that the water level of those three gauges cannot be compared directly, because each one has an independent reference level. The stage hydrograph at the “Cais Mauá C6” gauge started to rise strongly on 30 April, from about 110 cm, and continued to rise to 369 cm on 2 May afternoon, when the gauge was damaged. During the same period, the “Terminal Catsul” gauge increased from about the same value (110 cm) to 260 cm. The “Gasometro” gauge resumed the measuring in Porto Alegre at the evening of 3 May, starting at 458 cm at 3:00 p.m., and increasing to a peak of 535 cm at 5:30 a.m. on 5 May.

Stage hydrographs at three gauges on the Guaíba river during the April-May 2024 flood (stage is measured based on three different arbitrary references).
It is interesting to note in Figure 13 that before the start of the flood, between April 27th and 29th, the stage at Catsul and Cais Mauá C6 was approximately the same. From April 30th, however, the stage at Cais Mauá C6 began to rise earlier and faster than at Catsul. On the night of May 2, before the monitoring failure at Cais Mauá C6 occurred, the difference between the two measurements exceeded 1 meter. These data shows clearly that the flood arrives first in Porto Alegre (Cais Mauá C6), and then in the city of Guaíba (Catsul), as expected because Porto Alegre is located more upstream.
Leveling of high-water marks in Porto Alegre, made after the flood receded, revealed that at the place of the “Cais Mauá C6” gauge the water level reached 537 cm, measured in relation to the historical reference level of the “Praça da Harmonia” gauge or 528 cm if considering the local reference of the “Cais Mauá C6” gauge (Marcuzzo et al., 2024; Germano et al., 2024). The same authors also compared existing flood marks next to the main gate of the wall that gives access to the port area and found that the 2024 flood peak was 43 to 45 cm higher than the 1941 flood peak, at least in this part of the city. A similar difference between the 1941 and 2024 flood marks (2024 being 41 cm higher) was reported at the Mercado Publico historical building, which is about 300 m upstream of the main gate of the port area (GZH, 2024a).
This comparison of the 2024 flood with the marks of the 1941 flood, and with other floods that were observed systematically or by historical marks (Fundação Estadual de Planejamento Metropolitano e Regional, 2018; Rio Grande do Sul, 1968), reveals that the May 2024 flood in Porto Alegre was the highest observed flood in the last 125 years.
In addition to reaching a higher level than the 1941 flood in Porto Alegre, the 2024 Guaíba river flood was significantly faster, as in the 5 days between 30 April and 4 May 2024 the level of the Guaíba river rose more than 4 m, while in 1941 it took 13 days to rise 3.5 m. Likewise, it is important to note that it took only 48 hours, from 30 April to 2 May for the Guaíba River to rise from 1.36 to 3.00 meters, which is the level at which the port region begins to flood.
A further feature of the 2024 flood in Porto Alegre was its long duration. After the first peak, that occurred on 5 May, the stage of the Guaíba receded about 80 cm in Porto Alegre, as shown by the red line in Figure 13 (Gasometro gauge), and about 50 cm at the Catsul Guaíba gauge (black line). However, after nearly 150 mm of more rainfall fell in average over the river basin from 10 to 12 May (Collischonn et al., 2024b), a second flood wave occurred in Porto Alegre, with the peak occurring from 14 to 15 May. This second peak of the Guaíba river occurred about 10 days after the first, and its maximum stage was just a few centimeters lower than the initial peak. The total flood duration above the inundation levels in Porto Alegre was close to 30 days.
Wind forcing, known to be relevant as a driving force of oscillations of the Guaíba river stage (Possa et al., 2022b; Silveira, 2020; Lopes et al., 2018), played a minor role during the flood peak. Winds from the southern quadrant, blowing intensely for several hours over the Patos Lagoon, can have the effect of increasing the water level of the northern part of the Guaíba River, in Porto Alegre. However, during most of the more critical days, the wind over Patos Lagoon was from the East or Northeast. Southern winds occurred on 9 May, increasing the river stage about 10 cm, as can be seen in Figure 13. A few days later, on 13 May, relatively strong winds from the South may have contributed to the rapid initial rise of the second flood wave. On 15 May, however, when the secondary peak occurred, wind over the Patos Lagoon was already blowing from the West, with little effect on the maximum water level of this secondary peak.
The most intense effect of South wind on the Guaíba river stage during the period shown in Figure 13 occurred on 24 May, when water level increased by about half a meter both at the Gasometro and Catsul gauges. This suggests that while the south wind episodes had negligible impact on the Guaíba River’s peak elevations, they may have contributed to the prolonged duration of the flood.
Patos Lagoon
All the rivers mentioned in the previous sections ultimately converge to the Guaíba River, which transports water to the Patos Lagoon—the largest choked lagoon in South America (Kjerfve & Magill, 1986), spanning approximately 10,000 km2. However, the Guaíba is not the only contributor to the Patos Lagoon, as other rivers, such as the Camaquã River, also discharge directly into the lagoon.
In addition, the Patos Lagoon is connected to the Mirim Lagoon through the São Gonçalo Channel, in a system that receives the flow of several rivers, including some located in Uruguayan territory. The drainage system of the São Gonçalo Channel, including the Mirim and other rivers, and the transnational character of the hydrographic basin are described further in other publications (Possa et al., 2022a; Gonçalves et al., 2023; Santos et al., 2024; Lopes et al., 2018; Munar et al., 2018).
During the April-May 2024 flood, the peak discharge at the upstream edge of the Guaíba river, in Porto Alegre, was estimated as more than 30,000 m3.s-1, based on measurements made on 6 May, one day after the flood peak (Silva et al., 2024). The flow from the Guaíba to the Patos Lagoon, however, is not known, but it remained high until early June, as can be drawn from Figure 13.
The second most important tributary to the Patos Lagoon is the Camaquã river, whose 16.600 km2 basin received about 400 mm of rainfall from 27 April to 8 May. As a response, its discharge increased from about 150 m3.s-1 on 27 April to more than 4200 m3.s-1 on 2 May, and remained above 3500 m3.s-1 until 6 May.
Another large inflow to the Patos Lagoon occurs near the city of Pelotas, where the São Gonçalo Channel brings water from a basin of 62,250 km2, located partly in Brazil and partly in Uruguay. This basin received rainfall of almost 400 mm between April 27 and May 10, and most of this rainfall occurred after May 5.
The average flow rate in the São Gonçalo Channel is around 700 m3.s-1 (Hartmann & Harkot, 1990). During the May 2024 flood, continuous discharge monitoring using an acoustic Doppler profiler (Gonçalves et al., 2023) measured a rise from 1,145 m3.s-1 on May 1st to 2,513 m3.s-1 on May 26th.
This information shows that the main source of flow to Patos Lagoon was certainly the contribution from Guaíba River. However, the long duration of the flood in the Camaquã River and the long-lasting contribution through the São Gonçalo Channel also played a role in the increase in the water level in Patos Lagoon, especially in the city of Pelotas (Figure 14).

The water level in Patos Lagoon and São Gonçalo Channel during the flood in April and May was monitored at six points located as shown in Figure 14. Unfortunately, there were several observation failures at most of these monitoring points. Again, it is important to recall that the water level of those gauges cannot be compared directly, because some of them have differing reference levels.
Despite some gaps in the observation at several gauges, it is possible to observe in Figure 15 that the level of Patos Lagoon rose more slowly in the first week of May than the level in Guaíba, as shown in Figure 13. On May 1, the level at all points in Patos Lagoon and in Guaíba was in a range of approximately 1.0 to 1.5 meters. From that day onwards, the Guaíba River rose almost 3 meters in just 4 days. Meanwhile, water level in Patos Lagoon took between 10 and 14 days to rise about 1 m, at the different measurement points. The peak water level in the southern region of the lagoon, at the FURG/CCMAR measurement point in Rio Grande, and at Laranjal beach, near Pelotas, occurred only on May 16, eleven days after the observed peak of the Guaíba river in Porto Alegre. At the Laranjal monitoring point, the level on that day was approximately 1.8 meters above the level observed at the beginning of the month.

Measured stage at gauging stations on Patos Lagoon (Arambaré, São Lourenço, Rio Grande (Regatas), Rio Grande (FURG/CCMAR)), São Gonçalo Channel (Pelotas Porto) and Guaíba river (Catsul).
The monitoring points at Patos Lagoon show an average increase rate of around 15 cm per day during the first ten days of May. After that, the stage continued to rise, although at a lower rate of 5 cm per day from 10 May to 16 May.
The wind also had an influence on Patos Lagoon level. It can be seen by comparing Figure 15 with Figure 13 that the same wind events that resulted in a rise in the water level of the Guaíba River, as described in the previous section, resulted in a reduction in the level in the Patos Lagoon southern portion. The wind effect throughout Patos Lagoon is explained by Fernandes et al. (2002).
For instance, southern winds on 9 May, decreased the stage by about 35 cm at the Laranjal gauge, as can be seen in Figure 15. South winds on 13 May reduced stage at the FURG/CCMAR, São Lourenço and Pelotas Porto gauges by 25 to 40 cm. On 24 May, when the stage of the Guaíba river increased by about half a meter at the CATSUL gauge, a stage decline of the same order was observed over several gauges in the Southern part of Patos Lagoon.
Despite these fluctuations caused by the wind, it is possible to observe in Figure 15 that the water level began to show a clear downward trend from approximately May 19th onwards, at least at the FURG/CCMAR, Laranjal and São Lourenço gauges. The declining trend happened with a rate of 3 to 4 cm per day.
While at other points the level began to decline, at the Pelotas Porto gauge the water level remained high until the end of May. This different behavior occurs because the Pelotas Porto gauge is not located at the Patos Lagoon itself, but rather at the São Gonçalo Channel. This canal maintained relatively high flows from the Mirim Lagoon to the Patos Lagoon throughout the month of May due to rainfall over the border region between Uruguay and Brazil.
Similarly to other locations in the state, the 1941 flood remained the most extreme flood in Patos Lagoon until 2024. Although systematic observations over the Patos Lagoon are not available, comparison of flood marks in Pelotas revealed that the May 2024 flood was about 25 cm higher than the May 1941 flood. In Rio Grande, near the mouth of the entire drainage system, the maximum levels of 2024 and 1941 appear to be approximately the same.
Summary of river flooding
The April-May 2024 record breaking rainfall over a large portion of the State Rio Grande do Sul resulted in record breaking floods in several rivers and in the Patos Lagoon. As a result of the intense and long-lasting rainfall, unprecedent floods occurred in rivers spanning drainage areas from less than 1000 km2 to 84,000 km2 and to the Patos Lagoon, that drains an area of 182,000 km2 at its mouth at the Atlantic Ocean. The flood had an exceptionally long duration. Flood peaks occurred on April 30th in the smaller rivers to the west of the basin, like the Pardo and Jacuizinho rivers, and on May 1st in the Antas River, located to the east. The Taquari River peaked on May 2 and 3, the Sinos river had its peak on May 4 and the Jacuí and Guaíba rivers peaked at May 5. Maximum water level of the Patos Lagoon occurred at May 16. In the Guaíba river, at Porto Alegre, water levels remained high for about 30 days, until early June.
At least four hydropower dams experienced peak discharges above their design capacity. One dam suffered a partial rupture, while another experienced total erosion of its abutment. Flood amplitude exceeded 20 m in rivers at the mountain valleys, while in the Guaíba and Patos Lagoon, they were only a few meters. Along the Taquari river valley the 2024 flood reached maximum water heights more than 4 meters above the largest flood in the previous record, which spans more than 100 years in the past. In Porto Alegre the 2024 flood peak was 43 to 45 cm higher than the previous highest mark, that occurred in 1941.
The 2024 flood also differs from previous ones in the behavior of the water in the flooded plains. Unlike previous, smaller floods, in which the water in the plain had a relatively static behavior, with low speed, in the April-May 2024 flood the speed of the water in the plain reached very high values, contributing to increased impacts, as reported in the next sections.
Flood early warnings
The flood early warning in Brazil is relatively fragmented. At the national government level there are two institutions that issue forecasts and warnings publicly. One is CEMADEN (Centro Nacional de Monitoramento e Alertas de Desastres Naturais) and the other is the Geological Survey of Brazil (SGB – Serviço Geológico do Brasil). At the regional scale the Rio Grande do Sul State also issues bulletins from the government Situation Room and warnings from the Civil Defense. Local actors such as hydropower dam operators also produced their own forecasts (Fan et al., 2016), mainly aiming at dam safety, that are usually not publicly available.
Prior to the occurrence of the main floodings, before April 30th, CEMADEN issued warnings of hydrological risk for the southern half of the State. The warning was orange (high) level, on a scale that goes up to red (very high). The warnings typically did not contain detailed information regarding river levels or discharges (Brasil, 2024a).
The Situation Room of the Rio Grande do Sul state operates a hydrological forecasting model that covers all the state rivers with drainage areas above 1000km2 (Nectoux et al., 2019; Fan et al., 2019). Forecasts are made daily, using observed and forecast precipitation data, and are used to issue bulletins that warn about increasing or decreasing trends of discharge. These bulletins do not provide hydrographs or forecasts of the stage of rivers at reference locations. The modelling results are normally used to draw regions of major or minor risk on a map. In the main daily bulletin issued on April 29th the situation room suggested orange level risk (alert) for extreme rainfalls and rivers conditions on elevations.
The Civil Defense warnings from April 29th, also emitted from the state government, suggested risk of flooding in places along the Jacuí river. On April 30th the Civil Defense warnings started to include the occurrence of flooding along the Taquari and Jacui main rivers. The warnings consisted of hand-drawn estimated risk areas and textual information. The population that was registered on a mobile phone service within the hand-drawn risk areas received SMS short messages concerning the existence of risk.
The SGB operates a system named SACE (Sistema de Alerta de Eventos Criticos - Flood Warning System) which is a flood forecasting system that uses data-based forecasting models, and require observed stages at gauges upstream as the main input (Serviço Geológico do Brasil, 2024). SACE covers three rivers in Rio Grande do Sul (Uruguay, Taquari and Caí), and it is manually operated by hydrologists from the SGB. Forecasts are issued by bulletins with predicted river stage at selected reference gauges. In the Taquari river the system issues forecasts 4 hours in advance for reference gauges located more upstream (Muçum and Encantado) and 6 hours in advance for Lajeado and Estrela, which are located downstream. In the Caí river SACE issues forecasts 10 hours in advance for São Sebastião do Caí and Montentegro.
At both Caí and Taquari rivers SACE forecasts were reasonable accurate during the flood, and correctly informed the occurrence of an event above the highest (red) warning levels. However, the forecast range was relatively short, restraining the response actions. In addition, during the 24 hours that preceded the flood peak, the SACE system failed to provide forecasts because gauges located upstream were damaged by the flood.
While SACE provided quantitative forecasts for the Caí and Taquari rivers, none of the official institutions related to flood forecasting provides detailed operational forecast for the Guaiba and Sinos rivers, along which the most densely populated cities of the State are located. For cities located on the shores of the Patos Lagoon, like Pelotas and Rio Grande, with 330,000 and 200,000 inhabitants, respectively, there is also no operational flood forecasting service yet.
On May 1st, when the occurrence of an extraordinary flood was already being observed in several rivers of the Guaíba basin, it began to become clear that the Guaíba River itself would also experience a historic flood. From that day on, a group of researchers from the Instituto de Pesquisas Hidráulicas (IPH) of the Universidade Federal do Rio Grande do Sul (UFRGS) began to generate flow forecasts with a chain of hydrologic (MGB) and hydrodynamic (HEC-RAS) models using as input observed and forecasted rainfall along with observed streamflow at some reference gauges. The forecasts issued by the IPH team mainly consisted in an ensemble forecast of the Guaiba river at the Port area in Porto Alegre. The ensemble forecast included four members, one reference considering no rainfall and no wind in the forecasting range and the others considering precipitation and wind forecasts of the ECMWF and GFS weather forecasting models.
The IPH forecasts for the Guaíba river were produced from May 1st and were made available for the broad public through social media and traditional media (newspaper, radio and television) from May 2nd (i.e. GZH, 2024c, 2024e, 2024f, 2024g). From 4 May on the forecasts have been also published at the IPH website (Universidade Federal do Rio Grande do Sul, 2024). Two of those forecasts are shown on Figure 16 as an example. Figure 16a is the forecast that was prepared and published on May 2nd, when the Guaíba river stage was still below 3,00 meters at Porto Alegre. This forecast was prepared as an ensemble of three input combinations. The grey dashed line is a forecast based on observed rainfall up to May 2nd, and considering that no additional rainfall in the following hours. The red dashed line and yellow dashed lines are stage forecasts based on precipitation and wind forecasts of the ECMWF and GFS models respectively. In this forecast of May 2nd a flood peak was predicted to occur in the following two to three days, with maximum stage in the range of 4,70 to 5,50 meters, depending on the input that was used. This forecast was fairly accurate, because it predicted that the 2024 flood would possibly exceed the previous highest flood in Porto Alegre (1941), and this really happened.

Examples of forecasts for the Guaiba river flood issued on key dates by IPH-UFRGS: (a) forecast issued on 2 May; (b) forecast issued on 12 May (blue line: stage observed at the Cais Mauá C6 gauge; red line: observed stage at the Gasometro gauge; black dashed line: forecast based on the no-rain and no-wind scenario; yellow dashed line: stage forecast based on GFS precipitation and wind forecast; red dashed line: stage forecast based on ECMWF precipitation and wind forecast; green dashed line: stage forecast based on ECMWF precipitation forecast and no-wind.
Figure 16b shows the forecast published on 12 May, about one week after the flood peak, when the Guaíba river stage in Porto Alegre had already dropped about 80 cm since the first peak, that occurred in 5 May. This forecast is interesting because on 12 May a new rain event was occurring over the basin, and people were worried about how much worse the situation in Porto Alegre could get. In this forecast it became clear that a second flood peak would occur in Porto Alegre in the following days, and that this second peak could be nearly as high as the first, or even higher. In fact, the second peak occurred at the evening of 14 May, and it was just 10 cm below the first peak.
Forecasts like those two samples were issued continuously from 2 May to early July. Other aspects of the flood, such as the slow stage reduction and stage variations due to the wind were adequately predicted throughout this period.
On May 3, while the Guaíba River in Porto Alegre was exceeding the 4 m mark, flood forecasts prepared by IPH indicated that there was a risk that Porto Alegre's flood control system could be overwhelmed if the river's maximum level approached 6 m. On the same day, evidence began to emerge of failures in the flood protection system (see further details in the “Failure of flood protection system”), suggesting that protected neighborhoods could be flooded even if the river did not reach level 6 m. Thus, given the real possibility of flooding, researchers at IPH produced and published maps of the areas that could potentially be flooded, including a map of possible depths in the flooded areas, suggesting that the population should prepare for evacuation (Possantti, 2024; GZH, 2024b).
In the south of the State researchers from the Federal University of Pelotas (UFPel) provided meteorological and hydrological forecasts for the Piratini, Jaguarão and Camaquã rivers, and mapped areas prone to flooding. In the southernmost part of Patos Lagoon, the Federal University of Rio Grande (FURG) used level data and a combination of a calibrated and validated hydrodynamic numerical model and an artificial intelligence developed flood model to predict the water level variation inside the lagoon and flooded area.
To summarize what has been done in terms of flood early warning, we understand that, from a broad perspective, the hydrological forecast issued by national and regional services such as CEMADEN, Situation Room and Civil Defense were right when suggesting the occurrence of extreme events. However, those forecasts and warnings do not include hydrographs, stage forecasts at key gauges, or maps of flood prone areas, therefore its utility for decision makers and for the population was limited. Furthermore, the severity of the unprecedent hydrological event was not captured by these forecasting and warning centers. The SGB-SACE forecasts for the Cai and Taquari rivers, on the other hand, were more detailed, bringing information about predicted stage and time of occurrence, which could lead to better decision making for civil defense agents and the affected population. However, unfortunately the loss of gauging stations prevented further issues of SACE forecasts about 24 hours before the peak of the flood occurred. In the absence of official and operational flood forecasting systems for the Guaíba river and the Patos Lagoon, non-operational forecasts were issued by IPH/UFRGS researchers for Porto Alegre, and by UFPel and FURG for the southern end of the Patos Lagoon. The framework used to provide those flood forecasts can be considered a successful benchmark for future forecasting systems to be implemented in the region. Forecasts of the stage of the Guaíba river were fairly accurate, predicting the extraordinarily high stage of the first peak in Porto Alegre with about 2 to 3 days in advance, and correctly forecasting a secondary peak and the long flood duration. In the southern end of the Patos Lagoon, hydrological forecasts led by researchers from UFPel and FURG also provided useful information to minimize impacts to a population that exceeds 500,00 people in Pelotas and Rio Grande.
IMPACTS
In the previous section we have shown that the record rainfall caused the largest floods ever observed in the rivers of the Guaíba basin and in the Patos Lagoon. In addition, the intense and long-lasting rain caused a series of landslides, that is probably the most widespread series of landslides ever observed in Brazil. Both the landslides and the flooding of areas adjacent to the rivers brought enormous economic impacts to the population of the state. Here we seek to present a concise overview of the extent of the flooded areas and the impacts in terms of loss of human lives, displaced population, affected infrastructure and economic losses.
Inundated areas
The areas affected by floods and landslides in Rio Grande do Sul are shown in Figure 17, where it can be observed that the landslides occurred over a vast region of about 250 x 100 km, along the slopes of the northern part of the Guaiba river basin, while the most extensive floods occurred along the central depression, and on the shores of the Guaíba river and the Patos Lagoon.

Overview of the impacted region (a) mapped flooded areas and landslides scars; (b) inset detail of Porto Alegre Metropolitan Region and Southern Plateau slopes; (c) inset detail of the Patos Lagoon Estuary region; (d) Sentinel-II natural color imagery of May 6 revealing heavy landslides scars in Taquari River valley; (e) Sentinel-II natural color imagery of May 6 over the flooded São Leopoldo city (Sinos River basin); (f) Emergency status across Rio Grande do Sul municipalities as of May 21, 2024 (Rio Grande do Sul, 2024b).
According to the official mapping, approximately 15,000 km2 were inundated along the main rivers. This figure is about 6% of the total area of the state. Of this total, 262 km2 of the inundation occurred over areas classified as urban areas, affecting more than 850,000 people.
The inundation of floodplains along the Sinos River displaced the largest number of people, impacting more than 260,000 persons, followed by the areas flooded by the Guaíba River (more than 251,000 people), the Patos Lagoon (84,000 people), the Taquari River (more than 62,000 people), and the Jacuí River (more than 49,000 people). Moreover, the number of houses affected in the urban areas was more than 390,000, whereas for rural areas the number of houses affected was estimated as 71,000, totaling 461,000 homes affected due to the April-May 2024’ floods.
Failure of flood protection system
As described previously, there is a flood protection system in the cities of Porto Alegre, Canoas, São Leopoldo and Novo Hamburgo, all of which are in the RMPA. Theoretically, this system should prevent some of the lower areas of these cities from being flooded. However, during the May 2024 flood, this protection system had widespread failures, resulting in the flooding of many neighborhoods where residents believed there was no risk of flooding.
In Canoas, the dikes were unable to hold back the waters. Neighborhoods of the city located adjacent to the Sinos river in the western part of the city, and along the Gravataí river, in the southern part of the city, were inundated by the water that reached more than 2 meters deep over the streets in a matter of hours during the early hours of Saturday, the 4th. The fact that the flood protection system failed during the night contributed to the increase in the losses and the number of fatalities in this region, as many people were sleeping when the water invaded their homes. One of the most populous neighborhoods of Canoas, called Mathias Velho, was almost completely inundated, displacing nearly 40,000 residents. There was a mass exodus of the local population, with people abandoning cars in the middle of the road and running with their belongings. The main hospital of Canoas is in Mathias Velho, and it was flooded up to the second floor. The hospital, which was keeping patients in serious condition in Intensive Care Unit (ICU) rooms, had to be evacuated in a hurry. Two patients ended up dying during the evacuation (O Globo, 2024a).
The failure of the flood defense system occurred due to a variety of factors, and in practically all parts that were supposedly protected, as shown in Figure 18. At two points in the cities of São Leopoldo and Novo Hamburgo the maximum stage of the Sinos river during the flood exceeded the design crest elevation of the levee, and the water flowed over them (overtopping). These points are marked with number 1 in Figure 18.

Summary of failures of the flood defense system in the metropolitan area, showing inundation in protected (dark orange) and unprotected (light orange) areas, and the locations and types of the failures.
In some other points, especially near pumping houses, the flood did not exceed the design crest elevation of the levees, however the levees had been lowered by some reason such as to allow trucks and tractors to access the service road over the levees. At those lowered points, the levee overtopped, resulting in the formation of breaches through which water entered the protected areas (points marked with number 2 in Figure 18). These breaches in the lowered points of the levees were the main cause of the flooding of the neighborhoods of Mathias Velho (Canoas), Vicentina and Vilas Brás (São Leopoldo) and Santo Afonso (Novo Hamburgo).
Levee overtopping also occurred in certain areas where construction was not completed according to project specifications (points marked with number 3 in Figure 18). In these locations, the levees were built with crest heights approximately 1.5 meters lower than the design requirements. This issue affected the Sarandi neighborhood in northern Porto Alegre and the Rio Branco neighborhood in southern Canoas.
At some points, water also flowed into the protected area through points where a section of the levee is completely or partially absent, and where there is no floodgate, such as at the intersection of some roads with the levee (points marked with number 4 in Figure 18). This happened at the point where Ernesto Neugebauer Avenue and the railway cross under the BR-290 highway, in the northern part of Porto Alegre. Through this point, where the elevation of the avenue is lower than the elevation of the crest of the surrounding levees, water from the Gravataí River entered the polder that protects areas such as the Humaitá neighborhood and the Salgado Filho airport. Another point in the northern part of Porto Alegre where this type of failure occurred was where Assis Brasil Avenue crosses under the BR-290, which contributed to the flooding of the Sarandi neighborhood.
A further point labelled with number 4 in Figure 18 is a lowered portion of the dike located next to the Usina do Gasômetro building. At this point there are no streets crossing under the dike, but there is a section where the dike is lowered to allow pedestrian access.
Points marked with number 5 correspond to places where breaches were formed due to the construction of houses on or next to the levee, which weakened the structure.
Point 6 marks the place where one of the floodgates collapsed, probably because it was not properly secured. A large amount of water entered through this collapsed floodgate, inundating the northern part of the city, including the airport area. Several other floodgates were installed with gaps and sealing failures, which allowed river water to leak into the protected area of the city. Although the leakage flow through these gaps was relatively small, it is undeniable that it contributed to the flooding of the protected areas.
In the historic downtown area of Porto Alegre, near the port, the protection system failed because there was a backflow through the galleries of the pumping stations (points marked with number 7 in Figure 18), which serve to pump the city's rainwater into the river. The backflow could have been avoided if flap valves and drainage gallery access covers had been operating properly.
Additional failures in the flood defense system involved backflow through the rainwater drainage network in areas where it was mistakenly connected directly to the outside of the polder, rather than to pumping stations. Furthermore, these sections of the drainage network were not equipped with backflow gates. Such failures contributed to the flooding in the Menino Deus, Praia de Belas, and Cidade Baixa neighborhoods of Porto Alegre.
Following the flooding of the protected areas, several pumping stations were shut down due to lack of electric power supply. Although the cessation of pumping did not cause the initial flooding, the shutdown of the pumps extended the duration of the inundation. Even after the river level receded, water levels within the polders remained elevated for several more days until the pumping stations could resume operation. Some of them were finally dried out after approximately 30 days.
The description of the protection system failures presented here shows that the flood protection system in the metropolitan region could have prevented most of the flooding in the protected neighborhoods. Only at two points along the Sinos River, in São Leopoldo and Novo Hamburgo, the flood actually exceed the magnitude of the hypothetical flood considered in the design. At all other points with failures, it would have been possible to prevent the entry of water into the protected neighborhoods if the system had been operating in accordance with the hypothetical flood for which it was designed.
The failures in the RMPA flood protection system demonstrate that a flood protection system is not only composed of structures such as dikes, walls and floodgates. A flood protection system requires, above all, a management system, responsible for auditing and maintaining the system capable of operating under the conditions for which it was designed.
Loss of life
According to the state civil defense bulletin of August 20, 2024, the disaster resulted in 183 confirmed deaths, and 27 missing people (Rio Grande do Sul 2024d). Nearly half of the fatalities resulted from flooding, while 38% resulted from landslides.
Nearly two thirds of the fatal victims were male. Elderly individuals over the age of 60 were especially vulnerable, comprising 48% of the fatalities. This is similar with what happened in Germany, in 2021 (Thieken et al., 2023; Rhein & Kreibich, 2024).
Many of the fatal victims in the valleys along the tributaries of the Jacuí River ended up perishing after taking refuge on the second floor or on the roofs of their houses. This seems to have occurred because in these places the river had a very rapid rise in level and, more importantly, the maximum level was much higher than the largest floods known. Thus, the flood affected many people who believed they lived in places that would not be affected by the flood.
In many cases, taking refuge on the upper floor or on the roofs of the houses was not enough to save the victims because the house was destroyed by the force of the water. The destructive force of the water was amplified by the unprecedent high velocity flow on the floodplain, and by the large amount of woody material being transported.
Around 46 deaths (25% of the total) occurred in cities in the metropolitan region of Porto Alegre that are protected by dikes (Canoas, Porto Alegre, Novo Hamburgo and São Leopoldo). Most of them occurred because of the sudden flooding of the densely inhabited polders, some of them during the night.
Displaced population
The number of people displaced by the floods and landslides across the entire State reached 581,638, according to a report issued by Civil Defense on May 24, 2024 (Rio Grande do Sul, 2024e). This figure was later updated to 877,729 displaced individuals in August 2024, with the release of the Unified Map of the Rio Grande Plan by the state government (Rio Grande do Sul, 2024c).
Many of the displaced had to be rescued from their homes during the flood. In cities further upstream, numerous people required rescue because they initially remained in their homes, doubting that the water level could rise much higher than previously known floods. In areas of the metropolitan region, many had to be rescued because they were unaware they lived in flood-prone areas, as they were protected by levees. Additionally, the water level rose relatively quickly once the protection system began to fail. In several areas that should have been safeguarded by levees, the flooding occurred during the night, which further contributed to catching residents by surprise before they could evacuate. As of May 12, there were 78,000 displaced people housed in shelters, and three months after the flood peak, 2,800 people still remain in shelters throughout the state.
Figure 19a, highlights the spatial distribution of displaced individuals. The spatial pattern emphasizes that most of those affected by the disaster are located along the slopes of the Southern Plateau, the Central Depression, and the Coastal Plain. A total of 160 cities had more than 100 displaced people. Of these, 68 cities had over 1,000 displaced individuals. The 10 cities with the highest number of displaced people, illustrated in Figure 19b were Canoas, Porto Alegre, São Leopoldo, Rio Grande, Eldorado do Sul, Guaíba, Novo Hamburgo, Esteio, Pelotas, and Igrejinha. Together, these cities account for 582,000 displaced individuals, or 66% of the total displaced population. The three most affected cities—Canoas, Porto Alegre, and São Leopoldo—are protected by dike systems that failed during the gradual flooding.

Displaced population. (a) Map of absolute displaced population across Rio Grande do Sul; (b) Rank of top 10 cities with highest absolute displaced population; (c) Map of relative displaced population (in % of total city population); (d) Rank of top 10 cities with highest relative displaced population; (e) Displacement population plot, highlighting the relative displacement; (f) Displacement population plot, highlighting the landscape units.
Figure 19c shows the displaced population in relative terms, i.e., the percentage of displaced individuals relative to the total municipal population. This indicator can be interpreted as the intensity of the event’s impact on each municipality. A region with several red dots in the Taquari river valley shows that this region was severely affected. The 10 most affected cities, shown in Figure 19d, were Eldorado do Sul, Muçum, Roca Sales, Arambaré, Travesseiro, Colinas, Arroio do Meio, Igrejinha, Marques de Souza, and Canoas. Eldorado do Sul and Muçum were particularly hard-hit, with 80% and 79% of their populations displaced, respectively. Muçum is located within the Taquari river valley, while Eldorado do Sul is in the RMPA, but is not protected by any flood defense system.
Figures 19e and 19f outline the displaced population in a log-log scale graph. The upper right corner indicates a large displaced population, while the 1:1 line indicates 100% of the population displaced. In detail (e), shading shows the relative impact, demonstrating that while Porto Alegre is the second-largest city in absolute terms, it is not the worst case in relative impact. Conversely, Canoas had a large displaced population both in absolute and relative terms. Detail (f) maps the cities’ positions within the landscape units, highlighting that cities in the Central Depression were most severely affected.
Affected infrastructure
One of the biggest impacts of the flooding and landslides was the impact on transport infrastructure. The main state and federal highways in the State had more than 100 traffic interruption points in the middle of May, due to landslides and flooding. In total, there were 251 blockades on 99 motorways in 126 municipalities in the state. At the worst moment, there were 170 roadblocks on 79 highways in 97 municipalities on the state highways of Rio Grande do Sul (Comando Rodoviário da Brigada Militar, 2024).
The flood destroyed or damaged dozens of bridges throughout the state. Considering only the largest state and federal highways, 14 bridges will need to be completely rebuilt. Sections of highways in the floodplains of the rivers Taquari, Pardo, and Jacuí suffered erosion, and dozens of kilometers will have to be reconstructed.
One of the most impacted infrastructures in Rio Grande do Sul was the Salgado Filho airport, the state's main airport, which is located in the northern part of Porto Alegre, in a low-lying area near the Gravataí and Guaíba rivers, which should have been protected from flooding by the levees. However, as described earlier, there were several failures in the city´s flood protection system resulting in flooding of the airport area, with water depths above 2 meters in some parts. Runways, hangars, internal and external roads, terminals and all support structures were flooded for about a month. The terminal has not received flights for passengers and cargo since May 3, and the airport was only able to resume operations at the end of October 2024, which means that the airport remained closed for 6 months directly affecting the state's logistics (Henkes, 2024). A study by the government of Rio Grande do Sul indicates that the shutdown of Salgado Filho International Airport in Porto Alegre could cause losses between R$2.5 billion and R$3.2 billion to the state's economy.
As for the impact on railways, 455 kilometers of freight railway were blocked due to the floods in the state (GZH, 2024d). In the RMPA, the metropolitan passenger train company Trensurb was severely affected by the flood. Of the 40 trains that make up the fleet, three were hit and damaged by flooding. In addition, there were losses of power supply structures and damage to the tracks. The company's headquarters and main train yard of Trensurb are located in the northern part of Porto Alegre, in an area that would be protected by the dike system, which failed as described previously. Five months after the flood the Trensurb service is still not completely restored, because the three stations that are closer to downtown Porto Alegre are still out of service. The urban train service in the RMPA is expected to be fully reestablished by December 24, 2024.
Most of long distance passenger transport within the state occurs by bus. The most important bus station in the State is the Porto Alegre bus station, which is located very close to the Guaíba river, behind the floodwall. Due to the failure of the flood defense system, this bus station was flooded over about 30 days, and remained without receiving buses for 41 days.
Drinking water supply infrastructure was immediately affected. At least eight cities were left completely without drinking water. The Regional Water Company (in portuguese: Companhia Riograndense de Saneamento - Corsan), responsible for supplying water to 317 municipalities in the State of Rio Grande do Sul (around 6.5 million people), estimated 523 thousand homes without drinking water, in 39 cities. At the height of the crisis - May 4, 2024 - the number of customers without access to drinking water exceeded 1 million, in 64 municipalities (Rio Grande do Sul, 2024a; Companhia Riograndense de Saneamento, 2024).
In Porto Alegre more than 1 million people were left without water supply, given the shutdown of all Water Treatment Plants. For the whole state the extreme event left probably more than 3 million people without drinking water. The interruption in the water supply occurred because the WTP or the water intake structures were flooded. The hydraulic pumps were not prepared to work underwater, or the power supply was interrupted to avoid accidents.
In addition to the failure of the hydraulic infrastructure (water supply and treatment), the quality of water abstracted from water bodies and sent to treatment plants worsened significantly during the flood. As a result of landslides and soil erosion, the turbidity of water in the rivers, that used to be in the range of 20-40 NTU, reached values above 1000 NTU. This high turbidity required water treatment plants to operate at only 50% of their normal capacity, according to information provided by local authorities.
The full return of the water supply system took approximately 20-25 days, with some Water Treatment Plants (WTP) resuming in the same week and others needing longer periods. Some WTP are in regions where the water level rises and falls quickly, making repairs possible. In the metropolitan region, the water level took 30-40 days to return, as mentioned previously.
Some Wastewater Treatment Plants (WWTP) did not return to operation after 5 months, and there is still no expected return, while some other WWTP still do not operate properly.
At the height of the crisis (peak of the event), 532,000 homes and businesses were left without power supply by the companies CEEE Equatorial and RGE Sul, representing more than 10% of the whole State (Rio Grande do Sul, 2024b).
At least 579 schools in the state Rio Grande do Sul were damaged by the floods and 83 that were not damaged served as shelters for flood victims. According to official information from the State, 1044 of the 2300 state schools in Rio Grande do Sul were affected by the floods and landslides. More than 500 thousand students were out of school for one to three weeks, and more than 200 thousand students were out of school for more than a month (Rio Grande do Sul, 2024b).
Other impacts
The record-breaking high-water levels, and the unprecedent flow velocities in the inundated areas resulted in widespread destruction of buildings. According to the National Confederation of Municipalities, 103,000 homes were damaged and 9,300 were destroyed throughout Rio Grande do Sul, causing a total loss of R$4.7 billion (Confederação Nacional de Município, 2024). In the municipality of Cruzeiro do Sul, located on the banks of the Taquari River, an estimated 1,000 homes were destroyed. One of the most impacted areas was the Passo de Estrela neighborhood, located near a sharp bend in the riverbed, where the force of the water flowing over the plain destroyed 650 houses (O Globo, 2024c).
The rapid rise of waters, particularly in areas that should have been protected by levees in the RMPA, resulted in extensive losses of cars, trucks and other vehicles. The number of affected vehicles was estimated at 200,000 in the state, including those covered by insurance. The economic loss related to the flooded vehicles is estimated at R$ 8 billion, or around 1,5 billion dollars (G1, 2024).
According to Emater/Ascar (Rio Grande do Sul, 2024f), infrastructure damage in rural areas during the period of extreme rains and floods affected 9,158 localities in the state of Rio Grande do Sul. Numerous damages were observed in rural facilities, such as houses, barns, warehouses, silos, greenhouses, and poultry farms, impacting buildings and facilities belonging to 19,190 rural families. There were also significant issues with the transportation of goods from 4,548 communities due to damage to rural roads. Access to potable water in rural areas was also compromised, resulting in the contamination of hundreds of water sources, leaving thousands of families without clean drinking water. Records of water contamination in rural areas reached 4,570 cases, affecting at least 34,519 rural families.
In terms of primary production, there were significant losses in various crops. In the grain sector, losses in summer crops, stored products, and early winter plantings were particularly notable. Regions near the metropolitan area experienced severe damage to horticulture and fruit production. The livestock sector in Rio Grande do Sul was also heavily impacted, with losses of 1.2 million poultry, 14,806 beef cattle, 14,794 pigs and 16,054 commercial bee hives (Rio Grande do Sul, 2024f).
The agriculture sector has also been severely affected by soil erosion and fertility loss, that was reported at 405 municipalities reaching 2.7 million hectares (Rio Grande do Sul, 2024f).
Industry was impacted by the loss of inventories, machinery, equipment, and facilities, and by the logistical challenges in distributing products or receiving inputs from suppliers who were also affected by the catastrophe (Federação das Indústrias do Estado do Rio Grande do Sul, 2024). The National Confederation of Commerce of Goods, Services and Tourism estimated that the natural disaster in Rio Grande do Sul could represent losses of up to R$58 billion in the state itself and R$38.9 billion in other states, with an impact of around R$97 billion on the Brazilian economy in 2024. There is also a possibility of affecting about 10% of Rio Grande do Sul's Gross Domestic Product (GDP, the sum of goods and services produced in the state), with negative impact of about 1% on Brazil's GDP (O Globo, 2024b).
A similar figure of economic impact of the disaster was estimated by a mission of experts from the Inter-American Development Bank (IDB), the World Bank, ECLAC (Economic Commission for Latin America and the Caribbean), and the federal and Rio Grande do Sul governments, who estimated the losses at R$87 billion (Valor, 2024).
Finally, the 2024 disaster is also showing medium- and long-term health impacts, because floodwater increased the spread of diseases such as hepatitis A, typhoid fever, and leptospirosis (Martins-Filho et al., 2024; Ziliotto et al., 2024; Silveira et al., 2021). According to the State government epidemiological report issued in August 15, 788 cases of leptospirosis and 25 deaths directly related to the flood have been confirmed in 2024, while 2844 cases are still under investigation (Rio Grande do Sul, 2024g).
SUMMARY AND DISCUSSION
A large portion of the Rio Grande do Sul state, in South Brazil, was hit by a hydrological event in late April and early May 2024 that resulted in landslides and widespread flooding. The event was caused by unprecedent rainfall that largely exceeded the most intense large-scale precipitation events historically observed in Brazil, from 1961 to 2022, at least for affected areas in the range from 2,000 to 100,000 km2 and rainfall durations of 3 to 14 days.
As a result of the intense and long-lasting rainfall, record breaking floods occurred in rivers spanning drainage areas from less than 1000 km2 to 84,000 km2 and to the Patos Lagoon, that drains 182,000 km2 at its outflow to the Atlantic Ocean. Along the steeper valleys of the Upper Jacuí, Pardo and Taquari rivers the flood was particularly impressive due to the stage rise that exceeded 20 m in a few days, and due to the high water levels, that reached more than 4 meters higher than the worst floods experienced in more than 100 years. In the lower parts of the region the maximum water levels of the 2024 flood are also the highest in more than 100 years. Moreover, the 2024 flood had an extremely long duration, with stage remaining high for about 30 days in the capital city Porto Alegre, from early May to early June.
At four hydropower dams, at least, the peak discharge was above the design discharge. In two of those dams, the flow rate with an estimated return time of 10,000 years was exceeded, and in the two others, the flow rate with an estimated return time of 1,000 years was exceeded. One dam suffered a partial rupture, and another dam suffered total erosion of the abutment.
The intense rainfall also led to landslides along the steeper parts of the basin, covering a region that extends about 350 km from west to east, and around 100 km from south to north. More than 15,000 landslide scars were identified by remote sensing, and many more were identified at field, making this event to rank first in Brazil in terms of spatial scale and number of landslides.
Flooding along the main rivers affected an area of about 15,000 km2, where an estimated population of 850,000 people live. More than half of these displaced people live in areas in the Porto Alegre Metropolitan Area (RMPA) that should have been protected by an extensive flood defense system, composed by levees, flood walls, flood gates and pumping stations. This flood defense system failed for a variety of reasons, demonstrating that a flood protection system requires, above all, a management system, responsible for maintaining the system capable of operating under the conditions for which it was designed.
Almost 200 fatalities occurred due to the riverine flooding, landslides and inundation due to the failure of the flood defense system in the RMPA. Most of the fatalities occurred in mountainous areas, mainly related to landslides and flash floods in relatively steep valleys. Nevertheless, a sizable part of the fatalities occurred in areas that were flooded despite being protected by levees. No fatalities were registered in the southernmost area of Patos Lagoon, where the stage increased much slower, giving time for people to prepare.
The impacts to the state´s economy, including infrastructure (damaged roads, railways, airport, water and electricity services, schools and hospitals), and the properties of the affected people are being estimated at 87 to 97 billion reais.
Medium range weather forecasts by global models, issued before the days with the most intense rainfall, generally underestimated the magnitude of the precipitation, and misplaced the regions with the maximum amount of rain. Forecasts issued by the National Meteorology Institute (INMET) a few days in advance, based on a regional model, had mixed performance: forecasting runs before the first days of rain underestimated the precipitation amount, while updated runs, issued during the days with the most intense rainfalls, were more accurate. While it can be said that the weather forecasts in general underestimated the total precipitation, they at least indicated the potential for high rainfall intensities and allowed broad warnings to be issued.
Flood early warning in Brazil is relatively fragmented, therefore the broad warnings of weather forecasts and the relatively poor monitoring of rainfall and rivers limited the quality and scale of flood forecasts during the 2024 event in Rio Grande do Sul. Institutions of the state government issued warnings about flooding in several rivers, but no detailed information was given about hydrographs, flood maps or the maximum stage predicted at key gauging stations. The Geological Survey of Brazil (SGB) issued detailed forecasts for key gauges of two of the most impacted rivers (Taquari and Caí), that were useful during the early part of the flood but could not be issued through the most critical flood peak period, since key measuring equipment was lost by the destructive waters. Apart from the Taquari and Caí river, no official operational flood forecasting service exists, that can forecast the maximum height of the water in the upcoming hours or days.
To address this lack of information in the city of Porto Alegre, researchers from the Federal University of Rio Grande do Sul combined hydrological and hydrodynamic forecasting tools, that were still under development, with meteorological observations and forecasts to generate forecasts of water levels in Porto Alegre throughout the most critical period of the flood. These forecasts proved to be quite accurate, considering the non-operational conditions in which they were made, and the relatively limited data used as input to the forecasting models. The forecasts, in combination with produced maps and fails observations, allowed the emissions of evacuation suggestions for Porto Alegre. Furthermore, these forecasts may serve as a benchmark, pointing the way toward developing operational flood forecasts for the entire state. Similarly, in the southern end of Patos Lagoon, hydrological and hydrodynamic forecasts performed by researchers from the Federal University of Rio Grande (FURG) and the Federal University of Pelotas (UFPel) helped to reduce the impacts of the flood on a population of over 500,000 people.
Within this context, some important questions that need answers are: what caused this event to result in so many fatalities? and why did it result in such a high economic impact?
The first factor that is related to the high number of deaths is the number and extension of landslides, which are the direct cause of 38% of the casualties. Secondly, the floods in the valleys of the tributaries to the Jacuí and Guaíba rivers reached water levels well above previous historical records. In the most populated part of the Taquari River, for example, the maximum levels were more than 4 meters above the maximum levels previously observed, including the floods of 1941 and 2023. This caused the water to reach the homes of people who had no previous experience of flooding. In addition, in many cases, the most experienced residents, who tried to take refuge on the upper floors of their houses, as they usually did with the smaller floods they were used to, ended up surprised by the flooding that ended up completely covering the roofs of their homes. In some cases, rescue by boat or helicopter arrived in time, but in many others, there was no time or conditions for rescue.
Much higher water levels than in previous floods in those relatively steep valleys also brought another component that was previously unknown to many residents: the water in the flooded area reached much higher speeds than it usually did. This occurred because, after a certain water level, the plain ceases to be a place where the water invades, but becomes practically static, and becomes a place where the water flows, practically becoming part of the main riverbed. Some preliminary results of hydrodynamic modeling, and observation of some videos by amateur videographers, suggest that the speed of the water in the plain may have reached several meters per second in some places. Such rapid water currents were highly destructive, and those who sought refuge in their homes ultimately perished when their houses were destroyed, even though the structures were not completely submerged.
The destructive power of the floodwaters was also increased by the large quantity of tree trunks that were carried by the rivers. This was probably a consequence of the extensive landslides, several of them in steep forested areas on the shores of the rivers, and of the high speed of water on the floodplain, where many large trees were uprooted and taken with the current.
Finally, an important factor that contributed to the lethality of the hydrological event was the flooding of areas that should have been protected by the flood defenses, levees and floodwalls, in a sad example of the “safe development paradox” (Fusinato et al., 2024).
The 2024 flood, described here, together with the September 2023 flood on the Taquari river (Alvalá et al., 2024; Moraes et al., 2024), demonstrated that it is not sufficient to focus on flooded areas to estimate possible impacts on infrastructure and properties, as mentioned by Koks et al. (2021). This suggests that flood hazard maps that have been produced in Brazil, although necessary, are not sufficient for adequate preparation. This was made very clear by the destruction of an entire neighborhood in the municipality of Cruzeiro do Sul, due to the high flow velocities over the floodplain.
Regarding the causes of the high economic impacts, a large part of it may be related to the catastrophic failure of the flood defense system in the Metropolitan Region of Porto Alegre (RMPA). The flood protection system in the metropolitan region could have prevented most of the flooding in the RMPA. It would have been possible to significantly reduce the flooding of most of the RMPA if the flood defense system had been operating in accordance with the hypothetical flood for which it was designed. The failures in the flood defense system highlight that effective flood protection involves more than just physical infrastructure; it also requires a robust institutional management system that ensures the flood defenses remain functional and capable of operating under the conditions for which they were designed.
Considering the projected impacts of climate change on extreme hydrological events in Brazil (Brêda et al., 2023; Paiva et al., 2024b; Petry et al., 2023), the catastrophic flood of 2024 in Rio Grande do Sul may have been a glimpse of similar events that can be expected to occur in the future in the southern region of Brazil and in neighboring countries of the La Plata basin. Therefore, to improve preparedness for extreme flood events already influenced by climate change, recommendations have been made that reconstruction of the infrastructure affected by the 2024 flood be carried out considering a change in hydrological criteria (Paiva et al., 2024c).
We understand that damages cannot completely be prevented when such an exceptional hydrological event, like the April-May 2024 flood in Southern Brazil, occurs. However, we re-emphasize that the damage can be reduced, in case a similar event happens again.
Fatalities could be reduced by improving the early warning and evacuation schemes, and by recognizing that structural flood control measures like levees do not eliminate the probability of flooding. In accordance with recent research (Pappenberger et al., 2015; Nonnemacher & Fan, 2023), it can be stated that accurate forecasts would have allowed for the preparation to reduce damage. This is a reality for places that do not have structural measures in place, such as the cities along the Taquari, Pardo and Caí rivers, which could have anticipated evacuations once the maximum level and its occurrence were predicted. Equally, it is also a reality for cities that have implemented structural flood defenses, such as Porto Alegre and Canoas. In the latter case, forecasts allow decision-making based on the possibility that the event could lead to failure or exceedance of the levels supported by the protection structures. In all these cases, detailed and timely water level forecasts are crucial data. These kinds of forecasts, however, are still not produced operationally by the national, regional or local authorities, except for a few locations. These reflections unequivocally highlight the importance of investing in monitoring systems, forecasting systems, and trained institutions in the context of flood resilience, regardless of the existence or not of other structural or non-structural measures.
Long lasting impacts on the population, like power and water shortages, and impacts to public health in hospitals could be reduced by spatial planning and design of waterproof infrastructure, and by measures to rapidly return to minimum service levels when failure cannot be prevented.
Economic impacts could have been highly reduced during the 2024 flood in Rio Grande do Sul if the flood defense system had operated as it was designed. This flood defense system has presented several flaws that appear to result from less effective management than required.
In face of similar flood threats throughout the 21st century, in a context of climate change, strengthening the management of the RMPA flood defense system and investing in capacities for flood forecasting appears to be an unavoidable course of action.
ACKNOWLEDGEMENTS
The authors wish to acknowledge CERTEL and ELERA for providing data about hydropower dams. The authors wish to acknowledge HidroSens research group from Universidade Federal de Pelotas for the Patos Lagoon data made available.
REFERENCES
-
Agência Nacional de Energia Elétrica – ANEEL. (2024). Nota à imprensa: ANEEL acompanha de perto a operação das usinas do Jacuí (RS) após acionamento de Plano de Emergência devido às fortes chuvas. Retrieved in 2024, August 15, from https://www.gov.br/aneel/pt-br/assuntos/noticias/2024/nota-a-imprensa-aneel-acompanha-de-perto-a-operacao-das-usinas-do-jacui-rs-apos-acionamento-de-plano-de-emergencia-devido-as-fortes-chuvas
» https://www.gov.br/aneel/pt-br/assuntos/noticias/2024/nota-a-imprensa-aneel-acompanha-de-perto-a-operacao-das-usinas-do-jacui-rs-apos-acionamento-de-plano-de-emergencia-devido-as-fortes-chuvas -
Allasia, D. G., Tassi, R., Bemfica, D., & Goldenfum, J. A. (2015). Decreasing flood risk perception in Porto Alegre-Brazil and its influence on water resource management decisions. Proceedings of the International Association of Hydrological Sciences, 370, 189-192. http://doi.org/10.5194/piahs-370-189-2015
» http://doi.org/10.5194/piahs-370-189-2015 -
Altafini, D., Costa Braga, A., & Ugalde, C. (2023). Mapping urban flood-prone areas’ spatial structure and their tendencies of change: A network study for Brazil’s Porto Alegre Metropolitan Region. Cartographica. Cartographica, 58(4), 205-226. http://doi.org/10.3138/cart-2023-0003
» http://doi.org/10.3138/cart-2023-0003 -
Alvalá, R. C. S., Ribeiro, D. F., Marengo, J. A., Seluchi, M. E., Gonçalves, D. A., Silva, L. A., Cuartas Pineda, L. A., & Saito, S. M. (2024). Analysis of the hydrological disaster occurred in the state of Rio Grande do Sul, Brazil in September 2023: vulnerabilities and risk management capabilities. International Journal of Disaster Risk Reduction, 110, 104645. http://doi.org/10.1016/j.ijdrr.2024.104645
» http://doi.org/10.1016/j.ijdrr.2024.104645 -
Andrades Filho, C. O., Mexias, L., Jacomini, A., Iescheck, A., Viero, A., Giaccom, B., Cargnin, B., Michelin, C., Sluter, C. R., Gonzatti, C., Meneghini, C., Cavalheiro, D., Cremon, E., Boni, D., Barboza, E., Schwarzer, G., Diniz, F., Jacques, F., Oliveira, G., Dorneles, J., Santos, J., Cacciatore, J., Lescano, H., Schmitt, H., Novakoski, K., Duarte, L., Guasselli, L., Petry, L., Mevel, L., Peres, L., Bressani, L., Rosso, K., Reis, M., Rosa, M., Righi, M., Rosa, M., Silva, M., Ribeiro Junior, M., Machado, M., Soares, N., Gruber, N., Herrmann, P., Souza, P., Remboski, R., Schumacher, R., Quevedo, R., Mendonça, R., Philipp, R., Cárdenas, S., Soares, V., & Núñez, W. (2024). Nota técnica conjunta IGEO/CEPSRM Mapeamento das cicatrizes de mzovimentos de massa decorrentes do acumulado de chuva no RS entre 27/04 e 13/05 de 2024 Porto Alegre: Universidade Federal do Rio Grande do Sul. http://doi.org/10.13140/RG.2.2.10472.89609
» http://doi.org/10.13140/RG.2.2.10472.89609 -
Bougeault, P., Toth, Z., Bishop, C., Brown, B., Burridge, D., Chen, D. H., Ebert, B., Fuentes, M., Hamill, T. M., Mylne, K., Nicolau, J., Paccagnella, T., Park, Y.-Y., Parsons, D., Raoult, B., Schuster, D., Dias, P. S., Swinbank, R., Takeuchi, Y., Tennant, W., Wilson, L., & Worley, S. (2010). The THORPEX interactive grand global ensemble. Bulletin of the American Meteorological Society, 91(8), 1059-1072. http://doi.org/10.1175/2010BAMS2853.1
» http://doi.org/10.1175/2010BAMS2853.1 -
Brasil. Centro Nacional de Monitoramento e Alertas de Desastres Naturais – CEMADEN. (2024a, 29 de abril). 30/04/2024: previsão de riscos geo-hidrológicos. Retrieved in 2024, October 9, from https://www.gov.br/cemaden/pt-br/assuntos/riscos-geo-hidrologicos/30-04-2024-previsao-de-riscos-geo-hidrologicos
» https://www.gov.br/cemaden/pt-br/assuntos/riscos-geo-hidrologicos/30-04-2024-previsao-de-riscos-geo-hidrologicos -
Brasil. Centro Nacional de Monitoramento e Alertas de Desastres Naturais – CEMADEN. (2024b). Mapa interativo da Rede Observacional para Monitoramento de Risco de Desastres Naturais do CEMADEN. Retrieved in 2024, May 30, from https://mapainterativo.cemaden.gov.br/
» https://mapainterativo.cemaden.gov.br/ - Brasil. Centro Nacional de Monitoramento e Alertas de Desastres Naturais – CEMADEN. (2024c). Mapeamento dos movimentos de massa relacionados ao desastre de abril-maio de 2024 no estado do Rio Grande do Sul (Nota Técnica, No. 412/2024/Sei-CEMADEN). Brasília.
-
Brasil. Ministério da Ciência, Tecnologia e Inovação – MCTI. (2024d). Chuvas extremas no Rio Grande do Sul envolvem múltiplos fatores, apontam especialistas. Retrieved in 2024, November 4, from https://www.gov.br/mcti/pt-br/acompanhe-o-mcti/noticias/2024/05/chuvas-extremas-no-rio-grande-do-sul-envolvem-multiplos-fatores-apontam-especialistas
» https://www.gov.br/mcti/pt-br/acompanhe-o-mcti/noticias/2024/05/chuvas-extremas-no-rio-grande-do-sul-envolvem-multiplos-fatores-apontam-especialistas -
Brêda, J. P. L., Paiva, R. C. D., Siqueira, V. A., & Collischonn, W. (2023). Assessing climate change impact on flood discharge in South America and the influence of its main drivers. Journal of Hydrology, 619, 129284. http://doi.org/10.1016/j.jhydrol.2023.129284
» http://doi.org/10.1016/j.jhydrol.2023.129284 -
Chagas, V. B., Chaffe, P. L., & Blöschl, G. (2022). Climate and land management accelerate the Brazilian water cycle. Nature Communications, 13(1), 5136. http://doi.org/10.1038/s41467-022-32580-x
» http://doi.org/10.1038/s41467-022-32580-x -
Cia Energética Rio das Antas – CERAN. (2024). Ficha técnica do empreendimento – Castro Alves. Retrieved in 2024, August 15, from https://ceran.com.br/wp-content/uploads/2022/05/1_ficha_tecnica_CA.pdf
» https://ceran.com.br/wp-content/uploads/2022/05/1_ficha_tecnica_CA.pdf - Collischonn, W., Brêda, J. P. L. F., Wongchuig, S., Ruhoff, A., Paiva, R. C. D., Fan, F. M., Machado Filho, R. C. C., & Ramalho, N. (2024a). Unprecedented April-May 2024 rainfall in South Brazil sets new record. Revista Brasileira de Recursos Hídricos, 29, e50. http://doi.org/10.1590/2318-0331.292420240088.
- Collischonn, W., Ruhoff, A., Cabeleira Filho, R., Paiva, R., Fan, F., Possa, T., & Pickbrenner, K. (2024b). Nota técnica: chuva da cheia de 2024 foi mais volumosa e intensa que a da cheia de 1941 na bacia hidrográfica do Guaíba Porto Alegre: Instituto de Pesquisas Hidráulicas, Universidade Federal do Rio Grande do Sul, Serviço Geológico do Brasil.
-
Comando Rodoviário da Brigada Militar – CRBM. (2024). Notícias. Retrieved in 2024, October 16, from https://crbm.bm.rs.gov.br/noticias/
» https://crbm.bm.rs.gov.br/noticias/ -
Companhia Riograndense de Saneamento – CORSAN. (2024). CORSAN lança programa de isenção de tarifas para afetados pelas enchentes. Retrieved in 2024, July 15, from https://corsan.com.br/corsan-lanca-programa-de-isencao-de-tarifas-para-afetados-pelas-enchentes
» https://corsan.com.br/corsan-lanca-programa-de-isencao-de-tarifas-para-afetados-pelas-enchentes -
Confederação Nacional de Município – CNM. (2024). CNM atualiza prejuízos dos municípios com as chuvas no RS. Retrieved in 2024, August 15, from https://cnm.org.br/comunicacao/noticias/cnm-atualiza-prejuizos-dos-municipios-com-as-chuvas-no-rs-impacto-e-de-r-12-8-bilhoes
» https://cnm.org.br/comunicacao/noticias/cnm-atualiza-prejuizos-dos-municipios-com-as-chuvas-no-rs-impacto-e-de-r-12-8-bilhoes - Contreira Pereira, L., Silva, F. A., & Fonseca, J. (2024). Monitoramento dos níveis d’água na região de Pelotas, estuário da Lagoa dos Patos, durante a inundação de maio 2024. In Anais do 20º Congresso Latino-Americano de Ciências do Mar e 8º Congresso Brasileiro de Oceanografia, Itajaí. Itajaí: Secretaria de Comunicação da Prefeitura de Itajaí, Arquivo Histórico de Itajaí.
-
Dimitriou, E., Efstratiadis, A., Zotou, I., Papadopoulos, A., Iliopoulou, T., Sakki, G.-K., Mazi, K., Rozos, E., Koukouvinos, A., Koussis, A. D., Mamassis, N., & Koutsoyiannis, D. (2024). Post-analysis of daniel extreme flood event in Thessaly, Central Greece: practical lessons and the value of state-of-the-art water-monitoring networks. Water, 16(7), 980. http://doi.org/10.3390/w16070980
» http://doi.org/10.3390/w16070980 - Dona Francisca Energética S.A. – DFESA. (2022). Plano de segurança da usina hidrelétrica de Dona Francisca - volume VI: plano de ação de emergência. EGVP00428/00-10-RL-1006. Agudo, RS: DFESA.
-
Exame. (2024). Barragem 14 de Julho, no Rio Grande do Sul, entra em colapso após forte chuva. Retrieved in 2024, August 15, from https://exame.com/brasil/barragem-14-de-julho-no-rio-grande-do-sul-entra-em-colapso/
» https://exame.com/brasil/barragem-14-de-julho-no-rio-grande-do-sul-entra-em-colapso/ -
Fan, F. M., Paiva, R. C. D. D., & Collischonn, W. (2016). Hydrological forecasting practices in Brazil. In T. E. Adams III & T. C. Pagano (Eds.), Flood forecasting: a global perspective (pp. 41-66). London: Academic Press. http://doi.org/10.1016/B978-0-12-801884-2.00002-5
» http://doi.org/10.1016/B978-0-12-801884-2.00002-5 - Fan, F. M., Fleischmann, A. S., Siqueira, V. A., Nectoux, M., Giacomelli, L., & Collischonn, W. (2019). Development of a flood forecasting system for the state of Rio Grande do Sul, Brazil. In Abstracts of the EGU General Assembly 2019 (Vol. 21, pp. 10547-10547). Vienna: EGU.
-
Federação das Indústrias do Estado do Rio Grande do Sul – FIERGS. (2024). Estudos especiais: consulta da FIERGS sobre as enchentes de maio de 2024 no Rio Grande do Sul. Retrieved in 2024, August 15, from https://observatoriodaindustriars.org.br/inteligencia-estrategica/consulta-da-fiergs-sobre-as-enchentes-de-maio-de-2024-no-rio-grande-do-sul/
» https://observatoriodaindustriars.org.br/inteligencia-estrategica/consulta-da-fiergs-sobre-as-enchentes-de-maio-de-2024-no-rio-grande-do-sul/ -
Fernandes, E. H. L., Dyer, K. R., Moller, O. O., & Niencheski, L. F. H. (2002). The Patos Lagoon hydrodynamics during El Niño event (1998). Continental Shelf Research, 22(11-13), 1699-1713. http://doi.org/10.1016/S0278-4343(02)00033-X
» http://doi.org/10.1016/S0278-4343(02)00033-X -
Frnda, J., Durica, M., Rozhon, J., Vojtekova, M., Nedoma, J., & Martinek, R. (2022). ECMWF short-term prediction accuracy improvement by deep learning. Scientific Reports, 12(1), 7898. http://doi.org/10.1038/s41598-022-11936-9
» http://doi.org/10.1038/s41598-022-11936-9 - Fundação Estadual de Planejamento Metropolitano e Regional – METROPLAN. (2018). Estudo de alternativas e projetos para minimização do efeito das cheias na bacia do rio dos Sinos Porto Alegre.
-
Fusinato, E., Han, S., Kobiyama, M., & de Brito, M. M. (2024). Safe development paradox: evidence and methodological insights from a systematic review. Natural Hazards, 120(15), 13693-13714. http://doi.org/10.1007/s11069-024-06774-z
» http://doi.org/10.1007/s11069-024-06774-z -
G1. (2024). Enchentes danificaram 200 mil veículos no RS, afirma consultoria; prejuízos somam R$ 8 bilhões. G1 Retrieved in 2024, August 15, from https://g1.globo.com/rs/rio-grande-do-sul/noticia/2024/05/29/enchentes-danificaram-200-mil-veiculos-no-rs-afirma-consultoria-prejuizos-somam-r-8-bilhoes.ghtml
» https://g1.globo.com/rs/rio-grande-do-sul/noticia/2024/05/29/enchentes-danificaram-200-mil-veiculos-no-rs-afirma-consultoria-prejuizos-somam-r-8-bilhoes.ghtml -
Gaume, E., Livet, M., Desbordes, M., & Villeneuve, J. P. (2004). Hydrological analysis of the river Aude, France, flash flood on 12 and 13 November 1999. Journal of Hydrology, 286(1-4), 135-154. http://doi.org/10.1016/j.jhydrol.2003.09.015
» http://doi.org/10.1016/j.jhydrol.2003.09.015 - Germano, A. D. O., Lamberty, D., Silva, E. D., Buffon, F. T., & Pedrollo, M. C. R. (2024). Nota técnica: avaliação indireta do nível máximo do Guaíba na região central de Porto Alegre entre as estações Cais Mauá C6 e Usina do Gasômetro Brasília: Serviço Geológico do Brasil-CPRM.
-
Gonçalves, G. M. S., Bartels, G. K., Lima, L. S., Boeira, L. D. S., & Collares, G. L. (2023). Continuous discharge monitoring of the Mirim-São Gonçalo system by the index velocity rating curve method. Journal of Hydroinformatics, 25(1), 20-35. http://doi.org/10.2166/hydro.2023.045
» http://doi.org/10.2166/hydro.2023.045 -
Google. (2024). Open Buildings database. Retrieved in 2024, October 31, from https://sites.research.google/gr/open-buildings/
» https://sites.research.google/gr/open-buildings/ -
GZH. (2024a, 28 de maio). Qual foi o nível da enchente no Mercado Público de Porto Alegre. Retrieved in 2024, October 16, from https://gauchazh.clicrbs.com.br/colunistas/leandro-staudt/noticia/2024/05/qual-foi-o-nivel-da-enchente-no-mercado-publico-de-porto-alegre-clwqj3x4l002h01469pcoktvd.html
» https://gauchazh.clicrbs.com.br/colunistas/leandro-staudt/noticia/2024/05/qual-foi-o-nivel-da-enchente-no-mercado-publico-de-porto-alegre-clwqj3x4l002h01469pcoktvd.html -
GZH. (2024b, 3 de maio). Hidrólogos pedem que Porto Alegre prepare evacuação. Retrieved in 2024, May 15, from https://gauchazh.clicrbs.com.br/porto-alegre/noticia/2024/05/hidrologos-pedem-que-porto-alegre-prepare-evacuacao-veja-como-seria-inundacao-clvqsldrv022l011w51s0vgfk.html#:~:text=O%20pedido%20dos%20especialistas%20%C3%A9,sistema%20de%20defesa%20da%20cidade
» https://gauchazh.clicrbs.com.br/porto-alegre/noticia/2024/05/hidrologos-pedem-que-porto-alegre-prepare-evacuacao-veja-como-seria-inundacao-clvqsldrv022l011w51s0vgfk.html#:~:text=O%20pedido%20dos%20especialistas%20%C3%A9,sistema%20de%20defesa%20da%20cidade -
GZH. (2024c, 10 de maio). Quais são as chances de o Guaíba ter um “repique” nos próximos dias. Retrieved in 2024, May 15, from https://gauchazh.clicrbs.com.br/porto-alegre/noticia/2024/05/quais-as-chances-de-o-guaiba-ter-um-repique-nos-proximos-dias-clw0fej7i0004019atpu4gc9w.html
» https://gauchazh.clicrbs.com.br/porto-alegre/noticia/2024/05/quais-as-chances-de-o-guaiba-ter-um-repique-nos-proximos-dias-clw0fej7i0004019atpu4gc9w.html -
GZH. (2024d, 28 de maio). RS ainda tem quatro trechos de ferrovias totalmente bloqueados; veja a lista. Retrieved in 2024, August 15, from https://gauchazh.clicrbs.com.br/passo-fundo/geral/noticia/2024/05/rs-ainda-tem-quatro-trechos-de-ferrovias-totalmente-bloqueados-veja-a-lista-clwqhdiir001v013uj6ifjl72.html
» https://gauchazh.clicrbs.com.br/passo-fundo/geral/noticia/2024/05/rs-ainda-tem-quatro-trechos-de-ferrovias-totalmente-bloqueados-veja-a-lista-clwqhdiir001v013uj6ifjl72.html -
GZH. (2024e, 4 de maio). Baixa da inundação em Porto Alegre deverá ocorrer “vagarosamente”, apontam pesquisadores da UFRGS. Retrieved in 2024, August 15, from https://gauchazh.clicrbs.com.br/porto-alegre/noticia/2024/05/baixa-da-inundacao-em-porto-alegre-devera-ocorrer-vagarosamente-apontam-pesquisadores-da-ufrgs-clvspdeha022u014aeqm0605c.html#:~:text=O%20pesquisador%20diz%20que%2C%20ap%C3%B3s,mais%20prov%C3%A1vel%20%E2%80%94menciona%20Fernando%20Fan
» https://gauchazh.clicrbs.com.br/porto-alegre/noticia/2024/05/baixa-da-inundacao-em-porto-alegre-devera-ocorrer-vagarosamente-apontam-pesquisadores-da-ufrgs-clvspdeha022u014aeqm0605c.html#:~:text=O%20pesquisador%20diz%20que%2C%20ap%C3%B3s,mais%20prov%C3%A1vel%20%E2%80%94menciona%20Fernando%20Fan -
GZH. (2024f, 3 de maio). Guaíba deve atingir 5 metros de cheia neste fim de semana, aponta hidrólogo. Retrieved in 2024, August 15, from https://gauchazh.clicrbs.com.br/porto-alegre/noticia/2024/05/guaiba-deve-atingir-5-metros-de-cheia-neste-fim-de-semana-aponta-hidrologo-clvre1x5q02f7011w99qc4po1.html#:~:text=Apreens%C3%A3o%20na%20Capital-,Gua%C3%ADba%20deve%20atingir%205%20metros%20de,fim%20de%20semana%2C%20aponta%20hidr%C3%B3logo&text=A%20medida%20mais%20recente%20da,4m76cm%20na%20enchente%20de%201941
» https://gauchazh.clicrbs.com.br/porto-alegre/noticia/2024/05/guaiba-deve-atingir-5-metros-de-cheia-neste-fim-de-semana-aponta-hidrologo-clvre1x5q02f7011w99qc4po1.html#:~:text=Apreens%C3%A3o%20na%20Capital-,Gua%C3%ADba%20deve%20atingir%205%20metros%20de,fim%20de%20semana%2C%20aponta%20hidr%C3%B3logo&text=A%20medida%20mais%20recente%20da,4m76cm%20na%20enchente%20de%201941 -
GZH. (2024g, 2 de maio). Guaíba pode ultrapassar os 5 metros, aponta projeção do Instituto de Pesquisas Hidráulicas da UFRGS. Retrieved in 2024, August 15, from https://gauchazh.clicrbs.com.br/ambiente/noticia/2024/05/guaiba-pode-ultrapassar-os-5-metros-aponta-projecao-do-instituto-de-pesquisas-hidraulicas-da-ufrgs-clvplcxi1019d014aes0o62ev.html
» https://gauchazh.clicrbs.com.br/ambiente/noticia/2024/05/guaiba-pode-ultrapassar-os-5-metros-aponta-projecao-do-instituto-de-pesquisas-hidraulicas-da-ufrgs-clvplcxi1019d014aes0o62ev.html -
Hartmann, C., & Harkot, P. F. C. (1990). Influência do Canal de São Gonçalo no aporte de sedimentos para o estuário da Laguna dos Patos - RS. Revista Brasileira de Geociencias, 20(1), 329-332. http://doi.org/10.25249/0375-7536.1990329332
» http://doi.org/10.25249/0375-7536.1990329332 -
Hawker, L., Uhe, P., Paulo, L., Sosa, J., Savage, J., Sampson, C., & Neal, J. (2022). A 30 m global map of elevation with forests and buildings removed. Environmental Research Letters, 17(2), 024016. http://doi.org/10.1088/1748-9326/ac4d4f
» http://doi.org/10.1088/1748-9326/ac4d4f - Henkes, J. A. (2024). Impactos ambientais na aviação civil: O caso do aeroporto Salgado Filho de Porto Alegre, fortemente impactado pelas chuvas de maio de 2024. Revista Brasileira de Aviação Civil & Ciências Aeronáuticas, 4(2), 1-8.
-
Hodnebrog, Ø., Steensen, B. M., Marelle, L., Alterskjær, K., Dalsøren, S. B., & Myhre, G. (2022). Understanding model diversity in future precipitation projections for South America. Climate Dynamics, 58(5), 1329-1347. http://doi.org/10.1007/s00382-021-05964-w
» http://doi.org/10.1007/s00382-021-05964-w -
Hungr, O., Leroueil, S., & Picarelli, L. (2014). The Varnes classification of landslide types, an update. Landslides, 11(2), 167-194. http://doi.org/10.1007/s10346-013-0436-y
» http://doi.org/10.1007/s10346-013-0436-y -
Instituto Brasileiro de Geografia e Estatística – IBGE. (2023). Censo demográfico 2022: população e domicílios: primeiros resultados. Retrieved in 2024, August 15, from https://biblioteca.ibge.gov.br/visualizacao/livros/liv102011.pdf
» https://biblioteca.ibge.gov.br/visualizacao/livros/liv102011.pdf -
Instituto Nacional de Meteorologia – INMET. (2024a). Tempestades atingem parte da Região Sul nos próximos dias. Retrieved in 2024, August 15, from https://portal.inmet.gov.br/noticias/tempestades-atingem-parte-da-regi%C3%A3o-sul-nos-pr%C3%B3ximos-dias
» https://portal.inmet.gov.br/noticias/tempestades-atingem-parte-da-regi%C3%A3o-sul-nos-pr%C3%B3ximos-dias -
Instituto Nacional de Meteorologia – INMET. (2024b). Sul do Brasil segue sendo atingido por tempestades nos próximos dias. Retrieved in 2024, August 15, from https://portal.inmet.gov.br/noticias/sul-do-brasil-segue-sendo-atingido-por-tempestades-nos-pr%C3%B3ximos-dias
» https://portal.inmet.gov.br/noticias/sul-do-brasil-segue-sendo-atingido-por-tempestades-nos-pr%C3%B3ximos-dias -
Kjerfve, B., & Magill, E. K. E. (1986). Comparative oceanography of coastal lagoons. In D. A. Wolfe (Ed.), Estuarine variability (pp. 63-81). New York: Academic Press. http://doi.org/10.1016/B978-0-12-761890-6.50009-5
» http://doi.org/10.1016/B978-0-12-761890-6.50009-5 - Koks, E., van Ginkel, K., van Marle, M., & Lemnitzer, A. (2021). Brief communication: critical infrastructure impacts of the 2021 mid-July western European flood event. Natural Hazards and Earth System Sciences Discussions, 2021, 1-11.
-
Kreibich, H., Di Baldassarre, G., Vorogushyn, S., Aerts, J. C. J. H., Apel, H., Aronica, G. T., Arnbjerg-Nielsen, K., Bouwer, L. M., Bubeck, P., Caloiero, T., Chinh, D. T., Cortès, M., Gain, A. K., Giampá, V., Kuhlicke, C., Kundzewicz, Z. W., Llasat, M. C., Mård, J., Matczak, P., Mazzoleni, M., Molinari, D., Dung, N. V., Petrucci, O., Schröter, K., Slager, K., Thieken, A. H., Ward, P. J., & Merz, B. (2017). Adaptation to flood risk: results of international paired flood event studies. Earth’s Future, 5(10), 953-965. http://doi.org/10.1002/2017EF000606
» http://doi.org/10.1002/2017EF000606 -
Kunkel, K. E., & Champion, S. M. (2019). An assessment of rainfall from Hurricanes Harvey and Florence relative to other extremely wet storms in the United States. Geophysical Research Letters, 46(22), 13500-13506. http://doi.org/10.1029/2019GL085034
» http://doi.org/10.1029/2019GL085034 -
Lima, S., & Paiva, R. (2024). Análise dos impactos em cenários de rompimento hipotéticos da UHE 14 de julho no tio Taquari-Antas (Nota técnica). Porto Alegre: UFRGS-IPH. Retrieved in 2024, July 29, from https://www.ufrgs.br/iph/nota-tecnica-analise-dos-impactos-em-cenarios-de-rompimento-hipoteticos-da-uhe-14-de-julho-no-rio-taquari-antas/
» https://www.ufrgs.br/iph/nota-tecnica-analise-dos-impactos-em-cenarios-de-rompimento-hipoteticos-da-uhe-14-de-julho-no-rio-taquari-antas/ -
Lopes, V. A. R., Fan, F. M., Pontes, P. R. M., Siqueira, V. A., Collischonn, W., & Marques, M. (2018). A first integrated modelling of a river-lagoon large-scale hydrological system for forecasting purposes. Journal of Hydrology, 565, 177-196. http://doi.org/10.1016/j.jhydrol.2018.08.011
» http://doi.org/10.1016/j.jhydrol.2018.08.011 -
Marcuzzo, F. F. N., Kenup, R. E., Zanetti, H. P., Benvenutti, L., Oliveira, M. P., Wilson, E. S., Acosta, C. C., & Bao, R. (2024). Nota técnica: aferição direta e avalição indireta do nível máximo de rios em estações fluviométricas e marcas de inundação no Rio Grande do Sul na grande cheia de maio de 2024. 6ª versão. Porto Alegre: Serviço Geológico do Brasil – CPRM. Retrieved in 2024, October 31, from https://rigeo.sgb.gov.br/handle/doc/24939.10
» https://rigeo.sgb.gov.br/handle/doc/24939.10 -
Marengo, J. A., Alcantara, E., Cunha, A. P., Seluchi, M., Nobre, C. A., Dolif, G., Goncalves, D., Assis Dias, M., Cuartas, L. A., Bender, F., Ramos, A. M., Mantovani, J. R., Alvalá, R. C., & Moraes, O. L. (2023a). Flash floods and landslides in the city of Recife, Northeast Brazil after heavy rain on May 25-28, 2022: causes, impacts, and disaster preparedness. Weather and Climate Extremes, 39, 100545. http://doi.org/10.1016/j.wace.2022.100545
» http://doi.org/10.1016/j.wace.2022.100545 -
Marengo, J. A., Seluchi, M. E., Cunha, A. P., Cuartas, L. A., Goncalves, D., Sperling, V. B., Ramos, A. M., Dolif, G., Saito, S., Bender, F., Lopes, T. R., Alvala, R. C., & Moraes, O. L. (2023b). Heavy rainfall associated with floods in southeastern Brazil in November-December 2021. Natural Hazards, 116(3), 3617-3644. http://doi.org/10.1007/s11069-023-05827-z
» http://doi.org/10.1007/s11069-023-05827-z -
Marengo, J. A., Cunha, A. P., Seluchi, M. E., Camarinha, P. I., Dolif, G., Sperling, V. B., Alcântara, E. H., Ramos, A. M., Andrade, M. M., Stabile, R. A., Mantovani, J., Park, E., Alvala, R. C., Moraes, O. L., Nobre, C. A., & Goncalves, D. (2024). Heavy rains and hydrogeological disasters on February 18th-19th, 2023, in the city of São Sebastião, São Paulo, Brazil: from meteorological causes to early warnings. Natural Hazards, 120(8), 7997-8024. http://doi.org/10.1007/s11069-024-06558-5
» http://doi.org/10.1007/s11069-024-06558-5 -
Martins-Filho, P. R., Croda, J., Araújo, A. A. D. S., Correia, D., & Quintans-Júnior, L. J. (2024). Catastrophic Floods in Rio Grande do Sul, Brazil: The Need for Public Health Responses to Potential Infectious Disease Outbreaks. Revista da Sociedade Brasileira de Medicina Tropical, 57, e00603-2024. http://doi.org/10.1590/0037-8682-0162-2024
» http://doi.org/10.1590/0037-8682-0162-2024 -
Merz, B., Nguyen, V. D., Guse, B., Han, L., Guan, X., Rakovec, O., Samaniego, L., Ahrens, B., & Vorogushyn, S. (2024). Spatial counterfactuals to explore disastrous flooding. Environmental Research Letters, 19(4), 044022. http://doi.org/10.1088/1748-9326/ad22b9
» http://doi.org/10.1088/1748-9326/ad22b9 - Miranda, A. (2016). Floods and extension plans: discourse and projects in Southern Brazil. In International Planning History Society Proceedings (Vol. 2). Delft, The Netherlands: IPHS.
-
Mohr, S., Ehret, U., Kunz, M., Ludwig, P., Caldas-Alvarez, A., Daniell, J. E., Ehmele, F., Feldmann, H., Franca, M. J., Gattke, C., Hundhausen, M., Knippertz, P., Küpfer, K., Mühr, B., Pinto, J. G., Quinting, J., Schäfer, A. M., Scheibel, M., Seidel, F., & Wisotzky, C. (2023). A multi-disciplinary analysis of the exceptional flood event of July 2021 in central Europe – part 1: event description and analysis. Natural Hazards and Earth System Sciences, 23(2), 525-551. http://doi.org/10.5194/nhess-23-525-2023
» http://doi.org/10.5194/nhess-23-525-2023 -
Montanari, A., Merz, B., & Blöschl, G. (2024). HESS Opinions: the sword of Damocles of the impossible flood. Hydrology and Earth System Sciences, 28(12), 2603-2615. http://doi.org/10.5194/hess-28-2603-2024
» http://doi.org/10.5194/hess-28-2603-2024 -
Moraes, S. R., Collischonn, W., Buffon, F. T., & Eckhardt, R. R. (2024). Revisão e consolidação da série histórica dos níveis das cheias do rio Taquari em Lajeado de 1939 a 2023 (Nota técnica). Porto Alegre: UFRGS. Retrieved in 2024, March 19, from https://lume.ufrgs.br/
» https://lume.ufrgs.br/ -
Munar, A. M., Cavalcanti, J. R., Bravo, J. M., Fan, F. M., Motta-Marques, D., & Fragoso Junior, C. R. (2018). Coupling large-scale hydrological and hydrodynamic modeling: toward a better comprehension of watershed-shallow lake processes. Journal of Hydrology, 564, 424-441. http://doi.org/10.1016/j.jhydrol.2018.07.045
» http://doi.org/10.1016/j.jhydrol.2018.07.045 -
Nanditha, J. S., Kushwaha, A. P., Singh, R., Malik, I., Solanki, H., Chuphal, D. S., Dangar, S., Mahto, S. S., Vegad, U., & Mishra, V. (2023). The Pakistan flood of August 2022: causes and implications. Earth’s Future, 11(3), e2022EF003230. http://doi.org/10.1029/2022EF003230
» http://doi.org/10.1029/2022EF003230 -
National Aeronautics and Space Administration – NASA. NASA Disasters Program. (2024). Item details. Retrieved in 2024, September 15, from https://maps.disasters.nasa.gov/arcgis/home/item.html?id=a442900ab36549ffb50cd722307ffa43
» https://maps.disasters.nasa.gov/arcgis/home/item.html?id=a442900ab36549ffb50cd722307ffa43 -
National Oceanic and Atmospheric Administration – NOAA. National Centers for Environmental Prediction – NCEP. (2011). NOAA/NCEP Global Forecast System (GFS) Atmospheric Model. Retrieved in 2024, October 9, from http://pacioos.org/metadata/ncep_global.html
» http://pacioos.org/metadata/ncep_global.html - Nectoux, M., Giacomelli, L., Fan, F. M., Fleischmann, A. S., Siqueira, V. A., Custodio, M., & Collischonn, W. (2019). Previsão de cheias e produção de avisos no estado do Rio Grande do Sul através da sala de situação SEMA/RS e modelo MGB. In Anais do XXIII Simpósio Brasileiro de Recursos Hídricos (Vol. 1, p. 1). Porto Alegre: ABRHidro.
-
New York Times. (2024). Images of a Brazilian city underwater. Retrieved in 2024, October 9, from https://www.nytimes.com/2024/05/08/world/americas/brazil-flooding-photos.html
» https://www.nytimes.com/2024/05/08/world/americas/brazil-flooding-photos.html -
Nonnemacher, L., & Fan, F. M. (2023). Análise da viabilidade econômica da previsão de cheias no Rio Grande do Sul. Revista de Gestão de Água da América Latina, 20, 1-15. http://doi.org/10.21168/rega.v20e8
» http://doi.org/10.21168/rega.v20e8 -
O Globo. (2024a). Maioria de homens e moradores de Canoas: qual o perfil das vítimas das enchentes do Rio Grande do Sul. O Globo Retrieved in 2024, August 15, from https://oglobo.globo.com/brasil/sos-rio-grande-do-sul/noticia/2024/05/14/maioria-de-homens-e-moradores-de-canoas-que-sao-as-vitimas-das-enchentes-do-rio-grande-do-sul.ghtml
» https://oglobo.globo.com/brasil/sos-rio-grande-do-sul/noticia/2024/05/14/maioria-de-homens-e-moradores-de-canoas-que-sao-as-vitimas-das-enchentes-do-rio-grande-do-sul.ghtml -
O Globo. (2024b). Impacto das enchentes do Rio Grande do Sul pode chegar a 97 bilhões. O Globo Retrieved in 2024, August 15, from https://oglobo.globo.com/blogs/miriam-leitao/post/2024/07/impacto-das-enchentes-do-rio-grande-do-sul-pode-chegar-a-r-97-bilhoes-para-a-economia-brasileira-estima-a-cnc.ghtml
» https://oglobo.globo.com/blogs/miriam-leitao/post/2024/07/impacto-das-enchentes-do-rio-grande-do-sul-pode-chegar-a-r-97-bilhoes-para-a-economia-brasileira-estima-a-cnc.ghtml -
O Globo. (2024c). Cidade do RS que vai receber Lula e comitiva tem metade da população fora de casa, 12 mortes e risco de deslizamentos após enchentes. Retrieved in 2024, August 15, from https://g1.globo.com/rs/rio-grande-do-sul/noticia/2024/06/06/cidade-do-rs-que-vai-receber-lula-e-comitiva-tem-metade-da-populacao-fora-de-casa-12-mortes-e-risco-de-deslizamentos-apos-enchentes.ghtml
» https://g1.globo.com/rs/rio-grande-do-sul/noticia/2024/06/06/cidade-do-rs-que-vai-receber-lula-e-comitiva-tem-metade-da-populacao-fora-de-casa-12-mortes-e-risco-de-deslizamentos-apos-enchentes.ghtml - Oliveira, G. G. (2023). Desastre hidrológico ocorrido em janeiro de 2010 na porção central do Rio Grande do Sul (RS). In F. Zanandrea, M. Kobiyama, G. P. Michel, A. S. Fleischmann & W. Collischonn (Eds.), Desastres e água: eventos históricos no Brasil. Porto Alegre: ABRHidro.
-
Operador Nacional do Sistema Elétrico – ONS. (2024). Histórico da operação: dados gerais. Retrieved in 2024, September 15, from https://www.ons.org.br/paginas/resultados-da-operacao/historico-da-operacao/dados-gerais
» https://www.ons.org.br/paginas/resultados-da-operacao/historico-da-operacao/dados-gerais - Paiva, R. C. D., Collischonn, W., Kolling, A., & Miranda, P. T. (2024a). Cooperação em tecnologias para análises hidrológicas em escala nacional. Subprojeto Clima: sensibilidade de vazões a variabilidade e mudanças climáticas: relatório final: IPH-ANA-HGE-CLIMA-A2 Porto Alegre: UFRGS.
- Paiva, R. C. D., Collischonn, W., Miranda, P. T., Fagundes, H. O. W., Kolling, A., Castro, L., Rossi, J., Matte, G., Laipelt, L., Alves, W., & Petry, I. (2024b). Cooperação em tecnologias para análises hidrológicas em escala nacional. Subprojeto Clima: impactos de mudanças climáticas em extremos de vazão (cheias e estiagens): relatório final: IPH-ANA-HGE-CLIMA-A3 Porto Alegre: UFRGS.
-
Paiva, R., Collischonn, W., Miranda, P., Petry, I., Dornelles, F., Goldenfum, J., Fan, F., Ruhoff, A., & Fagundes, H. (2024c). Critérios hidrológicos para adaptação à mudança climática: chuvas e cheias extremas na Região Sul do Brasil (Nota técnica). Porto Alegre: UFRGS-IPH. Retrieved in 2024, November 4, from https://www.ufrgs.br/iph/wp-content/uploads/2024/05/CriteriosAdaptacaoMudancaClimaticaChuvasCheiasExtremasSul.pdf
» https://www.ufrgs.br/iph/wp-content/uploads/2024/05/CriteriosAdaptacaoMudancaClimaticaChuvasCheiasExtremasSul.pdf -
Pappenberger, F., Cloke, H. L., Parker, D. J., Wetterhall, F., Richardson, D. S., & Thielen, J. (2015). The monetary benefit of early flood warnings in Europe. Environmental Science & Policy, 51, 278-291. http://doi.org/10.1016/j.envsci.2015.04.016
» http://doi.org/10.1016/j.envsci.2015.04.016 -
Peel, M. C., Finlayson, B. L., & McMahon, T. A. (2007). Updated world map of the Köppen-Geiger climate classification. Hydrology and Earth System Sciences, 11(5), 1633-1644. http://doi.org/10.5194/hess-11-1633-2007
» http://doi.org/10.5194/hess-11-1633-2007 - Petry, I., Paiva, R. C. D., Collischonn, W., Miranda, P. T., Rossi, J. B., Fagundes, H. D. O., Ribeiro, L. C., Kolling Neto, A., Alves, W. R. G., Fernandez, G. M. R., Souza, S. A., & Araujo, A. A. (2023). Change on flood discharge frequency in South America in the next decades: assessment of the CMIP6 climate projection. In Anais do XXV Simpósio Brasileiro de Recursos Hídricos. Porto Alegre: ABRHidro.
-
Pinto, E. J. A., Azambuja, A. M. S., Farias, J. A. M., Salgueiro, J. P. B., & Pickbrenner, K. (Eds.). (2011). Atlas pluviométrico do Brasil: isoietas mensais, isoietas trimestrais, isoietas anuais, meses mais secos, meses mais chuvosos, trimestres mais secos, trimestres mais chuvosos (1 DVD. Escala 1.5:000.000. SIG - versão 2.0 – atualizada em 11/2011; Levantamento da Geodiversidade). Brasília: CPRM. Retrieved in 2024, August 27, from https://www.sgb.gov.br/isoietas
» https://www.sgb.gov.br/isoietas -
Possa, T. M., Collares, G. L., Boeira, L. D. S., Jardim, P. F., Fan, F. M., & Terra, V. S. S. (2022a). Fully coupled hydrological-hydrodynamic modeling of a basin–river–lake transboundary system in Southern South America. Journal of Hydroinformatics, 24(1), 93-112. http://doi.org/10.2166/hydro.2021.096
» http://doi.org/10.2166/hydro.2021.096 -
Possa, T. M., Collischonn, W., Jardim, P. F., & Fan, F. M. (2022b). Hydrological-hydrodynamic simulation and analysis of the possible influence of the wind in the extraordinary flood of 1941 in Porto Alegre. Revista Brasileira de Recursos Hídricos, 27, e29. http://doi.org/10.1590/2318-0331.272220220028
» http://doi.org/10.1590/2318-0331.272220220028 -
Possantti, I. (Ed.). (2024). Banco de dados das cheias na Região Hidrográfica do Lago Guaíba em Maio de 2024 (version 1.2) [Data set]. Zenodo. Retrieved in 2024, August 30, from https://zenodo.org/doi/10.5281/zenodo.11164049
» https://zenodo.org/doi/10.5281/zenodo.11164049 -
Possantti, I., Müller, J., & Ruhoff, A. (Eds.). (2024). Cheias no Rio Grande do Sul: base de dados e informações geográficas na Região Hidrográfica do Lago Guaíba e na Lagoa dos Patos em 2024. UFRGS. Retrieved in 2024, August 30, from https://storymaps.arcgis.com/stories/a81d69f4bccf42989609e3fe64d8ef48
» https://storymaps.arcgis.com/stories/a81d69f4bccf42989609e3fe64d8ef48 - Rambo, B. (2005). A fisionomia do Rio Grande do Sul: ensaio de monografia natural São Leopoldo: Ed. Unisinos.
- Rauber, V. (1992). Prevenir é o melhor remédio (47 p.). Porto Alegre: Prefeitura Municipal.
-
Reboita, M. S., Mattos, E. V., Capucin, B. C., Souza, D. O. D., & Ferreira, G. W. D. S. (2024). A multi-scale analysis of the extreme precipitation in southern Brazil in April/May 2024. Atmosphere, 15(9), 1123. http://doi.org/10.3390/atmos15091123
» http://doi.org/10.3390/atmos15091123 -
Rhein, B., & Kreibich, H. (2024). Causes of the exceptionally high number of fatalities in the Ahr valley, Germany, during the 2021 flood. EGUsphere, 2024, 1-12. http://doi.org/10.5194/egusphere-2024-2066
» http://doi.org/10.5194/egusphere-2024-2066 - Rio Grande do Sul. Departamento Nacional de Obras de Saneamento – DNOS. (1968). Estudo de viabilidade técnico-econômica das obras de defesa de Porto Alegre, Canoas e São Leopoldo contra inundações. Porto Alegre.
-
Rio Grande do Sul. Rede Estadual de Educação. (2024a). Mapa do retorno. Retrieved in 2024, August 30, from https://educacao.rs.gov.br/mapa-do-retorno
» https://educacao.rs.gov.br/mapa-do-retorno - Rio Grande do Sul. Governo do Estado. (2024b, 21 de maio). Decreto nº 57626 de 21/05/2024. Altera o Decreto nº 57600/2024, que reitera o estado de calamidade pública no território do Estado do Rio Grande do Sul afetado pelos eventos climáticos de chuvas intensas, COBRADE 1.3.2.1.4, que ocorrem no período de 24 de abril ao mês de maio de 2024, e especifica os Municípios atingidos. Diário Oficial do Estado, Porto Alegre.
-
Rio Grande do Sul. Governo do Estado. (2024c). Mapa Único do Plano Rio Grande. Retrieved in 2024, August 30, from https://mup.rs.gov.br/
» https://mup.rs.gov.br/ -
Rio Grande do Sul. (2024d). Defesa Civil atualiza balanço das enchentes no RS-20/8. Retrieved in 2024, September 30, from https://defesacivil.rs.gov.br/defesa-civil-atualiza-balanco-das-enchentes-no-rs-10-7-66b67813ba21f-66c4eed627af9
» https://defesacivil.rs.gov.br/defesa-civil-atualiza-balanco-das-enchentes-no-rs-10-7-66b67813ba21f-66c4eed627af9 -
Rio Grande do Sul. Defesa Civil. (2024e). Boletim Defesa Civil atualiza balanço das enchentes no RS - 24/5, 18h. Retrieved in 2024, September 30, from https://estado.rs.gov.br/defesa-civil-atualiza-balanco-das-enchentes-no-rs-24-5-18h
» https://estado.rs.gov.br/defesa-civil-atualiza-balanco-das-enchentes-no-rs-24-5-18h -
Rio Grande do Sul. Governo do Estado. (2024f). Relatório de perdas referente às chuvas e cheias extremas no Estado do Rio Grande do Sul em maio de 2024. Retrieved in 2024, August 15, from https://estado.rs.gov.br/upload/arquivos/202406/relatorio-sisperdas-evento-enchentes-em-maio-2024.pdf
» https://estado.rs.gov.br/upload/arquivos/202406/relatorio-sisperdas-evento-enchentes-em-maio-2024.pdf -
Rio Grande do Sul. Governo do Estado. Secretaria da Saúde. (2024g). Leptospirose. Retrieved in 2024, October 7, from https://saude.rs.gov.br/leptospirose
» https://saude.rs.gov.br/leptospirose -
Rio Grande do Sul. Governo do Estado. (2024h). Gabinete de Crise avalia cenário meteorológico e prioriza ações de resgate de famílias ilhadas. Retrieved in 2024, October 9, from https://www.estado.rs.gov.br/gabinete-de-crise-avalia-cenario-meteorologico-e-prioriza-acoes-de-resgate-de-familias-ilhadas
» https://www.estado.rs.gov.br/gabinete-de-crise-avalia-cenario-meteorologico-e-prioriza-acoes-de-resgate-de-familias-ilhadas -
Roberts, C. D., Senan, R., Molteni, F., Boussetta, S., Mayer, M., & Keeley, S. P. E. (2018). Climate model configurations of the ECMWF Integrated Forecasting System (ECMWF-IFS cycle 43r1) for HighResMIP. Geoscientific Model Development, 11(9), 3681-3712. http://doi.org/10.5194/gmd-11-3681-2018
» http://doi.org/10.5194/gmd-11-3681-2018 - Roche, J. (1955). Porto Alegre, Metrópole do Brasil Meridional. Boletim Paulista de Geografia, (19), 30-51.
-
Santos, G. B., Collares, G. L., Santos Boeira, L., & Possa, T. M. (2024). Quantitative water balance of surface waters for a transboundary basin in South America. Environment, Development and Sustainability, 26(8), 21755-21781. http://doi.org/10.1007/s10668-023-03430-7
» http://doi.org/10.1007/s10668-023-03430-7 -
Scheibe, A. C., Piccinini, L. T. S., & Braga, A. D. C. (2015). Evolução urbana do município de Lajeado: um estudo configuracional. Revista Políticas Públicas & Cidades, 2(2), 7-27. http://doi.org/10.23900/2359-1552v1n2-01-07-27-2021-01
» http://doi.org/10.23900/2359-1552v1n2-01-07-27-2021-01 -
Schutz, J. A. V., & Graebin, C. M. G. (2024). Canoas (RS) e a construção do patrimônio cultural: elementos históricos, desafios socioespaciais e ambientais. Revista Memória em Rede, 16(30), 181-206. http://doi.org/10.15210/rmr.v16i30.25585
» http://doi.org/10.15210/rmr.v16i30.25585 -
Serviço Geológico do Brasil – SGB. (2024). Bacias monitoradas: bacia do rio Caí Retrieved in 2024, October 9, from https://www.sgb.gov.br/sace/index_bacias_monitoradas.php?getbacia=bcai#
» https://www.sgb.gov.br/sace/index_bacias_monitoradas.php?getbacia=bcai# - Silva, T. S., Toldo Junior, E. E., Nunes, J. C. R., Castro, N., Funke, N., Nievinski, F., Manica, R., Puhl, E., Fick, C., Scottá, F., Silva, M. L. R., & Ávila, I. M. (2024). Nota técnica: vazões no Rio Guaíba durante os picos da enchente de maio de 2024 (2 p.). Porto Alegre: UFRGS.
- Silveira, A. L. L. (2020). Chuvas e vazões da grande enchente de 1941 em Porto Alegre/RS. Boletim Geográfico do Rio Grande do Sul, 35, 69-90.
-
Silveira, P. O., Guasselli, L. A., Oliveira, G. G. D., & Nascimento, V. F. (2021). Relationship between cases of hepatitis A and flood areas, municipality of Encantado, Rio Grande do Sul, Brazil. Ciência & Saúde Coletiva, 26, 721-728. http://doi.org/10.1590/1413-81232020261.30592018
» http://doi.org/10.1590/1413-81232020261.30592018 - Silveira, A. L. L., Dornelles, F., Goldenfum, J. A., Possa, T. M., Collischonn, W., & Moraes, S. R. (2023). A histórica cheia de 1941 na bacia hidrográfica do Guaíba. In F. Zanandrea, M. Kobiyama, G. P. Michel, A. S. Fleischmann & W. Collischonn (Eds.), Desastres e água: eventos históricos no Brasil. Porto Alegre: ABRHidro.
- Sirko, W., Kashubin, S., Ritter, M., Annkah, A., Bouchareb, Y. S. E., Dauphin, Y., Keysers, D., Neumann, M., Cisse, M., & Quinn, J. A. (2021). Continental-scale building detection from high resolution satellite imagery. arXiv, 2021, 2107.12283.
-
Skamarock, W. C., Klemp, J. B., Dudhia, J., Gill, D. O., Barker, D. M., Duda, M. G., Huang, X. Y., Wang, W., & Powers, J. G. (2008). A description of the Advanced Research WRF version 3 (NCAR Technical Note, No. NCAR/TN-475+STR, 113 p.). Boulder: NCAR. http://doi.org/10.5065/D68S4MVH
» http://doi.org/10.5065/D68S4MVH -
Slavovsky, T. (2017). Windy. Retrieved in 2024, October 9, from https://www.ecmwf.int/en/elibrary/17309-windy
» https://www.ecmwf.int/en/elibrary/17309-windy -
Streck, E. V., Kämpf, N., Dalmolin, R. S. D., Klamt, E., Nascimento, P. C., Giasson, E., & Pinto, L. F. S. (2018). Solos do Rio Grande do Sul (3. ed. rev. ampl., 252 p.). Porto Alegre: Emater/RS-Ascar. Retrieved in 2024, October 9, from https://www.bibliotecaagptea.org.br/agricultura/solos/livros/SOLOS%203%20EDICAO.pdf
» https://www.bibliotecaagptea.org.br/agricultura/solos/livros/SOLOS%203%20EDICAO.pdf -
Swinbank, R., Kyouda, M., Buchanan, P., Froude, L., Hamill, T. M., Hewson, T. D., Keller, J. H., Matsueda, M., Methven, J., Pappenberger, F., Scheuerer, M., Titley, H. A., Wilson, L., & Yamaguchi, M. (2016). The TIGGE project and its achievements. Bulletin of the American Meteorological Society, 97(1), 49-67. http://doi.org/10.1175/BAMS-D-13-00191.1
» http://doi.org/10.1175/BAMS-D-13-00191.1 - Thieken, A., Bubeck, P., & Zenker, M. L. (2023). Fatal incidents during the flood of July 2021 in North Rhine-Westphalia, Germany: what can be learnt for future flood risk management? Journal of Coastal and Riverine Flood Risk, 2, 5.
-
Toldo Junior, E. E., Dillenburg, S. R., Corrêa, I. C. S., Almeida, L. E. S. B., Weschenfelder, J., & Gruber, N. L. S. (2006). Sedimentação de longo e curto período na Lagoa dos Patos, Sul do Brasil. Pesquisas em Geociências, 33(2), 79-86. http://doi.org/10.22456/1807-9806.19516
» http://doi.org/10.22456/1807-9806.19516 - Torres, L. H. (2012). Águas de maio: a enchente de 1941 em Rio Grande. Historiae, 3(3), 239-254.
- Tucci, C. E. (1999). Conflitos do controle de inundação ribeirinha em Porto Alegre. In Anais do XIII Simpósio Brasileiro de Recursos Hídricos (pp. 1-15). Belo Horizonte: SBRH.
-
Universidade Federal do Rio Grande do Sul – UFRGS. (2024). IPH: notícias. Retrieved in 2024, October 9, from https://www.ufrgs.br/iph/noticias/
» https://www.ufrgs.br/iph/noticias/ -
Valor. (2024). Flood damage in Rio Grande do Sul reaches R$87bn, IDB says. Retrieved in 2024, October 9, from https://valorinternational.globo.com/economy/news/2024/09/23/flood-damage-in-rio-grande-do-sul-reaches-r87bn-idb-says.ghtml
» https://valorinternational.globo.com/economy/news/2024/09/23/flood-damage-in-rio-grande-do-sul-reaches-r87bn-idb-says.ghtml - Varnes, D. J. (1978). Slope movement types and processes. In R. L. Schuster & R. J. Krizek (Eds.), Landslides, analysis and control (Special Report, No. 176: Transportation Research Board, pp. 11-33). Washington, D.C.: National Academy of Sciences.
-
Villwock, J. A., Tomazelli, L. J., Loss, E. L., Dehnhardt, E. A., Bachi, F. A., & Dehnhardt, B. A. (2020). Geology of the Rio Grande do Sul coastal province. In J. Rabassa (Ed.), Quaternary of South America and Antarctic Peninsula (pp. 79-97). London: CRC Press. http://doi.org/10.1201/9781003079316-5
» http://doi.org/10.1201/9781003079316-5 - Wildner, W., Ramgrab, G. E., Lopes, R. C., & Iglesias, C. M. F. (2008). Geologia e recursos minerais do estado do Rio Grande do Sul (Escala 1:750.000). Porto Alegre: Programa Geologia do Brasil, CPRM.
- Zanandrea, F., Kobiyama, M., Michel, G. P., Fleischmann, A., & Collischonn, W. (2023). Desastres e água: eventos históricos no Brasil Porto Alegre: ABRHidro.
-
Ziliotto, M., Chies, J. A. B., & Ellwanger, J. H. (2024). Extreme weather events and pathogen pollution fuel infectious diseases: the 2024 flood-related leptospirosis outbreak in Southern Brazil and other red lights. Pollutants, 4(3), 424-433. http://doi.org/10.3390/pollutants4030028
» http://doi.org/10.3390/pollutants4030028