
ABSTRACT
Lactation records from cows of the southwestern Paraná state, Brazil, form the dataset of this study. We applied the information-theoretic approach to evaluate the ability of the nonlinear Wood, Brody, Dijkstra, and Gamma functions to fit to these data by employing a two-step technique based on nonlinear mixed-effects models and generalized linear mixed-effects models. Wood's equation was fitted with the combination of a first-order autoregressive correlation structure and a variance function to account for heteroscedasticity. This version was the best choice to mimic lactation records. Some geometric attributes of Wood's model were deduced, mainly the ascending specific rate from parturition to peak milk yield and the descending specific rate as a measure of the lactation persistence of the milk yield at peak production. Breed and parity order of the cows were assumed as fixed effects to obtain a reliable model fitting process. Regardless of breed, first-order parity cows had greater persistency than their older counterparts, and the greater the ascending rate of milk yield from the parturition to the peak, the sharper the decrease in milk yield post-peak; therefore, the rates (absolute values) of ascending and descending phases correlated positively. Nonetheless, the actual estimated values of the descending phase rates are negative. Wood's equation was flexible enough to mimic either concave- and convex-shaped lactation profiles. The correlations between both peak milk yield and random estimates for β with total milk yield per lactation were positive. However, peak milk yield might not be the only variable used for ranking cows; the total milk yield integrates all information of the lactation profile through the estimated parameters of Wood's equation.
Keywords:
dairy cattle; generalized linear mixed-effects model; lactation models; nonlinear mixed-effects model; nonlinear parameter estimation
1. Introduction
Lactation functions provide an elegant example to study the applicability of mathematical models to explain nonlinear phenomena in animal science. Scientists have proposed several mathematical functions to mimic milk production records over time ( Brody et al., 1924Brody, S.; Turner, C. W. and Ragsdale, A. C. 1924. The relation between the initial rise and the subsequent decline of milk secretion following parturition. The Journal of General Physiology 6:541-545. https://doi.org/10.1085/jgp.6.5.541
https://doi.org/10.1085/jgp.6.5.541...
; Wood, 1967Wood, P. D. P. 1967. Algebraic model of the lactation curve in cattle. Nature 216:164-165. https://doi.org/10.1038/216164a0
https://doi.org/10.1038/216164a0...
; Grossman and Koops, 1988Grossman, M. and Koops, W. J. 1988. Multiphasic analysis of lactation curves in dairy cattle. Journal of Dairy Science 71:1598-1608. https://doi.org/10.3168/jds.S0022-0302(88)79723-4
https://doi.org/10.3168/jds.S0022-0302(8...
; Rook et al., 1993Rook, A. J.; France, J. and Dhanoa, M. S. 1993. On the mathematical description of lactation curves. The Journal of Agricultural Science 121:97-102. https://doi.org/10.1017/S002185960007684X
https://doi.org/10.1017/S002185960007684...
; Dijkstra et al., 1997Dijkstra, J.; France, J.; Dhanoa, M. S.; Maas, J. A.; Hanigan, M. D.; Rook, A. J. and Beever, D. E. 1997. A model to describe growth patterns of the mammary gland during pregnancy and lactation. Journal of Dairy Science 80:2340-2354. https://doi.org/10.3168/jds.S0022-0302(97)76185-X
https://doi.org/10.3168/jds.S0022-0302(9...
; Pollott, 2000Pollott, G. E. 2000. A biological approach to lactation curve analysis for milk yield. Journal of Dairy Science 83:2448-2458. https://doi.org/10.3168/jds.S0022-0302(00)75136-8
https://doi.org/10.3168/jds.S0022-0302(0...
). Specialized dairy breeds typically exhibit convex-shaped lactation profiles with ascending, peak, and descending phases ( Brody et al., 1924Brody, S.; Turner, C. W. and Ragsdale, A. C. 1924. The relation between the initial rise and the subsequent decline of milk secretion following parturition. The Journal of General Physiology 6:541-545. https://doi.org/10.1085/jgp.6.5.541
https://doi.org/10.1085/jgp.6.5.541...
). Nevertheless, there are literature reports that present the difficulty of some mathematical models to fit atypical lactation profiles, which include profiles with an insufficient number of records to characterize the entire lactation, concave-shaped profiles, as well as those profiles that present an irregular distribution of milk records over time. Furthermore, some studies have emphasized that genetics, diet, parity order, season, metabolic disorders, diseases, and other environmental aspects are responsible for the occurrence of atypical lactation profiles ( Wood, 1968Wood, P. D. P. 1968. Factors affecting persistency of lactation in cattle. Nature 218:894. https://doi.org/10.1038/218894a0
https://doi.org/10.1038/218894a0...
, 1970Wood, P. D. P. 1970. The relationship between the month of calving and milk production. Animal Production 12:253-259. https://doi.org/10.1017/S0003356100038824
https://doi.org/10.1017/S000335610003882...
, 1972Wood, P. D. P. 1972. A note on seasonal fluctuations in milk production. Animal Production 15:89-92. https://doi.org/10.1017/S0003356100011260
https://doi.org/10.1017/S000335610001126...
, 1976Wood, P. D. P. 1976. Algebraic models of the lactation curves for milk, fat and protein production, with estimates of seasonal variation. Animal Production 22:35-40. https://doi.org/10.1017/S000335610003539X
https://doi.org/10.1017/S000335610003539...
, 1980Wood, P. D. P. 1980. Breed variations in the shape of the lactation curve of cattle and their implications for efficiency. Animal Production 31:133-141. https://doi.org/10.1017/S0003356100024363
https://doi.org/10.1017/S000335610002436...
; Grossman and Koops, 1988Grossman, M. and Koops, W. J. 1988. Multiphasic analysis of lactation curves in dairy cattle. Journal of Dairy Science 71:1598-1608. https://doi.org/10.3168/jds.S0022-0302(88)79723-4
https://doi.org/10.3168/jds.S0022-0302(8...
; Olori et al., 1999Olori, V. E.; Brotherstone, S.; Hill, W. G. and McGuirk, B. J. 1999. Fit of standard models of the lactation curve to weekly records of milk production of cows in a single herd. Livestock Production Science 58:55-63. https://doi.org/10.1016/S0301-6226(98)00194-8
https://doi.org/10.1016/S0301-6226(98)00...
; Rekik and Ben Gara, 2004Rekik, B. and Ben Gara, A. 2004. Factors affecting the occurrence of atypical lactations for Holstein−Friesian cows. Livestock Production Science 87:245-250. https://doi.org/10.1016/j.livprodsci.2003.09.023
https://doi.org/10.1016/j.livprodsci.200...
; Dijkstra et al., 2010Dijkstra, J.; Lopez, S.; Bannink, A.; Dhanoa, M. S.; Kebreab, E.; Odongo, N. E.; Nasri, M. H. F.; Behera, U. K.; Hernandez-Ferrer, D. and France, J. 2010. Evaluation of a mechanistic lactation model using cow, goat and sheep data. Journal of Agricultural Science 148:249-262. https://doi.org/10.1017/S0021859609990578
https://doi.org/10.1017/S002185960999057...
; Hossein-Zadeh, 2016Hossein-Zadeh, N. G. 2016. Comparison of non-linear models to describe the lactation curves for milk yield and composition in buffaloes ( Bubalus bubalis ). Animal 10:248-261. https://doi.org/10.1017/S1751731115001846
https://doi.org/10.1017/S175173111500184...
; Ahmed et al., 2019Ahmed, B. A.; Laurence, P.; Pierre, G. and Olivier, M. 2019. Lactation curve model with explicit representation of perturbations as a phenotyping tool for dairy livestock precision farming. bioRxiv 661249. https://doi.org/10.1101/661249
https://doi.org/10.1101/661249...
). These factors might explain why some models are unsuccessful in fitting some lactation records. Therefore, there is a need to investigate flexible models that are applicable to a wide range of situations to describe the nonlinear phenomenon of lactation. Among them, we can list some models that fitted lactation profiles adequately ( Ferreira et al., 2015Ferreira, A. G. T.; Henrique, D. S.; Vieira, R. A. M.; Maeda, E. M. and Valotto, A. A. 2015. Fitting mathematical models to lactation curves from holstein cows in the southwestern region of the state of Parana, Brazil. Anais da Academia Brasileira de Ciências 87:503-517. https://doi.org/10.1590/0001-3765201520130514
https://doi.org/10.1590/0001-37652015201...
), i.e., the models proposed by Brody et al. (1924)Brody, S.; Turner, C. W. and Ragsdale, A. C. 1924. The relation between the initial rise and the subsequent decline of milk secretion following parturition. The Journal of General Physiology 6:541-545. https://doi.org/10.1085/jgp.6.5.541
https://doi.org/10.1085/jgp.6.5.541...
, Wood (1967)Wood, P. D. P. 1967. Algebraic model of the lactation curve in cattle. Nature 216:164-165. https://doi.org/10.1038/216164a0
https://doi.org/10.1038/216164a0...
, and Dijkstra et al. (1997)Dijkstra, J.; France, J.; Dhanoa, M. S.; Maas, J. A.; Hanigan, M. D.; Rook, A. J. and Beever, D. E. 1997. A model to describe growth patterns of the mammary gland during pregnancy and lactation. Journal of Dairy Science 80:2340-2354. https://doi.org/10.3168/jds.S0022-0302(97)76185-X
https://doi.org/10.3168/jds.S0022-0302(9...
, and we suggest the Gamma probability density function as a generalized form of Wood's model.
The development of tools from theories of nonlinear mixed-effects models and generalized linear mixed-effects models ( Pinheiro and Bates, 2000Pinheiro, J. C. and Bates, D. M. 2000. Mixed-effects models in S and S-PLUS. Springer-Verlag Inc., New York. ; Littell et al., 2006Littell, R. C.; Milliken, G. A.; Stroup, W. W.; Wolfinger, R. D. and Schabenberger, O. 2006. SAS®for mixed models. 2nd ed. SAS Institute Inc., Cary, USA. ; Vonesh, 2012Vonesh, E. F. 2012. Generalized linear and nonlinear models for correlated data: theory and applications using SAS®. SAS Institute Inc., Cary. ; Stroup, 2013Stroup, W. W. 2013. Generalized linear mixed models: Modern concepts, methods and applications. Taylor & Francis Group, LLC, Boca Raton. ) has provided instruments to describe several nonlinear phenomena in animal science ( Zanton and Heinrichs, 2009Zanton, G. I. and Heinrichs, A. J. 2009. Evaluation of modeling procedure for fitting in situ feed degradation profiles. Journal of Animal Science 87:2080-2088. https://doi.org/10.2527/jas.2008-1180
https://doi.org/10.2527/jas.2008-1180...
; Strathe et al., 2010Strathe, A. B.; Danfaer, A.; Sørensen, H. and Kebreab, E. 2010. A multilevel nonlinear mixed-effects approach to model growth in pigs. Journal of Animal Science 88:638-649. https://doi.org/10.2527/jas.2009-1822
https://doi.org/10.2527/jas.2009-1822...
; Albertini et al., 2012Albertini, T. Z.; Medeiros, S. R.; Torres Júnior, R. A. A.; Zocchi, S. S.; Oltjen, J. W.; Strathe, A. B. and Lanna, D. P. D. 2012. A methodological approach to estimate the lactation curve and net energy and protein requirements of beef cows using nonlinear mixed-effects modeling. Journal of Animal Science 90:3867-3878. https://doi.org/10.2527/jas.2010-3540
https://doi.org/10.2527/jas.2010-3540...
; Araujo et al., 2015Araujo, R. P.; Vieira, R. A. M.; Rocha, N. S.; Abreu, M. L. C.; Glória, L. S.; Rohem Júnior, N. M. and Fernandes, A. M. 2015. Long-term growth of body, body parts and composition of gain of dairy goat wethers. Journal of Agricultural Science 153:1321-1340. https://doi.org/10.1017/S0021859615000532
https://doi.org/10.1017/S002185961500053...
; Vieira et al., 2018Vieira, R. A. M.; Rohem Júnior, N. M.; Gomes, R. S.; Oliveira, T. S.; Bendia, L. C. R.; Azevedo, F. H. V.; Barbosa, D. L.; Glória, L. S. and Rodrigues, M. T. 2018. The ontogenetic allometry of body morphology and chemical composition in dairy goat wethers. Animal 12:538-553. https://doi.org/10.1017/S1751731117001884
https://doi.org/10.1017/S175173111700188...
, 2020Rohem Júnior, N. M.; Silva, M. C.; Abreu, M. L. C.; Oliveira, J. G.; Glória, L. S.; Tedeschi, L. O. and Vieira, R. A. M. 2020. The transit of external markers throughout the ruminant digestive tract: 1. The fitting quality of models to marker profiles in feces using an information-theoretic approach. Animal Feed Science and Technology 261:114407. https://doi.org/10.1016/j.anifeedsci.2020.114407
https://doi.org/10.1016/j.anifeedsci.202...
; Rohem Júnior et al., 2020Rohem Júnior, N. M.; Silva, M. C.; Abreu, M. L. C.; Oliveira, J. G.; Glória, L. S.; Tedeschi, L. O. and Vieira, R. A. M. 2020. The transit of external markers throughout the ruminant digestive tract: 1. The fitting quality of models to marker profiles in feces using an information-theoretic approach. Animal Feed Science and Technology 261:114407. https://doi.org/10.1016/j.anifeedsci.2020.114407
https://doi.org/10.1016/j.anifeedsci.202...
). The information-theoretic approach (I-T) provides the elements for evaluating the quality of fit of models by aiming at their predictive powers ( Buckland et al., 1997Buckland, S. T.; Burnham, K. P. and Augustin, N. H. 1997. Model selection: an integral part of inference. Biometrics 53:603-618. https://doi.org/10.2307/2533961
https://doi.org/10.2307/2533961...
; Sober, 2002Sober, E. 2002. Instrumentalism, parsimony, and the Akaike framework. Philosophy of Science 69:S112-S123. https://doi.org/10.1086/341839
https://doi.org/10.1086/341839...
; Burnham and Anderson, 2004Burnham, K. P. and Anderson, D. R. 2004. Multimodel inference: understanding AIC and BIC in model selection. Sociological Methods & Research 33:261-304. https://doi.org/10.1177/0049124104268644
https://doi.org/10.1177/0049124104268644...
; Burnham et al., 2011aBurnham, K. P.; Anderson, D. R. and Huyvaert, K. P. 2011a. AIC model selection and multimodel inference in behavioral ecology: some background, observations, and comparisons. Behavioral Ecology and Sociobiology 65:23-35. https://doi.org/10.1007/s00265-010-1029-6
https://doi.org/10.1007/s00265-010-1029-...
). In this regard, we can use the geometric properties of mathematical functions to describe lactation records through a two-step prediction based on the statistical methods described. This approach can yield robust predictions about several biological mechanisms that explain the lactation course. Interesting examples rely on the quantitative representation of cell proliferation and death in the mammary gland, whose effects on milk secretion concur for the rise, peak, and fall observed in typical lactation records ( Knight and Peaker, 1984Knight, C. H. and Peaker, M. 1984. Mammary development and regression during lactation in goats in relation to milk secretion. Quarterly Journal of Experimental Physiology 69:331-338. https://doi.org/10.1113/expphysiol.1984.sp002809
https://doi.org/10.1113/expphysiol.1984....
; Dijkstra et al., 1997Dijkstra, J.; France, J.; Dhanoa, M. S.; Maas, J. A.; Hanigan, M. D.; Rook, A. J. and Beever, D. E. 1997. A model to describe growth patterns of the mammary gland during pregnancy and lactation. Journal of Dairy Science 80:2340-2354. https://doi.org/10.3168/jds.S0022-0302(97)76185-X
https://doi.org/10.3168/jds.S0022-0302(9...
; Capuco et al., 2001Capuco, A. V.; Wood, D. L.; Baldwin, R.; McLeod, K. and Paape, M. J. 2001. Mammary cell number, proliferation, and apoptosis during a bovine lactation: relation to milk production and effect of bST. Journal of Dairy Science 84:2177-2187. https://doi.org/10.3168/jds.S0022-0302(01)74664-4
https://doi.org/10.3168/jds.S0022-0302(0...
). The advantage of geometric functions and the two-step prediction based on the described statistical methods is the feasible estimation of parametric functions represented by geometric properties without increasing the number of parameters of a given model.
Therefore, our goal was to evaluate the quality of fit of Brody, Wood, Dijkstra, and Gamma models to describe lactation records from different cattle breeds and parity orders of the cows and, by deducing and using geometric functions, to predict essential attributes of the lactation function by employing a generalized two-step prediction technique.
2. Material and Methods
Lactation records from cows of the southwestern region of the Paraná state, Brazil, were used to develop the evaluation dataset, which was partially used in a previous study performed by our research group about curve fitting to lactation records of Holstein cows ( Ferreira et al., 2015Ferreira, A. G. T.; Henrique, D. S.; Vieira, R. A. M.; Maeda, E. M. and Valotto, A. A. 2015. Fitting mathematical models to lactation curves from holstein cows in the southwestern region of the state of Parana, Brazil. Anais da Academia Brasileira de Ciências 87:503-517. https://doi.org/10.1590/0001-3765201520130514
https://doi.org/10.1590/0001-37652015201...
). Here, we used a larger dataset and presented descriptive statistics by breed ( B ) and parity order ( PO ) ( Table 1 ). We used the entire dataset containing 6754 lactation profiles. We discarded no lactation records to challenge the ability of the equations studied to fit the data at hand.
Breeds, parity orders, number of cows ( n c ), number of time records ( n t ), mean, standard deviation (SD), and range limits for the dataset
2.1. Geometric attributes of Wood's equation
Wood (1967)Wood, P. D. P. 1967. Algebraic model of the lactation curve in cattle. Nature 216:164-165. https://doi.org/10.1038/216164a0
https://doi.org/10.1038/216164a0...
reparameterized the gamma probability density function to yield a nonlinear equation that mimics records over the lactation course of dairy cows with a satisfactory fit ( Ferreira et al., 2015Ferreira, A. G. T.; Henrique, D. S.; Vieira, R. A. M.; Maeda, E. M. and Valotto, A. A. 2015. Fitting mathematical models to lactation curves from holstein cows in the southwestern region of the state of Parana, Brazil. Anais da Academia Brasileira de Ciências 87:503-517. https://doi.org/10.1590/0001-3765201520130514
https://doi.org/10.1590/0001-37652015201...
). The equation can take the form of the following expression:
The parameter μ t represents an expected value, that is, a population mean about random lactation records over time ( t , days or weeks) from one cow or, preferably, from a random sample of cows taken from a larger population. Parameters α , β , and λ are constants, and μ t is a nonlinear function. Isolated, λ is a fractional rate of decline expressed as reciprocal of time units ( t −1), and a formal differential equation ( Dijkstra et al., 2005Dijkstra, J.; Forbes, J. M. and France, J. 2005. Quantitative aspects of ruminant digestion and metabolism. 2nd ed. CABI Pub., Cambridge. ) reveals that the specific fractional rate is time-dependent, actually:
Equation 2 represents a time trajectory instead of a single parameter that otherwise would offer a direct biological interpretation for both theoretical and practical purposes. In fact, λ is the asymptotic fractional rate for . Therefore, Wood's model presents some attributes revealed by analytic geometry that may be of use for animal scientists ( Figure 1 ).

We choose equation 1 because of its flexibility and feasibility to mimic lactation records as demonstrated by several authors ( Dijkstra et al., 2010Dijkstra, J.; Lopez, S.; Bannink, A.; Dhanoa, M. S.; Kebreab, E.; Odongo, N. E.; Nasri, M. H. F.; Behera, U. K.; Hernandez-Ferrer, D. and France, J. 2010. Evaluation of a mechanistic lactation model using cow, goat and sheep data. Journal of Agricultural Science 148:249-262. https://doi.org/10.1017/S0021859609990578
https://doi.org/10.1017/S002185960999057...
; Ferreira et al., 2015Ferreira, A. G. T.; Henrique, D. S.; Vieira, R. A. M.; Maeda, E. M. and Valotto, A. A. 2015. Fitting mathematical models to lactation curves from holstein cows in the southwestern region of the state of Parana, Brazil. Anais da Academia Brasileira de Ciências 87:503-517. https://doi.org/10.1590/0001-3765201520130514
https://doi.org/10.1590/0001-37652015201...
; López et al., 2015López, S.; France, J.; Odongo, N. E.; McBride, R. A.; Kebreab, E.; AlZahal, O.; McBride, B. W. and Dijkstra, J. 2015. On the analysis of Canadian Holstein dairy cow lactation curves using standard growth functions. Journal of Dairy Science 98:2701-2712. https://doi.org/10.3168/jds.2014-8132
https://doi.org/10.3168/jds.2014-8132...
; Ahmed et al., 2019Ahmed, B. A.; Laurence, P.; Pierre, G. and Olivier, M. 2019. Lactation curve model with explicit representation of perturbations as a phenotyping tool for dairy livestock precision farming. bioRxiv 661249. https://doi.org/10.1101/661249
https://doi.org/10.1101/661249...
). The geometric properties of equation 1 are nonlinear functions of its parameters. The time to peak milk production ( t p ) and peak milk production ( ) have been already described ( Wood, 1967Wood, P. D. P. 1967. Algebraic model of the lactation curve in cattle. Nature 216:164-165. https://doi.org/10.1038/216164a0
https://doi.org/10.1038/216164a0...
):
These two attributes are time-independent. The inflection point ( t i ) of equation 1 is one of two possible solutions (i.e., roots) obtained by equating the second derivative of equation 1 to zero. These two solutions are also time-independent:
Only the root t i > t p is valid. All parameters must be subjected to the same constraints described by Wood (1967)Wood, P. D. P. 1967. Algebraic model of the lactation curve in cattle. Nature 216:164-165. https://doi.org/10.1038/216164a0
https://doi.org/10.1038/216164a0...
. As a corollary of the parametric space for β , that is, β ≤ 1, lactation records with ascending and descending phases about peak milk yield are those with a constrained parametric space, i.e. 0 < β ≤ 1; whereas those records that show only a descending phase starting from the onset of lactation at parturition are those for which the parametric space is constrained to β ≤ 0 (concave profiles). We remind the reader that equation 1 resumes to the exponential model for β = 0. The cumulative or total milk production ( TMμ t ) is the area under the curve used to describe the lactation records. Here, we provide an analytical solution that yields the definite integral as follows:
Numerically, the upper limit ( u ) of the integral was set at 305 d, and the lower limit ( l ) can be a small value greater than zero (10−6) for numerical integration. The incomplete gamma function is . The gamma function exp(− t ) dt is a numerical result from a definite integral, and the lower incomplete gamma function is given by exp(− λv ) dv . The average milk production was computed as .
The geometry of the function depicted in Figure 1 can yield a fractional rate constant of decline with reference to peak milk yield. The dashed descending line tangent to the inflection point after the time for peak milk yield is the geometric place defined by equation 7a:
in which ( t ', ) is the point where equation 7a crosses the tangent line to the point ( t p , ), and is the value of the first derivative of equation (1) at t i ( Figure 1a ). The tangent to ( t p , ) is parallel to the abscissa axis, i.e., , and the abscissa coordinate t ' can be isolated in equation 7a and solved for t = t i . Finally, if we divide both sides of equation 7a by and manipulate signs for κ d because , for not changing the trend of equation 7a , we have the persistency trend over time ( P t ) as follows:
Therefore, the specific rate constant of decline after peak milk yield arbitrarily becomes the positive value, as follows:
The new parameter κ d can be d−1 or w−1 and dependent on t i ( equation 5 ) as an intrinsic attribute of equation 1 . We can relate the fractional rate described by equation 8 to the phenomenon of stromal apoptosis in the mammary gland ( Stefanon et al., 2002Stefanon, B.; Colitti, M.; Gabai, G.; Knight, C. H. and Wilde, C. J. 2002. Mammary apoptosis and lactation persistency in dairy animals. Journal of Dairy Research 69:37-52. https://doi.org/10.1017/S0022029901005246
https://doi.org/10.1017/S002202990100524...
; Dijkstra et al., 1997Dijkstra, J.; France, J.; Dhanoa, M. S.; Maas, J. A.; Hanigan, M. D.; Rook, A. J. and Beever, D. E. 1997. A model to describe growth patterns of the mammary gland during pregnancy and lactation. Journal of Dairy Science 80:2340-2354. https://doi.org/10.3168/jds.S0022-0302(97)76185-X
https://doi.org/10.3168/jds.S0022-0302(9...
, 2010Dijkstra, J.; Lopez, S.; Bannink, A.; Dhanoa, M. S.; Kebreab, E.; Odongo, N. E.; Nasri, M. H. F.; Behera, U. K.; Hernandez-Ferrer, D. and France, J. 2010. Evaluation of a mechanistic lactation model using cow, goat and sheep data. Journal of Agricultural Science 148:249-262. https://doi.org/10.1017/S0021859609990578
https://doi.org/10.1017/S002185960999057...
). The relative rate of decline midway between peak milk yield and the arbitrary end point of lactation ( t f = 305) is an additional rate computed from the parameters of Wood's equation, namely ( Dijkstra et al., 2010Dijkstra, J.; Lopez, S.; Bannink, A.; Dhanoa, M. S.; Kebreab, E.; Odongo, N. E.; Nasri, M. H. F.; Behera, U. K.; Hernandez-Ferrer, D. and France, J. 2010. Evaluation of a mechanistic lactation model using cow, goat and sheep data. Journal of Agricultural Science 148:249-262. https://doi.org/10.1017/S0021859609990578
https://doi.org/10.1017/S002185960999057...
).
Another critical factor of the lactation might be the rate of DNA proliferation in the mammary gland, which would be responsible for the rise in milk production after parturition ( Dijkstra et al., 2010Dijkstra, J.; Lopez, S.; Bannink, A.; Dhanoa, M. S.; Kebreab, E.; Odongo, N. E.; Nasri, M. H. F.; Behera, U. K.; Hernandez-Ferrer, D. and France, J. 2010. Evaluation of a mechanistic lactation model using cow, goat and sheep data. Journal of Agricultural Science 148:249-262. https://doi.org/10.1017/S0021859609990578
https://doi.org/10.1017/S002185960999057...
). We can geometrically generate a point estimator for an ascending rate of milk production by calculating the average milk production during the ascending phase until peak milk yield, as follows:
for . By computing the tangent of the δ angle ( Figure 1b ), as equation 10 , we have:
and the following ratio yields a constant, fractional ascendant rate of milk production given by equation 11 .
This rate can be d−1 or w−1. The rate κ α can be associated with the process of cell proliferation until peak milk yield ( Dijkstra et al., 1997Dijkstra, J.; France, J.; Dhanoa, M. S.; Maas, J. A.; Hanigan, M. D.; Rook, A. J. and Beever, D. E. 1997. A model to describe growth patterns of the mammary gland during pregnancy and lactation. Journal of Dairy Science 80:2340-2354. https://doi.org/10.3168/jds.S0022-0302(97)76185-X
https://doi.org/10.3168/jds.S0022-0302(9...
, 2010Dijkstra, J.; Lopez, S.; Bannink, A.; Dhanoa, M. S.; Kebreab, E.; Odongo, N. E.; Nasri, M. H. F.; Behera, U. K.; Hernandez-Ferrer, D. and France, J. 2010. Evaluation of a mechanistic lactation model using cow, goat and sheep data. Journal of Agricultural Science 148:249-262. https://doi.org/10.1017/S0021859609990578
https://doi.org/10.1017/S002185960999057...
). The constraint 0 < β ≤ 1 must hold for a valid κ α ; nonetheless, even though estimates for the fixed parameter β are negative, there are possible occurrences of positive values from the random cow effect over parameter β that may result in typical ascending-peak-descending (convex-shaped) lactation profiles.
2.2. Brody's lactation equation
Brody and colleagues proposed a model to mimic the standard course of milk flow of dairy cows, that is, the rise of milk flow after parturition and its steady decline after peak milk yield ( Brody et al., 1924Brody, S.; Turner, C. W. and Ragsdale, A. C. 1924. The relation between the initial rise and the subsequent decline of milk secretion following parturition. The Journal of General Physiology 6:541-545. https://doi.org/10.1085/jgp.6.5.541
https://doi.org/10.1085/jgp.6.5.541...
). Their model describes a biphasic phenomenon, in which the rise follows a monomolecular change and, simultaneously, an exponential decay follows the peak milk yield. Mathematically, the final equation has the form:
The mean μ t has the same meaning as previously described, but θ 1 and θ 2 are scale parameters, κ 1 (d−1 or w−1) is the characteristic constant of the decline of milk production after peak milk yield (“after the second month” in those authors' words), and κ 2 (d−1 or w−1) is the characteristic diminishing constant of the rising course of lactation. It is possible that equation 12 mimics concave-shaped lactation profiles, but this will depend on final parametric estimates: if θ 1 > 0 and θ 2 ≤ 0, the equation resumes to an exponential decay. All derivations applicable to Wood's equation also apply to the Brody's equation.
2.3. Dijkstra's lactation equation
There is an elegant mechanistic equation based on the pool size of DNA in the cell population of the mammary gland during lactation. This model roots on cell proliferation and death and mimics the typical convex-shaped lactation profile as follows:
Parameter μ 0 (kg · d−1 or kg · w−1) is the theoretical initial milk production at parturition, θ T (d−1 or w−1) represents the specific rate of cell proliferation at parturition, κ 3 (d−1 or w−1) is a decay parameter, and κ 4 (d−1 or w−1) is the specific rate of cell death. Dijkstra et al. (1997)Dijkstra, J.; France, J.; Dhanoa, M. S.; Maas, J. A.; Hanigan, M. D.; Rook, A. J. and Beever, D. E. 1997. A model to describe growth patterns of the mammary gland during pregnancy and lactation. Journal of Dairy Science 80:2340-2354. https://doi.org/10.3168/jds.S0022-0302(97)76185-X
https://doi.org/10.3168/jds.S0022-0302(9...
showed several attributes of equation 13 as general nonlinear functions of its parameters.
2.4. The Gamma density function used as a lactation equation
The gamma probability density function (PDF) models time-to-event data ( Mood et al., 1974Mood, A. M.; Graybill, F. A. and Boes, D. C. 1974. Introduction to the theory of statistics. 3rd ed. McGraw-Hill Kogakusha, LTD., Tokyo. ; Stroup, 2013Stroup, W. W. 2013. Generalized linear mixed models: Modern concepts, methods and applications. Taylor & Francis Group, LLC, Boca Raton. ). Because Wood (1967)Wood, P. D. P. 1967. Algebraic model of the lactation curve in cattle. Nature 216:164-165. https://doi.org/10.1038/216164a0
https://doi.org/10.1038/216164a0...
reparametrized the gamma density function as previously mentioned, we believe that it is worthy evaluating this model in its original form because the properties of the gamma PDF may be of use to describe lactation records. We can compute the mean and variance based on this lactation function. The model can have the following form:
The mean μ t represents the lactation course, and α and r are scale and shape parameters, respectively. Parameter λ (d−1 or w−1) has the same meaning as previously described. The constraints α 0 > 0, r > 0, and λ > 0 must hold. The equivalence between equations 1 and 14 is trivial, because of β = r − 1, α = α 0 λ r / Γ [ r ], and λ is the parameter in common. One can use the same rationale for Wood's model to obtain the nonlinear parametric functions of interest.
2.5. Model fitting: first-step prediction
We used the nlme function of R to fit equations 1 , 12 , 13 , and 14 to the lactation records. The gnls and nlme functions belong to the nlme package ( Pinheiro et al., 2017Pinheiro, J. C.; Bates, D. M.; DebRoy, S. and Sarkar, D. 2017. nlme: Linear and nonlinear mixed effects models. R package version 3.1-130. Available at: <https://CRAN.R-project.org/package=nlme>. Accessed on: Dec. 20, 2017.
https://CRAN.R-project.org/package=nlme...
). The stochastic version of the models was set as follows:
The record corresponds to the milk production rate (kg · d−1) for the k -th cow of the i -th breed, during the j -th parity order, and recorded at time t . The basic nonlinear function that fits is , ∀ μ t related to equations 1 , 12 , 13 , and 14 . Parameter Θ m represents the vector of parameters of the m -th model. However, prior to the fit of the model equations, we had to group lactation records by the random cow and cow × parity order intersecting effects by using the groupedData function of nlme. The resulting formula for the grouped data was y ~ Time|cow/cpo, i.e., y is daily milk yield, time is t , cow and cpo are the random cow and cow × parity order (cpo) intersection. Breed ( B ), parity order ( PO ), and their interaction ( BPO ) were the fixed effects associated with each parameter of μ t for each model evaluated.
We modeled the variance associated with the error term ( ) according to four conditions:
Parameters represent the residual variance ( σ 2), the power ( ψ ) that scales the absolute mean | g ( Θ m , tijk )|, and the assumed positive correlation parameter (0 < ϕ < 1). The model fitted with the variance function in equation 17 challenges the fitted one based on the traditional homoscedastic assumption described by equation 16 . Parameter ω is the intercept of the VarConstPower function ( equation 18 ), which allowed modeling the variances when | g ( Θ m , tijk )| = 0 or equal to a baseline or background value, and when the variance scales to the mean for | g ( Θ m , tijk )| > 0 or greater than a baseline value ( Pinheiro and Bates, 2000Pinheiro, J. C. and Bates, D. M. 2000. Mixed-effects models in S and S-PLUS. Springer-Verlag Inc., New York. ; Rohem Júnior et al., 2020Rohem Júnior, N. M.; Silva, M. C.; Abreu, M. L. C.; Oliveira, J. G.; Glória, L. S.; Tedeschi, L. O. and Vieira, R. A. M. 2020. The transit of external markers throughout the ruminant digestive tract: 1. The fitting quality of models to marker profiles in feces using an information-theoretic approach. Animal Feed Science and Technology 261:114407. https://doi.org/10.1016/j.anifeedsci.2020.114407
https://doi.org/10.1016/j.anifeedsci.202...
; Vieira et al., 2020Vieira, R. A. M.; Rohem Júnior, N. M.; Abreu, M. L. C.; Silva, M. C.; Oliveira, J. G.; Tedeschi, L. O. and Glória, L. S. 2020. The transit of external markers throughout the ruminant digestive tract: 2. The estimation of fiber digestibility, ruminoreticular fill, and related biases. Animal Feed Science and Technology 261:114420. https://doi.org/10.1016/j.anifeedsci.2020.114420
https://doi.org/10.1016/j.anifeedsci.202...
). The fit of the model with the first-order autoregressive correlation structure given by equation 19 challenges the traditional assumption of independent time records on the same subject ( Vonesh, 2012Vonesh, E. F. 2012. Generalized linear and nonlinear models for correlated data: theory and applications using SAS®. SAS Institute Inc., Cary. ); this was accomplished by fitting the corCAR1 function of nlme package ( Pinheiro and Bates, 2000Pinheiro, J. C. and Bates, D. M. 2000. Mixed-effects models in S and S-PLUS. Springer-Verlag Inc., New York. ). We also checked for possible diagonal and symmetric covariance structures for random effects by using the pdDiag (diagonal, D) and pdSymm (unstructured, U) covariance classes available in the R software ( Pinheiro and Bates, 2000Pinheiro, J. C. and Bates, D. M. 2000. Mixed-effects models in S and S-PLUS. Springer-Verlag Inc., New York. ).
The models were initially fitted with the gnls function with no random effects introduced. Thence, by using the nlme function, we gradually introduced random effects (cow and cow × parity order) in the different fixed parameters contained in g ( Θ m , tijk ) creating several model versions. An example is the introduction of the random effects over parameter λ in Wood's equation, in sequence over parameters λ and β , and so on for all equations studied, which formed the different model versions. In addition, we assessed the quality of fit of the model solutions by using the I-T approach ( Buckland et al., 1997Buckland, S. T.; Burnham, K. P. and Augustin, N. H. 1997. Model selection: an integral part of inference. Biometrics 53:603-618. https://doi.org/10.2307/2533961
https://doi.org/10.2307/2533961...
; Burnham and Anderson, 2004Burnham, K. P. and Anderson, D. R. 2004. Multimodel inference: understanding AIC and BIC in model selection. Sociological Methods & Research 33:261-304. https://doi.org/10.1177/0049124104268644
https://doi.org/10.1177/0049124104268644...
, 2014Burnham, K. P. and Anderson, D. R. 2014. P values are only an index to evidence: 20th- vs. 21st-century statistical science. Ecology 95:627-630. https://doi.org/10.1890/13-1066.1
https://doi.org/10.1890/13-1066.1...
; Burnham et al., 2011aBurnham, K. P.; Anderson, D. R. and Huyvaert, K. P. 2011a. AIC model selection and multimodel inference in behavioral ecology: some background, observations, and comparisons. Behavioral Ecology and Sociobiology 65:23-35. https://doi.org/10.1007/s00265-010-1029-6
https://doi.org/10.1007/s00265-010-1029-...
, bBurnham, K. P.; Anderson, D. R. and Huyvaert, K. P. 2011b. Erratum to: AIC model selection and multimodel inference in behavioral ecology: some background, observations, and comparisons. Behavioral Ecology and Sociobiology 65:415. https://doi.org/10.1007/s00265-010-1084-z
https://doi.org/10.1007/s00265-010-1084-...
; Sober, 2002Sober, E. 2002. Instrumentalism, parsimony, and the Akaike framework. Philosophy of Science 69:S112-S123. https://doi.org/10.1086/341839
https://doi.org/10.1086/341839...
). This methodology is based on the corrected Akaike Information Criterion as AICcm ( Akaike, 1974Akaike, H. 1974. A new look at the statistical model identification. IEEE Transactions on Automatic Control 19:716-723. https://doi.org/10.1109/TAC.1974.1100705
https://doi.org/10.1109/TAC.1974.1100705...
; Sugiura, 1978Sugiura, N. 1978. Further analysis of the data by Akaike's information criterion and the finite corrections. Communications in Statistics - Theory and Methods 7:13-26. https://doi.org/10.1080/03610927808827599
https://doi.org/10.1080/0361092780882759...
; Hurvich and Tsai, 1989Hurvich, C. M. and Tsai, C.-L. 1989. Regression and time series model selection in small samples. Biometrika 76:297-307. https://doi.org/10.1093/biomet/76.2.297
https://doi.org/10.1093/biomet/76.2.297...
; Cavanaugh, 1997Cavanaugh, J. E. 1997. Unifying the derivations for the Akaike and corrected Akaike information criteria. Statistics & Probability Letters 33:201-208. https://doi.org/10.1016/S0167-7152(96)00128-9
https://doi.org/10.1016/S0167-7152(96)00...
), and the derived measures Δ m ( m -th Akaike differences), pm ( m -th model probabilities), and ERm ( m -th evidence ratios) computed for each m −th feasible model version fitted. We discarded solutions that yielded heavy-tailed 0.95 confidence intervals (0.95CI) for variance components of the pdDiag or pdSymm structures, as well as for parameters of the correlation structure, the power-of-the-mean function, or both ( Pinheiro and Bates, 2000Pinheiro, J. C. and Bates, D. M. 2000. Mixed-effects models in S and S-PLUS. Springer-Verlag Inc., New York. ).
2.6. Generalized linear mixed-effects models: second step prediction
Only one solution satisfied all criteria for model selection ( Table 2 ). Therefore, we obtained the random effects as outputs of the nlme function and computed the nonlinear geometric functions of the parameters. In sequence, we fitted the values for each cow and cpo for all BPO , which generated new random variables to be analyzed by using the GLIMMIX procedure (SAS University Edition, SAS Systems Inc., Cary, NC, USA). We checked the patterns of the Pearson residuals to evaluate the quality of fit of the model and the assumed probability density function. The model definition was as follows:
Estimate of the negative logarithm of the likelihood function ( ) and derived information criteria 1 1 AICcm - corrected Akaike information criterion; Δ m - Akaike difference; p m - model probability; ER m - evidence ratio; and n m - number of parameters of the m -th model combination. for the fitted Brody, Dijkstra, Gamma, and Wood nonlinear mixed-effects models
The linear predictor is ηijk and the Greek uppercase letters represent the i -th breed ( Bi ), the j -th parity order ( Pj ), and their interaction ( BPij ). We assumed that variables could be yijk | ck ~ Gamma( μijk , Φ ) or yijk | ck ~ Normal( μijk , σ 2), and the random effect of cow is identically and independently distributed as ck ~ Normal(0, ). The Greek capital Φ is a scale parameter, and the link functions used were as follows ( Stroup, 2013Stroup, W. W. 2013. Generalized linear mixed models: Modern concepts, methods and applications. Taylor & Francis Group, LLC, Boca Raton. ): the identity link or ηijk = μijk was used for the Normal distribution, whereas the inverse and log links, namely or ηijk = log ( μijk ), were used for the Gamma PDF. Because the Normal distribution and the Gamma distribution produced equal residual patterns, the alternative Gamma PDF was chosen as the best solution. Therefore, the Gamma was used as a generalizing distribution for variables in the domain (0, ∞).
3. Results
We challenged the traditional assumption of independence and homoscedasticity among errors. Initially, we fitted the nonlinear models corresponding to the general mean with fixed effects of breed ( B ), parity order ( PO ), and their interaction ( BPO ), without the correlation ( equation 18 ) among repeated measures, and with a simple variance function ( equation 16 ). The gradual introduction of fixed effects resulted in an improvement of the model quality of fit ( Table 2 ). The addition of a random effect was a necessary improvement, as well as the introduction of a first-order autoregressive correlation ( equation 19 or corCAR1 function, parameter ϕ ) and the power-of-the-mean variance function ( equation 17 , parameter ψ ). Nonetheless, the introduction of a single random effect to parameter β of equation 1 was the best solution after an exhaustive and careful choice among several possible and feasible model versions, given the data ( Tables 2 and 3 ). Therefore, the best model in the set of all models studied was formed by combining equation 1 fitted with 62 parameters related to the BPO interactions as the fixed effects, the variance function described by equation 17 , the corCAR1 function, and a random effect associated with the shape parameter β . We also presented the standard errors of the variance components of the random effects and their respective 0.95CI related to parameter β , namely, the standard deviations related to the cows ( σcow,β ), the intersecting cow × parity order ( σcpo,β ), and the residual error ( σ ). There is one parameter estimated from equation 17 and another parameter from equation 19 , namely ψ and ϕ , respectively ( Table 3 ).
Fixed parameter estimates and respective standard errors (SE) of the chosen model according to the information-theoretic approach
Equation 1 presented convergence in all cases. In contrast, the other models sometimes failed at convergence or yielded non-positive definite Hessians for variance-covariance matrices. Other problems observed were unreliable (heavy-tailed) confidence intervals for variance-covariance parameters, and we discarded those solutions as recommended by Pinheiro and Bates (2000)Pinheiro, J. C. and Bates, D. M. 2000. Mixed-effects models in S and S-PLUS. Springer-Verlag Inc., New York. . Equations 12 and 13 yielded poor performances if compared with the best solution for equation 1 . Only model versions with fixed effects were feasible for those models.
The nonlinear geometric functions of the fixed parameters ( α , β , and λ ) of the best model ( equation 1 ) and respective standard errors were estimated for each BPO ( Table 3 ). The estimate obtained for parameter β of BPO 41 was negative. The sign of the estimate of parameter β determines the shape of the lactation function, so that the curve was concave for β ≤ 0 ( Figure 2 , panel e) or presented a typical convex profile for 0 < β ≤ 1 ( Figure 2 , panels a, b, c, d, and f). A group of 385 cows presented a final negative random value for β ; therefore, 6369 cows presented typical convex-shaped lactation profiles. The curves fitted with fixed parameter β ≤ 0 did not present peak milk yields as observed for convex-shaped profiles, and we found those results for the first and third parity orders of the crossbreds, namely BPO 41 and BPO 43. Possibly, the low number of records and cows of the third and fourth parity orders limit the strength of the inferences taken.
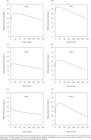
Examples of expected lactation profiles for some breed ( i ) × parity order ( j ) interactions ( BPOij ).
Other attributes computed from the two-step prediction, such as , κα , κd , tp , etc., are presented with standard errors of the means and respective 0.95CI for all BPO combinations ( Tables 4 and 5 ). Sixth parity order cows of the Holstein breed produced more milk per lactation than any other parity order for Holsteins or breeds, as one can check by comparing the confidence intervals reported. Therefore, Holsteins produced more milk than any other breed in the Southwest Paraná state. Fourth-, fifth-, and sixth-order Holstein cows presented the same peak milk yield, as demonstrated by overlapping confidence intervals ( Table 4 ). The combination of the two-step statistical tools allowed the identification of these attributes for ranking animals within breeds and groups.
Attributes 1 1 Additional parameters estimated as nonlinear functions of Wood's equation parameters. of the lactation records obtained from the two-step estimation based on Wood's equation: average milk production ( , kg · d−1), time to peak milk yield ( t p , w), peak milk yield ( , kg · d−1), cumulative or total milk production ( TMμt , kg), and their respective standard errors (SE) and lower (L) and upper (U) 0.99 confidence limits
Attributes 1 1 Additional parameters estimated as nonlinear functions of Wood's equation parameters. To be presented, actual estimates of κ d , Lκd , and Uκd were multiplied by 102, whereas actual SEκd estimates were multiplied by 104. of the lactation records obtained from the two-step estimation based on Wood's equation: specific ascending rate of milk production until peak milk yield ( κ α , w−1), time at the inflection point ( t i , w), specific rate of milk production decline post peak milk yield ( κ d , w−1), their respective standard errors (SE), and lower (L) and upper (U) 0.99 confidence limits
Older Holstein cows reached tp earlier than their first- and second-order counterparts did ( Table 4 ). Brown Swiss cows followed the same Holstein patterns, but stayed in second place as milk producers. Jersey and crossbred cows did not follow the same patterns presented by Holsteins and Brown Swiss cows. Second- and third-order Jersey cows produced more milk than the ones of the first parity order. Girolando cows were low in rank, but the dataset contained only first and second parity order cows ( Tables 1 and 4 ).
Holsteins presented an increasing pattern for κα from the first to the fifth parity order, but the rate reduced at the sixth parity order ( Table 5 ). The same happened for Jerseys and crossbreds from first to the fourth lactation, whereas Brown Swiss cows showed an increase from first to the third lactation. The second-order Girolando cows presented an ascending rate of milk production faster than their first-order counterparts did. Despite the β ≤ 0 estimates for BPO 41 and BPO 43, the convex profiles generated from positive random effects over the fixed β allowed the estimation of κα ( Table 5 ).
Holsteins and Brown Swiss cows of the first parity order generally reached the time at the inflection point later than their older counterparts did. The exception was the sixth parity order Holsteins ( Table 5 ). However, this pattern was not followed by the other breeds and the crossbred cows. In fact, Jersey cows increased ti as they got second and third parity orders, but fourth-order Jersey cows reached the inflection point earlier.
The negative fractional descending rate was higher for first parity order cows, irrespective of breed or crossbreed ( Table 5 ). Older cows generally presented lower descending rates; therefore, they did not sustain the peak milk yield as first parity order cows did. There was a negative association between κα and the negative ( , P<0.001). Given the values of the SE reported, we can depict that κα and κd estimates for the fixed effects were precise. The relative variation for the ascending rate ( ) ranged from 0.33 to 8.97%, whereas the relative variation for κd ranged from 0.14 to 3.95%. On the other hand, the estimates for λ presented a greater relative variation for the fixed effects, i.e., from 2.18% to 221%. The introduction of a random effect on parameter λ was ineffective to reduce the AICcm substantially if compared with the random effect ascribed to β ( Table 2 ). Therefore, only positive values occurred for λ as population estimates ( Table 3 ). The ascending and descending rates are nonlinear functions of the model parameters, and the integrated information resulted in precise estimates, which favored the direct comparisons; isolated parameters were less precise ( Tables 3 and 5 ).
For comparison purposes, we regressed the estimated least-squares means for rd (w−1) over the estimated least-squares means for κd (w−1, Eq. 8 ) in their original scales, i.e., both rates are characteristic of the descending phase after peak milk yield and are both negative. Because of and domains (estimates < 0), we assumed rd normally distributed, and we estimated the simple linear regression by least squares (PROC REG, SAS University Edition): . Therefore, for the proper estimation of one must use in the preceding regression ( Table 5 ). The SE of the intercept was 4.11 · 10−4, the SE of the slope was 3.19 · 10−2, the standard error of the regression was 4.19 · 10−4, and the R 2 = 0.9925. The estimated values for rd and κd were precise and close to each other. Regardless of breed, cows of first parity order presented smaller arbitrarily positive κd estimates in the first half of the down ranked least-squares means contained in Table 5 .
The relationships among parameters α , β , and λ with, for instance, κα , κd , tp , , and TM μt are mathematical. Therefore, the functional relationships established among those parameters explain, by and large, the correlation estimates among those same parameters. Nonetheless, the Pearson correlation for in our study amounted to 0.982 (P<0.001) regardless of breed and parity order. This was done for those cows ( nc = 6369) with an overall random estimate for β ∈ (0, 1). Nonetheless, the random β estimates for all 6754 cows presented a positive correlation with TMμt , namely 0.873 (P<0.001). Therefore, generally, even for cows with atypical concave profiles, the greater the random estimates of β , the greater the predictions for TMμt . In our data, some examples of the Pearson correlation coefficients were: −0.519 (P<0.001) for TMμt × κα, 0.035 (P = 0.005) for TMμt × κα, −0.828 (P<0.001) for κα × κd , and −0.896 (P<0.001) for κα × tp .
4. Discussion
The technique of the nonlinear mixed-effects models allows the ranking of dairy cows within each breed and each parity order (ranks not shown). Therefore, one can replace the unstructured G matrix and ascribe a phenotypic value by associating to it genetic merits by the two-step estimation technique with a genomic relationship matrix in the linear mixed model ( Silva et al., 2017Silva, F. F.; Zambrano, M. F. B.; Varona, L.; Glória, L. S.; Lopes, P. S.; Silva, M. V. G. B.; Arbex, W.; Lázaro, S. F.; Resende, M. D. V. and Guimarães, S. E. F. 2017. Genome association study through nonlinear mixed models revealed new candidate genes for pig growth curves. Scientia Agricola 74:1-7. https://doi.org/10.1590/1678-992x-2016-0023
https://doi.org/10.1590/1678-992x-2016-0...
; Soares et al., 2017Soares, A. C. C.; Guimarães, S. E. F.; Kelly, M. J.; Fortes, M. R. S.; Silva, F. F.; Verardo, L. L.; Mota, R. R. and Moore, S. 2017. Multiple-trait genomewide mapping and gene network analysis for scrotal circumference growth curves in Brahman cattle. Journal of Animal Science 95:3331-3345. https://doi.org/10.2527/jas.2017.1409
https://doi.org/10.2527/jas.2017.1409...
). An extension to the generalized linear mixed-effects model is possible ( Littell et al., 2006Littell, R. C.; Milliken, G. A.; Stroup, W. W.; Wolfinger, R. D. and Schabenberger, O. 2006. SAS®for mixed models. 2nd ed. SAS Institute Inc., Cary, USA. ; Vonesh, 2012Vonesh, E. F. 2012. Generalized linear and nonlinear models for correlated data: theory and applications using SAS®. SAS Institute Inc., Cary. ; Stroup, 2013Stroup, W. W. 2013. Generalized linear mixed models: Modern concepts, methods and applications. Taylor & Francis Group, LLC, Boca Raton. ). Nonetheless, we remind the reader that we fitted the random effects of cow ( σcow,β ) and cow × parity order ( σcpo,β ) successfully only to the shape parameter β , and this result may explain the fitting flexibility of Wood's equation over the other equations studied here. In addition, the combined powers of equations 17 and 19 accounted for variations attributable to either scale and correlations among repeated measures ( Tables 2 and 3 ). If not discounted, those variations can be understood as pseudorandom variations that otherwise would inflate the residual variation ( Vieira et al., 2018Vieira, R. A. M.; Rohem Júnior, N. M.; Gomes, R. S.; Oliveira, T. S.; Bendia, L. C. R.; Azevedo, F. H. V.; Barbosa, D. L.; Glória, L. S. and Rodrigues, M. T. 2018. The ontogenetic allometry of body morphology and chemical composition in dairy goat wethers. Animal 12:538-553. https://doi.org/10.1017/S1751731117001884
https://doi.org/10.1017/S175173111700188...
). The nlme function of R accounts for all these issues and its main advantage is to integrate all information in a single variance-covariance matrix. The overall benefits are an improved precision of parametric estimates and information loss minimization during the quantitative interpretation of nonlinear phenomena with mathematical models ( Pinheiro and Bates, 2000Pinheiro, J. C. and Bates, D. M. 2000. Mixed-effects models in S and S-PLUS. Springer-Verlag Inc., New York. ).
4.1. Nonlinear models and their quality of fit
The Akaike criterion ( Akaike, 1974Akaike, H. 1974. A new look at the statistical model identification. IEEE Transactions on Automatic Control 19:716-723. https://doi.org/10.1109/TAC.1974.1100705
https://doi.org/10.1109/TAC.1974.1100705...
) corrected for small samples ( Sugiura, 1978Sugiura, N. 1978. Further analysis of the data by Akaike's information criterion and the finite corrections. Communications in Statistics - Theory and Methods 7:13-26. https://doi.org/10.1080/03610927808827599
https://doi.org/10.1080/0361092780882759...
; Hurvich and Tsai, 1989Hurvich, C. M. and Tsai, C.-L. 1989. Regression and time series model selection in small samples. Biometrika 76:297-307. https://doi.org/10.1093/biomet/76.2.297
https://doi.org/10.1093/biomet/76.2.297...
; Cavanaugh, 1997Cavanaugh, J. E. 1997. Unifying the derivations for the Akaike and corrected Akaike information criteria. Statistics & Probability Letters 33:201-208. https://doi.org/10.1016/S0167-7152(96)00128-9
https://doi.org/10.1016/S0167-7152(96)00...
), namely AICcm , has been reported as one of the most important measures to evaluate the predictive power of mathematical models in a multiple hypotheses framework ( Buckland et al., 1997Buckland, S. T.; Burnham, K. P. and Augustin, N. H. 1997. Model selection: an integral part of inference. Biometrics 53:603-618. https://doi.org/10.2307/2533961
https://doi.org/10.2307/2533961...
; Sober, 2002Sober, E. 2002. Instrumentalism, parsimony, and the Akaike framework. Philosophy of Science 69:S112-S123. https://doi.org/10.1086/341839
https://doi.org/10.1086/341839...
; Burnham and Anderson, 2004Burnham, K. P. and Anderson, D. R. 2004. Multimodel inference: understanding AIC and BIC in model selection. Sociological Methods & Research 33:261-304. https://doi.org/10.1177/0049124104268644
https://doi.org/10.1177/0049124104268644...
). The AICcm and its derived measures constitute the I-T approach, which allows the comparison of the quality of fit of different models and, whenever necessary, establishes parameters for model averaging. If one takes the smallest AICcm value to choose a model over the others, does an incomplete procedure within the I-T framework ( Burnham and Anderson, 2004Burnham, K. P. and Anderson, D. R. 2004. Multimodel inference: understanding AIC and BIC in model selection. Sociological Methods & Research 33:261-304. https://doi.org/10.1177/0049124104268644
https://doi.org/10.1177/0049124104268644...
; Vieira et al., 2018Vieira, R. A. M.; Rohem Júnior, N. M.; Gomes, R. S.; Oliveira, T. S.; Bendia, L. C. R.; Azevedo, F. H. V.; Barbosa, D. L.; Glória, L. S. and Rodrigues, M. T. 2018. The ontogenetic allometry of body morphology and chemical composition in dairy goat wethers. Animal 12:538-553. https://doi.org/10.1017/S1751731117001884
https://doi.org/10.1017/S175173111700188...
; 2020Rohem Júnior, N. M.; Silva, M. C.; Abreu, M. L. C.; Oliveira, J. G.; Glória, L. S.; Tedeschi, L. O. and Vieira, R. A. M. 2020. The transit of external markers throughout the ruminant digestive tract: 1. The fitting quality of models to marker profiles in feces using an information-theoretic approach. Animal Feed Science and Technology 261:114407. https://doi.org/10.1016/j.anifeedsci.2020.114407
https://doi.org/10.1016/j.anifeedsci.202...
). The smallest AICcm value indicates the lower information loss due to the fit of a given model among the feasible models evaluated. However, if one assumes that a given model is the best solution and ignores the others, depending on the pm for the chosen model, its uncertainty can be large. This is why we assumed that a low uncertainty for a given model is 1 − pm < 0.10 ( Burnham and Anderson, 2004Burnham, K. P. and Anderson, D. R. 2004. Multimodel inference: understanding AIC and BIC in model selection. Sociological Methods & Research 33:261-304. https://doi.org/10.1177/0049124104268644
https://doi.org/10.1177/0049124104268644...
; Vieira et al., 2018Vieira, R. A. M.; Rohem Júnior, N. M.; Gomes, R. S.; Oliveira, T. S.; Bendia, L. C. R.; Azevedo, F. H. V.; Barbosa, D. L.; Glória, L. S. and Rodrigues, M. T. 2018. The ontogenetic allometry of body morphology and chemical composition in dairy goat wethers. Animal 12:538-553. https://doi.org/10.1017/S1751731117001884
https://doi.org/10.1017/S175173111700188...
).
The frequentist statistical tools available nowadays allow the association of random factors to the fixed parameters of nonlinear models and the fit of the resultant models by maximum or restricted maximum likelihood. In addition, one can challenge the traditional assumptions of homoscedasticity and independence of the errors with these tools based on the theories of nonlinear and generalized linear mixed-effects models ( Pinheiro and Bates, 2000Pinheiro, J. C. and Bates, D. M. 2000. Mixed-effects models in S and S-PLUS. Springer-Verlag Inc., New York. ; Vonesh, 2012Vonesh, E. F. 2012. Generalized linear and nonlinear models for correlated data: theory and applications using SAS®. SAS Institute Inc., Cary. ; Stroup, 2013Stroup, W. W. 2013. Generalized linear mixed models: Modern concepts, methods and applications. Taylor & Francis Group, LLC, Boca Raton. ). In our study, the use of the available statistical tools (nlme from R and GLIMMIX of SAS) provided considerable improvements in model fitting and prediction. Based on the I-T approach, we observed that Wood's equation was superior in terms of quality of fit and the best choice to represent the diversity in shape and form of the lactation profiles, given the data. Nonetheless, many studies use the R 2 to compare models, but this measure is not sensitive to differences among nonlinear models, which make comparisons useless because of the difficulty to demonstrate differences. Therefore, models that actually differ based on I-T may be considered equal if one bases on R 2 or, alternatively, its adjusted version for model selection ( Spiess and Neumeyer, 2010Spiess, A.-N. and Neumeyer, N. 2010. An evaluation of R2as an inadequate measure for nonlinear models in pharmacological and biochemical research: a Monte Carlo approach. BMC Pharmacology 10:6. https://doi.org/10.1186/1471-2210-10-6
https://doi.org/10.1186/1471-2210-10-6...
; Hossein-Zadeh, 2016Hossein-Zadeh, N. G. 2016. Comparison of non-linear models to describe the lactation curves for milk yield and composition in buffaloes ( Bubalus bubalis ). Animal 10:248-261. https://doi.org/10.1017/S1751731115001846
https://doi.org/10.1017/S175173111500184...
).
4.2. Lactation curve models
In this study, we challenged the ability of some models to mimic actual lactation records over time. Although the abundant dataset (37810 time-records) might have favored both accuracy and precision of the estimates, considerable variation may have arisen due to different ethnic types, parity orders, low number of cows for some breed-parity order interactions, and incomplete or irregular lactation records to characterize an entire lactation (0-305 days). These sources of variation might have constrained some of the results and increased the difficulty of obtaining valid, convergent, and robust solutions for some models. Nonetheless, the dataset offered the opportunity for Wood's model to exhibit its flexible nature to fit both convex and concave lactation profiles. Concave profiles are rather frequent than one might expect; these concave profiles are characteristic of animals that did not present peak milk yield, and equation 1 mimicked those profiles when other models ( equations 12 - 14 ) failed. Within the framework of nonlinear mixed-effects models, Wood's model even was able to fit lactation profiles with incomplete records, which are needed to characterize an entire lactation trend ( Table 3 and Figure 2 , panel e).
Several authors faced difficulties with fitting models to atypical lactation profiles, that is, those profiles that deviate from the standard lactation convex-shaped trend ( Rekik and Ben Gara, 2004Rekik, B. and Ben Gara, A. 2004. Factors affecting the occurrence of atypical lactations for Holstein−Friesian cows. Livestock Production Science 87:245-250. https://doi.org/10.1016/j.livprodsci.2003.09.023
https://doi.org/10.1016/j.livprodsci.200...
; Macciotta et al., 2005Macciotta, N. P. P.; Vicario, D. and Cappio-Borlino, A. 2005. Detection of different shapes of lactation curve for milk yield in dairy cattle by empirical mathematical models. Journal of Dairy Science 88:1178-1191. https://doi.org/10.3168/jds.S0022-0302(05)72784-3
https://doi.org/10.3168/jds.S0022-0302(0...
; López et al., 2015López, S.; France, J.; Odongo, N. E.; McBride, R. A.; Kebreab, E.; AlZahal, O.; McBride, B. W. and Dijkstra, J. 2015. On the analysis of Canadian Holstein dairy cow lactation curves using standard growth functions. Journal of Dairy Science 98:2701-2712. https://doi.org/10.3168/jds.2014-8132
https://doi.org/10.3168/jds.2014-8132...
). Therefore, the greater flexibility of equation 1 provides the necessary accuracy and precision to the selection of cows based on ranking their performances as parametric attributes of the lactation profiles such as peak milk yield, mean milk production, ascending and descending rates, and more importantly, the total milk production per lactation.
There was a positive agreement between random β and total milk production estimates. Therefore, the use of the peak milk yield as a parameter for selection may result in the exclusion of cows that may produce high quantities of milk, even though the shape parameter β ≤ 0 for a given breed. Our findings favored the use of all lactation profiles from all cows. They avoided an equivocated exclusion of animals before the fit of the model, i.e., all animals were evaluated regardless of the occurrence of a peak milk yield or not ( Rekik and Ben Gara, 2004Rekik, B. and Ben Gara, A. 2004. Factors affecting the occurrence of atypical lactations for Holstein−Friesian cows. Livestock Production Science 87:245-250. https://doi.org/10.1016/j.livprodsci.2003.09.023
https://doi.org/10.1016/j.livprodsci.200...
). The poor performance of the other models ( equations 12 − 14 ) may be explained by the no prior arbitrary exclusion of concave lactation records, as well as incomplete and irregular lactation profiles from our dataset. The advantage of the nonlinear mixed-effects models relies exactly upon the joint analysis of all lactation records employing a matrix of random effects, which encompasses the variation from the random sample of cows about the fixed parameters.
There are some reports that present a poor performance for equation 1 if compared with equations 12 and 13 . However, they used the nonlinear least-squares method of estimation to fit the models, did not consider random factors over the fixed parameters, nor did challenged the independence of residuals and homogeneity of variances ( Brody et al., 1924Brody, S.; Turner, C. W. and Ragsdale, A. C. 1924. The relation between the initial rise and the subsequent decline of milk secretion following parturition. The Journal of General Physiology 6:541-545. https://doi.org/10.1085/jgp.6.5.541
https://doi.org/10.1085/jgp.6.5.541...
; Dijkstra et al., 1997Dijkstra, J.; France, J.; Dhanoa, M. S.; Maas, J. A.; Hanigan, M. D.; Rook, A. J. and Beever, D. E. 1997. A model to describe growth patterns of the mammary gland during pregnancy and lactation. Journal of Dairy Science 80:2340-2354. https://doi.org/10.3168/jds.S0022-0302(97)76185-X
https://doi.org/10.3168/jds.S0022-0302(9...
; Hossein-Zadeh, 2016Hossein-Zadeh, N. G. 2016. Comparison of non-linear models to describe the lactation curves for milk yield and composition in buffaloes ( Bubalus bubalis ). Animal 10:248-261. https://doi.org/10.1017/S1751731115001846
https://doi.org/10.1017/S175173111500184...
). Generally, convex-shaped lactation records are selected because they resemble the typical, standard lactation profile ( Morant and Gnanasakthy, 1989Morant, S. V. and Gnanasakthy, A. 1989. A new approach to the mathematical formulation of lactation curves. Animal Production 49:151-162. https://doi.org/10.1017/S000335610003227X
https://doi.org/10.1017/S000335610003227...
; Dijkstra et al., 1997Dijkstra, J.; France, J.; Dhanoa, M. S.; Maas, J. A.; Hanigan, M. D.; Rook, A. J. and Beever, D. E. 1997. A model to describe growth patterns of the mammary gland during pregnancy and lactation. Journal of Dairy Science 80:2340-2354. https://doi.org/10.3168/jds.S0022-0302(97)76185-X
https://doi.org/10.3168/jds.S0022-0302(9...
; Macciotta et al., 2005Macciotta, N. P. P.; Vicario, D. and Cappio-Borlino, A. 2005. Detection of different shapes of lactation curve for milk yield in dairy cattle by empirical mathematical models. Journal of Dairy Science 88:1178-1191. https://doi.org/10.3168/jds.S0022-0302(05)72784-3
https://doi.org/10.3168/jds.S0022-0302(0...
). Nonetheless, the final shape and form of the nonlinear model depend on its parametric estimates ( Wood, 1967Wood, P. D. P. 1967. Algebraic model of the lactation curve in cattle. Nature 216:164-165. https://doi.org/10.1038/216164a0
https://doi.org/10.1038/216164a0...
; Grossman and Koops, 1988Grossman, M. and Koops, W. J. 1988. Multiphasic analysis of lactation curves in dairy cattle. Journal of Dairy Science 71:1598-1608. https://doi.org/10.3168/jds.S0022-0302(88)79723-4
https://doi.org/10.3168/jds.S0022-0302(8...
; Morant and Gnanasakthy, 1989Morant, S. V. and Gnanasakthy, A. 1989. A new approach to the mathematical formulation of lactation curves. Animal Production 49:151-162. https://doi.org/10.1017/S000335610003227X
https://doi.org/10.1017/S000335610003227...
; Dijkstra et al., 1997Dijkstra, J.; France, J.; Dhanoa, M. S.; Maas, J. A.; Hanigan, M. D.; Rook, A. J. and Beever, D. E. 1997. A model to describe growth patterns of the mammary gland during pregnancy and lactation. Journal of Dairy Science 80:2340-2354. https://doi.org/10.3168/jds.S0022-0302(97)76185-X
https://doi.org/10.3168/jds.S0022-0302(9...
; Macciotta et al., 2005Macciotta, N. P. P.; Vicario, D. and Cappio-Borlino, A. 2005. Detection of different shapes of lactation curve for milk yield in dairy cattle by empirical mathematical models. Journal of Dairy Science 88:1178-1191. https://doi.org/10.3168/jds.S0022-0302(05)72784-3
https://doi.org/10.3168/jds.S0022-0302(0...
). The sign and magnitude of the β estimate determine if the curve is flatter, presents a sharp peak, or decline monotonically at the onset of lactation at parturition ( Congleton Jr. and Everett, 1980Congleton Jr., W. R. and Everett, R. W. 1980. Error and bias of the incomplete gamma function to describe lactation curves. Journal of Dairy Science 63:101-108. https://doi.org/10.3168/jds.S0022-0302(80)82894-3
https://doi.org/10.3168/jds.S0022-0302(8...
; Morant and Gnanasakthy, 1989Morant, S. V. and Gnanasakthy, A. 1989. A new approach to the mathematical formulation of lactation curves. Animal Production 49:151-162. https://doi.org/10.1017/S000335610003227X
https://doi.org/10.1017/S000335610003227...
). In addition, it is important to note that the inflection point in the descending phase is part of a typical convex-shaped lactation profile ( Druet et al., 2003Druet, T.; Jaffrézic, F.; Boichard, D. and Ducrocq, V. 2003. Modeling lactation curves and estimation of genetic parameters for first lactation test-day records of French Holstein cows. Journal of Dairy Science 86:2480-2490. https://doi.org/10.3168/jds.S0022-0302(03)73842-9
https://doi.org/10.3168/jds.S0022-0302(0...
).
Congleton Jr. and Everett (1980)Congleton Jr., W. R. and Everett, R. W. 1980. Error and bias of the incomplete gamma function to describe lactation curves. Journal of Dairy Science 63:101-108. https://doi.org/10.3168/jds.S0022-0302(80)82894-3
https://doi.org/10.3168/jds.S0022-0302(8...
and Macciotta et al. (2006)Macciotta, N. P. P.; Dimauro, C.; Catillo, G.; Coletta, A. and Cappio-Borlino, A. 2006. Factors affecting individual lactation curve shape in i talian river buffaloes. Livestock Science 104:33-37. https://doi.org/10.1016/j.livsci.2006.03.001
https://doi.org/10.1016/j.livsci.2006.03...
believed that the lack of points at the ascending phase do not allow the proper characterization of the typical convex-shaped lactation profiles with a characteristic peak milk yield. Nonetheless, our dataset contains concave-shaped lactation records with several time points, as the better-characterized convex-shaped profiles do. This is why the accommodation of the random factor to parameter β resulted in the superiority of equation 1 to represent the data, because final random estimates can be either 0 < β ≤ 1 and β ≤ 0. Because of the factors mentioned previously, we believe that those variations occurred when cows presented the peak milk yield on the day of parturition or nearly after parturition. These types of lactation profiles occurred for groups BPO 41 and BPO 43, which might be associated with the poor dairy temperament of Zebu breeds and its crossbreeds with dairy breeds ( Bangar and Verma, 2017Bangar, Y. C. and Verma, M. R. 2017. Non-linear modelling to describe lactation curve in Gir crossbred cows. Journal of Animal Science and Technology 59:3. https://doi.org/10.1186/s40781-017-0128-6
https://doi.org/10.1186/s40781-017-0128-...
). Sometimes, even cows that exhibited a typical convex-shaped lactation profile in a previous lactation fail to present a peak milk yield in a further lactation, because of environmental factors such as metabolic disorders, mastitis, other diseases, and nutritional or other management errors ( Wood, 1968Wood, P. D. P. 1968. Factors affecting persistency of lactation in cattle. Nature 218:894. https://doi.org/10.1038/218894a0
https://doi.org/10.1038/218894a0...
, 1970Wood, P. D. P. 1970. The relationship between the month of calving and milk production. Animal Production 12:253-259. https://doi.org/10.1017/S0003356100038824
https://doi.org/10.1017/S000335610003882...
, 1972Wood, P. D. P. 1972. A note on seasonal fluctuations in milk production. Animal Production 15:89-92. https://doi.org/10.1017/S0003356100011260
https://doi.org/10.1017/S000335610001126...
, 1976Wood, P. D. P. 1976. Algebraic models of the lactation curves for milk, fat and protein production, with estimates of seasonal variation. Animal Production 22:35-40. https://doi.org/10.1017/S000335610003539X
https://doi.org/10.1017/S000335610003539...
, 1980Wood, P. D. P. 1980. Breed variations in the shape of the lactation curve of cattle and their implications for efficiency. Animal Production 31:133-141. https://doi.org/10.1017/S0003356100024363
https://doi.org/10.1017/S000335610002436...
; Macciotta et al., 2005Macciotta, N. P. P.; Vicario, D. and Cappio-Borlino, A. 2005. Detection of different shapes of lactation curve for milk yield in dairy cattle by empirical mathematical models. Journal of Dairy Science 88:1178-1191. https://doi.org/10.3168/jds.S0022-0302(05)72784-3
https://doi.org/10.3168/jds.S0022-0302(0...
; Hossein-Zadeh, 2016Hossein-Zadeh, N. G. 2016. Comparison of non-linear models to describe the lactation curves for milk yield and composition in buffaloes ( Bubalus bubalis ). Animal 10:248-261. https://doi.org/10.1017/S1751731115001846
https://doi.org/10.1017/S175173111500184...
; Ahmed et al., 2019Ahmed, B. A.; Laurence, P.; Pierre, G. and Olivier, M. 2019. Lactation curve model with explicit representation of perturbations as a phenotyping tool for dairy livestock precision farming. bioRxiv 661249. https://doi.org/10.1101/661249
https://doi.org/10.1101/661249...
). Nevertheless, the cows that presented typical convex-shaped lactation profiles were those that produced more milk in the entire course of lactation than their counterparts did.
4.3. Geometric attributes of Wood's model
The ascending phase of equation 1 is represented by κα and can be associated with the proliferation of secretory cells of the epithelial parenchyma in the mammary gland of cows ( Capuco et al., 2001Capuco, A. V.; Wood, D. L.; Baldwin, R.; McLeod, K. and Paape, M. J. 2001. Mammary cell number, proliferation, and apoptosis during a bovine lactation: relation to milk production and effect of bST. Journal of Dairy Science 84:2177-2187. https://doi.org/10.3168/jds.S0022-0302(01)74664-4
https://doi.org/10.3168/jds.S0022-0302(0...
), dairy does ( Knight and Peaker, 1984Knight, C. H. and Peaker, M. 1984. Mammary development and regression during lactation in goats in relation to milk secretion. Quarterly Journal of Experimental Physiology 69:331-338. https://doi.org/10.1113/expphysiol.1984.sp002809
https://doi.org/10.1113/expphysiol.1984....
), and mice and rats ( Dijkstra et al., 1997Dijkstra, J.; France, J.; Dhanoa, M. S.; Maas, J. A.; Hanigan, M. D.; Rook, A. J. and Beever, D. E. 1997. A model to describe growth patterns of the mammary gland during pregnancy and lactation. Journal of Dairy Science 80:2340-2354. https://doi.org/10.3168/jds.S0022-0302(97)76185-X
https://doi.org/10.3168/jds.S0022-0302(9...
). The DNA content of the mammary gland is richer in the ascending phase, which results in greater RNA transcription and the consequent translation into enzymes responsible for the synthesis of milk components such as galactosyl transferase, fatty acid synthase, and acetyl-CoA carboxylase ( Knight and Peaker, 1984Knight, C. H. and Peaker, M. 1984. Mammary development and regression during lactation in goats in relation to milk secretion. Quarterly Journal of Experimental Physiology 69:331-338. https://doi.org/10.1113/expphysiol.1984.sp002809
https://doi.org/10.1113/expphysiol.1984....
; Boutinaud et al., 2004Boutinaud, M.; Guinard-Flament, J. and Jammes, H. 2004. The number and activity of mammary epithelial cells, determining factors for milk production. Reproduction Nutrition Development 44:499-508. https://doi.org/10.1051/rnd:2004054
https://doi.org/10.1051/rnd:2004054...
). The continuous milk production increase may be associated with the net number of secretory cells that result from the processes of cell mitosis or differentiation ( Capuco et al., 2001Capuco, A. V.; Wood, D. L.; Baldwin, R.; McLeod, K. and Paape, M. J. 2001. Mammary cell number, proliferation, and apoptosis during a bovine lactation: relation to milk production and effect of bST. Journal of Dairy Science 84:2177-2187. https://doi.org/10.3168/jds.S0022-0302(01)74664-4
https://doi.org/10.3168/jds.S0022-0302(0...
; Dijkstra et al., 1997Dijkstra, J.; France, J.; Dhanoa, M. S.; Maas, J. A.; Hanigan, M. D.; Rook, A. J. and Beever, D. E. 1997. A model to describe growth patterns of the mammary gland during pregnancy and lactation. Journal of Dairy Science 80:2340-2354. https://doi.org/10.3168/jds.S0022-0302(97)76185-X
https://doi.org/10.3168/jds.S0022-0302(9...
, 2010Dijkstra, J.; Lopez, S.; Bannink, A.; Dhanoa, M. S.; Kebreab, E.; Odongo, N. E.; Nasri, M. H. F.; Behera, U. K.; Hernandez-Ferrer, D. and France, J. 2010. Evaluation of a mechanistic lactation model using cow, goat and sheep data. Journal of Agricultural Science 148:249-262. https://doi.org/10.1017/S0021859609990578
https://doi.org/10.1017/S002185960999057...
). Homeorhetic mechanisms orchestrate changes in the mammary gland and other metabolic organs of the animals to provide the machinery and nutrients for milk synthesis by the secretory tissue. The net results are the changes observed for milk yields in the course of the lactation, including changes in other variables that dairy animals go through during the dry and transition periods ( Bauman and Currie, 1980Bauman, D. E. and Currie, W. B. 1980. Partitioning of nutrients during pregnancy and lactation: a review of mechanisms involving homeostasis and homeorhesis. Journal of Dairy Science 63:1514-1529. https://doi.org/10.3168/jds.S0022-0302(80)83111-0
https://doi.org/10.3168/jds.S0022-0302(8...
; Bauman et al., 1999Bauman, D. E.; Everett, R. W.; Weiland, W. H. and Collier, R. J. 1999. Production responses to bovine somatotropin in northeast dairy herds. Journal of Dairy Science 82:2564-2573. https://doi.org/10.3168/jds.S0022-0302(99)75511-6
https://doi.org/10.3168/jds.S0022-0302(9...
; Bauman, 2000Bauman, D. E. 2000. Regulation of nutrient partitioning during lactation: homeostasis and homeorhesis revisited. p.311-328. In: Ruminant physiology. Cronjé, P. B., ed. CABI, Wallingford. ).
The smaller estimates for κα of primiparous cows within each breed observed in our study may be explained by the incomplete development of their mammary glands. First parity order cows are younger and still grow after the first calving; therefore, there is a competition for nutrients between the processes of growth, gestation, and the subsequent lactation, which delays the growth of the mammary gland and its full secretory potential observed in a mature cow ( Bauman and Currie, 1980Bauman, D. E. and Currie, W. B. 1980. Partitioning of nutrients during pregnancy and lactation: a review of mechanisms involving homeostasis and homeorhesis. Journal of Dairy Science 63:1514-1529. https://doi.org/10.3168/jds.S0022-0302(80)83111-0
https://doi.org/10.3168/jds.S0022-0302(8...
; Bauman et al., 1999Bauman, D. E.; Everett, R. W.; Weiland, W. H. and Collier, R. J. 1999. Production responses to bovine somatotropin in northeast dairy herds. Journal of Dairy Science 82:2564-2573. https://doi.org/10.3168/jds.S0022-0302(99)75511-6
https://doi.org/10.3168/jds.S0022-0302(9...
; Bauman, 2000Bauman, D. E. 2000. Regulation of nutrient partitioning during lactation: homeostasis and homeorhesis revisited. p.311-328. In: Ruminant physiology. Cronjé, P. B., ed. CABI, Wallingford. ). Indeed, the mammary glands of cows ( Capuco et al., 2001Capuco, A. V.; Wood, D. L.; Baldwin, R.; McLeod, K. and Paape, M. J. 2001. Mammary cell number, proliferation, and apoptosis during a bovine lactation: relation to milk production and effect of bST. Journal of Dairy Science 84:2177-2187. https://doi.org/10.3168/jds.S0022-0302(01)74664-4
https://doi.org/10.3168/jds.S0022-0302(0...
) and dairy does ( Knight and Peaker, 1984Knight, C. H. and Peaker, M. 1984. Mammary development and regression during lactation in goats in relation to milk secretion. Quarterly Journal of Experimental Physiology 69:331-338. https://doi.org/10.1113/expphysiol.1984.sp002809
https://doi.org/10.1113/expphysiol.1984....
) continue to grow until and after the first parturition. The volume of secretory tissue in the mammary gland of second parity order dairy does is greater than that of the first parity order does, but the greater differentiation in the quantity of secretory parenchyma occurs during pregnancy ( Fowler et al., 1990Fowler, P. A.; Knight, C. H.; Cameron, G. G. and Foster, M. A. 1990. In-vivo studies of mammary development in the goat using magnetic resonance imaging (MRI). Journal of Reproduction and Fertility 89:367-375. https://doi.org/10.1530/jrf.0.0890367
https://doi.org/10.1530/jrf.0.0890367...
; Knight and Wilde, 1993Knight, C. H. and Wilde, C. J. 1993. Mammary cell changes during pregnancy and lactation. Livestock Production Science 35:3-19. https://doi.org/10.1016/0301-6226(93)90178-K
https://doi.org/10.1016/0301-6226(93)901...
). Those biological facts may explain the greater κα estimates for multiparous cows and, consequently, their greater peak milk yields estimated in our study.
The peak milk yield can be used as a parametric reference for phenotypic selection of cows because of the good positive agreement between total milk production and peak milk yield in dairy cattle ( Grossman and Koops, 1988Grossman, M. and Koops, W. J. 1988. Multiphasic analysis of lactation curves in dairy cattle. Journal of Dairy Science 71:1598-1608. https://doi.org/10.3168/jds.S0022-0302(88)79723-4
https://doi.org/10.3168/jds.S0022-0302(8...
; Tekerli et al., 2000Tekerli, M.; Akinci, Z.; Dogan, I. and Akcan, A. 2000. Factors affecting the shape of lactation curves of holstein cows from the Balikesir province of Turkey. Journal of Dairy Science 83:1381-1386. https://doi.org/10.3168/jds.S0022-0302(00)75006-5
https://doi.org/10.3168/jds.S0022-0302(0...
; Hossein-Zadeh, 2014Hossein-Zadeh, N. G. 2014. Comparison of non-linear models to describe the lactation curves of milk yield and composition in Iranian Holsteins. Journal of Agricultural Science 152:309-324. https://doi.org/10.1017/S0021859613000415
https://doi.org/10.1017/S002185961300041...
; López et al., 2015López, S.; France, J.; Odongo, N. E.; McBride, R. A.; Kebreab, E.; AlZahal, O.; McBride, B. W. and Dijkstra, J. 2015. On the analysis of Canadian Holstein dairy cow lactation curves using standard growth functions. Journal of Dairy Science 98:2701-2712. https://doi.org/10.3168/jds.2014-8132
https://doi.org/10.3168/jds.2014-8132...
) and buffaloes ( Hossein-Zadeh, 2016Hossein-Zadeh, N. G. 2016. Comparison of non-linear models to describe the lactation curves for milk yield and composition in buffaloes ( Bubalus bubalis ). Animal 10:248-261. https://doi.org/10.1017/S1751731115001846
https://doi.org/10.1017/S175173111500184...
).
The descending phase occurs soon after the peak milk yield ( Figure 1 ) ( Wood, 1967Wood, P. D. P. 1967. Algebraic model of the lactation curve in cattle. Nature 216:164-165. https://doi.org/10.1038/216164a0
https://doi.org/10.1038/216164a0...
, 1976Wood, P. D. P. 1976. Algebraic models of the lactation curves for milk, fat and protein production, with estimates of seasonal variation. Animal Production 22:35-40. https://doi.org/10.1017/S000335610003539X
https://doi.org/10.1017/S000335610003539...
; Knight and Peaker, 1984Knight, C. H. and Peaker, M. 1984. Mammary development and regression during lactation in goats in relation to milk secretion. Quarterly Journal of Experimental Physiology 69:331-338. https://doi.org/10.1113/expphysiol.1984.sp002809
https://doi.org/10.1113/expphysiol.1984....
; Dijkstra et al., 1997Dijkstra, J.; France, J.; Dhanoa, M. S.; Maas, J. A.; Hanigan, M. D.; Rook, A. J. and Beever, D. E. 1997. A model to describe growth patterns of the mammary gland during pregnancy and lactation. Journal of Dairy Science 80:2340-2354. https://doi.org/10.3168/jds.S0022-0302(97)76185-X
https://doi.org/10.3168/jds.S0022-0302(9...
, 2010Dijkstra, J.; Lopez, S.; Bannink, A.; Dhanoa, M. S.; Kebreab, E.; Odongo, N. E.; Nasri, M. H. F.; Behera, U. K.; Hernandez-Ferrer, D. and France, J. 2010. Evaluation of a mechanistic lactation model using cow, goat and sheep data. Journal of Agricultural Science 148:249-262. https://doi.org/10.1017/S0021859609990578
https://doi.org/10.1017/S002185960999057...
; López et al., 2015López, S.; France, J.; Odongo, N. E.; McBride, R. A.; Kebreab, E.; AlZahal, O.; McBride, B. W. and Dijkstra, J. 2015. On the analysis of Canadian Holstein dairy cow lactation curves using standard growth functions. Journal of Dairy Science 98:2701-2712. https://doi.org/10.3168/jds.2014-8132
https://doi.org/10.3168/jds.2014-8132...
). We used the inflection point at the descending phase to obtain an estimator for κd . This specific constant rate can be an index of persistency: the greater the absolute values, the lower the lactation persistence, i.e., the sharper the decline after peak milk yield. Nonetheless, those cows that presented lactation profiles with greater κα estimates also presented greater arbitrarily positive κd estimates (smaller persistency). We observed a negative Pearson correlation between these two specific rates, which clearly demonstrated the relationship. Wood (1969)Wood, P. D. P. 1969. Factors affecting the shape of the lactation curve in cattle. Animal Production 11:307-316. https://doi.org/10.1017/S0003356100026945
https://doi.org/10.1017/S000335610002694...
observed that as cows grow older, they start with greater milk yield records at parturition, but their rate of decline in milk production reduces as lactation advances post-peak milk yield (persistency reduces = larger absolute κd ). Our results confirm that primiparous cows present flatter lactational profiles, which means a greater persistency if compared with their older counterparts ( Grossman and Koops, 1988Grossman, M. and Koops, W. J. 1988. Multiphasic analysis of lactation curves in dairy cattle. Journal of Dairy Science 71:1598-1608. https://doi.org/10.3168/jds.S0022-0302(88)79723-4
https://doi.org/10.3168/jds.S0022-0302(8...
; Bauman et al., 1999Bauman, D. E.; Everett, R. W.; Weiland, W. H. and Collier, R. J. 1999. Production responses to bovine somatotropin in northeast dairy herds. Journal of Dairy Science 82:2564-2573. https://doi.org/10.3168/jds.S0022-0302(99)75511-6
https://doi.org/10.3168/jds.S0022-0302(9...
; Cobuci and Costa, 2012Cobuci, J. A. and Costa, C. N. 2012. Persistency of lactation using random regression models and different fixed regression modeling approaches. Revista Brasileira de Zootecnia 41:1996-2004. https://doi.org/10.1590/S1516-35982012000900005
https://doi.org/10.1590/S1516-3598201200...
; Hossein-Zadeh, 2014Hossein-Zadeh, N. G. 2014. Comparison of non-linear models to describe the lactation curves of milk yield and composition in Iranian Holsteins. Journal of Agricultural Science 152:309-324. https://doi.org/10.1017/S0021859613000415
https://doi.org/10.1017/S002185961300041...
, 2016Hossein-Zadeh, N. G. 2016. Comparison of non-linear models to describe the lactation curves for milk yield and composition in buffaloes ( Bubalus bubalis ). Animal 10:248-261. https://doi.org/10.1017/S1751731115001846
https://doi.org/10.1017/S175173111500184...
; López et al., 2015López, S.; France, J.; Odongo, N. E.; McBride, R. A.; Kebreab, E.; AlZahal, O.; McBride, B. W. and Dijkstra, J. 2015. On the analysis of Canadian Holstein dairy cow lactation curves using standard growth functions. Journal of Dairy Science 98:2701-2712. https://doi.org/10.3168/jds.2014-8132
https://doi.org/10.3168/jds.2014-8132...
). Therefore, the geometrization of equation 1 yielded parameter estimates that agreed with the biological trends reported in the literature.
The milk production decline post-peak yield may be associated to the reduction in the numbers of secretory cells in the mammary glands of cows ( Capuco et al., 1997Capuco, A. V.; Akers, R. M. and Smith, J. J. 1997. Mammary growth in Holstein cows during the dry period: quantification of nucleic acids and histology. Journal Dairy of Science 80:477-487. https://doi.org/10.3168/jds.S0022-0302(97)75960-5
https://doi.org/10.3168/jds.S0022-0302(9...
; Cobuci and Costa, 2012Cobuci, J. A. and Costa, C. N. 2012. Persistency of lactation using random regression models and different fixed regression modeling approaches. Revista Brasileira de Zootecnia 41:1996-2004. https://doi.org/10.1590/S1516-35982012000900005
https://doi.org/10.1590/S1516-3598201200...
), dairy does ( Knight and Peaker, 1984Knight, C. H. and Peaker, M. 1984. Mammary development and regression during lactation in goats in relation to milk secretion. Quarterly Journal of Experimental Physiology 69:331-338. https://doi.org/10.1113/expphysiol.1984.sp002809
https://doi.org/10.1113/expphysiol.1984....
; Quarrie et al., 1994Quarrie, L. H.; Addey, C. V. P. and Wilde, C. J. 1994. Local regulation of mammary apoptosis in the lactating goat. Biochemical Society Transactions 22:178S. https://doi.org/10.1042/bst022178s
https://doi.org/10.1042/bst022178s...
; Dijkstra et al., 1997Dijkstra, J.; France, J.; Dhanoa, M. S.; Maas, J. A.; Hanigan, M. D.; Rook, A. J. and Beever, D. E. 1997. A model to describe growth patterns of the mammary gland during pregnancy and lactation. Journal of Dairy Science 80:2340-2354. https://doi.org/10.3168/jds.S0022-0302(97)76185-X
https://doi.org/10.3168/jds.S0022-0302(9...
), and small rodents ( Walker et al., 1989Walker, N. I.; Bennett, R. E. and Kerr, J. F. 1989. Cell death by apoptosis during involution of the lactating breast in mice and rats. The American Journal of Anatomy 185:19-32. https://doi.org/10.1002/aja.1001850104
https://doi.org/10.1002/aja.1001850104...
; Strange et al., 1992Strange, R.; Li, F.; Saurer, S.; Burkhardt, A. and Friis, R. R. 1992. Apoptotic cell death and tissue remodelling during mouse mammary gland involution. Development 115:49-58. https://dev.biologists.org/content/115/1/49
https://dev.biologists.org/content/115/1...
; Dijkstra et al., 1997Dijkstra, J.; France, J.; Dhanoa, M. S.; Maas, J. A.; Hanigan, M. D.; Rook, A. J. and Beever, D. E. 1997. A model to describe growth patterns of the mammary gland during pregnancy and lactation. Journal of Dairy Science 80:2340-2354. https://doi.org/10.3168/jds.S0022-0302(97)76185-X
https://doi.org/10.3168/jds.S0022-0302(9...
). The number of epithelial secretory cells recorded at the peak milk yield can be reduced by 40% until the end of lactation in cows ( Capuco et al., 2001Capuco, A. V.; Wood, D. L.; Baldwin, R.; McLeod, K. and Paape, M. J. 2001. Mammary cell number, proliferation, and apoptosis during a bovine lactation: relation to milk production and effect of bST. Journal of Dairy Science 84:2177-2187. https://doi.org/10.3168/jds.S0022-0302(01)74664-4
https://doi.org/10.3168/jds.S0022-0302(0...
) and by 30 ( Knight and Peaker, 1984Knight, C. H. and Peaker, M. 1984. Mammary development and regression during lactation in goats in relation to milk secretion. Quarterly Journal of Experimental Physiology 69:331-338. https://doi.org/10.1113/expphysiol.1984.sp002809
https://doi.org/10.1113/expphysiol.1984....
) to 40% in dairy does ( Fowler et al., 1990Fowler, P. A.; Knight, C. H.; Cameron, G. G. and Foster, M. A. 1990. In-vivo studies of mammary development in the goat using magnetic resonance imaging (MRI). Journal of Reproduction and Fertility 89:367-375. https://doi.org/10.1530/jrf.0.0890367
https://doi.org/10.1530/jrf.0.0890367...
). Capuco et al. (2001)Capuco, A. V.; Wood, D. L.; Baldwin, R.; McLeod, K. and Paape, M. J. 2001. Mammary cell number, proliferation, and apoptosis during a bovine lactation: relation to milk production and effect of bST. Journal of Dairy Science 84:2177-2187. https://doi.org/10.3168/jds.S0022-0302(01)74664-4
https://doi.org/10.3168/jds.S0022-0302(0...
reported that the number of secretory cells results from the balance between cell proliferation and death, i.e., the quantity of secretory tissue reduces as the cell death rate overcomes the cell proliferation rate. This resultant cell loss occurs by some sort of a programmed mechanism for cell death also called cell apoptosis ( Walker et al., 1989Walker, N. I.; Bennett, R. E. and Kerr, J. F. 1989. Cell death by apoptosis during involution of the lactating breast in mice and rats. The American Journal of Anatomy 185:19-32. https://doi.org/10.1002/aja.1001850104
https://doi.org/10.1002/aja.1001850104...
; Strange et al., 1992Strange, R.; Li, F.; Saurer, S.; Burkhardt, A. and Friis, R. R. 1992. Apoptotic cell death and tissue remodelling during mouse mammary gland involution. Development 115:49-58. https://dev.biologists.org/content/115/1/49
https://dev.biologists.org/content/115/1...
; Quarrie et al., 1994Quarrie, L. H.; Addey, C. V. P. and Wilde, C. J. 1994. Local regulation of mammary apoptosis in the lactating goat. Biochemical Society Transactions 22:178S. https://doi.org/10.1042/bst022178s
https://doi.org/10.1042/bst022178s...
; Stefanon et al., 2002Stefanon, B.; Colitti, M.; Gabai, G.; Knight, C. H. and Wilde, C. J. 2002. Mammary apoptosis and lactation persistency in dairy animals. Journal of Dairy Research 69:37-52. https://doi.org/10.1017/S0022029901005246
https://doi.org/10.1017/S002202990100524...
). The first report about apoptosis was for no lactating mice and rats during the period of mammary gland involution ( Walker et al., 1989Walker, N. I.; Bennett, R. E. and Kerr, J. F. 1989. Cell death by apoptosis during involution of the lactating breast in mice and rats. The American Journal of Anatomy 185:19-32. https://doi.org/10.1002/aja.1001850104
https://doi.org/10.1002/aja.1001850104...
; Strange et al., 1992Strange, R.; Li, F.; Saurer, S.; Burkhardt, A. and Friis, R. R. 1992. Apoptotic cell death and tissue remodelling during mouse mammary gland involution. Development 115:49-58. https://dev.biologists.org/content/115/1/49
https://dev.biologists.org/content/115/1...
). Nonetheless, Knight and Peaker (1984)Knight, C. H. and Peaker, M. 1984. Mammary development and regression during lactation in goats in relation to milk secretion. Quarterly Journal of Experimental Physiology 69:331-338. https://doi.org/10.1113/expphysiol.1984.sp002809
https://doi.org/10.1113/expphysiol.1984....
detected the reduction in the number of cells of the secretory tissue after the eighth week of lactation in Saanen does. However, the association of this reduction in the number of secretory cells to the phenomenon of lactational apoptosis in ruminants was introduced by Quarrie et al. (1994)Quarrie, L. H.; Addey, C. V. P. and Wilde, C. J. 1994. Local regulation of mammary apoptosis in the lactating goat. Biochemical Society Transactions 22:178S. https://doi.org/10.1042/bst022178s
https://doi.org/10.1042/bst022178s...
. Therefore, from the estimation of κα and κd , we can infer quantitatively about the anatomic and physiological changes during pregnancy and mainly after parturition. We can also speculate, based on our correlated κα and κd estimates, that the faster the cell proliferation occurs, the sooner the process of cell apoptosis prevails in the secretory tissue of the mammary gland. In addition, we can use those parametric estimates to predict the impact of long-term environmental constraints over milk production trends ( Wood, 1972Wood, P. D. P. 1972. A note on seasonal fluctuations in milk production. Animal Production 15:89-92. https://doi.org/10.1017/S0003356100011260
https://doi.org/10.1017/S000335610001126...
), e.g., the attenuation or worsening of the effects of the oxidative stress over the secretory capacity of the mammary gland, and the consequent result in milk production ( Bernabucci et al., 2002Bernabucci, U.; Ronchi, B.; Lacetera, N. and Nardone, A. 2002. Markers of oxidative status in plasma and erythrocytes of transition dairy cows during hot season. Journal of Dairy Science 85:2173-2179. https://doi.org/10.3168/jds.S0022-0302(02)74296-3
https://doi.org/10.3168/jds.S0022-0302(0...
, 2005Bernabucci, U.; Ronchi, B.; Lacetera, N. and Nardone, A. 2005. Influence of body condition score on relationships between metabolic status and oxidative stress in periparturient dairy cows. Journal of Dairy Science 88:2017-2026. https://doi.org/10.3168/jds.S0022-0302(05)72878-2
https://doi.org/10.3168/jds.S0022-0302(0...
). Other solutions may be of use for short-term effects that dramatically alter the lactation trends ( Ahmed et al., 2019Ahmed, B. A.; Laurence, P.; Pierre, G. and Olivier, M. 2019. Lactation curve model with explicit representation of perturbations as a phenotyping tool for dairy livestock precision farming. bioRxiv 661249. https://doi.org/10.1101/661249
https://doi.org/10.1101/661249...
).
We can make a direct algebraic comparison, for instance, between equations 1 and 13 . If we take the root for ti > tp ( equation 21 ) among other possible root solutions to d 2 μt / dt 2 = 0 for μt from equation 13 1 1 dμt/dt=μ0(θTexp(−κ3t)−κ4)exp(κ3−1θT(1−exp(−κ3t))−k4t) , for μt from equation 13 . ,2 2 d2μt/dt2=μ0(θTexp(−κ3t)−κ4)2exp(κ3−1θT(1−exp(−κ3t))−k4t)−μ0θTκ3exp(κ3−1θT(1−exp(−κ3t))−(κ3+κ4)t) , for μt from equation 13 . , the time at the inflection point would be as follows:
Thence, we can apply the same rationale for κd as described by equations 7b and 8 , with the properties described by Dijkstra et al. (1997)Dijkstra, J.; France, J.; Dhanoa, M. S.; Maas, J. A.; Hanigan, M. D.; Rook, A. J. and Beever, D. E. 1997. A model to describe growth patterns of the mammary gland during pregnancy and lactation. Journal of Dairy Science 80:2340-2354. https://doi.org/10.3168/jds.S0022-0302(97)76185-X
https://doi.org/10.3168/jds.S0022-0302(9...
. In sequence, we can also obtain an equivalent specific ratio as described by equation 11 , because
In equation 22 , , , and the definite integral can be solved numerically. Unfortunately, the model described by equation 13 did not fit our dataset with the same flexibility as Wood's model did, and the comparison was only on a theoretical basis.
5. Conclusions
Based on the I-T approach, we demonstrated the superior quality of fit of Wood's equation combined with a power-of-the-mean function to account for heterogeneous variances, with a first-order autoregressive correlation structure, and by introducing the random cow and cow × parity order effects over the shape parameter ( β ). This choice provides the best-suited model for mimicking lactation records quantitatively from a large dataset of cows from different breeds and with several parity orders, given the data, particularly if the dataset contains convex- and concave-shaped lactation profiles. It also provides the possibility of extracting nonlinear, geometric functions based on Wood's equation parameters via a two-step prediction procedure to yield both accurate and precise estimates for ranking cows by predicting random effects over nonlinear functions of parameters. In this regard, the two-step prediction of the variables based on the geometric functions we deduced from Wood's equation ( κα , κd , , ti and TMμt ), together with previous ones already known ( tp and ), may be of use as selection measures about cow performance and for quantitative associations or predictions for decision making at the farm level.
-
1
, for μt from equation 13 .
-
2
, for μt from equation 13 .
Acknowledgments
We wish to thank Prof. Fabyano Fonseca e Silva (Departamento de Zootecnia of Universidade Federal de Viçosa) for his critical reading of the manuscript. R.A.M. Vieira thanks the grants provided by the Conselho Nacional de Desenvolvimento Científico e Tecnológico - CNPq (303974/2019-2) and Fundação Carlos Chagas Filho de Amparo à Pesquisa do Estado do Rio de Janeiro - FAPERJ (E-26/202.544/2019). J.G. Oliveira thanks the fellowships provided by Coordenação de Aperfeiçoamento de Pessoal de Nível Superior - Brazil (CAPES) - Finance Code 001, and CNPq (141916/2018-4). Finally, we dedicate, at heart, this paper to the memory of Prof. Douglas Sampaio Henrique (UTFPR): disciple, mentor, and above all, a true friend.
References
- Ahmed, B. A.; Laurence, P.; Pierre, G. and Olivier, M. 2019. Lactation curve model with explicit representation of perturbations as a phenotyping tool for dairy livestock precision farming. bioRxiv 661249. https://doi.org/10.1101/661249
» https://doi.org/10.1101/661249 - Akaike, H. 1974. A new look at the statistical model identification. IEEE Transactions on Automatic Control 19:716-723. https://doi.org/10.1109/TAC.1974.1100705
» https://doi.org/10.1109/TAC.1974.1100705 - Albertini, T. Z.; Medeiros, S. R.; Torres Júnior, R. A. A.; Zocchi, S. S.; Oltjen, J. W.; Strathe, A. B. and Lanna, D. P. D. 2012. A methodological approach to estimate the lactation curve and net energy and protein requirements of beef cows using nonlinear mixed-effects modeling. Journal of Animal Science 90:3867-3878. https://doi.org/10.2527/jas.2010-3540
» https://doi.org/10.2527/jas.2010-3540 - Araujo, R. P.; Vieira, R. A. M.; Rocha, N. S.; Abreu, M. L. C.; Glória, L. S.; Rohem Júnior, N. M. and Fernandes, A. M. 2015. Long-term growth of body, body parts and composition of gain of dairy goat wethers. Journal of Agricultural Science 153:1321-1340. https://doi.org/10.1017/S0021859615000532
» https://doi.org/10.1017/S0021859615000532 - Bangar, Y. C. and Verma, M. R. 2017. Non-linear modelling to describe lactation curve in Gir crossbred cows. Journal of Animal Science and Technology 59:3. https://doi.org/10.1186/s40781-017-0128-6
» https://doi.org/10.1186/s40781-017-0128-6 - Bauman, D. E. 2000. Regulation of nutrient partitioning during lactation: homeostasis and homeorhesis revisited. p.311-328. In: Ruminant physiology. Cronjé, P. B., ed. CABI, Wallingford.
- Bauman, D. E. and Currie, W. B. 1980. Partitioning of nutrients during pregnancy and lactation: a review of mechanisms involving homeostasis and homeorhesis. Journal of Dairy Science 63:1514-1529. https://doi.org/10.3168/jds.S0022-0302(80)83111-0
» https://doi.org/10.3168/jds.S0022-0302(80)83111-0 - Bauman, D. E.; Everett, R. W.; Weiland, W. H. and Collier, R. J. 1999. Production responses to bovine somatotropin in northeast dairy herds. Journal of Dairy Science 82:2564-2573. https://doi.org/10.3168/jds.S0022-0302(99)75511-6
» https://doi.org/10.3168/jds.S0022-0302(99)75511-6 - Bernabucci, U.; Ronchi, B.; Lacetera, N. and Nardone, A. 2002. Markers of oxidative status in plasma and erythrocytes of transition dairy cows during hot season. Journal of Dairy Science 85:2173-2179. https://doi.org/10.3168/jds.S0022-0302(02)74296-3
» https://doi.org/10.3168/jds.S0022-0302(02)74296-3 - Bernabucci, U.; Ronchi, B.; Lacetera, N. and Nardone, A. 2005. Influence of body condition score on relationships between metabolic status and oxidative stress in periparturient dairy cows. Journal of Dairy Science 88:2017-2026. https://doi.org/10.3168/jds.S0022-0302(05)72878-2
» https://doi.org/10.3168/jds.S0022-0302(05)72878-2 - Boutinaud, M.; Guinard-Flament, J. and Jammes, H. 2004. The number and activity of mammary epithelial cells, determining factors for milk production. Reproduction Nutrition Development 44:499-508. https://doi.org/10.1051/rnd:2004054
» https://doi.org/10.1051/rnd:2004054 - Brody, S.; Turner, C. W. and Ragsdale, A. C. 1924. The relation between the initial rise and the subsequent decline of milk secretion following parturition. The Journal of General Physiology 6:541-545. https://doi.org/10.1085/jgp.6.5.541
» https://doi.org/10.1085/jgp.6.5.541 - Buckland, S. T.; Burnham, K. P. and Augustin, N. H. 1997. Model selection: an integral part of inference. Biometrics 53:603-618. https://doi.org/10.2307/2533961
» https://doi.org/10.2307/2533961 - Burnham, K. P. and Anderson, D. R. 2004. Multimodel inference: understanding AIC and BIC in model selection. Sociological Methods & Research 33:261-304. https://doi.org/10.1177/0049124104268644
» https://doi.org/10.1177/0049124104268644 - Burnham, K. P. and Anderson, D. R. 2014. P values are only an index to evidence: 20th- vs. 21st-century statistical science. Ecology 95:627-630. https://doi.org/10.1890/13-1066.1
» https://doi.org/10.1890/13-1066.1 - Burnham, K. P.; Anderson, D. R. and Huyvaert, K. P. 2011a. AIC model selection and multimodel inference in behavioral ecology: some background, observations, and comparisons. Behavioral Ecology and Sociobiology 65:23-35. https://doi.org/10.1007/s00265-010-1029-6
» https://doi.org/10.1007/s00265-010-1029-6 - Burnham, K. P.; Anderson, D. R. and Huyvaert, K. P. 2011b. Erratum to: AIC model selection and multimodel inference in behavioral ecology: some background, observations, and comparisons. Behavioral Ecology and Sociobiology 65:415. https://doi.org/10.1007/s00265-010-1084-z
» https://doi.org/10.1007/s00265-010-1084-z - Capuco, A. V.; Akers, R. M. and Smith, J. J. 1997. Mammary growth in Holstein cows during the dry period: quantification of nucleic acids and histology. Journal Dairy of Science 80:477-487. https://doi.org/10.3168/jds.S0022-0302(97)75960-5
» https://doi.org/10.3168/jds.S0022-0302(97)75960-5 - Capuco, A. V.; Wood, D. L.; Baldwin, R.; McLeod, K. and Paape, M. J. 2001. Mammary cell number, proliferation, and apoptosis during a bovine lactation: relation to milk production and effect of bST. Journal of Dairy Science 84:2177-2187. https://doi.org/10.3168/jds.S0022-0302(01)74664-4
» https://doi.org/10.3168/jds.S0022-0302(01)74664-4 - Cavanaugh, J. E. 1997. Unifying the derivations for the Akaike and corrected Akaike information criteria. Statistics & Probability Letters 33:201-208. https://doi.org/10.1016/S0167-7152(96)00128-9
» https://doi.org/10.1016/S0167-7152(96)00128-9 - Cobuci, J. A. and Costa, C. N. 2012. Persistency of lactation using random regression models and different fixed regression modeling approaches. Revista Brasileira de Zootecnia 41:1996-2004. https://doi.org/10.1590/S1516-35982012000900005
» https://doi.org/10.1590/S1516-35982012000900005 - Congleton Jr., W. R. and Everett, R. W. 1980. Error and bias of the incomplete gamma function to describe lactation curves. Journal of Dairy Science 63:101-108. https://doi.org/10.3168/jds.S0022-0302(80)82894-3
» https://doi.org/10.3168/jds.S0022-0302(80)82894-3 - Dijkstra, J.; Forbes, J. M. and France, J. 2005. Quantitative aspects of ruminant digestion and metabolism. 2nd ed. CABI Pub., Cambridge.
- Dijkstra, J.; France, J.; Dhanoa, M. S.; Maas, J. A.; Hanigan, M. D.; Rook, A. J. and Beever, D. E. 1997. A model to describe growth patterns of the mammary gland during pregnancy and lactation. Journal of Dairy Science 80:2340-2354. https://doi.org/10.3168/jds.S0022-0302(97)76185-X
» https://doi.org/10.3168/jds.S0022-0302(97)76185-X - Dijkstra, J.; Lopez, S.; Bannink, A.; Dhanoa, M. S.; Kebreab, E.; Odongo, N. E.; Nasri, M. H. F.; Behera, U. K.; Hernandez-Ferrer, D. and France, J. 2010. Evaluation of a mechanistic lactation model using cow, goat and sheep data. Journal of Agricultural Science 148:249-262. https://doi.org/10.1017/S0021859609990578
» https://doi.org/10.1017/S0021859609990578 - Druet, T.; Jaffrézic, F.; Boichard, D. and Ducrocq, V. 2003. Modeling lactation curves and estimation of genetic parameters for first lactation test-day records of French Holstein cows. Journal of Dairy Science 86:2480-2490. https://doi.org/10.3168/jds.S0022-0302(03)73842-9
» https://doi.org/10.3168/jds.S0022-0302(03)73842-9 - Ferreira, A. G. T.; Henrique, D. S.; Vieira, R. A. M.; Maeda, E. M. and Valotto, A. A. 2015. Fitting mathematical models to lactation curves from holstein cows in the southwestern region of the state of Parana, Brazil. Anais da Academia Brasileira de Ciências 87:503-517. https://doi.org/10.1590/0001-3765201520130514
» https://doi.org/10.1590/0001-3765201520130514 - Fowler, P. A.; Knight, C. H.; Cameron, G. G. and Foster, M. A. 1990. In-vivo studies of mammary development in the goat using magnetic resonance imaging (MRI). Journal of Reproduction and Fertility 89:367-375. https://doi.org/10.1530/jrf.0.0890367
» https://doi.org/10.1530/jrf.0.0890367 - Grossman, M. and Koops, W. J. 1988. Multiphasic analysis of lactation curves in dairy cattle. Journal of Dairy Science 71:1598-1608. https://doi.org/10.3168/jds.S0022-0302(88)79723-4
» https://doi.org/10.3168/jds.S0022-0302(88)79723-4 - Hossein-Zadeh, N. G. 2014. Comparison of non-linear models to describe the lactation curves of milk yield and composition in Iranian Holsteins. Journal of Agricultural Science 152:309-324. https://doi.org/10.1017/S0021859613000415
» https://doi.org/10.1017/S0021859613000415 - Hossein-Zadeh, N. G. 2016. Comparison of non-linear models to describe the lactation curves for milk yield and composition in buffaloes ( Bubalus bubalis ). Animal 10:248-261. https://doi.org/10.1017/S1751731115001846
» https://doi.org/10.1017/S1751731115001846 - Hurvich, C. M. and Tsai, C.-L. 1989. Regression and time series model selection in small samples. Biometrika 76:297-307. https://doi.org/10.1093/biomet/76.2.297
» https://doi.org/10.1093/biomet/76.2.297 - Knight, C. H. and Peaker, M. 1984. Mammary development and regression during lactation in goats in relation to milk secretion. Quarterly Journal of Experimental Physiology 69:331-338. https://doi.org/10.1113/expphysiol.1984.sp002809
» https://doi.org/10.1113/expphysiol.1984.sp002809 - Knight, C. H. and Wilde, C. J. 1993. Mammary cell changes during pregnancy and lactation. Livestock Production Science 35:3-19. https://doi.org/10.1016/0301-6226(93)90178-K
» https://doi.org/10.1016/0301-6226(93)90178-K - Littell, R. C.; Milliken, G. A.; Stroup, W. W.; Wolfinger, R. D. and Schabenberger, O. 2006. SAS®for mixed models. 2nd ed. SAS Institute Inc., Cary, USA.
- López, S.; France, J.; Odongo, N. E.; McBride, R. A.; Kebreab, E.; AlZahal, O.; McBride, B. W. and Dijkstra, J. 2015. On the analysis of Canadian Holstein dairy cow lactation curves using standard growth functions. Journal of Dairy Science 98:2701-2712. https://doi.org/10.3168/jds.2014-8132
» https://doi.org/10.3168/jds.2014-8132 - Macciotta, N. P. P.; Dimauro, C.; Catillo, G.; Coletta, A. and Cappio-Borlino, A. 2006. Factors affecting individual lactation curve shape in i talian river buffaloes. Livestock Science 104:33-37. https://doi.org/10.1016/j.livsci.2006.03.001
» https://doi.org/10.1016/j.livsci.2006.03.001 - Macciotta, N. P. P.; Vicario, D. and Cappio-Borlino, A. 2005. Detection of different shapes of lactation curve for milk yield in dairy cattle by empirical mathematical models. Journal of Dairy Science 88:1178-1191. https://doi.org/10.3168/jds.S0022-0302(05)72784-3
» https://doi.org/10.3168/jds.S0022-0302(05)72784-3 - Mood, A. M.; Graybill, F. A. and Boes, D. C. 1974. Introduction to the theory of statistics. 3rd ed. McGraw-Hill Kogakusha, LTD., Tokyo.
- Morant, S. V. and Gnanasakthy, A. 1989. A new approach to the mathematical formulation of lactation curves. Animal Production 49:151-162. https://doi.org/10.1017/S000335610003227X
» https://doi.org/10.1017/S000335610003227X - Olori, V. E.; Brotherstone, S.; Hill, W. G. and McGuirk, B. J. 1999. Fit of standard models of the lactation curve to weekly records of milk production of cows in a single herd. Livestock Production Science 58:55-63. https://doi.org/10.1016/S0301-6226(98)00194-8
» https://doi.org/10.1016/S0301-6226(98)00194-8 - Pinheiro, J. C. and Bates, D. M. 2000. Mixed-effects models in S and S-PLUS. Springer-Verlag Inc., New York.
- Pinheiro, J. C.; Bates, D. M.; DebRoy, S. and Sarkar, D. 2017. nlme: Linear and nonlinear mixed effects models. R package version 3.1-130. Available at: <https://CRAN.R-project.org/package=nlme>. Accessed on: Dec. 20, 2017.
» https://CRAN.R-project.org/package=nlme - Pollott, G. E. 2000. A biological approach to lactation curve analysis for milk yield. Journal of Dairy Science 83:2448-2458. https://doi.org/10.3168/jds.S0022-0302(00)75136-8
» https://doi.org/10.3168/jds.S0022-0302(00)75136-8 - Quarrie, L. H.; Addey, C. V. P. and Wilde, C. J. 1994. Local regulation of mammary apoptosis in the lactating goat. Biochemical Society Transactions 22:178S. https://doi.org/10.1042/bst022178s
» https://doi.org/10.1042/bst022178s - Rekik, B. and Ben Gara, A. 2004. Factors affecting the occurrence of atypical lactations for Holstein−Friesian cows. Livestock Production Science 87:245-250. https://doi.org/10.1016/j.livprodsci.2003.09.023
» https://doi.org/10.1016/j.livprodsci.2003.09.023 - Rohem Júnior, N. M.; Silva, M. C.; Abreu, M. L. C.; Oliveira, J. G.; Glória, L. S.; Tedeschi, L. O. and Vieira, R. A. M. 2020. The transit of external markers throughout the ruminant digestive tract: 1. The fitting quality of models to marker profiles in feces using an information-theoretic approach. Animal Feed Science and Technology 261:114407. https://doi.org/10.1016/j.anifeedsci.2020.114407
» https://doi.org/10.1016/j.anifeedsci.2020.114407 - Rook, A. J.; France, J. and Dhanoa, M. S. 1993. On the mathematical description of lactation curves. The Journal of Agricultural Science 121:97-102. https://doi.org/10.1017/S002185960007684X
» https://doi.org/10.1017/S002185960007684X - Silva, F. F.; Zambrano, M. F. B.; Varona, L.; Glória, L. S.; Lopes, P. S.; Silva, M. V. G. B.; Arbex, W.; Lázaro, S. F.; Resende, M. D. V. and Guimarães, S. E. F. 2017. Genome association study through nonlinear mixed models revealed new candidate genes for pig growth curves. Scientia Agricola 74:1-7. https://doi.org/10.1590/1678-992x-2016-0023
» https://doi.org/10.1590/1678-992x-2016-0023 - Soares, A. C. C.; Guimarães, S. E. F.; Kelly, M. J.; Fortes, M. R. S.; Silva, F. F.; Verardo, L. L.; Mota, R. R. and Moore, S. 2017. Multiple-trait genomewide mapping and gene network analysis for scrotal circumference growth curves in Brahman cattle. Journal of Animal Science 95:3331-3345. https://doi.org/10.2527/jas.2017.1409
» https://doi.org/10.2527/jas.2017.1409 - Sober, E. 2002. Instrumentalism, parsimony, and the Akaike framework. Philosophy of Science 69:S112-S123. https://doi.org/10.1086/341839
» https://doi.org/10.1086/341839 - Spiess, A.-N. and Neumeyer, N. 2010. An evaluation of R2as an inadequate measure for nonlinear models in pharmacological and biochemical research: a Monte Carlo approach. BMC Pharmacology 10:6. https://doi.org/10.1186/1471-2210-10-6
» https://doi.org/10.1186/1471-2210-10-6 - Stefanon, B.; Colitti, M.; Gabai, G.; Knight, C. H. and Wilde, C. J. 2002. Mammary apoptosis and lactation persistency in dairy animals. Journal of Dairy Research 69:37-52. https://doi.org/10.1017/S0022029901005246
» https://doi.org/10.1017/S0022029901005246 - Strange, R.; Li, F.; Saurer, S.; Burkhardt, A. and Friis, R. R. 1992. Apoptotic cell death and tissue remodelling during mouse mammary gland involution. Development 115:49-58. https://dev.biologists.org/content/115/1/49
» https://dev.biologists.org/content/115/1/49 - Strathe, A. B.; Danfaer, A.; Sørensen, H. and Kebreab, E. 2010. A multilevel nonlinear mixed-effects approach to model growth in pigs. Journal of Animal Science 88:638-649. https://doi.org/10.2527/jas.2009-1822
» https://doi.org/10.2527/jas.2009-1822 - Stroup, W. W. 2013. Generalized linear mixed models: Modern concepts, methods and applications. Taylor & Francis Group, LLC, Boca Raton.
- Sugiura, N. 1978. Further analysis of the data by Akaike's information criterion and the finite corrections. Communications in Statistics - Theory and Methods 7:13-26. https://doi.org/10.1080/03610927808827599
» https://doi.org/10.1080/03610927808827599 - Tekerli, M.; Akinci, Z.; Dogan, I. and Akcan, A. 2000. Factors affecting the shape of lactation curves of holstein cows from the Balikesir province of Turkey. Journal of Dairy Science 83:1381-1386. https://doi.org/10.3168/jds.S0022-0302(00)75006-5
» https://doi.org/10.3168/jds.S0022-0302(00)75006-5 - Vieira, R. A. M.; Rohem Júnior, N. M.; Abreu, M. L. C.; Silva, M. C.; Oliveira, J. G.; Tedeschi, L. O. and Glória, L. S. 2020. The transit of external markers throughout the ruminant digestive tract: 2. The estimation of fiber digestibility, ruminoreticular fill, and related biases. Animal Feed Science and Technology 261:114420. https://doi.org/10.1016/j.anifeedsci.2020.114420
» https://doi.org/10.1016/j.anifeedsci.2020.114420 - Vieira, R. A. M.; Rohem Júnior, N. M.; Gomes, R. S.; Oliveira, T. S.; Bendia, L. C. R.; Azevedo, F. H. V.; Barbosa, D. L.; Glória, L. S. and Rodrigues, M. T. 2018. The ontogenetic allometry of body morphology and chemical composition in dairy goat wethers. Animal 12:538-553. https://doi.org/10.1017/S1751731117001884
» https://doi.org/10.1017/S1751731117001884 - Vonesh, E. F. 2012. Generalized linear and nonlinear models for correlated data: theory and applications using SAS® SAS Institute Inc., Cary.
- Walker, N. I.; Bennett, R. E. and Kerr, J. F. 1989. Cell death by apoptosis during involution of the lactating breast in mice and rats. The American Journal of Anatomy 185:19-32. https://doi.org/10.1002/aja.1001850104
» https://doi.org/10.1002/aja.1001850104 - Wood, P. D. P. 1967. Algebraic model of the lactation curve in cattle. Nature 216:164-165. https://doi.org/10.1038/216164a0
» https://doi.org/10.1038/216164a0 - Wood, P. D. P. 1968. Factors affecting persistency of lactation in cattle. Nature 218:894. https://doi.org/10.1038/218894a0
» https://doi.org/10.1038/218894a0 - Wood, P. D. P. 1969. Factors affecting the shape of the lactation curve in cattle. Animal Production 11:307-316. https://doi.org/10.1017/S0003356100026945
» https://doi.org/10.1017/S0003356100026945 - Wood, P. D. P. 1970. The relationship between the month of calving and milk production. Animal Production 12:253-259. https://doi.org/10.1017/S0003356100038824
» https://doi.org/10.1017/S0003356100038824 - Wood, P. D. P. 1972. A note on seasonal fluctuations in milk production. Animal Production 15:89-92. https://doi.org/10.1017/S0003356100011260
» https://doi.org/10.1017/S0003356100011260 - Wood, P. D. P. 1976. Algebraic models of the lactation curves for milk, fat and protein production, with estimates of seasonal variation. Animal Production 22:35-40. https://doi.org/10.1017/S000335610003539X
» https://doi.org/10.1017/S000335610003539X - Wood, P. D. P. 1980. Breed variations in the shape of the lactation curve of cattle and their implications for efficiency. Animal Production 31:133-141. https://doi.org/10.1017/S0003356100024363
» https://doi.org/10.1017/S0003356100024363 - Zanton, G. I. and Heinrichs, A. J. 2009. Evaluation of modeling procedure for fitting in situ feed degradation profiles. Journal of Animal Science 87:2080-2088. https://doi.org/10.2527/jas.2008-1180
» https://doi.org/10.2527/jas.2008-1180
Publication Dates
-
Publication in this collection
16 Oct 2020 -
Date of issue
2020
History
-
Received
03 Feb 2020 -
Accepted
15 June 2020


