ABSTRACT
The present investigation aimed to evaluate the population structure and inbreeding of Holstein herds in southern Brazil. To carry out the analysis, the Associação Paranaense de Criadores de Bovinos da Raça Holandesa (APCBRH) in Brazil provided the data, which consisted of a pedigree file of 206,796 animals born between 1970 and 2014. Results regarding the following parameters were determined: pedigree integrity, effective number of founders, effective number of ancestors, generation interval, inbreeding coefficient, realized effective population size, and average relatedness coefficient. POPREP and ENDOG v.4.5 software packages were employed to estimate these parameters. Based on the data set, the mean generation interval was found to be 6.3 years, and the average inbreeding coefficient, related to inbred animals, was 4.99%. Furthermore, the realized effective population size varied throughout the time period, ranging from 22 to 114, whereas the rate of inbreeding in this same period showed a decreasing trend towards the later years in the period until 2014. Upon evaluation, average relatedness coefficient was estimated to be 0.71%. Moreover, the effective number of founders and ancestors were estimated as 418 and 400 animals, respectively. According to the level of inbreeding observed, it could be noticed that genetic diversity remains elevated, which will be important to the genetic progress in the Holstein breeding program in Southern Brazil.
effective population size; founders; generation interval
Introduction
Data monitoring is beneficial for maximizing profits and improving the application of selection methods to provide genetic progress in dairy herds ( Silva et al., 2016Silva, M. H. M. A.; Malhado, C. H. M.; Costa Jr, J. L.; Cobuci, J. A.; Costa, C. N. and Carneiro, P. L. S. 2016. Population genetic structure in the Holstein breed in Brazil. Tropical Animal Health and Production 48:331-336. https://doi.org/10.1007/s11250-015-0956-7
https://doi.org/10.1007/s11250-015-0956-...
). In addition, rigorous pedigree control is essential for the correct identification of relationships between the animals, which will help prevent possible high rates of inbreeding in the long term. Inbreeding is caused by the mating of individuals that share one or more common ancestors. High inbreeding rates cause undesirable outcomes, such as a decrease in genetic variance and, therefore, should be avoided ( Hinrichs and Thaller, 2011Hinrichs, D. and Thaller, G. 2011. Pedigree analysis and inbreeding effects on calving traits in large dairy herds in Germany. Journal of Dairy Science 94:4726-4733. https://doi.org/10.3168/jds.2010-4100
https://doi.org/10.3168/jds.2010-4100...
).
Since the adoption of large-scale reproductive biotechnologies, the probability of producing inbred animals has increased considerably because of the diffusion of genetic material from specific breeding herds. Thus, more careful analyses of the structural genealogy of populations are required ( Pedrosa et al., 2010Pedrosa, V. B.; Santana Jr, M. L.; Oliveira, P. S.; Eler, J. P. and Ferraz, J. B. S. 2010. Population structure and inbreeding effects on growth traits of Santa Inês sheep in Brazil. Small Ruminant Research 93:135-139. ). The population structure is typically determined by calculating the allelic frequencies of the different individuals. To prevent inbreeding, possible changes in the distribution of genetic variability should be constantly monitored ( Barros et al., 2017Barros, E. A.; Brasil, L. H. A.; Tejero, J. P.; Delgado-Bermejo, J. V. and Ribeiro, M. N. 2017. Population structure and genetic variability of the Segureña sheep breed through pedigree analysis and inbreeding effects on growth traits. Small Ruminant Research 149:128-133. https://doi.org/10.1016/j.smallrumres.2017.02.009
https://doi.org/10.1016/j.smallrumres.20...
).
Many dairy herds utilize imported genetic material, often collected from proven bulls from various countries. In 2017, Brazil imported 2.4 million doses of semen from the Holstein breed alone ( ASBIA, 2018ASBIA - Associação Brasileira de Inseminação Artificial. 2018. Index ASBIA - Importação, exportação e comercialização de sêmen. ). As a result of these high importation rates, males that become distinctive internationally tend to become progenitors in several countries, which leads to the dissemination of their genetic material worldwide. Thus, in a relatively short period, many progenies are produced from a small number of bulls, leading to a significant increase in the likelihood of inbreeding ( Hammami et al., 2009Hammami, H.; Rekik, B.; Bastin, C.; Soyeurt, H.; Bormann, J.; Stoll, J. and Gengler, N. 2009. Environmental sensitivity for milk yield in Luxembourg and Tunisian Holsteins by herd management level. Journal of Dairy Science 92:4604-4612. https://doi.org/10.3168/jds.2008-1513
https://doi.org/10.3168/jds.2008-1513...
).
The Holstein breed is recognized globally for its high milk production rates and availability of its genetic material on all continents. The breed is a product of intensive artificial selection, which has resulted in increased milk production ( Rodríguez-Ramilo et al., 2015Rodríguez-Ramilo, S. T.; Fernandez, J.; Toro, M. A.; Hernández, D. and Villanueva, B. 2015. Genome-wide estimates of coancestry, inbreeding and effective population size in the Spanish Holstein population. PLoS ONE 10:e0124157. https://doi.org/10.1371/journal.pone.0124157
https://doi.org/10.1371/journal.pone.012...
). Furthermore, many studies have demonstrated the genetic gain obtained in this breed ( Stachowicz et al., 2011Stachowicz, K.; Sargolzaei, M.; Miglior, F. and Schenkel, F. S. 2011. Rates of inbreeding and genetic diversity in Canadian Holstein and Jersey cattle. Journal of Dairy Science 94:5160-5175. ; García-Ruiz et al., 2016García-Ruiz, A.; Cole, J. B.; VanRaden, P. M.; Wiggans, G. R.; Ruiz-López, F. J.; Van Tassell, C. P. 2016. Changes in genetic selection differentials and generation intervals in US Holstein dairy cattle as a result of genomic selection. Proceedings of the National Academy of Sciences 113:E3995-E4004. https://doi.org/10.1073/pnas.1519061113
https://doi.org/10.1073/pnas.1519061113...
). However, only a few scientific papers have focused on the population structure of the Holstein breed and the effects of possible inbreeding in the herds of South America, which are important factors that can potentially interfere with the genetic gain over generations. Therefore, the present study aimed to evaluate the population structure and inbreeding rates of Holstein herds in southern Brazil to determine the process of gene distribution over the years.
Material and Methods
To carry out the present investigation, the Associação Paranaense de Criadores de Bovinos da Raça Holandesa (APCBRH) in Brazil provided the data, which primarily consisted of information about Holstein animals from herds located in southern Brazil. A complete pedigree file, which included the identification of the animal, sire, dam, and birth year, was created, consisting of 206,796 animals (200,856 females and 5,940 males) born between 1970 and 2014. Of these animals, one or both parents of 45,905 animals were unidentified. These animals were excluded from the study, resulting in a reference population of 160,891 animals.
To determine the genetic structure of the population and the level of inbreeding, the following parameters were considered: pedigree integrity, effective number of founders (fe), effective number of ancestors (fa), generation interval (GI), inbreeding coefficient (F), realized effective population size (Nē), and average relatedness coefficient (AR). All population parameters and inbreeding rates were estimated using the software packages POPREP ( Groeneveld et al., 2009Groeneveld, E.; Westhuizen, B. V. D.; Maiwashe, A.; Voordewind, F. and Ferraz, J. B. S. 2009. POPREP: a generic report for population management. Genetics and Molecular Research 8:1158-1178. https://doi.org/10.4238/vol8-3gmr648
https://doi.org/10.4238/vol8-3gmr648...
) and ENDOG v.4.5 ( Gutiérrez and Goyache, 2005Gutiérrez, J. P. and Goyache, F. 2005. A note on ENDOG: a computer program for analysing pedigree information. Journal of Animal Breeding and Genetics 122:172-176. https://doi.org/10.1111/j.1439-0388.2005.00512.x
https://doi.org/10.1111/j.1439-0388.2005...
).
The integrity of the pedigree was examined, which was essential for the complete evaluation of the available data. The number of known generations was determined, and the proportion of known ancestors from several previous generations was calculated. Generation equivalents were calculated by averaging the sum of (1/2)n, in which n is the number of generations that separates the individual from each known ancestor ( Sargolzaei et al., 2006Sargolzaei, M.; Iwaisaki, H. and Colleau, J. 2006. A software package for pedigree analysis and monitoring genetic diversity. Department of Agro-biology, Niigata University, Japan. ). Additionally, detailed information regarding the ancestry of each individual was generated using complete pedigree knowledge. The pedigree integrity for each generation was estimated according to the methods proposed by MacCluer et al. (1983)MacCluer, J. W.; Boyce, A. J.; Dyke, B.; Weitkamp, R.; Pfenning, D. W. and Parsons, C. J. 1983. Inbreeding and pedigree structure in Standardbred horses. Journal of Heredity 74:394-399. https://doi.org/10.1093/oxfordjournals.jhered.a109824
https://doi.org/10.1093/oxfordjournals.j...
, in which the proportion of individuals with parental information is estimated.
Estimates of gene dissemination over time were determined by calculating fe and fa. Essentially, fe denotes the number of animals with an equal genetic contribution, i.e., those that supplied a similar amount of genetic material to the population ( Pedrosa et al., 2010Pedrosa, V. B.; Santana Jr, M. L.; Oliveira, P. S.; Eler, J. P. and Ferraz, J. B. S. 2010. Population structure and inbreeding effects on growth traits of Santa Inês sheep in Brazil. Small Ruminant Research 93:135-139. ). This parameter was calculated using equation 1, given by Boichard et al. (1997)Boichard, D.; Maignel, L. and Verrier, É. 1997. The value of using probabilities of gene origin to measure genetic variability in a population. Genetics Selection Evolution 29:5-23. https://doi.org/10.1186/1297-9686-29-1-5
https://doi.org/10.1186/1297-9686-29-1-5...
:
in which fe is the effective number of founders and qk is the probability of the origin of the genetic contribution of ancestor k, indicating the actual number of founders. In contrast, fa represents the minimum number of animals (founder or not) required to provide the observed genetic diversity of a population. This parameter represents the loss of genetic diversity produced by the unbalanced use of breeding individuals and was calculated using equation 2:
in which fa is the effective number of ancestors and qj is the marginal contribution of an ancestor j, which is the genetic contribution made by an ancestor that is not explained by other ancestors chosen earlier ( Pedrosa et al., 2010Pedrosa, V. B.; Santana Jr, M. L.; Oliveira, P. S.; Eler, J. P. and Ferraz, J. B. S. 2010. Population structure and inbreeding effects on growth traits of Santa Inês sheep in Brazil. Small Ruminant Research 93:135-139. ).
Furthermore, information on the average age of the parents at the birth of their young was used to calculate GI ( Falconer and Mackay, 1996Falconer, D. S. and Mackay, T. F. C. 1996. Introduction to quantitative genetics. 4th ed. Longman Editors, Essex, UK. ). For this purpose, the values for the average GI for the following gametic passages were obtained: sire–son, sire–daughter, dam–son, and dam–daughter. Additionally, AR was determined considering that the AR of each individual is the probability that an allele randomly selected from the entire population is present in that individual. Estimating AR helps to determine the percentage of genetic information that an animal contributes to the population ( Gutiérrez and Goyache, 2005Gutiérrez, J. P. and Goyache, F. 2005. A note on ENDOG: a computer program for analysing pedigree information. Journal of Animal Breeding and Genetics 122:172-176. https://doi.org/10.1111/j.1439-0388.2005.00512.x
https://doi.org/10.1111/j.1439-0388.2005...
).
The probability of an individual being a carrier of two genes identical by descent was determined by calculating F following the method employed by Meuwissen and Luo (1992)Meuwissen, T. H. E. and Luo, Z. 1992. Computing inbreeding coefficients in large populations. Genetics Selection Evolution 24:305-313. https://doi.org/10.1186/1297-9686-24-4-305
https://doi.org/10.1186/1297-9686-24-4-3...
, in which the average F of a given generation t (Ft) was determined by using equation 3 ( Falconer and Mackay, 1996Falconer, D. S. and Mackay, T. F. C. 1996. Introduction to quantitative genetics. 4th ed. Longman Editors, Essex, UK. ):
in which ΔF is the change in the inbreeding rate from one generation to another, i.e., new inbreeding. The increase in inbreeding (ΔF) for each generation was calculated using formula 4:
in which Ft and Ft−1 represent the average inbreeding estimates for the current and the previous generation, respectively ( Falconer and Mackay, 1996Falconer, D. S. and Mackay, T. F. C. 1996. Introduction to quantitative genetics. 4th ed. Longman Editors, Essex, UK. ).
The calculated values for ΔF can be further employed to determine, which is the mean of the increase in the inbreeding level of each individual (ΔFi) of n individuals of a given subpopulation. The individual increase in inbreeding (ΔFi) can be defined as
in which t is the equivalent complete generations calculated for the pedigree of the individual as the sum over all known ancestors of the term of (½)n, in which n is the number of generations separating the individual from each known ancestor, as described by Gutiérrez et al. (2008)Gutiérrez, J. P.; Cervantes, I.; Molina, A.; Valera, M. and Goyache, F. 2008. Individual increase in inbreeding allows estimating effective sizes from pedigrees. Genetics Selection Evolution 40:359-378. https://doi.org/10.1051/gse:2008008
https://doi.org/10.1051/gse:2008008...
.
The obtained values for were used to calculate Nē ( Gutiérrez et al., 2003Gutiérrez, J. P.; Altarriba, J.; Díaz, C.; Quintanilla, R.; Cañón, J. and Piedrafita, J. 2003. Pedigree analysis of eight Spanish beef cattle breeds. Genetics Selection Evolution 35:43-63. https://doi.org/10.1186/1297-9686-35-1-43
https://doi.org/10.1186/1297-9686-35-1-4...
), using equation 6:
The method described above utilized to calculate the effective population size was independent of the mating policy of the reference population; however, it was found to depend on the mating performed along with the pedigree of each individual ( Pedrosa et al., 2010Pedrosa, V. B.; Santana Jr, M. L.; Oliveira, P. S.; Eler, J. P. and Ferraz, J. B. S. 2010. Population structure and inbreeding effects on growth traits of Santa Inês sheep in Brazil. Small Ruminant Research 93:135-139. ).
Results
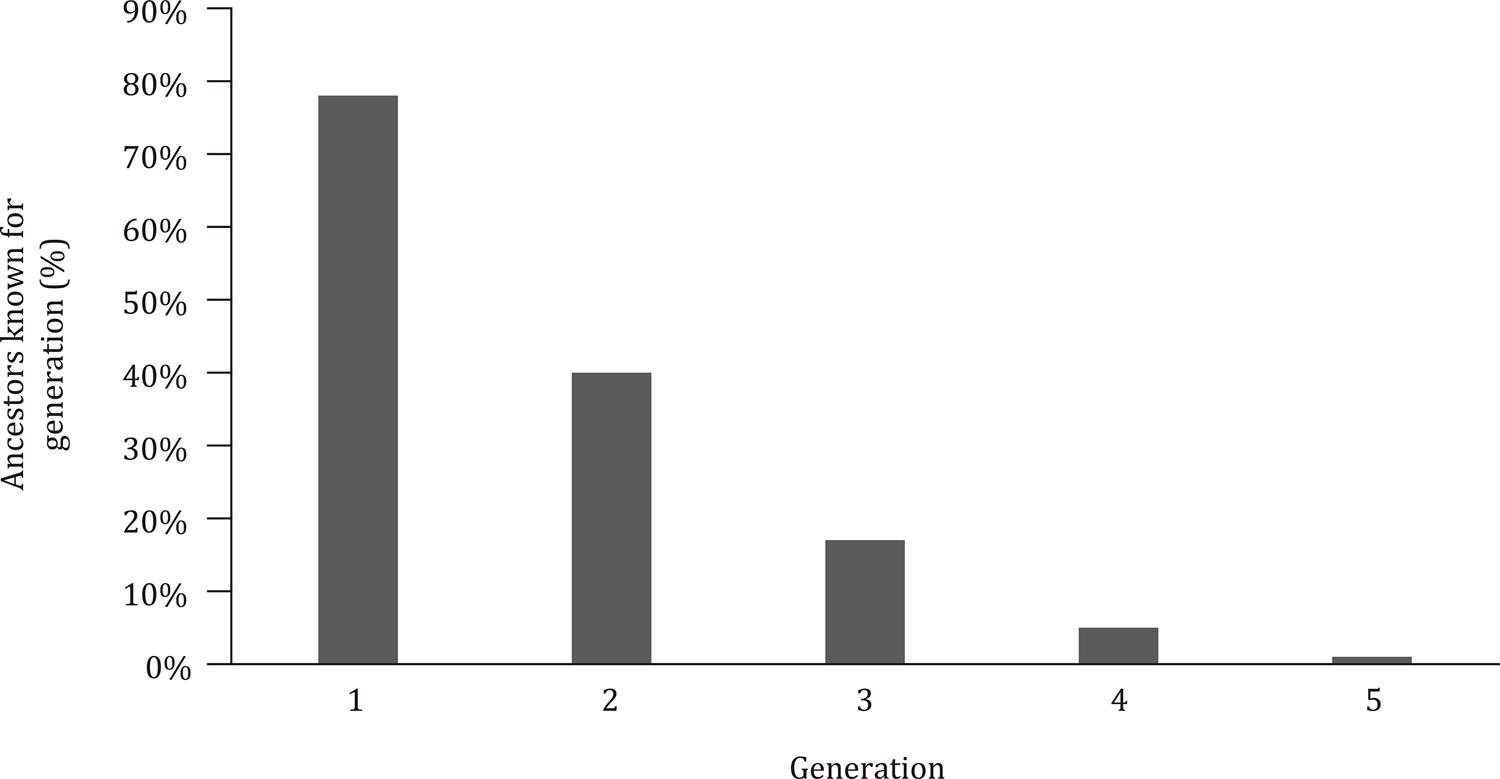
Upon analyzing the total data set, the average pedigree completeness for the first generation of ancestors was determined to be 78.02%. The average pedigree completeness values for the second and third generations were 39.91 and 17.42%, respectively ( Figure 1 ). As expected, the average pedigree completeness for the following generations progressively decreased (the average pedigree completeness values for the fourth and fifth generations were 4.51 and 0.77%, respectively; Figure 2 ).
Total animals in the pedigree joint with the level of identification of the ancestors up to the third generation in Holstein cattle in southern Brazil.
The average GI in the population was 6.3 years ( Table 1 ). However, GI showed discrepancies among the gametic passages. The average GI for sire–daughter (i.e., the sire’s age at the birth of a daughter) was 8.5 years, and that for sire–son was 7.0 years, whereas the average GI for dam–son and dam–daughter were 5.6 and 4.1 years, respectively. The higher GI for sire gametic passages could be explained by the extensive use of semen from older bulls (with advanced age).
An inbreeding level of 0-10% was most common, and no animals were identified with an inbreeding level over 25% ( Table 2 ). Within the population, the F among all individuals was 0.21%. The mean F value of inbred animals was 4.99%, and the minimum and maximum values of individual inbreeding were 0.01 and 25.15%, respectively. The calculation of inbreeding in the present population indicated that of a total of 206,796 animals, 12,192 (5.89%) presented some level of inbreeding. Additionally, of these 12,192 inbred animals, 60.86% were progeny, 39.03% were cows, and 0.11% were bulls. Indeed, the average amount of inbreeding observed in the progeny was 4.55%, followed by 7.25 and 0.22% in the cows and bulls, respectively.
Distribution of Holstein animals per year and inbreeding levels (1 = 0-10%, 2 = 11-20%, and 3 = 21-30%)
The Nē calculated in the present work varied during the period, ranging from 22 to 114 ( Figure 3 ). The AR is necessary to measure the genetic contribution made by an animal to its population because it defines the probability of a randomly chosen allele belonging to an individual. We calculated AR to be 0.71%, indicating an acceptable level of genetic diversity (values below 1% are considered acceptable) ( Gutiérrez et al., 2003Gutiérrez, J. P.; Altarriba, J.; Díaz, C.; Quintanilla, R.; Cañón, J. and Piedrafita, J. 2003. Pedigree analysis of eight Spanish beef cattle breeds. Genetics Selection Evolution 35:43-63. https://doi.org/10.1186/1297-9686-35-1-43
https://doi.org/10.1186/1297-9686-35-1-4...
). Additionally, the genetic variability in the population was calculated as being from 418 founders and 400 ancestors.
Inbreeding coefficient and realized effective population size distributed according to the year of birth for inbred animals of the Holstein breed.
Discussion
In addition to representing the number of animals with a known relationship, the level of pedigree integrity, i.e., the pedigree completeness, can quantify the informative degree of the pedigree. Based on the above calculations of pedigree completeness, the first two generations of ancestors are most informative, which indicates a high quality of data control achieved by the APCBRH in Brazil. The attainment of high completeness of the pedigree provides a good understanding of the population history and provides better information on the relationships between individuals ( Hinrichs and Thaller, 2011Hinrichs, D. and Thaller, G. 2011. Pedigree analysis and inbreeding effects on calving traits in large dairy herds in Germany. Journal of Dairy Science 94:4726-4733. https://doi.org/10.3168/jds.2010-4100
https://doi.org/10.3168/jds.2010-4100...
). Thus, having a high level of pedigree integrity and being able to define relationships between individuals makes it possible to more accurately determine common ancestors, which results in a more precise calculation of F ( Gutiérrez et al., 2003Gutiérrez, J. P.; Altarriba, J.; Díaz, C.; Quintanilla, R.; Cañón, J. and Piedrafita, J. 2003. Pedigree analysis of eight Spanish beef cattle breeds. Genetics Selection Evolution 35:43-63. https://doi.org/10.1186/1297-9686-35-1-43
https://doi.org/10.1186/1297-9686-35-1-4...
).
Among individuals within the grandparent generation, the percentage of animals with known parentage decreased substantially. The level of pedigree completeness in the sire line, starting from the grandparent generation, was less informative in comparison with the dam line. The use of semen primarily from bulls raised and selected abroad could be the main reason for the limited pedigree information from the sire line. Part of the bull parentage identification is missing from the database, because the registry of male ancestors is not available in the Brazilian dataset, which prevents the completion of the male lineage.
The pedigree of the first generation was found to be more complete (78.02%) than pedigrees from some other dairy cattle studies in Brazil. For example, Canaza-Cayo et al. (2014)Canaza-Cayo, A. W.; Lopes, P. S.; Silva, M. V. G. B.; Cobuci, J. A.; Torres, R. A.; Martins, M. F. and Arbex, W. A. 2014. Estrutura populacional da raça Girolando. Ciência Rural 44:2072-2077. https://doi.org/10.1590/0103-8478cr20131307
https://doi.org/10.1590/0103-8478cr20131...
found 61.1% pedigree completeness in the first generation while studying the Girolando cattle population. However, Silva et al. (2016)Silva, M. H. M. A.; Malhado, C. H. M.; Costa Jr, J. L.; Cobuci, J. A.; Costa, C. N. and Carneiro, P. L. S. 2016. Population genetic structure in the Holstein breed in Brazil. Tropical Animal Health and Production 48:331-336. https://doi.org/10.1007/s11250-015-0956-7
https://doi.org/10.1007/s11250-015-0956-...
recorded a similar level of pedigree completeness for Holstein cattle raised in Brazilian herds, with pedigree integrities of 76.48 and 75.46% for sires and dams, respectively.
Additionally, the analysis of pedigree depth revealed that there was a maximum of five generations between an individual and its most distant ancestor. This gap mainly occurred due to the further dispersion of information in each subsequent generation, which naturally decreased completeness. In this case, the depth of the pedigree becomes relevant ( MacCluer et al., 1983MacCluer, J. W.; Boyce, A. J.; Dyke, B.; Weitkamp, R.; Pfenning, D. W. and Parsons, C. J. 1983. Inbreeding and pedigree structure in Standardbred horses. Journal of Heredity 74:394-399. https://doi.org/10.1093/oxfordjournals.jhered.a109824
https://doi.org/10.1093/oxfordjournals.j...
), because the percentage proportions of the known ancestors can be discerned by closely analyzing the pedigree depth. Investigating the pedigree depth is another way to evaluate the quality of other parameters: a deeper pedigree means more information is available, resulting in more accurate calculations of the study parameters ( Gutiérrez et al., 2003Gutiérrez, J. P.; Altarriba, J.; Díaz, C.; Quintanilla, R.; Cañón, J. and Piedrafita, J. 2003. Pedigree analysis of eight Spanish beef cattle breeds. Genetics Selection Evolution 35:43-63. https://doi.org/10.1186/1297-9686-35-1-43
https://doi.org/10.1186/1297-9686-35-1-4...
).
The GI is an important factor to analyze because it affects the genetic progress of a herd. The shorter the GI, the faster the genetic change of the population. In spite of the deviation observed in the case of GI values, the result for the average GI agreed with the expected value, because some herds were raised on pastures, which can result in animals producing calves at older ages.
A study carried out by Leroy (2014)Leroy, G. 2014. Inbreeding depression in livestock species: review and meta-analysis. Animal Genetics 45:618-628. https://doi.org/10.1111/age.12178
https://doi.org/10.1111/age.12178...
on Holstein cattle reared primarily in countries such as the United States and Canada, where feeding systems are almost exclusively feedlots, found that the average GI was five years, which demonstrates the effort these countries make to avoid long GI. Nevertheless, other international studies have reported a similar GI to those found in this work, for example, an average GI of 6.12 years for Holstein cattle in Spain ( Rodríguez-Ramilo et al., 2015Rodríguez-Ramilo, S. T.; Fernandez, J.; Toro, M. A.; Hernández, D. and Villanueva, B. 2015. Genome-wide estimates of coancestry, inbreeding and effective population size in the Spanish Holstein population. PLoS ONE 10:e0124157. https://doi.org/10.1371/journal.pone.0124157
https://doi.org/10.1371/journal.pone.012...
).
An important consideration is that the use of imported semen, particularly before the genomic era, resulted in the use of genetic material from older bulls. This is a particular problem in countries that rely almost exclusively on imported semen because it can take a long time for the imported semen to be progeny-tested and used on a large scale. At that point, the age of the proven bull was already high, because the long process occurred. Furthermore, the practice of artificial insemination means semen can be used for many years after it is collected, thereby causing a large GI. This extensive use of semen from old bulls (with advanced age) likely explains the observed higher GI of sire–progeny compared with dam–progeny. Additionally, the increase in the use of embryo transfer and in vitro fertilization, although they do facilitate the use of genetic material from superior reproducers, can result in an unequal genetic contribution of some particular bulls. This can lead to an increase in GI and F levels and compromise the genetic gain. In the case of the gametic passages, the mean GI value of sire–progeny was found higher in relation to dam–progeny, probably explained by the intense use of semen from old bulls (with advanced age). Because of the use of artificial insemination, bulls can still be used while their semen is preserved for many years, thereby eventually causing a large GI. However, in the present genomic era, this risk is likely to decrease due to greater substitution of the animals and greater availability of young bulls.
Females do not have a high turnover rate within the herd, because the farmers require a stable herd to generate profits and keep the cows for a long period ( García-Ruiz et al., 2016García-Ruiz, A.; Cole, J. B.; VanRaden, P. M.; Wiggans, G. R.; Ruiz-López, F. J.; Van Tassell, C. P. 2016. Changes in genetic selection differentials and generation intervals in US Holstein dairy cattle as a result of genomic selection. Proceedings of the National Academy of Sciences 113:E3995-E4004. https://doi.org/10.1073/pnas.1519061113
https://doi.org/10.1073/pnas.1519061113...
). It is likely that the females with a higher GI come from herds that do not perform genetic selection and only stop breeding cows that either lose their reproductive capability or present health problems.
In a study carried out with Holstein cattle in Spain, Rodríguez-Ramilo et al. (2015)Rodríguez-Ramilo, S. T.; Fernandez, J.; Toro, M. A.; Hernández, D. and Villanueva, B. 2015. Genome-wide estimates of coancestry, inbreeding and effective population size in the Spanish Holstein population. PLoS ONE 10:e0124157. https://doi.org/10.1371/journal.pone.0124157
https://doi.org/10.1371/journal.pone.012...
, found a higher average GI for the sire–progeny passages (sire–son = 6.06, sire–daughter = 5.24), in comparison with dam–progeny passages (dam–son = 3.88, dam–daughter = 3.77). Likewise, García-Ruiz et al. (2016)García-Ruiz, A.; Cole, J. B.; VanRaden, P. M.; Wiggans, G. R.; Ruiz-López, F. J.; Van Tassell, C. P. 2016. Changes in genetic selection differentials and generation intervals in US Holstein dairy cattle as a result of genomic selection. Proceedings of the National Academy of Sciences 113:E3995-E4004. https://doi.org/10.1073/pnas.1519061113
https://doi.org/10.1073/pnas.1519061113...
found that, in the United States, a higher GI was observed for sire–progeny passages, with the GI being 6.9 years for both sire–son and sire–daughter gametic passages.
The proportion of identical genes by descent carried by the offspring is characterized by F, which in turn confirms the pedigree integrity ( Canaza-Cayo et al., 2014Canaza-Cayo, A. W.; Lopes, P. S.; Silva, M. V. G. B.; Cobuci, J. A.; Torres, R. A.; Martins, M. F. and Arbex, W. A. 2014. Estrutura populacional da raça Girolando. Ciência Rural 44:2072-2077. https://doi.org/10.1590/0103-8478cr20131307
https://doi.org/10.1590/0103-8478cr20131...
). In the present study, the distribution of animals per year and inbreeding levels ( Table 2 ) indicates that the Holstein cattle population in southern Brazil is controlled by the mating process; therefore, the population exhibits relatively low levels of inbreeding. A considerable increase in the proportion of animals with some percentage of inbreeding was observed in the early 1980s. This increase could be attributed to the relatively smaller number of animals during that time, when few herds were controlled, the same breeding methodology was used for a long period of time, and there were a low number of bulls available.
The maximum inbreeding value observed for an individual was 25%. Typically, animals with high individual inbreeding rates are present in the herd due to an attempt to fix certain alleles linked to important traits, which may cause an increase in inbreeding rates in the long term. Furthermore, the excessive use of certain animals, or even sons and grandsons of specific sires, can increase F to undesirable levels, which implies that a wide range of genes from a particular animal may prompt problems associated with high selection pressures ( Gutiérrez et al., 2003Gutiérrez, J. P.; Altarriba, J.; Díaz, C.; Quintanilla, R.; Cañón, J. and Piedrafita, J. 2003. Pedigree analysis of eight Spanish beef cattle breeds. Genetics Selection Evolution 35:43-63. https://doi.org/10.1186/1297-9686-35-1-43
https://doi.org/10.1186/1297-9686-35-1-4...
). Therefore, to avoid these problems and maintain genetic diversity, selection programs must propose different strategies ( Fernández et al., 2011Fernández, J.; Meuwissen, T. H. E.; Toro, M. A. and Maki-Tanila, A. 2011. Management of genetic diversity in small farm animal populations. Animal 5:1684-1698. https://doi.org/10.1017/S1751731111000930
https://doi.org/10.1017/S175173111100093...
).
According to Dezetter et al. (2015)Dezetter, C.; Leclerc, H.; Mattalia, S.; Barbat, A.; Boichard, D. and Ducrocq, V. 2015. Inbreeding and crossbreeding parameters for production and fertility traits in Holstein, Montbéliarde, and Normande cows. Journal of Dairy Science 98:4904-4913. https://doi.org/10.3168/jds.2014-8386
https://doi.org/10.3168/jds.2014-8386...
, inbreeding values around 4-5% could be considered low, and thus, the value of 4.99% presented here should not exert a remarkable impact on the economic traits of the studied population. Additionally, the obtained average F value (4.99%) was similar to the previously reported average F values of 4.9% ( Hinrichs and Thaller, 2011Hinrichs, D. and Thaller, G. 2011. Pedigree analysis and inbreeding effects on calving traits in large dairy herds in Germany. Journal of Dairy Science 94:4726-4733. https://doi.org/10.3168/jds.2010-4100
https://doi.org/10.3168/jds.2010-4100...
) and 6% ( Stachowicz et al., 2011Stachowicz, K.; Sargolzaei, M.; Miglior, F. and Schenkel, F. S. 2011. Rates of inbreeding and genetic diversity in Canadian Holstein and Jersey cattle. Journal of Dairy Science 94:5160-5175. ) for Holstein cattle in Germany and Canada, respectively. Considering the obtained average F values, these authors suggested that, within their studied populations, the possibility of the accumulation of the negative effects on the herd would only become an aggravating factor when considerable increases in F values were observed as the result of poor selection of animals and the loss of genetic diversity.
Upon evaluating the mean F value for each sex, females were observed as the main cause of inflating inbreeding rates (7.25%). The observation can be explained by considering that animals that remain in the herd for a longer period give rise to more descendants, resulting in an increased transfer of genetic material from past generations. Additionally, various herds utilize semen from the same bulls in both dams and daughters, which raises the coefficient of female inbreeding over the years. Holstein cows raised in Germany also had a higher average F value ( Hinrichs and Thaller, 2011Hinrichs, D. and Thaller, G. 2011. Pedigree analysis and inbreeding effects on calving traits in large dairy herds in Germany. Journal of Dairy Science 94:4726-4733. https://doi.org/10.3168/jds.2010-4100
https://doi.org/10.3168/jds.2010-4100...
), but females did not cause an accretion in the average level of inbreeding because the replacement rates were controlled with the help of a genetic selection program.
In many populations, the management of F is comprehended as a method of maintaining the value of inbreeding at a desirable level. However, no exaggerated F values have been reported, because F mainly depends on the generation analyzed. Conversely, in closed population groups, there will always be some animals with high F values. Thus, for a population, the relationship between inbreeding and the effective population size becomes crucial, because the impact of inbreeding on the entire herd can be evaluated and not only on specific individuals ( Goyache et al., 2010Goyache, F.; Fernández, I.; Espinosa, M. A.; Payeras, L.; Pérez-Pardal, L.; Gutiérrez, J. P.; Royo, L. J. and Álvarez, L. 2010. Análisis demográfico y genético de la raza ovina Mallorquina. Información Técnica Económica Agraria 106:3-14. ).
The results of Nē and F were grouped in periods equivalent to five years ( Figure 3 ), thereby facilitating the illustration of the findings gathered in the long period of analysis. The figure revealed that the F and Nē values were inversely related, as expected. It was also observed that there were oscillations in F values, beginning at 12.75% in the years 1980-1984, followed by a proportional decrease in the values over subsequent years. For Nē , the highest values were observed in the 2005-2009 period, while the lowest values were in the 1980-1984 period. The high Nē value in the 2005-2009 period could be due to the greater availability of bulls in the market at that time, resulting in a better chance of increasing the genetic diversity. Silva et al. (2016)Silva, M. H. M. A.; Malhado, C. H. M.; Costa Jr, J. L.; Cobuci, J. A.; Costa, C. N. and Carneiro, P. L. S. 2016. Population genetic structure in the Holstein breed in Brazil. Tropical Animal Health and Production 48:331-336. https://doi.org/10.1007/s11250-015-0956-7
https://doi.org/10.1007/s11250-015-0956-...
also demonstrated an increase of the effective population size in recent years, mentioning that this fact could be related to the increase in the use of artificial insemination, which may allow an increase in the genetic variability of the Brazilian Holstein population.
The effective population size is also a key parameter in the genetic conservation of a population, due to its inverse relationship with increased inbreeding ( Barros, 2009Barros, E. A. 2009. Estrutura populacional e variabilidade genética do núcleo de conservação da raça Marota no Piauí. Dissertação (M.Sc.). Universidade Federal Rural de Pernambuco, Recife. ). Indeed, the smaller the population size in previous generations, the greater the number of common ancestors ( Breda et al., 2004Breda, F. C.; Euclydes, R. F.; Pereira, C. S.; Torres, R. A.; Carneiro, P. L. S.; Sarmento, J. L. R.; Torres Filho, R. A. and Moita, A. K. F. 2004. Endogamia e limite de seleção em populações selecionadas obtidas por simulação. Revista Brasileira de Zootecnia 33:2017-2025. https://doi.org/10.1590/S1516-35982004000800013
https://doi.org/10.1590/S1516-3598200400...
) ( Figure 3 ). Additionally, Meuwissen (2009)Meuwissen, T. 2009. Genetic management of small populations: A review. Acta Agriculturae Scandinavica Section A 59:71-79. https://doi.org/10.1080/09064700903118148
https://doi.org/10.1080/0906470090311814...
reported that acceptable rates of inbreeding and Nē are necessary to maintain adequate genetic diversity and can be obtained through the management of breeding programs.
The AR obtained in this study indicated a proper genetic contribution of the founders, transmitted over the generations. Gutiérrez et al. (2003)Gutiérrez, J. P.; Altarriba, J.; Díaz, C.; Quintanilla, R.; Cañón, J. and Piedrafita, J. 2003. Pedigree analysis of eight Spanish beef cattle breeds. Genetics Selection Evolution 35:43-63. https://doi.org/10.1186/1297-9686-35-1-43
https://doi.org/10.1186/1297-9686-35-1-4...
stated that AR values below 1% indicate a great diversity of bulls used throughout history to form populations. Additionally, the AR value achieved in the present study signaled that breeders have not exclusively used the same few individuals for breeding and, therefore, they have provided a favorable level of genetic diversity in southern Brazil. Silva et al. (2016)Silva, M. H. M. A.; Malhado, C. H. M.; Costa Jr, J. L.; Cobuci, J. A.; Costa, C. N. and Carneiro, P. L. S. 2016. Population genetic structure in the Holstein breed in Brazil. Tropical Animal Health and Production 48:331-336. https://doi.org/10.1007/s11250-015-0956-7
https://doi.org/10.1007/s11250-015-0956-...
reported an AR value of 0.13% in Holstein cattle in Brazil, indicating that a variety of bulls were also used in that population. The authors suggested that the low AR could be related to the rapid expansion of the semen market in the 1970s, resulting in a more balanced use of bulls.
The fa, which generally represents the minimum number of animals (founders or not) required to produce the observed genetic diversity, can explicitly explain the complete genetic diversity of the studied population. Muasya et al. (2013)Muasya, T. K.; Peters, K. J. and Kahi, A. K. 2013. Breeding structure and genetic variability of the Holstein Friesian dairy cattle population in Kenya. Animal Genetic Resources 52:127-137. https://doi.org/10.1017/S2078633613000039
https://doi.org/10.1017/S207863361300003...
, explained that the larger the difference between fe and fa, the smaller the contribution of the founders. The small observed difference between fe and fa in the current study implies a high level of participation of the founding animals in the population throughout the generations, which contributes to the large genetic variability of the population.
Boichard et al. (1997)Boichard, D.; Maignel, L. and Verrier, É. 1997. The value of using probabilities of gene origin to measure genetic variability in a population. Genetics Selection Evolution 29:5-23. https://doi.org/10.1186/1297-9686-29-1-5
https://doi.org/10.1186/1297-9686-29-1-5...
suggested that the imbalance between the base and the reference population due to loss in the genetic diversity that existed in the founding animals can be studied through the relationship between the effective number of founders and the effective number of ancestors (fe:fa). A higher fe:fa ratio means genetic bottlenecks and loss of ancestral genes. The fe:fa ratio in the present study was 1.045, indicating that the genetic variability was not reduced.
Conclusions
The inbreeding coefficients observed in the studied population maintained desirable levels over de years. Additionally, the high number of founding animals and continuous change of unrelated sires among the generations resulted in significant genetic variability among the herds. However, a continuous monitoring of the selection process is recommended so that the inbreeding rates remain controlled, maintaining the appropriate genetic variability for the next generations.
Acknowledgments
The authors thank the Associação Paranaense de Criadores de Bovinos da Raça Holandesa (APCBRH) for providing the pedigree and phenotypic data and the Coordenação de Aperfeiçoamento de Pessoal de Nível Superior (CAPES) for granting the funds to develop this research.
References
- ASBIA - Associação Brasileira de Inseminação Artificial. 2018. Index ASBIA - Importação, exportação e comercialização de sêmen.
- Barros, E. A. 2009. Estrutura populacional e variabilidade genética do núcleo de conservação da raça Marota no Piauí. Dissertação (M.Sc.). Universidade Federal Rural de Pernambuco, Recife.
- Barros, E. A.; Brasil, L. H. A.; Tejero, J. P.; Delgado-Bermejo, J. V. and Ribeiro, M. N. 2017. Population structure and genetic variability of the Segureña sheep breed through pedigree analysis and inbreeding effects on growth traits. Small Ruminant Research 149:128-133. https://doi.org/10.1016/j.smallrumres.2017.02.009
» https://doi.org/10.1016/j.smallrumres.2017.02.009 - Boichard, D.; Maignel, L. and Verrier, É. 1997. The value of using probabilities of gene origin to measure genetic variability in a population. Genetics Selection Evolution 29:5-23. https://doi.org/10.1186/1297-9686-29-1-5
» https://doi.org/10.1186/1297-9686-29-1-5 - Breda, F. C.; Euclydes, R. F.; Pereira, C. S.; Torres, R. A.; Carneiro, P. L. S.; Sarmento, J. L. R.; Torres Filho, R. A. and Moita, A. K. F. 2004. Endogamia e limite de seleção em populações selecionadas obtidas por simulação. Revista Brasileira de Zootecnia 33:2017-2025. https://doi.org/10.1590/S1516-35982004000800013
» https://doi.org/10.1590/S1516-35982004000800013 - Canaza-Cayo, A. W.; Lopes, P. S.; Silva, M. V. G. B.; Cobuci, J. A.; Torres, R. A.; Martins, M. F. and Arbex, W. A. 2014. Estrutura populacional da raça Girolando. Ciência Rural 44:2072-2077. https://doi.org/10.1590/0103-8478cr20131307
» https://doi.org/10.1590/0103-8478cr20131307 - Dezetter, C.; Leclerc, H.; Mattalia, S.; Barbat, A.; Boichard, D. and Ducrocq, V. 2015. Inbreeding and crossbreeding parameters for production and fertility traits in Holstein, Montbéliarde, and Normande cows. Journal of Dairy Science 98:4904-4913. https://doi.org/10.3168/jds.2014-8386
» https://doi.org/10.3168/jds.2014-8386 - Falconer, D. S. and Mackay, T. F. C. 1996. Introduction to quantitative genetics. 4th ed. Longman Editors, Essex, UK.
- Fernández, J.; Meuwissen, T. H. E.; Toro, M. A. and Maki-Tanila, A. 2011. Management of genetic diversity in small farm animal populations. Animal 5:1684-1698. https://doi.org/10.1017/S1751731111000930
» https://doi.org/10.1017/S1751731111000930 - García-Ruiz, A.; Cole, J. B.; VanRaden, P. M.; Wiggans, G. R.; Ruiz-López, F. J.; Van Tassell, C. P. 2016. Changes in genetic selection differentials and generation intervals in US Holstein dairy cattle as a result of genomic selection. Proceedings of the National Academy of Sciences 113:E3995-E4004. https://doi.org/10.1073/pnas.1519061113
» https://doi.org/10.1073/pnas.1519061113 - Goyache, F.; Fernández, I.; Espinosa, M. A.; Payeras, L.; Pérez-Pardal, L.; Gutiérrez, J. P.; Royo, L. J. and Álvarez, L. 2010. Análisis demográfico y genético de la raza ovina Mallorquina. Información Técnica Económica Agraria 106:3-14.
- Gutiérrez, J. P.; Altarriba, J.; Díaz, C.; Quintanilla, R.; Cañón, J. and Piedrafita, J. 2003. Pedigree analysis of eight Spanish beef cattle breeds. Genetics Selection Evolution 35:43-63. https://doi.org/10.1186/1297-9686-35-1-43
» https://doi.org/10.1186/1297-9686-35-1-43 - Gutiérrez, J. P. and Goyache, F. 2005. A note on ENDOG: a computer program for analysing pedigree information. Journal of Animal Breeding and Genetics 122:172-176. https://doi.org/10.1111/j.1439-0388.2005.00512.x
» https://doi.org/10.1111/j.1439-0388.2005.00512.x - Gutiérrez, J. P.; Cervantes, I.; Molina, A.; Valera, M. and Goyache, F. 2008. Individual increase in inbreeding allows estimating effective sizes from pedigrees. Genetics Selection Evolution 40:359-378. https://doi.org/10.1051/gse:2008008
» https://doi.org/10.1051/gse:2008008 - Groeneveld, E.; Westhuizen, B. V. D.; Maiwashe, A.; Voordewind, F. and Ferraz, J. B. S. 2009. POPREP: a generic report for population management. Genetics and Molecular Research 8:1158-1178. https://doi.org/10.4238/vol8-3gmr648
» https://doi.org/10.4238/vol8-3gmr648 - Hammami, H.; Rekik, B.; Bastin, C.; Soyeurt, H.; Bormann, J.; Stoll, J. and Gengler, N. 2009. Environmental sensitivity for milk yield in Luxembourg and Tunisian Holsteins by herd management level. Journal of Dairy Science 92:4604-4612. https://doi.org/10.3168/jds.2008-1513
» https://doi.org/10.3168/jds.2008-1513 - Hinrichs, D. and Thaller, G. 2011. Pedigree analysis and inbreeding effects on calving traits in large dairy herds in Germany. Journal of Dairy Science 94:4726-4733. https://doi.org/10.3168/jds.2010-4100
» https://doi.org/10.3168/jds.2010-4100 - Leroy, G. 2014. Inbreeding depression in livestock species: review and meta-analysis. Animal Genetics 45:618-628. https://doi.org/10.1111/age.12178
» https://doi.org/10.1111/age.12178 - MacCluer, J. W.; Boyce, A. J.; Dyke, B.; Weitkamp, R.; Pfenning, D. W. and Parsons, C. J. 1983. Inbreeding and pedigree structure in Standardbred horses. Journal of Heredity 74:394-399. https://doi.org/10.1093/oxfordjournals.jhered.a109824
» https://doi.org/10.1093/oxfordjournals.jhered.a109824 - Meuwissen, T. H. E. and Luo, Z. 1992. Computing inbreeding coefficients in large populations. Genetics Selection Evolution 24:305-313. https://doi.org/10.1186/1297-9686-24-4-305
» https://doi.org/10.1186/1297-9686-24-4-305 - Meuwissen, T. 2009. Genetic management of small populations: A review. Acta Agriculturae Scandinavica Section A 59:71-79. https://doi.org/10.1080/09064700903118148
» https://doi.org/10.1080/09064700903118148 - Muasya, T. K.; Peters, K. J. and Kahi, A. K. 2013. Breeding structure and genetic variability of the Holstein Friesian dairy cattle population in Kenya. Animal Genetic Resources 52:127-137. https://doi.org/10.1017/S2078633613000039
» https://doi.org/10.1017/S2078633613000039 - Pedrosa, V. B.; Santana Jr, M. L.; Oliveira, P. S.; Eler, J. P. and Ferraz, J. B. S. 2010. Population structure and inbreeding effects on growth traits of Santa Inês sheep in Brazil. Small Ruminant Research 93:135-139.
- Rodríguez-Ramilo, S. T.; Fernandez, J.; Toro, M. A.; Hernández, D. and Villanueva, B. 2015. Genome-wide estimates of coancestry, inbreeding and effective population size in the Spanish Holstein population. PLoS ONE 10:e0124157. https://doi.org/10.1371/journal.pone.0124157
» https://doi.org/10.1371/journal.pone.0124157 - Sargolzaei, M.; Iwaisaki, H. and Colleau, J. 2006. A software package for pedigree analysis and monitoring genetic diversity. Department of Agro-biology, Niigata University, Japan.
- Silva, M. H. M. A.; Malhado, C. H. M.; Costa Jr, J. L.; Cobuci, J. A.; Costa, C. N. and Carneiro, P. L. S. 2016. Population genetic structure in the Holstein breed in Brazil. Tropical Animal Health and Production 48:331-336. https://doi.org/10.1007/s11250-015-0956-7
» https://doi.org/10.1007/s11250-015-0956-7 - Stachowicz, K.; Sargolzaei, M.; Miglior, F. and Schenkel, F. S. 2011. Rates of inbreeding and genetic diversity in Canadian Holstein and Jersey cattle. Journal of Dairy Science 94:5160-5175.
Publication Dates
-
Publication in this collection
27 Feb 2020 -
Date of issue
2020
History
-
Received
20 Mar 2019 -
Accepted
20 Nov 2019