Abstract
This study evaluated the correlation between measurements of rib-eye areas of sheep carcasses by traditional methods and those obtained by scanned images. Thirty pictures of the longissimus dorsi muscle of sheep carcasses were drawn on tracing paper and analyzed for muscle area (rib-eye) using four methods: scanned images, which utilizes the software DDA -Determinador Digital de Áreas (Digital Area Determiner); measurements "A" and "B" applied to the equation: (A/2 × B/2) × π; Planimeter method and rib-eye grid method. All rib-eye area figures were measured five times by each method, setting up a completely randomized experiment with four treatments and five replicates. Data were submitted to analysis of variance and means were compared by the Tukey test, Pearson correlation and linear regression by the SAS software. Easiness and difficulties perceived by the evaluators in the performance of each method were also recorded. The method of scanned images analyzed by the software DDA showed high correlation with the methods traditionally used, and can be considered feasible to determine carcass rib-eye area, with the advantage of being easy to operate, flexible, and economical.
carcass assessment; image analysis; longissimus dorsi area; software
TECHNICAL NOTE
Measurement of rib-eye area by the method of digital images
Otoniel Geter Lauz FerreiraI; Fábio Diniz RossiII; Régis Antônio Teixeira CoelhoIII; Vivian Francieli FuciliniIII; Marlova BenedettiIII
IDZ/FAEM/UFPEL
IIIFFarroupilha - Alegrete Campus
III IFFarroupilha - Santo Augusto Campus
ABSTRACT
This study evaluated the correlation between measurements of rib-eye areas of sheep carcasses by traditional methods and those obtained by scanned images. Thirty pictures of the longissimus dorsi muscle of sheep carcasses were drawn on tracing paper and analyzed for muscle area (rib-eye) using four methods: scanned images, which utilizes the software DDA -Determinador Digital de Áreas (Digital Area Determiner); measurements "A" and "B" applied to the equation: (A/2 × B/2) × π; Planimeter method and rib-eye grid method. All rib-eye area figures were measured five times by each method, setting up a completely randomized experiment with four treatments and five replicates. Data were submitted to analysis of variance and means were compared by the Tukey test, Pearson correlation and linear regression by the SAS software. Easiness and difficulties perceived by the evaluators in the performance of each method were also recorded. The method of scanned images analyzed by the software DDA showed high correlation with the methods traditionally used, and can be considered feasible to determine carcass rib-eye area, with the advantage of being easy to operate, flexible, and economical.
Key Words: carcass assessment, image analysis, longissimus dorsi area, software
Introduction
Research results have shown that analyzing the components of the longissimus dorsi muscle at the 12th rib location are good indicators of carcass cuts yield and composition, enabling the comparison of different genetic groups and management practices used (Louvandini et al., 2006). Along with subcutaneous fat thickness over the biceps femoris muscle in the rump, these measures might be employed in identifying the best point of slaughter for animals in accordance with specific market requirements. The area of the longissimus dorsi muscle, also called rib-eye area, is directly related to the amount of muscle in the carcass, especially in the loin and round, and should be considered in animal studies as an indicator of muscle development and yield of high valuable cuts (Williams, 2002).
The assessment of the rib-eye area is usually practiced in research trials involving farm animals. It is possible to predict rib-eye area in vivo using ultrasound, a noninvasive technique that allows rapid animal assessment with good accuracy (Luz e Silva et al., 2003) and computer tomography as well (Junkuszew & Ringdorfer, 2005). In most cases, carcass traits are determined in the cross-section of the longissimus muscle obtained between the 12th and 13th thoracic vertebra (Osório & Osório, 2005). Depending on the amount of animals to be evaluated, such measurements can become time consuming and tedious, leading to errors. Thus, methodologies that could make this task easier are always welcome and being sought by researches. In this sense, the software DDA (digital determiner of area) was developed, where digital pictures of the rib-eye can be used to measure their area, which would represent a cheaper, faster, and still accurate method when compared with the traditional ones currently used (Ferreira et al., 2009). This study evaluated the correlation between the rib-eye area measurements obtained in sheep carcass by traditional methods or by the method of digital images analyzed by the software DDA.
Material and Methods
Thirty pictures of the longissimus dorsi muscle from sheep carcasses were used for the development of this study. Longissimus dorsi rib-eye areas were drawn on tracing paper according to the methodology described by Osório & Osório (2005) and then analyzed for muscle area (rib-eye) using four methods. The first method was the one of scanned images (digital method): The longissimus dorsi pictures above mentioned were scanned in a resolution of 100 dpi and saved as monochrome bitmap image, then they were analyzed for their area using software DDA (Ferreira et al., 2008); The second method consisted on measuring both "A" and "B" and then applying the values into the following equation: (A/2 × B/2) × π, where "A" is the maximal length of the longissimus dorsi muscle and "B" is its maximal depth; both measurements were taken perpendicularly from one another; π equals to 3.1416 (Osório & Osório, 2005). The third method was based on a planimeter Koizumi,Type KP-27 (Pinto, 1988; Osório & Osório, 2005). The last method used was the rib-eye grid, in which the grid was placed on the cut surface of the longissimus dorsi muscle and, the dots, which were completely within the perimeter of the muscle, were counted. The dots on the perimeter of the muscle surface were counted and the number obtained was divided by two. Rib-eye area was obtained by adding the results of both steps described above and multiplying it to 0.01 cm2 (Pinto, 1988; Osório & Osório, 2005). All measurements were taken five times by each method, setting up an experiment with four treatments and five replicates in a completely randomized design. The values obtained were submitted to analysis of variance (P<0.05) and means were compared by the Tukey test, Pearson correlation and linear regression by SAS (Statistical Analysis System, version 9.1). Easiness and difficulties perceived by the evaluators in the performance of each method were also recorded.
Results and Discussion
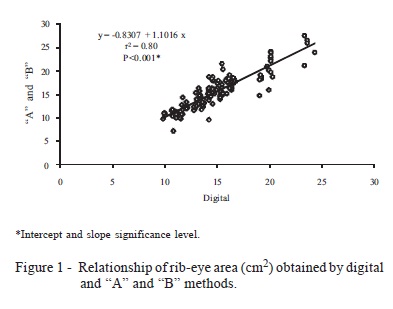
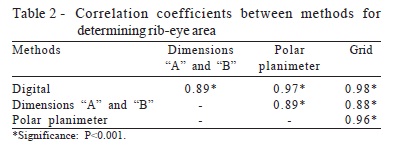
The correlation between the digital method and the one that measures "A" and "B" was high (r = 0.89; P<0.0001), with no significant difference between the area values obtained by these two methods, which showed mean value for rib-eye area higher than those observed in the planimeter and grid methods. In addition, the method that measures "A" and "B" also had greater rib-eye area range. The method that uses "A" and "B" measurements underestimates small areas and overestimates larger rib-eye areas. This may be due to the fact that rib-eye area is calculated based on the area of an ellipse, a geometric figure that would simulate the longissimus dorsi shape.
The dispersion of rib-eye area values in relation to the vertical axis of the regression curve illustrates the variation of the values obtained by the method that uses "A" and "B" values in relation to the digital method (Figure 1). This variation between trials (replications) probably comes from the irregularity of the margins of the figures, which leads to difficulty in determining the exact location where the maximum "A" and "B" measures are found. This difficulty opposes to the easiness of execution and economy of the method, which only requires a ruler and a calculator.
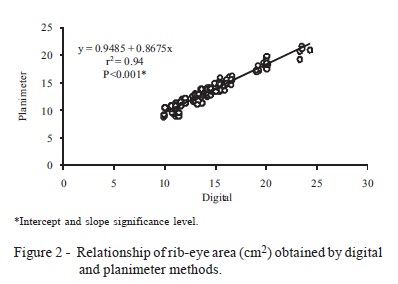
The correlation coefficient obtained for the rib-eye area values determined by the digital and the planimeter methods was 0.97 (P<0.0001). In this case, the digital method overestimated the rib-eye area in relation to that obtained by the planimeter method (Table 1). This fact can be seen by the slope (less than one) of the regression equation between the two methods (Figure 2), according to the methodology used by Tavares-Júnior et al. (2002) and Godoy et al. (2007). However, the dispersion of points in relation to the vertical axis (axis of the area obtained by the method of planimeter) was low, indicating little variation of these data and providing a high coefficient of determination. The accuracy of determinations from the planimeter is dependent on the size of the figure assessed, ranging from 0.1 to 1% of this area. The smaller the figure, the lower the accuracy, with error values tending to 1% of the measured area.
Polar planimeter measurement allows a relatively fast method, but, with its large number of figures, it is cumbersome and visually tiring. The main difficulty in implementing this method is the need for good fixation of the figure on the desktop, because if it moves, it is necessary to restart the measurement procedure.
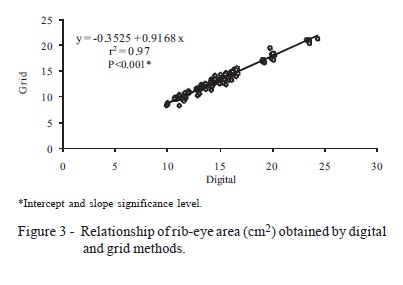
In the correlation between the Digital and Grid methods, it was observed that, despite its high coefficient (r = 0.98; P<0.0001), the Digital method also overestimated the muscle area, as occurred in comparison with the planimeter method (Table 1). However, it is important to mention that, despite the high correlations with other methods (Table 2), the Grid method showed the lowest mean area value (Table 1). The dispersion of points in relation to the vertical axis (axis of the area obtained by the Grid method) was low, indicating little variation of these data and providing a high coefficient of determination (Figure 3).
Amongst the methods tested, the grid method presented the greatest difficulties in implementing this study. Due to the size of subdivisions (0.01 cm2), the determination of area fractions of the small squares is extremely difficult, often requiring the use of a magnifying glass for easier viewing and counting.
Analyzing the methods jointly, it can be noted that regardless of the areas obtained, they presented high correlation (Table 2), which makes them liable for any use.
Considering the results previously discussed, it is possible to infer that the digital method tested here is useful for the determination of rib-eye area, demonstrating accuracy and precision. The intercept of the regression equations, in most of the comparisons, near zero, values of slope close to the unity and r2 close to 1,0 confirm this result (Tavares-Júnior et al., 2002; Godoy et al., 2007). Similarly, Cartaxo & Sousa (2008) considered the ultrasound accurate and it showed a correlation of 0.75 (P<0.001) despite the 2.19 cm2 difference in evaluating the carcass. In turn, while observing differences up to 7.88 cm2, Prado et al. (2004) considered the assessment of the rib-eye area by ultrasound highly reliable (80%), compared with the carcass evaluation of beef cattle.
In spite of the high correlation with other methods, the digital method herein tested was also quick and easy to perform even with the large number of images analyzed (150 evaluations), as previously affirmed by the study of Ferreira et al. (2009).
Conclusions
The method of digital images analyzed by the software DDA might be recommended to estimate sheep carcasses rib-eye area, with the advantages of being easily operated, fast, and economical.
Received May 4, 2011 and accepted January 24, 2012.
Corresponding author: oglferreira@gmail.com
- CARTAXO, F.Q.; SOUSA, W.H. Correlações entre as características obtidas in vivo por ultra-som e as obtidas na carcaça de cordeiros terminados em confinamento. Revista Brasileira de Zootecnia, v.37, p.1490-1495, 2008.
- FERREIRA, O.G.L.; ROSSI, F.D.; ANDRIGHETTO, C. DDA - Determinador Digital de Áreas: Software para determinação de área foliar, índice de área foliar e área de olho de lombo. Versão 2.0. Santo Augusto: IFFarroupilha. 2008.
- FERREIRA, O.G.L.; ROSSI, F.D.; ANDRIGHETTO, C. Determinação de área foliar, índice de área foliar e área de olho de lombo através de imagens digitais. In: REUNIÃO ANUAL DA SOCIEDADE BRASILEIRA DE ZOOTECNIA, 46., 2009, Maringá. Anais... Maringá: Sociedade Brasileira de Zootecnia/ Aptor, [2009]. (CD-ROM).
- GODOY, L.J.G.; YANAGIWARA, R.S.; VILLAS BOAS, R.L. et al. Análise da imagem digital para estimativa da área foliar em plantas de laranja "Pêra". Revista Brasileira de Fruticultura, v.29, p.420-424, 2007.
- JUNKUSZEW, A.; RINGDORFER, F. Computer tomography and ultrasound measurement at methods for the body composition of lambs. Small Ruminant Research, v.56, p.121-125, 2005.
- LOUVANDINI, H.; McMANUS, C.M.; DALLAGO, B.S. et al. Evaluations of carcass traits, non-carcass components and 12th rib analysis of hair sheep supplemented with phosphorus. Revista Brasileira de Zootecnia, v.35, p.550-554, 2006.
- LUZ E SILVA, S.; LEME, P.R.; PEREIRA, A.S.C. et al. Correlações entre características de carcaça avaliadas por ultra-som e pós abate em novilhos Nelore alimentados com altas proporções de concentrado. Revista Brasileira de Zootecnia, v.32, p.1236-1242, 2003.
- OSÓRIO, J.C.S; OSÓRIO, M.T.M. Produção de carne ovina: técnicas de avaliação "in vivo" e na carcaça. 2.ed. Pelotas: Programa de Pós-Graduação em Zootecnia/Faculdade de Agronomia Eliseu Maciel/Universidade Federal de Pelotas, 2005. 82p.
- PINTO, L.E.K. Curso de topografia Salvador: Centro Editorial e Didático da UFBA, 1988. 344p.
- PRADO, C.S.; PÁDUA, J.T.; CORREA, M.P.C. et al. Comparação de diferentes métodos de avaliação da área de olho-de-lombo e cobertura de gordura em bovinos de corte. Ciência Animal Brasileira v.5, p.141-149, 2004.
- TAVARES-JÚNIOR, J.E.; FAVARIN, J.L.; DOURADO-NETO, D.; et al. Análise comparativa de métodos de estimativa de área foliar em cafeeiro. Bragantia, v.61, p.199-203, 2002.
- WILLIAMS, A.R. [2002]. Ultrasound applications in beef cattle carcass research and management Available at: <http://asas.org/symposia/esupp2/jas2278.pdf>. Accessed on: Nov. 5, 2010.
Publication Dates
-
Publication in this collection
25 Apr 2012 -
Date of issue
Mar 2012
History
-
Received
04 May 2011 -
Accepted
24 Jan 2012


