
Abstract
In the bauxite flotation process, concentrate grade and tailings grade are key production indicators; however, they are difficult to measure online. It is also difficult to develop an effective mathematical model for the process because of the complex non-linear and uncertain relationship among the feed parameters (feed grade, pulp density, slurry particle size, etc.), froth features and production indicators. Therefore, an online hybrid modeling method is proposed by analyzing the multiple parameters that affect the production indicators. First, according to the correlation and redundancy in the feed and froth feature parameters, the kernel principle component analysis (KPCA) is used to reduce the number of the parameters. Then, a neutral network model of the regular extreme learning machine (RELM), which is based on wavelet function, is presented to predict these two indicators. To improve generalization capability and prediction accuracy, information entropy is used to distribute the weight of the two models based on their predicting error. At last, an on-line updating strategy of the hybrid model is constructed in order to investigate the influence of the working conditions. The proposed method is tested on the diasporic-bauxite flotation process and shows high predictive accuracy and generalization capability. It lays the foundation for optimal control of the operation parameters based on mineral grade in the flotation process.
Keywords:
froth flotation; image features; online predictive model; extreme learning machine (ELM)
1. Introduction
Online modeling is a useful tool for operating complex industrial processes. Updated models are needed for early reaction to disturbances that affect the process production indicators and the end product quality. In the bauxite flotation process, the concentrate grade and the tailings grade, which is measured by the mass ratio of Al2O3 and SiO2 (m (Al2O3)/m (SiO2) =A/S),are the main production indicators, but they are hard to achieve by online measurements (Morar et al., 2012MORAR, S. H., HARRIS, M. C., BRADSHAW, D. J. The use of machine vision to predict flotation performance [J]. Minerals Engineering. v. 36, p. 31-36, 2012., CAO et al., 2013CAO, B. F., XIEY. F., GUI, W.H. et al. Integrated prediction model of bauxite concentrate grade based on distributed machine vision [J]. Minerals Engineering. v. 53,p. 31-38, 2013., Moolman et al., 1996MOOLMAN, D. W., ALDRICH, C., SCHMITZ, G. P. J. et al. The interrelationship between surface froth characteristics and industrial flotation performance [J]. Minerals Engineering. v. 9, n. 8, p. 837-854, 1996.) and mainly depend on human laboratory analysis. However, off-line analysis is often long and tedious, with delay times ranging from 2 to 4 hours, making it difficult to offer a practical guide to industrial operations. The production indicators fluctuate with changing of feed parameters. Sometimes, a large fluctuation will exceed the allowable threshold, making the indicators unqualified. Typically, process operators predict the concentrate/tailings grade through the froth appearances and feed parameters to adjust operating parameters such as reagent dosage and aeration (Morar et al., 2012MORAR, S. H., HARRIS, M. C., BRADSHAW, D. J. The use of machine vision to predict flotation performance [J]. Minerals Engineering. v. 36, p. 31-36, 2012., Liu et al., 2008LIU, J. J., MACGREGOR, J. F. Froth-based modeling and control of flotation processes [J]. Minerals Engineering. v. 21, n. 9, p. 642-651, 2008., XU et al., 2012XU, C.H., GUI, W. H., YANG, C. H. Flotation process fault detection using output PDF of bubble size distribution [J]. Minerals Engineering. v. 26, n. 1, p. 5-12, 2012.). This manual operation is characterized by subjectivity and uncertainty, which might easily lead to excessive reagent dosages and working condition fluctuations. Thus, research for an indicator prediction is of great significance in stabilizing the flotation process, optimizing the flotation operation and reducing the overuse of reagents.
Much research has been conducted on detecting methods for the flotation process production indicators. Traditional mechanism-based modeling methods (Neethling et al., 2003NEETHLING, S. J. Simple approximations for estimating froth recovery [J]. International Journal of Mineral Processing. v. 89 n. 1, p. 44-52, 2008., Perez-Correa, 1998) made too many simplifications and assumptions because of the complexity of the flotation process mechanism, which makes it difficult to accurately describe the actual flotation process. The current methods for the detection of flotation indicators mainly integrate the field experience of operating workers, expert knowledge and statistical modeling rules. In González et al. (2003)GONZÁLEZ, G. D., ORCHARD, M, CERDA, J. L. et al. Local models for soft- sensors in a rougher flotation bank [J]. Minerals Engineering. v.16 n. 5, p. 441-453, 2003., feed grade, feed rate, pulp density and pulp level obtained during the copper flotation process were set as the model input data. Several prediction models including the autoregressive moving average model (ARMAX), neural networks, the fuzzy combination model and the partial least squares model (PLS) are compared in the prediction of copper concentrate grade. The feed rate, airflow rate and pH value of slurry in the copper flotation process are used as input variables in Hatonen et al., (1999)HATONEN J., HYOTYNIEMI H., MIETTUNEN J. et al. Using image information and partial least squares method to estimate mineral concentrations in mineral flotation[C]//Intelligent Processing and Manufacturing of Materials, 1999. IPMM'99. Proceedings of the Second International Conference on. IEEE. v. 1, p. 459-464, 1999. Moreover, the recursive partial least squares method was adopted to establish the concentrate grade and recovery rate prediction model of the lead and copper. These studies suggest that using the feed parameters to predict the concentrate grade is feasible. For the high-dimensional nonlinear characteristics of the feed parameters, the method of using kernel principal component analysis (KPCA) to extract the principal feature is proposed in Schölkopf et al.(1998)SCHÖLKOPF, B., SMOLA, A., MÜLLER, K. R. Nonlinear component analysis as a kernel eigenvalue problem [J]. Neural computation. v. 10, n. 5, p. 1299-1319, 1998. and LI et al. (2012)LI, H. B., CHAI, T. Y., YUE, H. Soft sensor and of technical indices based on KPCA-ELM application for flotation process [J]. CIESC Journal. v. 63, n. 9, p. 2892-2898, 2012.; the magnetite grade prediction model is then established, which demonstrates that the KPCA is capable of reducing the data dimension, eliminating redundancy among data, and further improving the model accuracy. This will easily result in an unsatisfactory dynamic tracking ability for the predictive model. In Hargrave et al. (1997)HARGRAVE, J. M., HALL, S. T. Diagnosis of concentrate grade and mass flowrate in tin flotation from color and surface texture analysis [J]. Minerals Engineering. v. 10, n. 6, p. 613-621, 1997. and Heinrich (2003)HEINRICH, G. An investigation into the use of froth color as sensor for metallurgical grade in a copper system [D].University of Cape Town, 2003., machine vision was introduced to the flotation process, and a relation model between the froth color and the concentrate grade was established. In CAO et al. (2013)CAO, B. F., XIEY. F., GUI, W.H. et al. Integrated prediction model of bauxite concentrate grade based on distributed machine vision [J]. Minerals Engineering. v. 53,p. 31-38, 2013. and Forbes (2007)FORBES G. Texture and bubble size measurements for modeling concentrate grade in flotation froth systems [D]. University of Cape Town, 2007., a relationship model between the size, velocity, froth load and production index was developed. The aforementioned research demonstrates that all of the visual features of the froth surface can reflect flotation performance, and it is a very effective method to predict the production indicators.
Therefore, this paper proposes an online hybrid predictive model (ON-HPM) of the production indicators based on multi-input data to improve the predictive precision of the model. First, the multi-input data influencing production indicators are analyzed, including the feed parameters and the froth feature parameters. Then, considering these parameters with high-dimensional, non-linear, redundant and non-relative properties, KPCA is used to reduce the dimension. Furthermore, a neutral network model of the regular extreme learning machine (RELM), which is based on wavelet function, is presented to predict the concentrate grade and the tailings grade. Then, information entropy is used to distribute the weight of the two models based on their predicting error. Considering the disturbances of the working condition fluctuation within the model, a model updating strategy is constructed. Lastly, the proposed method is validated in a diasporic-bauxite flotation plant.
This paper is organized as follows. Section 2 analyzes the diasporic-bauxite flotation process and influencing factors of the flotation process. Section 3 describes the online hybrid predictive model. Section 4 gives the application validations of the proposed predictive model in a bauxite flotation process, and a conclusion of this paper is given in Section 5.
2. Influencing factors of the bauxite flotation process
2.1 Process description of bauxite flotation
Diasporic-bauxite flotation in China is used as an example to describe the flotation process. This flotation is a direct flotation process that achieves flotation froth as the concentrate and underflow as the tailings. The diasporic-bauxite is characterized by a high content of Al2O3 and SiO2 and a low ratio of Al2O3 and SiO2 (m (Al2O3)/m (SiO2) =A/S, usually between 5 and 6). The bauxite flotation circuit is a long and complex separation process, consisting of the following flotation banks: roughing bank, rough-scavenging bank, clean-scavenging bank, cleaning I bank and cleaning II bank. Each flotation bank is composed of dozens of flotation cells. This is done to ensure both high concentrate grade and recovery. The flow sheet of the bauxite flotation plant is shown in Fig. 1.
The flotation processing begins with a ball grinder that reduces the particle size of the ore down to powder of micrometer level. Then, the powder is mixed with water and flotation reagents, and the resulting slurry is fed to an agitated tank. It is then fed into the roughing cell, and the stirring of the impeller forms ore pulp and froth. Then, the mineral particles adhering to the froths float up and overflow out of the rougher cells; the particles then pass into cleaning I, while the underflow pulp goes into the rough-scavenging. Then, the froth overflowing from cleaning I flows into cleaning II, and its concentrate feeds in to the final cleaners. Meanwhile, the underflow of cleaning II enters cleaning I, while the underflow of cleaning I enters the clean-scavenging. Froth overflows from the rough-scavenging and clean-scavenging banks; however, it then returns to roughing and cleaning I, respectively, for more separation. The underflows of both the rough-scavenging and clean-scavenging are added into the final tailings. The final concentrate products are selected from the final cleaning cell. It should be emphasized that the flotation processes mentioned above are used for the purpose of achieving a high concentrate grade and a low tailings grade.
2.2 Influencing factors of the bauxite flotation process
Bauxite flotation is a very complicated and non-linear process, and many direct or indirect parameters frequently exert influence on the production indicators (Zhao et al., 2010ZHAO, Q., MILLER, J.D., WANG, W. Recent developments in the beneficiation of Chinese bauxite [J].Mineral Processing & Extractive Metallurgy. v. 31, p. 111-119, 2010., CAO, et al., 2013CAO, B. F., XIEY. F., GUI, W.H. et al. Integrated prediction model of bauxite concentrate grade based on distributed machine vision [J]. Minerals Engineering. v. 53,p. 31-38, 2013., Sandro, 2012SANDRO, L. M. The flotation of marginal gibbsitic bauxite ores from paragominas-Brazil [D]. The University of Utah, 2012.). However, fewer model parameters should be considered when constructing predictive models because too many parameters may increase the complexity of the model, while the incompleteness of some parameters will result in low precision (González et al., 2003GONZÁLEZ, G. D., ORCHARD, M, CERDA, J. L. et al. Local models for soft- sensors in a rougher flotation bank [J]. Minerals Engineering. v.16 n. 5, p. 441-453, 2003., Kaartinen et al., 2005KAARTINEN, J., HYÖTYNIEMI, H. Combining multi-camera-data of flotation circuit with PCA and PLS [C]. CENTENARY OF FLOTATION SYMPOSIUM. Brisbane, Australia, n. 6-9, p. 121-125, 2005., LI et al., 2012LI, H. B., CHAI, T. Y., YUE, H. Soft sensor and of technical indices based on KPCA-ELM application for flotation process [J]. CIESC Journal. v. 63, n. 9, p. 2892-2898, 2012.).In this case, the significant parameters that affect flotation indicators should be considered.
According to the flotation metallurgist (Zhao et al., 2010ZHAO, Q., MILLER, J.D., WANG, W. Recent developments in the beneficiation of Chinese bauxite [J].Mineral Processing & Extractive Metallurgy. v. 31, p. 111-119, 2010., Sandro, 2012SANDRO, L. M. The flotation of marginal gibbsitic bauxite ores from paragominas-Brazil [D]. The University of Utah, 2012., ZHOU, et al., 2010ZHOU, C. C. Bauxite and flotation technology [M]. Xuzhou: China University of Mining Technology Press, 2011.), the slurry particle size refers to the ore grinding size. In this paper, the percentage content (%) of particle sizes is less than 200 mesh (-0.075mm). When the particle size is coarse, the flotation velocity is very slow, leading to incomplete detachment of a single ore, which results in a low concentrate grade. When the particle size is finer, the flotation velocity is fast, but it is hard to effectively sort and leads to a low grade of products. Appropriate pulp density benefits the selection of ores because too high or too low a concentration will result in the loss of useful minerals. Pulp density typically uses the percentage concentration (%), i.e., the percentage of solids, contained in the slurry. In bauxite flotation, the range of the pulp densityis within 30%to35%. The feed grade (A/S) represents the enrichment of useful minerals, and a higher feed grade indicates higher enrichment, which leads to an concentrate grade and metal recovery. Conversely, a low feed grade leads to difficultly in separating useful minerals. A/S for feed grade refers to the mass ratio of Al2O3 and SiO2 of feed slurry. Additionally, another important factor is the flotation temperature that is maintained within 40 to 45ºC. Operational variables affecting the technological indicators include pulp level, air inflow and reagents. The fluctuation of pulp level or air inflow often leads to overflow and sinking, so the corresponding technique adjusts the amount of reagents for a condition where by the air inflow and the pulp level remain stable. The main flotation reagent is the collector. The insufficient collector amount leads to inadequate mineralization of the diasporic-bauxite in the ore, resulting in a lower concentrate grade. However, the sufficient collector amount leads to the loss of flotation selectivity and results in a higher tailings grade and a lower recovery rate. The collector amount is typically 850 g/t. Therefore, the factors affecting flotation properties mainly include pulp density Gd, slurry particle size GS, feed grade Gg, dosages of the collector D0 and pulp pH DpH.
The visual features of froth image are an important indicator for characterizing the flotation properties (Heinrich, 2003HEINRICH, G. An investigation into the use of froth color as sensor for metallurgical grade in a copper system [D].University of Cape Town, 2003., Forbes, 2007FORBES G. Texture and bubble size measurements for modeling concentrate grade in flotation froth systems [D]. University of Cape Town, 2007., CAO et al., 2013CAO, B. F., XIEY. F., GUI, W.H. et al. Integrated prediction model of bauxite concentrate grade based on distributed machine vision [J]. Minerals Engineering. v. 53,p. 31-38, 2013.). For instance, the froth color can characterize the mineral type and content. Bubble transparency becomes lower when the color is darker, which reflects greater mineral content and a higher concentrate grade. Froth image texture is a comprehensive characterization of the roughness, contrast and viscosity. In some cases, the bubble size is correlated with the mineral ‘load’ of the froth and is also used to determine the optimal amount of reagent. With the increase in froth load, the probability of useless ores carried into the concentrates increases correspondingly; as a result, the concentrate grade decreases. Meanwhile, the bubble collapse rate can reflect the mineral content information, as does the bubble size. Therefore, the froth color, texture features, dynamic features and morphological characteristics are used to describe the froth image. The following proposed methods of parameter extraction (XU et al., 2012XU, C.H., GUI, W. H., YANG, C. H. Flotation process fault detection using output PDF of bubble size distribution [J]. Minerals Engineering. v. 26, n. 1, p. 5-12, 2012.; GUI et al., 2013GUI, W.H., LIU, J. P., YANG, C. H. et al. Color co-occurrence matrix based froth image texture extraction for mineral flotation [J]. Minerals Engineering. v. 46, p. 60-67, 2013., WANG et al., 2014WANGY, L.,CHEN, X. F. et al. Hybridintelligencemodelbasedonimagefeaturesfor thepredictionofflotationconcentrategrade[J], Abstractand Applied Analysis. v. 6, p. 1-17, 2014.) are used to extract these feature parameters: the R (red) mean value, the G (green) mean value, the relative red components, the B (blue) mean value, brightness, energy, entropy, correlation, local homogeneity, steepness, inverse difference moments, the average froth size, stability, speed, the froth load and the froth collapse rate.
3. Online hybrid predictive model
Because of the higher dimension, non-linearity and excessive redundancy among the parameters that affect the production indicators, KPCA is used to reduce the dimensions and to construct completed and independent datasets (Schölkopf et al., 1998SCHÖLKOPF, B., SMOLA, A., MÜLLER, K. R. Nonlinear component analysis as a kernel eigenvalue problem [J]. Neural computation. v. 10, n. 5, p. 1299-1319, 1998.). This paper proposes a neural network model based on the wavelet regularized extreme learning machine to predict the production indicators of bauxite flotation and to address the non-linearity and complexity of the data. However, the production data in a continuously running bauxite flotation process are constantly produced, so the model based on the data is easily influenced by the disturbance variables in the flotation process. This results in the time-varying feature of the data; therefore, the model cannot exactly reflect the production state when fluctuating. To avoid these problems, a sliding window approach is used to update the model parameters in this paper.
3.1 Regularized extreme learning machine based on wavelet function
The extreme leaning machine (Huang et al., 2004HUANG, G.B., ZHU, Q.Y., SIEW, C.K. Extreme learning machine: a new learning scheme of feedforward neural networks. In: INTERNATIONAL JOINT CONFERENCE ON NEURAL NETWORKS (IJCNN'2004), Budapest, Hungary, 2004.) is a new single-hidden layer feed forward neural network (SLFN) (Ferrari, et al., 2005FERRARI, S., STENGEL, R.F. Smooth function approximation using neural networks [J]. IEEE Trans. Neural Networks. n. 16, p. 24-38, 2005.). It has been demonstrated that the extreme learning machine has the same global approach property as the neural network (NN). There is no need for iteration to determine the parameters, and its velocity is much higher than the NN and the support vector machine (SVM), which meets the real-time requirements of an industrial site. However, some of the following problems exist in ELM.
(1) Structural crises and excessive fitting occur, and thus, the regularized extreme leaning machine was promoted to address these issues (DENG. et al., 2009DENG, W. Y., ZHANG, Q. H., CHEN, L. Regularized extreme learning machine [C]/ / Computational Intelligence and Data Mining. 2009. CIDM'09. IEEE Symposium on. Xian, p.389-395, 2009.).
(2) The activation function has excessive dependency and over-learning quality, which results in bad generalization performance. In this case, the study proposed the wavelet regularized learning machine where the wavelet function is used as an activation function and can effectively improve the ability of the local processing and model generalization ability.
ELM is one of the new algorithms of the single hidden layer feed forward neural network. One SLFN that contains N1 different learning samples and K hidden knots can be characterized as (Huang et al., 2006HUANG, G.B., CHEN L., SIEW C. K. Universal approximation using incremental constructive feed forward networks with random hidden nodes [J]. Neural Networks, IEEE Transactions on. v. 17, n.4, p. 879-892, 2006.)

where ωi is the link weight of the input neural cell with the ith hidden neural cell; bi is the threshold value of the mth neural cell; βi is the weight of the link hidden layer knot and the input layer knot; g is the activation function.

There are always some ωi, bi, βi that can make a single-hidden feed forward neural network converge with a sample value of expectation yj with near zero errors for the given N1 samples (xj, yj), namely.


The expression above can be simplified as:
H β = Y
where H is the hidden-layer output matrix of the neural network, namely
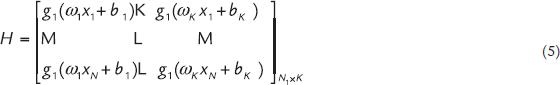
Huang (2006)HUANG, G.B., ZHU, Q.Y., SIEW, C.K. Extreme learning machine: theory and applications [J]. Neurocomputing. n. 70, p. 489-501, 2006. demonstrated that if the input weight value and the hidden-layer threshold value are randomly generated and the activation function is infinitely differentiable, then the rank of matrix H is L.Thus, the weight value of the output layer can be obtained by solving the linear equation group (4) without adjustment and the value can be assigned at any range. SLFM approximately equals the least square solution β of linear system H β = Y.

where HT represents the Moore-Penrose generalized inverse matrix of matrix H that is obtained through singular value decomposition.
The mathematical model of the regularized extreme learning machine (DENG. et al., 2009DENG, W. Y., ZHANG, Q. H., CHEN, L. Regularized extreme learning machine [C]/ / Computational Intelligence and Data Mining. 2009. CIDM'09. IEEE Symposium on. Xian, p.389-395, 2009.) can be characterized as:
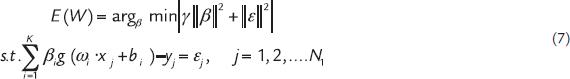
where ║β║2 represents the structural risk, ║ε║2 is the empirical risk, and is the rate parameter characterizing both of the risks.
By the La Grange equation, the question of the conditional extremum above can be converted to the question of the non-conditional extremum.
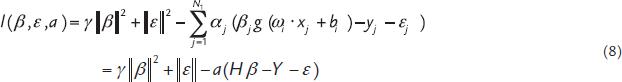
where α = [α1, α2, ...,αN], αj ∈ Rm (j = 1,2,..., N1) is the LaGrange multiplier.
The gradient in the equation is set to zero, so
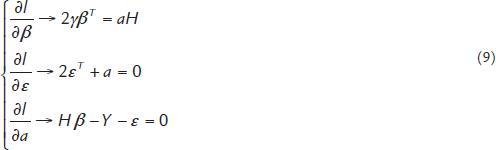
The equation above is simplified as:

The expression used to calculate contains merely one N x N matrix and is fast in operation speed. RELM is degenerated to be ELM when γ → 0.
This study draws ideas for theproperty of the activation function fromthe wavelet Support Vector Machine (Chih-Chiang Wei, 2012CHIH-CHIANG WEI. Wavelet kernel support vector machines forecasting techniques: case studyon water-level predictions during typhoons [J]. Expert Systems with Applications. v.39, p. 5189-5199, 2012.); therefore, the wavelet function has been brought into RELM, and the wavelet regularized learning machine has been proposed. The hidden activation function is infinitely differentiable; the weight of the input vector and the threshold of the hidden layer knots can be assigned at any value.
The Morlet wavelet function is characterized as:

It is easy to demonstrate that the equation meets the requirements of infinite differentiation and can be used as the activation function to construct wavelet RELM (WRELM). Wavelet features such as cosinusoidal modulation and high resolution of time frequency can be applied to ensure that the proposed method has advantages such as stable operation, small errors, excellent robustness to interference, etc.
3.2 Predictive sub-model based on KPCA and WRELM
There are many parameters affecting production indicators in the flotation process. On the basis of operator experience to inspect a “bubble,” this paper proposed a new production indicator predictive method combining froth features and feed parameters. Here, two predictive sub-models are constructedusing the feed parameters and the image features as input variables. The detailed steps are as follows.
Step 1: Input and output parameters of model
Appropriate input variables can improve the predictive precision, described as follows:
(1) Feed parameters are taken as one-input variables, including feed grade, feed density, slurry particle size,dosages of the collectorand pulp pH, labeled as: V = (v1,v2......v5);
(2) Image features are taken as other input variables, including the R mean value, the G mean value, the relative red components, the B mean value, brightness, energy, entropy, correlation, local homogeneity, steepness, inverse difference moments, average froth sizes, stability, speed, froth load and froth collapse rates, labeled as: U = (u1, u2......u15);
(3) KPCA is used to extract the non-linear principal components of variable V and variable U; they are then used construct the input samples set;
(4) The concentrate grade and the tailing grade are taken as output variables of the predictive model, labeled as y = (y1, y2) ;
Step 2: Construct the WRELM predictive model and select the model parameters;
(1) Select the hidden-layer activation function; the Morlet wavelet is used here;
(2) Determine parameter γ and the number of hidden-layer knots, followed by the set weight value vector ωi and the hidden-layer threshold value bi.
(3) Calculate the hidden-layer output matrix using Eq.(5);
(4) Calculate the hidden-layer output weight value vector using Eq.(10);
(5) Calculate the network output: Y = Hβ .
3.3 Hybrid predictive model based on entropy
Weight factors in a hybrid model are typically determined by manual experience or expertise. Thisstudy adopted the entropy method (WANG et al., 2014WANGY, L.,CHEN, X. F. et al. Hybridintelligencemodelbasedonimagefeaturesfor thepredictionofflotationconcentrategrade[J], Abstractand Applied Analysis. v. 6, p. 1-17, 2014.) to determine the value of the weight factor and to improve reliability because industrial conditions are not stable and easily fluctuate.
By separately calculating the estimate values of y"1K and y"2K at time k when the input is the feed parameters and the image features, the estimate value of the hybrid model is y"K. Defining enK to represent the relative error of the nth predictive model at time k, according to the following expression, it can be seen that
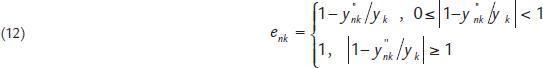
where yK is the actual value of the grade at time k; n=1...M, where M is the number of models. In this model, M=2; k=1, 2...N1, where N1 is the number of samples. The steps for determining the entropy value are as follows:
Step 1: Calculate the predictive error proportion of the nth single predictive model at time k.

Step 2: Calculate the entropy value En of the nth single predictive model.

Step 3: Calculate the sequence mutation degree dn of the relative error sequence of the nth single predictive model.

Step 4: Calculate the weighted coefficients of every single predictive model.

Step 5: Calculate the output of the integrated model of entropy.

Finally, the concentrate grade and the tailings grade were obtained using the above methods.
3.4 Online model updating strategy based on the sliding time window
In the continuously running bauxite flotation process, the above model considered the multi-influencing factors of non-linearity and complexity. However, the model based on the data is easily influenced by disturbance variables in the flotation process, resulting in atime-varying property in the data; the model could not exactly reflect the production state when fluctuating. To avoid these problems, an online model updating strategy is constructed based on the sliding window approach (Kaartinen et al., 2005KAARTINEN, J., HYÖTYNIEMI, H. Combining multi-camera-data of flotation circuit with PCA and PLS [C]. CENTENARY OF FLOTATION SYMPOSIUM. Brisbane, Australia, n. 6-9, p. 121-125, 2005., CHAI, 2013CHAIQ. Q. Optimal control of an aluminum evaporation process based on energy efficiency analysis [D]. 2013) in this paper.
Assuming that a set of learning samples obtained using the sliding window are expressed as S = {(x,y)}, where

are the process output variables, and L3 is the sliding window length, then in the newly composed data sample set, S1 = {(x5,y5), s = L3+1,...,N2} represents the retained data samples in the original data sample sets, while S2 = {(x5,z5), s = N2+1,...N2+L3} represents the new data samples. The following method is used to judge whether there is a need to update the model samples.
Step1: Calculate the model predictive error.
The model predictive error at the new sample moments should be calculated with Eq.18.

yne is the corresponding actual output value of the new sample, and y(xne) is the predictive value. Then, comparison between the predictive errors and themodel accuracy threshold is achieved to judge whether the model needs to be trained again.If the predictive error is less than the threshold value (usually, ±5% ), there is no need to train the model. Otherwise, the model needs to be trained again.
Step2: Determine whether samples need updating
If the model needs to be trained again, the correlation coefficients δ2 between the new collective data samples and the original training samples should be calculated. If the correlation is large, it may be considered that there is no new information brought by the new sample. In fact, because of noise interference, new samples are impossible to be completely expressed by the samples in the original training set. Therefore, the following approximation condition is used to judge whether the new samples have retention value:

If δ2 ≥ δ*2, the latest sample should be abandoned. If δ2 ≤ δ*2, the new samples should be added to the training of the next stage and the oldest training sample should be deleted.
4. Application validations in bauxite flotation
To test the working property of model, 385 groups of samples collected from April to June 2011 were analyzed. The Gaussian function was selected as the kernel function. Experiments determined that the width was σ = 2.3. KPCA was used to perform dimension reduction towards the principal and subordinate input variable, E=85% (Schölkopf et al. 1998SCHÖLKOPF, B., SMOLA, A., MÜLLER, K. R. Nonlinear component analysis as a kernel eigenvalue problem [J]. Neural computation. v. 10, n. 5, p. 1299-1319, 1998.); the results are shown in Table1 and Table2. It can be observed from the tables that the number of principal elements was 4 and 3, respectively. Principle elements were taken as the input parameters.
The WRELM predictive model was used to predict the concentrate grade. The parameters of the model, whose input sare the feed parameters, areas follows: 4 input layer nodes, 9 hidden layer nodes, and 2 output layer nodes. The parameters of the model, whose input sare the image features, areas follows: 3 input layer knots, 7 hidden-layer knots, and 2 output layer nodes. The Morlet wavelet was used as the activation function of the hidden layer; the ratio parameter of two types of risk is obtained by the cross-validation with γ = 0.01. The training time of the ELM algorithm was spent on solving the Moore-Penrose generalized inverse matrix of matrix H.However, RELM and WRELM include only one inverse operation of the LxL matrix, and the complexity of the model descended dramatically. Amodel whose sliding window size for model updating is N = 100was selected by the experiments as the training model; its precision threshold is 0.04 and δ*2 = 0.05. All operations and solutions were simulated on the MATLAB2011a platform.
To demonstrate the effect of the proposed model, the study initially used one group of samples for training and the remaining87 groups of samples for testing. The testing results areshown in Fig.2 and Fig.3. Fig.2 gives the comparison of the concentrate grade after using these different models including the online hybrid predictive model (ON-HPM), the hybrid predictive model (HPM) and the measured value. Fig.3 gives the comparison of the tailings grade after using these different models including the online hybrid predictive model (ON-HPM), the hybrid predictive model (HPM) and the measured value.
Comparison of tailing grade between the predictive value and the actual value To measure the property of the proposed online hybrid predictive model, the study analyzed the predictive precision using mean relative error (MRE), root mean square error (RMSE) and correlation coefficient R between the predictive result and the actual value.


where yi is the actual value of the ith testing sample and is the predictive result of the ith testing sample. Table3 and Table4 represent comparisons of the models of the two types.
It can be observed from Fig.2 and Fig.3 that the predicted value of ON-HPM proposed by this paper is closer to the actual value. It is much more satisfactory than HPM, especially when the production state fluctuates, which indicates the significanceof the online update of the model. It can be observed from Tables 3 and 4 that the MRE and RMSE values of ON-HPM are the smallest, which indicates the veryhigh precision of the proposed model. Compared with HPM, the precision of the online hybrid predictive model (ON-HPM) improves significantly. The average relative error of the concentrate grade is reduced to 5.28 from 8.12, and the error of the tailings grade is reduced to 6.87 from 11.43.
5. Conclusions
Considering that the problems concerning the concentrate grade and the tailings grade of the flotation process are very difficult to be measured online, an online hybrid predictive model is proposed. The regularized extreme learning machine is presented to the single hidden-layer fee forward network to solve the problems of low velocity and large error. The generalization property and the ability to process local data are improved using the wavelet function as the activation function. An online updating strategy for the hybrid model is constructed, aimed at the fluctuation of the working conditions. The industrial validation results of the diasporic-bauxite flotation process show that the proposed method has higher predictive accuracy and generalization capacity. The average relative error of the concentrate grade is reduced to 5.28 from 8.12, and the error of the tailings grade is reduced to 6.87 from 11.43. The correlation coefficients R between the predictive values and the actual values are 0.93 and 0.88, which is very satisfactory. Thus, this method can lay the foundation for the optimal control of operation parameters (reagent, pulp level, etc.) in the flotation process.
6. Acknowledgements
This article is supported by the Innovative Research Groups of the National Science Fund Project of China (61321003), the National Natural Science Foundation of China (61134006 and 61473318), Innovation-driven Plan in Central South University (No.2015cx007) and the Hunan Province Natural Science Foundation (Grant 14JJ5008).
References
- CAO, B. F., XIEY. F., GUI, W.H. et al. Integrated prediction model of bauxite concentrate grade based on distributed machine vision [J]. Minerals Engineering. v. 53,p. 31-38, 2013.
- CHAIQ. Q. Optimal control of an aluminum evaporation process based on energy efficiency analysis [D]. 2013
- CHIH-CHIANG WEI. Wavelet kernel support vector machines forecasting techniques: case studyon water-level predictions during typhoons [J]. Expert Systems with Applications v.39, p. 5189-5199, 2012.
- DENG, W. Y., ZHANG, Q. H., CHEN, L. Regularized extreme learning machine [C]/ / Computational Intelligence and Data Mining. 2009. CIDM'09. IEEE Symposium on. Xian, p.389-395, 2009.
- FERRARI, S., STENGEL, R.F. Smooth function approximation using neural networks [J]. IEEE Trans. Neural Networks. n. 16, p. 24-38, 2005.
- FORBES G. Texture and bubble size measurements for modeling concentrate grade in flotation froth systems [D]. University of Cape Town, 2007.
- GONZÁLEZ, G. D., ORCHARD, M, CERDA, J. L. et al. Local models for soft- sensors in a rougher flotation bank [J]. Minerals Engineering. v.16 n. 5, p. 441-453, 2003.
- GUI, W.H., LIU, J. P., YANG, C. H. et al. Color co-occurrence matrix based froth image texture extraction for mineral flotation [J]. Minerals Engineering. v. 46, p. 60-67, 2013.
- HARGRAVE, J. M., HALL, S. T. Diagnosis of concentrate grade and mass flowrate in tin flotation from color and surface texture analysis [J]. Minerals Engineering. v. 10, n. 6, p. 613-621, 1997.
- HATONEN J., HYOTYNIEMI H., MIETTUNEN J. et al. Using image information and partial least squares method to estimate mineral concentrations in mineral flotation[C]//Intelligent Processing and Manufacturing of Materials, 1999. IPMM'99. Proceedings of the Second International Conference on. IEEE. v. 1, p. 459-464, 1999
- HEINRICH, G. An investigation into the use of froth color as sensor for metallurgical grade in a copper system [D].University of Cape Town, 2003.
- HUANG, G.B., ZHU, Q.Y., SIEW, C.K. Extreme learning machine: a new learning scheme of feedforward neural networks. In: INTERNATIONAL JOINT CONFERENCE ON NEURAL NETWORKS (IJCNN'2004), Budapest, Hungary, 2004.
- HUANG, G.B., ZHU, Q.Y., SIEW, C.K. Extreme learning machine: theory and applications [J]. Neurocomputing n. 70, p. 489-501, 2006.
- HUANG, G.B., CHEN L., SIEW C. K. Universal approximation using incremental constructive feed forward networks with random hidden nodes [J]. Neural Networks, IEEE Transactions on. v. 17, n.4, p. 879-892, 2006.
- KAARTINEN, J., HYÖTYNIEMI, H. Combining multi-camera-data of flotation circuit with PCA and PLS [C]. CENTENARY OF FLOTATION SYMPOSIUM. Brisbane, Australia, n. 6-9, p. 121-125, 2005.
- LIU, J. J., MACGREGOR, J. F. Froth-based modeling and control of flotation processes [J]. Minerals Engineering. v. 21, n. 9, p. 642-651, 2008.
- LI, H. B., CHAI, T. Y., YUE, H. Soft sensor and of technical indices based on KPCA-ELM application for flotation process [J]. CIESC Journal v. 63, n. 9, p. 2892-2898, 2012.
- MOOLMAN, D. W., ALDRICH, C., SCHMITZ, G. P. J. et al. The interrelationship between surface froth characteristics and industrial flotation performance [J]. Minerals Engineering. v. 9, n. 8, p. 837-854, 1996.
- MORAR, S. H., HARRIS, M. C., BRADSHAW, D. J. The use of machine vision to predict flotation performance [J]. Minerals Engineering. v. 36, p. 31-36, 2012.
- NEETHLING, S. J. Simple approximations for estimating froth recovery [J]. International Journal of Mineral Processing v. 89 n. 1, p. 44-52, 2008.
- SANDRO, L. M. The flotation of marginal gibbsitic bauxite ores from paragominas-Brazil [D]. The University of Utah, 2012.
- SCHÖLKOPF, B., SMOLA, A., MÜLLER, K. R. Nonlinear component analysis as a kernel eigenvalue problem [J]. Neural computation v. 10, n. 5, p. 1299-1319, 1998.
- WANGY, L.,CHEN, X. F. et al. Hybridintelligencemodelbasedonimagefeaturesfor thepredictionofflotationconcentrategrade[J], Abstractand Applied Analysis v. 6, p. 1-17, 2014.
- XU, C.H., GUI, W. H., YANG, C. H. Flotation process fault detection using output PDF of bubble size distribution [J]. Minerals Engineering. v. 26, n. 1, p. 5-12, 2012.
- YIANATOS, J. B., MOYS, M. H., Contreras, F. et al. Froth recovery of industrial flotation cells [J]. Minerals Engineering. v. 21, n. 12, p. 817-825, 2008.
- ZHAO, Q., MILLER, J.D., WANG, W. Recent developments in the beneficiation of Chinese bauxite [J].Mineral Processing & Extractive Metallurgy v. 31, p. 111-119, 2010.
- ZHOU, C. C. Bauxite and flotation technology [M]. Xuzhou: China University of Mining Technology Press, 2011.
Publication Dates
-
Publication in this collection
Oct-Dec 2015
History
-
Received
23 Dec 2014 -
Accepted
11 Aug 2015


