Abstract
The need for materials with higher strength and corrosion resistance in corrosive environments, such as in the oil extraction in saline media, has led to the use of super duplex stainless steels in projects such as the Pre-sal. The manufacture of these materials involves the step of thermomechanical processing, whose performance depends on the workability of the material. Processing conditions in which the super duplex stainless steel UNS S32760 can be worked safely and in which the material can fail were investigated in this presentation. The physical simulation was performed by means of hot torsion testing. The tests were performed at temperatures ranging from 900°C to 1200°C and strain rates of 0.01s-1 to 10s-1. The evolution of strain rate sensitivity of flow stress (m) for deformation of 0.5 at all temperatures investigated here was determined. After attaining the values of m for each deformation condition, the values of the power dissipation efficiency (η) were calculated, an instability criterion (ξ) was applied, and processing maps were constructed. Using these maps, the effects of deformation conditions on the power dissipation efficiency and the material plastic instability were discussed. The domains of processing maps, the observed microstructures and the shape of plastic flow stress curves were associated.
Keywords:
Hot Workability; Processing Maps; Super Duplex; UNS S32760
1. Introduction
The austenitic-ferritic stainless steels solidify with ferrite structure at temperatures close to 1430°C and becomes dual phase with the α → γ transformation by solid state reactions on cooling. Usually, thermomechanical processing of these steels consists of reheating to 1250°C and deformation schedules by rolling or forging with temperature decreasing to levels close to 1000°C. In this temperature gap the phase transformation with the nucleation and growth of austenite particles at boundaries and in the ferrite matrix occurs. In general, the presence of a massive second phase during thermomechanical processing makes the plastic deformation more complex and the microstructure plays a key role in limiting the mechanical processing. Beside the hardening and softening mechanisms required to process each one of these phases, grain and phase boundaries have an important role in the deformation of duplex microstructure, since the deformation accommodation depends on the macroscopic plastic behavior and fracture characteristics of the phases and interfaces presents (Balancin, Hoffmann & Jonas et al, 2000BALANCIN, O., HOFFMANN, W.A., JONAS, J.J. Influence of microstructure on the flow behavior of duplex stainless steels at high temperatures. Metallurgical and Materials Transactions, v.31, A, 1353 -1364, 2000.; Gutiérrez, Iza-Mendia & Pinõl et al. 2000GUTIÉRREZ, I., IZA-MENDIA, A., PIÑOL, A.. Metallurgical and Materials Transitions. v. 31A, 1671-1677, 2000.).
The intrinsic workability of the material depends on the initial microstructure of the material and its response to deformation conditions imposed. This response implicitly encloses the dependence of the strain rate with the strain and temperature. However, the microstructure changes that take place are the explicitly part of the material response to the process parameters. For example, under certain conditions, the microstructure of the material can be rebuilt due to restoration processes such as recovery and recrystallization. Alternatively, the material can respond with microstructural damage due to unstable or localized flow.
One way of analyzing the response of the material to processing parameters are the construction of processing maps. Prasad et al. (Prasad & Seshacharyulu et al. 1998; Doraivelu, Gegel, Malas & Prasad et al. 1984DORAIVELU, S.M., GEGEL, H.L., MALAS, J.C., PRASAD, Y.V.R.K. Metallurgical and Materials Transactions, A, v.15, 1883-1892, 1984.) proposed to build maps using the Dynamic Materials Model. In this technique, the processing map is constructed by plotting the power dissipation in the workpiece (η) due to microstructural changes as a function of temperature and strain rate, and (η) given by:

where m is the strain rate sensitivity of flow stress, given by: m = (dln σ/dln έ). with the temperature and amount of deformation constants, the values (m) calculated are given in Table 1.
The material's plastic instability can be determined by the parameter (ξ), which depends on the temperature and strain rate and is given by:

The intrinsic workability of duplex stainless steels has been the subject of several studies (Kawasaki, Ohtsubo, Suzuki & Takada et al. 1986KAWASAKI, T.; OHTSUBO, H.; SUZUKI, S.; TAKADA, I. Hot workability of austenitic steel containing delta-ferrite, Kawasaki Steel Technical Report, n0. 14, 50-60, 1986.; Fang, Jiang, Liu & Song et al. 2009FANG, Y.L., JIANG, L.Z., LIU, Z.Y., SONG, H.M. Materials Science Engineering, A 526, 128-133, 2009.; Chen, Liu, Ma & Wang et al. 2011CHEN, L., LIU, X.; MA, X., WANG, l. Materials Design, v.32, 1292-1297, 2011.). However we do not have information about studies on thermomechanical processing of super duplex stainless steels. These steels with a more complex chemical composition are characterized by higher strength and corrosion resistance in saline environments. In this presentation, the workability of these steels using processing maps was studied.
2. Materials and procedures
The chemical composition of super duplex stainless steel UNS S32760 used in this study is given in Table 2.
Samples taken from hot rolled bars with a diameter of 19.5 mm were machined with useful length of 8.0 mm and diameter of 12.0 mm. To homogenize the material before straining, the samples were heated to 1200°C, maintained at this temperature for 5 minutes in a argon protective atmosphere, then cooled down to the deformation temperatures, being maintained at these temperatures for 30 seconds to minimize thermal gradients. The hot torsion tests were carried out in the temperature range 900-1200°C and with strain rates of 0.01, 0.1, 1.0 and 10 s-1. Upon testing, the response of the material was recorded in the form of effective stress vs. effective strain curves. After being tested, the samples were cooled to room temperature and sectioned along the diameter. After the standard metallographic procedures, the samples were subjected to etching with a solution (Behara), composed of 100 ml of distilled water, 20 ml of HCl and 2 g of potassium metabisulfide, and examined by optical microscopy in a plane parallel to the specimen axis.
The procedures to construct energy dissipation maps and instability maps followed the usual way and are described below. The stress values for each temperature and strain rate were obtained from flow stress curves and used to construct the ln ε versus ln σ diagram. From these curves, the strain rate sensitivity of flow stress was calculated (m = (dln σ/dln )). The energy dissipation efficiency due to microstructure changes (Eq. 1) was calculated as a function of temperature and strain rate and plotted in the form of iso-efficiency maps. The value of the instability parameter ξ (ε), given by equation (2), was evaluated and plotted as a function of temperature and strain rate to obtain the instability maps.
3. Results and discussion
3.1 Flow stress curves
Figure 1 shows the plastic flow stress curves obtained experimentally. It can be seen from this figure that the specimens deformed at low temperatures and high strain rates fail with straining close to 1.0. On the other hand, samples deformed at high temperatures and low strain rates support larger deformation, for instance, the sample strained at 1200°C with strain rate of 0.01s-1 did not fail even with strain as high as 4.0.
Flow stress curves for UNS S32760 stainless steel subjected to different strain rates and temperatures: (a) 900°C, (b) 1000°C, (c) 1100°C and (d) 1200°C.
The flow stress curves have the characteristic shape of the hot plastic behavior of metallic materials: the stress increases with the strain to a maximum and then decreases. However, there are significant differences when these curves are compared with those presented by single-phase materials that recover and recrystallize dynamically. It may be noted in Figure 1 that the steady state was not reached. At lower temperatures the curve has a rounded shape, as can be seen at 900°C with rates of 1.0 and 10s-1 and at 1000°C with strain rate of 10 s-1. At higher temperatures, the stress initially increases almost linearly until reaching maximum strain. Then, it may or may not present an interval of straining with constant stress in the region of maximum and decreases thereafter. In Figure 1, it can be seen that this transition occurs with the strain rate of 0.1s-1. At 1100°C with strain rate 0.1s-1, which is an example of this change, the flow stress curve shows a small stress level at the beginning of straining.
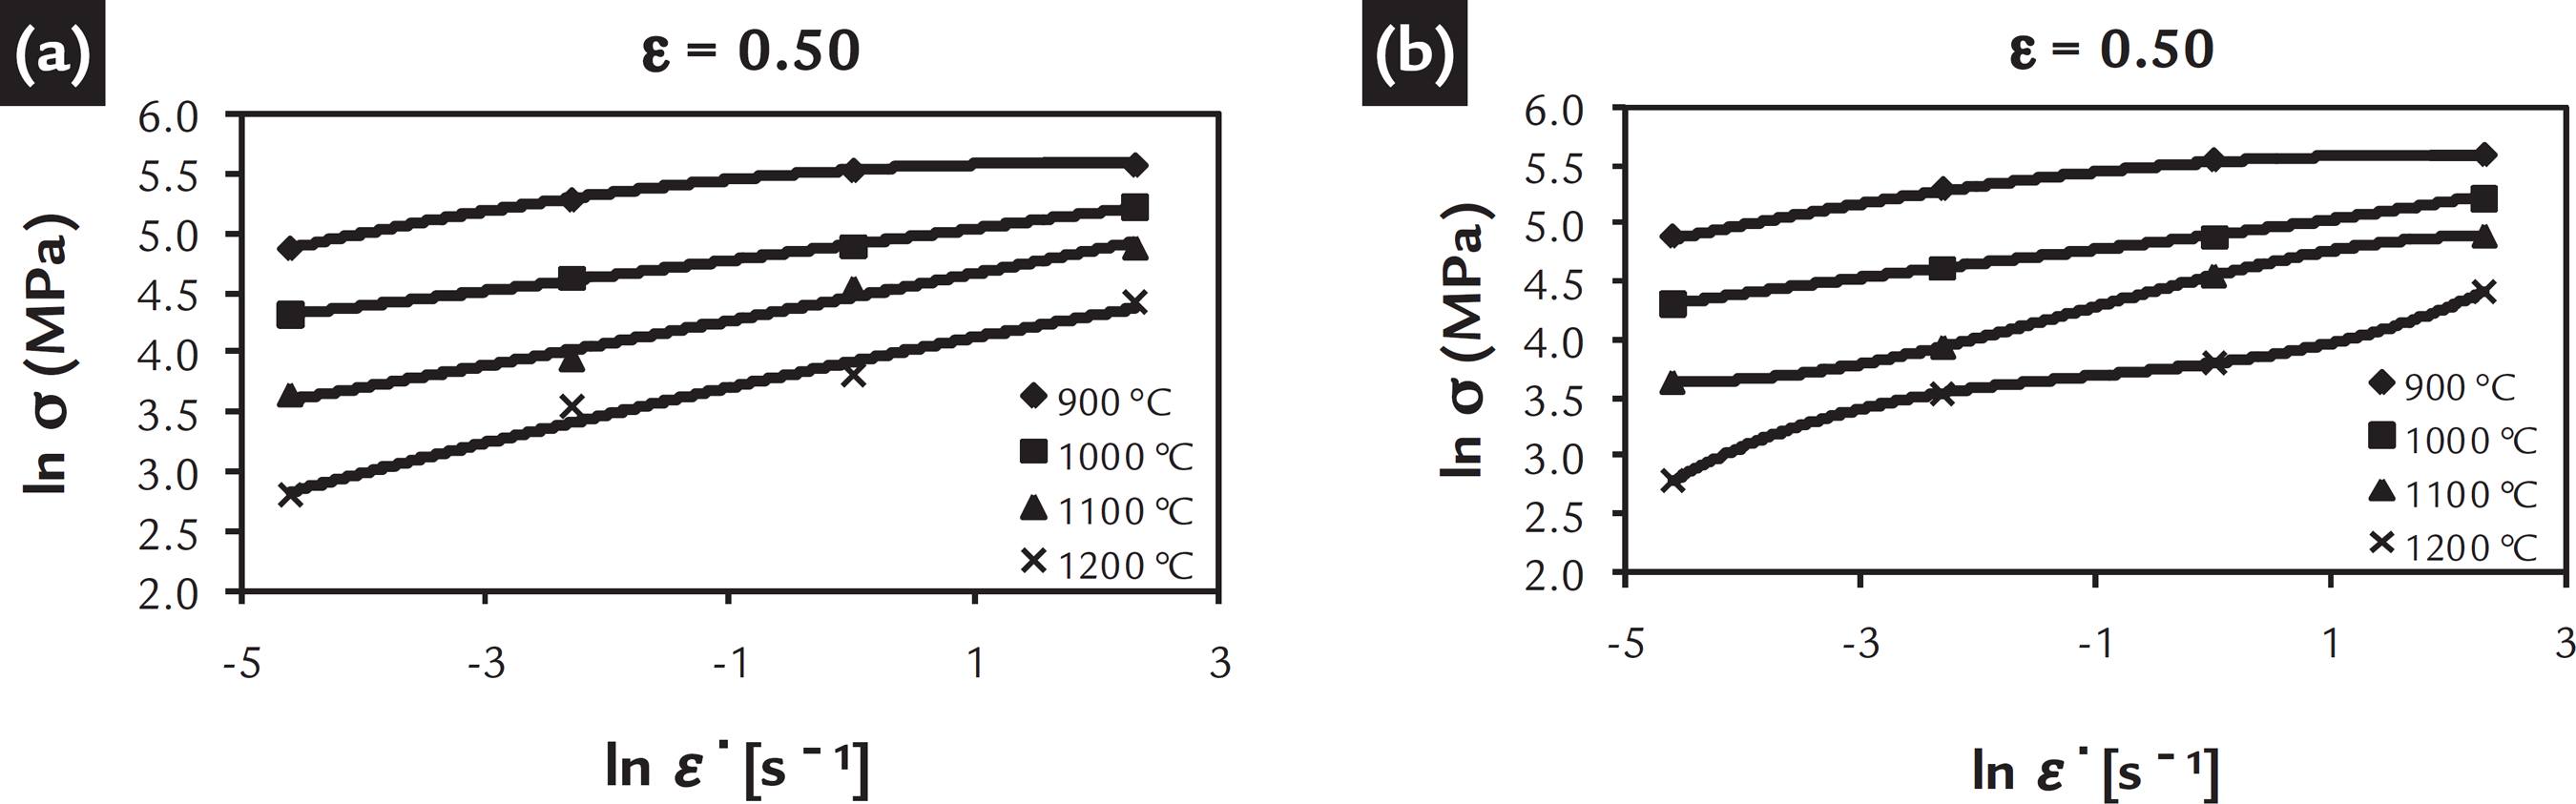
The ( ln σ versus ln ε ) diagrams for each deformation temperature were constructed using data of the flow stress curves for deformation of 0.5, as can be seen in Figure 2. The strain rate sensitivity of flow stress (m) was determined after interpolation of these points and the derivation of the fitted curves. Figure 2a displays the interpolation of these points with a second degree polynomial. One can see that the fit is not perfect; there are deviations at 1100 and 1200°C. To eliminate this gap, a third order polynomial was fitted as shown in Figure 2b. Independent of the type of fitting, it can be seen that at 900°C the curves have a parabolic shape with the slope increasing more rapidly at lower rates than at higher rates. This tendency disappears at 1000°C and at higher temperatures the best fit is the third degree polynomial.
The ln σ and ln ε diagrams at constant temperature and straining of 0.5. (a) Second degree polynomial fitting and (b) third degree polynomial fitting.
3.2 Processing maps
(i) Second degree fitting
From the discrepancies observed in Figure 2, it was chosen to build maps using both interpolations. Figure 3 displays the set of maps of power dissipation (a), instability (b) and processing (c) constructed with the m values attained from second degree fitting. The m value for stable plastic flow in a viscoplastic material increases from zero to one. When m increases, the power dissipation due to microstructure changes also increases. The efficiency represents the relative production of internal entropy during the hot deformation and characterizes the microstructure produced by different deformation conditions. In this study, the parameter that defines the power partition between the generated heat and the microstructure evolution, η, was represented in these maps by iso-efficiency lines. One can see in Figure 3(c) that the power dissipation reaches values between 30 and 40% when the material is strained at temperatures of 1100°C or higher. However, this level decreases suddenly when the material is strained at 900°C with a strain rate of 10s-1.
Power dissipation map (a) instability map (b) and processing map (c) calculated using the second degree fitting for the determination of m.
Bearing in mind that the processing map is the overlapping of both power dissipation energy and the plastic instability maps, it can be seen in Figure 3 that the plastic deformation is stable at high temperatures and displays a valley of instability when the material is strained close to 900°C with strain rate of 10s-1. The instability criterion used here can be interpreted in a simple way. If the material system does not produce entropy constitutively at a rate that at least matches the input entropy rate imposed by the process parameters, the plastic flow becomes localized and causes instability. Typical plastic instabilities are formed by adiabatic shear bands, location of plastic flow or fracture of the material.
(ii) Third degree fitting
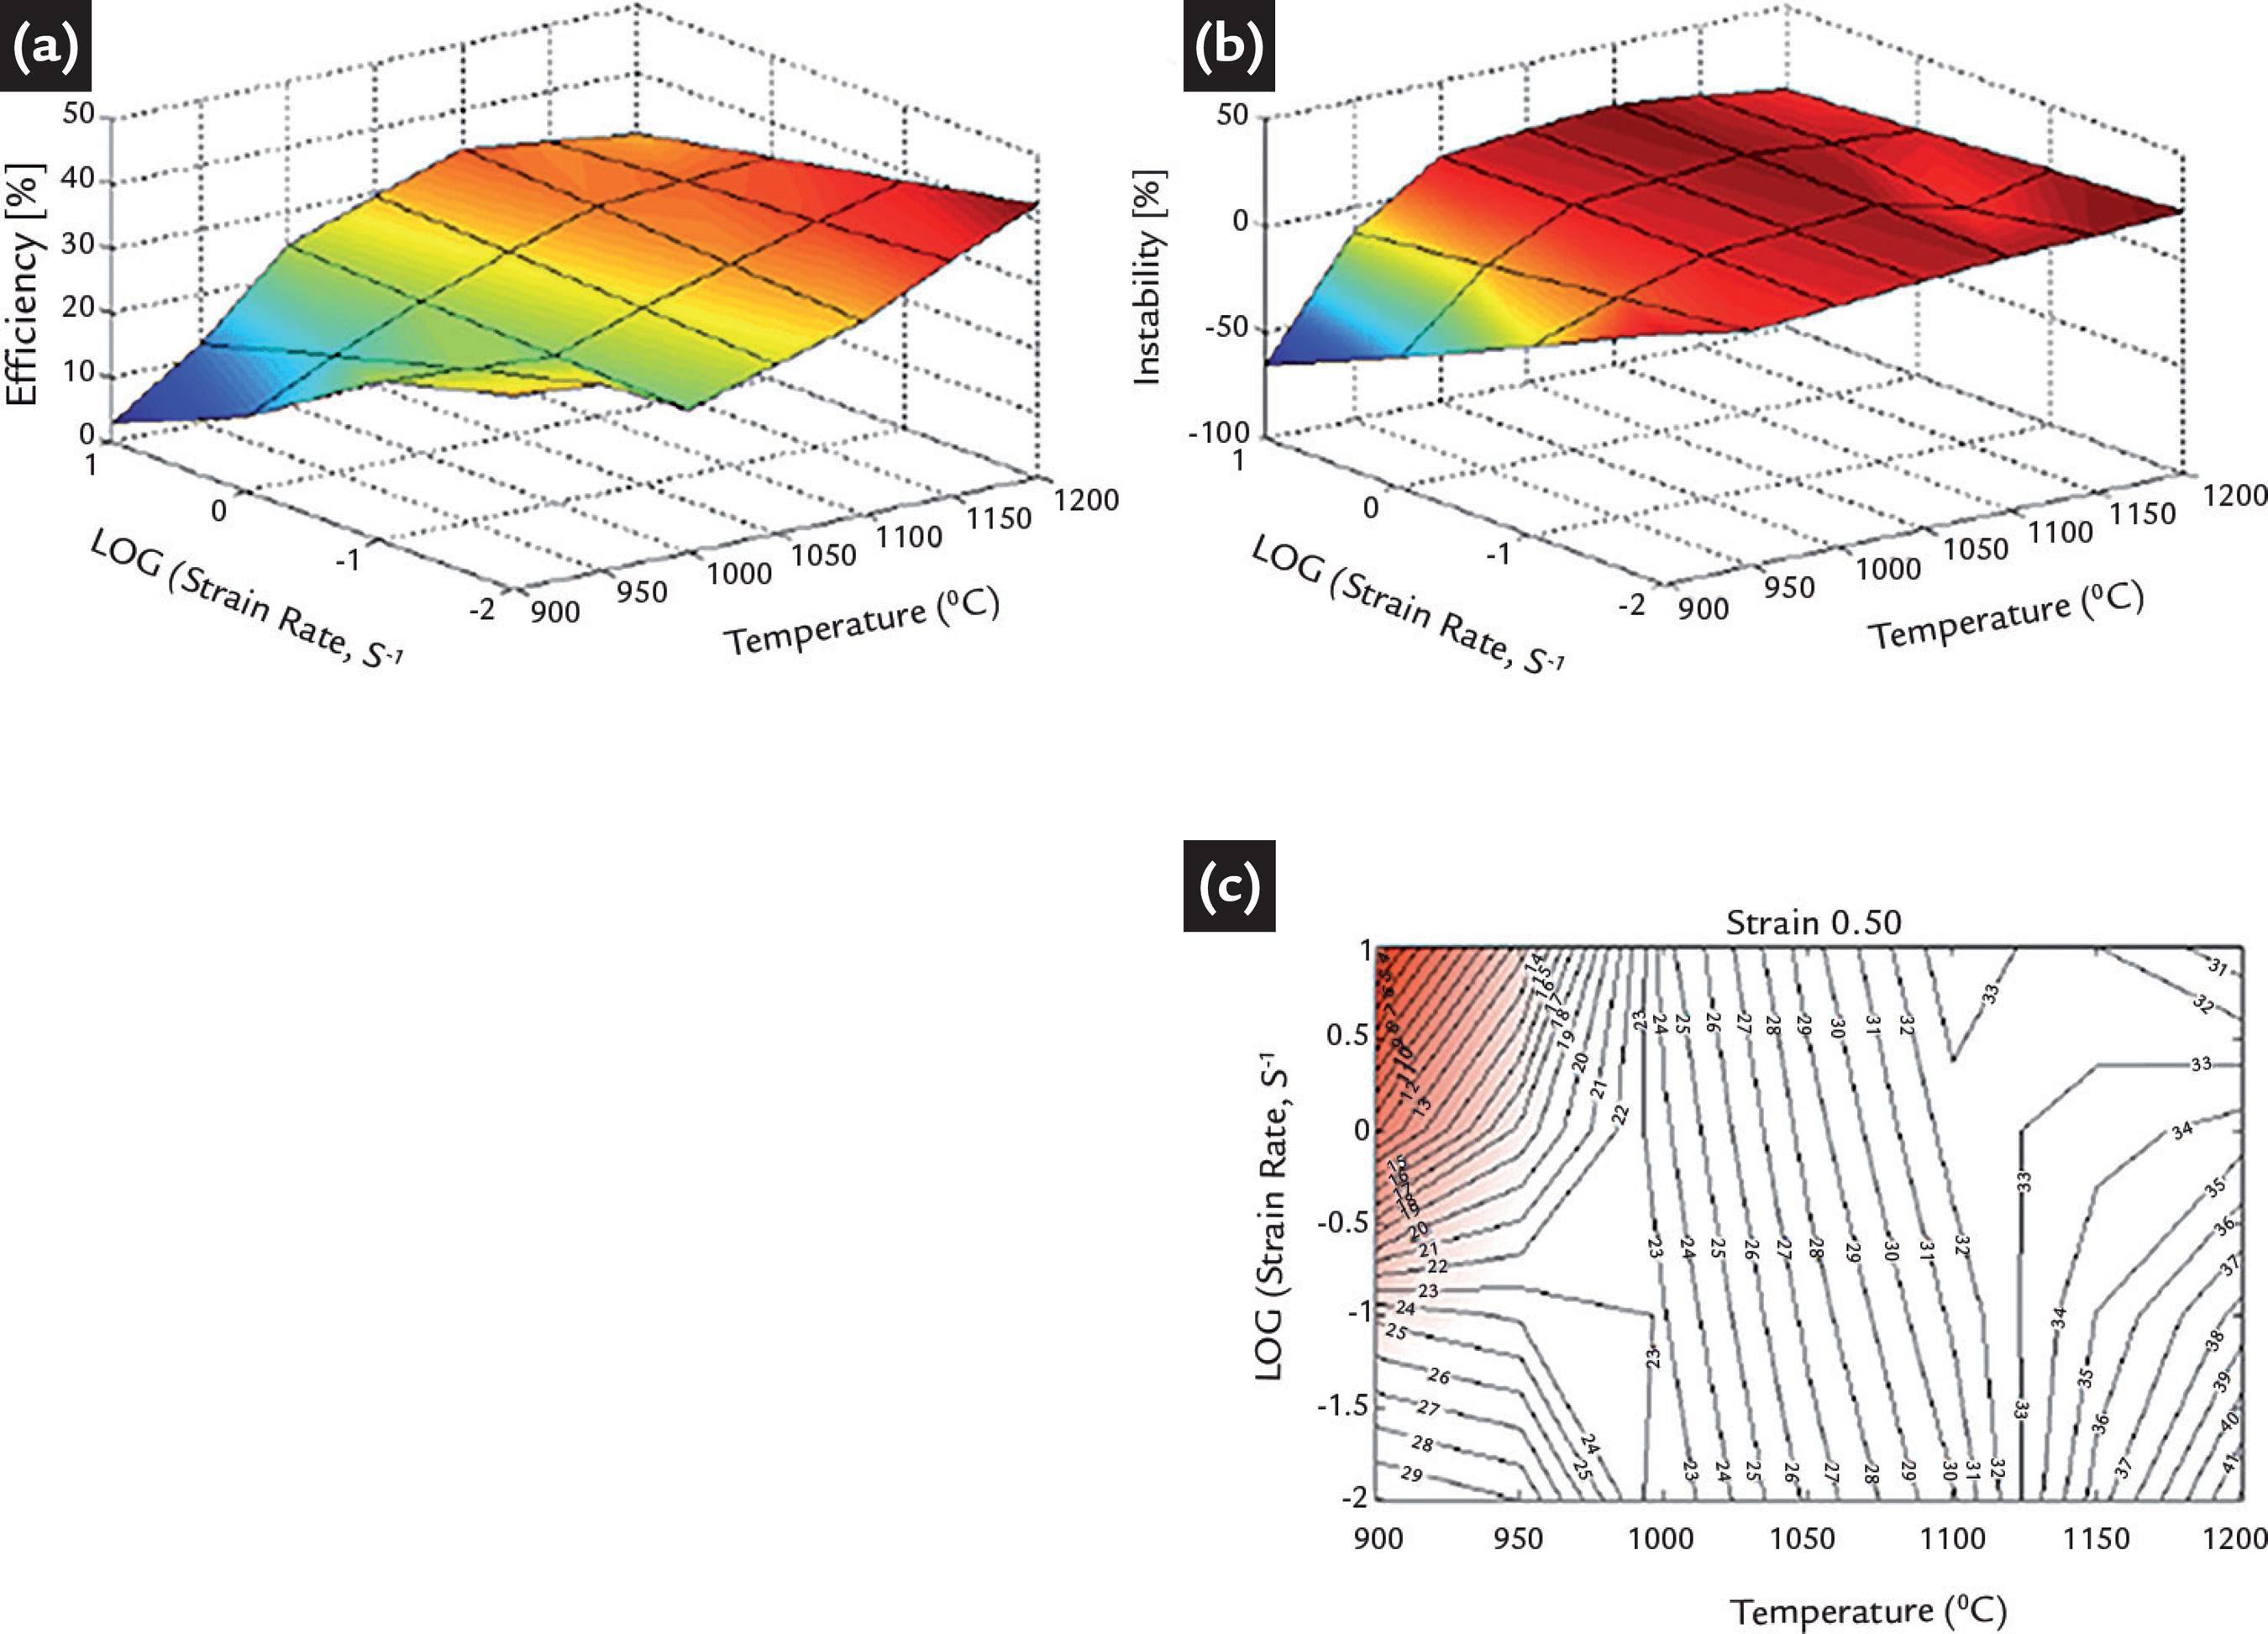
Figure 4 displays the set of maps of power dissipation (a), instability (b) and processing (c) constructed with the m values attained with third degree fitting. Bearing in mind that the effective stress varies nonlinearly with temperature and strain rate, the map of power dissipation must enclose hill and valley regions, when represented in three dimensions. The various domains that arise can be correlated with the microstructure changes of the material by different mechanisms. It is seen in Figure 4 that the map presents three new dissipation valleys, at 1100°C with rates of 0.01and 10 s-1 and 1200°C with rates between 1.0 and 0.1 s-1. Figure 4 shows the presence of a new region of instability at 1100°C with a rate of 10s-1. When comparing figures 3 and 4, it can be seen that the safe conditions for hot work processing have changed, there is a new region of instability around 1100°C with rates between 1.0 and 10s-1.
Power dissipation map (a), instability map (b) and processing map (c) calculated using the third degree fitting for the determination of m.
(iii) Microstructural evolution
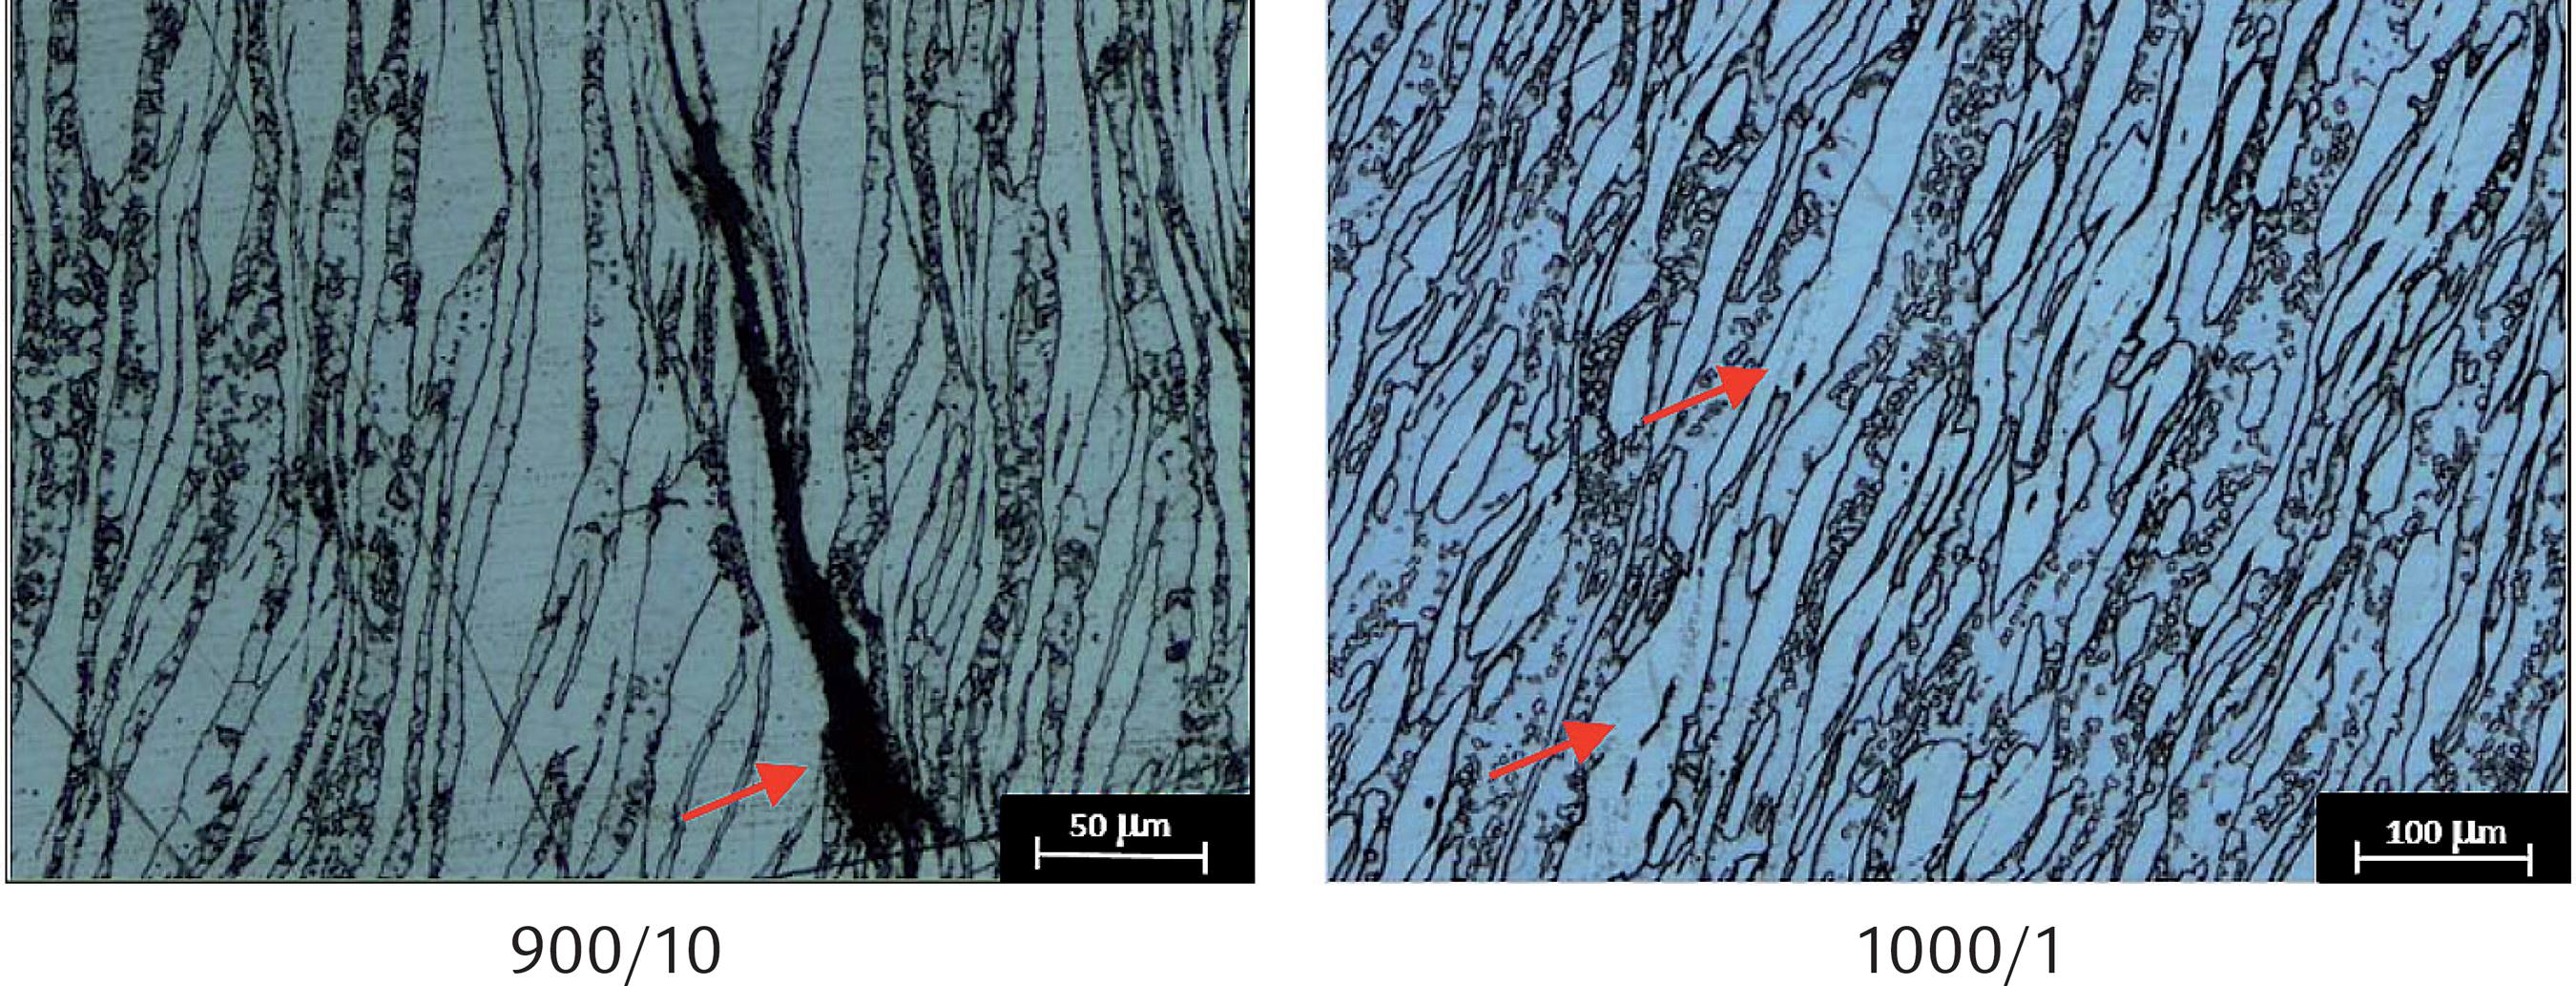
The microstructures of all specimens were observed after deformation. Both processing maps (Figures 3 and 4) indicate one instability region at low temperatures. Figure 5 shows microstructures observed after deformation in this region and close to it. Clearly, one can see the formation of cracks and flow location in the deformed specimen within the region of instability. Also, microstructures can be observed at 900 and 1000°C, as well as the presence of small austenite particles formed within the deformed ferrite matrix. This is an indication that there was phase transformation during cooling or upon deformation.
Microstructures observed in specimens deformed in the region of plastic instability and around this region at low temperatures.
Figure 6 shows the microstructures observed after deformation in regions of possible processing, specified by the maps in Figures 3 and 4, and in the instability region indicated by the processing map of the Figure 4. It is seen in these pictures that the two phases are elongated and aligned with the deformation direction. It is well established in literature that ferrite softens by extended dynamic recovery and austenite by dynamic recrystallization (Cizek, Hodgson, Hurley & Muddle et al. 1997; Balancin, Jorge & Reis et al. 2011BALANCIN, O., JORGE JR, A. M., REIS, G. S. Influence of the microstructure on the plastic behavior of duplex stainless steels. Materials Science Engineering, A528, 2254-2264, 2011.). The extended dynamic recovery can be inferred by the presence of grain boundaries/subgrains within fragmented old ferrite grains. Also, one can see a small amount of austenite particles formed inside of the ferrite grains.
When comparing the microstructure observed after deformation at 1200°C and rate of 0.01s-1 with the microstructure observed at 1100°C and rate of 10s-1, one can see that the microstructures are similar and do not display the instability region shown at 1100°C in the processing map of Figure 4. However, the plastic flow curves (Figure 1) indicate that there is a change in the shape of these curves under these deformation conditions. Also, the microstructures shown in Figuress. 5 and 6indicate that the volume fraction of austenite formed is significantly lower at high temperatures. Thus it can be expected that, at lower temperatures, austenite precipitation took place along with hardening of the material by cooling (9) and, at higher temperatures, deformation concentrates initially in the ferrite, which is softer than the austenite, as indicated by flow stress curve for the sample strained at 1100°C with a rate of 0.1 s-1.
4. Conclusions
The processing maps indicate that the super duplex stainless steel UNS S32760 can be processed in a satisfactory manner at high temperatures with the strain rates studied and display a region of plastic instability at low temperatures.
The processing map done with a better fitting in the calculation of the strain rate sensitivity of the flow stress indicates the presence of a region of the plastic instability around 1100°C and rate of 10s-1. The microstructures observed do not confirm this instability region. However, in these deformation conditions, the material exhibits plastic flow curves with lower work hardening rate.
5. References
- BALANCIN, O., JORGE JR, A. M., REIS, G. S. Influence of the microstructure on the plastic behavior of duplex stainless steels. Materials Science Engineering, A528, 2254-2264, 2011.
- BALANCIN, O., HOFFMANN, W.A., JONAS, J.J. Influence of microstructure on the flow behavior of duplex stainless steels at high temperatures. Metallurgical and Materials Transactions, v.31, A, 1353 -1364, 2000.
- CHEN, L., LIU, X.; MA, X., WANG, l. Materials Design, v.32, 1292-1297, 2011.
- CIZEK, P., HODGSON, P.D., HURLEY, J.P., MUDDLE, B.C., WYNE, B.P. Microestrutural study of softening processes in a duplex steel deformed in hot torsion. Materials Science, Forum, 284-286, 1998.
- DORAIVELU, S.M., GEGEL, H.L., MALAS, J.C., PRASAD, Y.V.R.K. Metallurgical and Materials Transactions, A, v.15, 1883-1892, 1984.
- FANG, Y.L., JIANG, L.Z., LIU, Z.Y., SONG, H.M. Materials Science Engineering, A 526, 128-133, 2009.
- GUTIÉRREZ, I., IZA-MENDIA, A., PIÑOL, A.. Metallurgical and Materials Transitions v. 31A, 1671-1677, 2000.
- KAWASAKI, T.; OHTSUBO, H.; SUZUKI, S.; TAKADA, I. Hot workability of austenitic steel containing delta-ferrite, Kawasaki Steel Technical Report, n0. 14, 50-60, 1986.
- PRASAD, Y.V.R.K., SASIDHARA, S. Handbook. ASM International, 1-24, 1997. (Chapter 2).
Publication Dates
-
Publication in this collection
Apr-Jun 2016
History
-
Received
05 Sept 2014 -
Accepted
16 Feb 2016