Abstract
The inefficiency in controlling the slurry/froth interface level of a scavenger column flotation stage was severely impairing the process performance of an iron mining company, increasing the iron content in the tailings to levels above 20% and, consequently, not meeting the company's iron recovery and pellet feed production targets. Based on mass balance and process data, hydraulic calculations were performed and showed that the installed 6.0" (15.24cm) diameter barometric leg tubes and the control system valve were adequate. An equation to determine the maximum barometric leg height was developed for the flotation column and other calculations showed the necessity to reduce this height from 4.6m to a maximum of 3.4m. The barometric leg adequacy considerably decreased the variability in controlling the slurry/froth interface level, reduced the iron content in the tailings from 24.9% to 18.9% and increased the iron recovery in the flotation stage from 97.9% to 98.7%.
keywords:
slurry/froth interface; barometric leg; column flotation; iron recovery
1. Introduction
Column flotation refers to the device and process described in the Canadian Patent 694,547 (Boutin and Tremblay, 1964) and in the US Patent 3,339.730 (Boutin and Tremblay, 1963), with first commercial use at Mines Gaspé in 1980 (Agar et al., 1991AGAR, G. E.; HULS, B. J.; HYMA, D. B. Foreword. In: INTERNATIONAL CONFERENCE ON COLUMN FLOTATION, 1991, Sudbury. Proceedings[...]. Sudbury, Canada: Column '91, 1991. v. 1, 1991.). In Brazil, the first industrial application of column flotation was at Mineração Manati, in the concentration of gold bearing copper sulfides (Reis Jr. and Peres, 1991). Concommitantly, Samarco began testing pilot columns as an option for the iron ore reverse cationic flotation recleaner circuit, which was preceded by a mechanical cell circuit (Viana et al., 1991VIANA, P. R. M.; SILVA, J. P.; RABELO, P. J. B.; COELHO, A. G.; SILVA, V. C. Column flotation for the expansion of the flotation circuit at Samarco Mineração, Brazil. In: INTERNATIONAL CONFERENCE ON COLUMN FLOTATION, 1991, Sudbury. Proceedings[...]. Sudbury, Canada: Column '91 , 1991. v. 1, p. 89-97.).
As enhanced selectivity between hydrophobic and hydrophilic species and high air flow rates require thicker froth layers, its height significantly affects flotation performance (Aquino et al., 2018AQUINO, J. A.; OLIVEIRA, M. L. M.; FERNANDES, M. D. Flotação em Coluna. In: LUZ, A. B.; FRANÇA, S. M. A.; BRAGA, P. F. A. Tratamento de Minérios. 6. ed. Rio de Janeiro: CETEM, 2018. p. 463-510.).
The motivation for this study arose from the inefficiency in the control of the slurry/froth interface of a flotation column observed at a Brazilian Iron Quadrangle based company. At times, a froth layer was not formed and slurry was spilled through the overflow and, in other occasions, tailings were not discharged in the overflow. The variability significantly impaired the process performance, raising the iron content in the tailings to above 20% (maximum stipulated to meet the company's iron recovery target).
This study presents the dimensional design of a barometric leg in order to reduce the variability of the slurry/froth interface level of a flotation column.
2. Material and methods
2.1 Flotation column installations
The slurry/froth interface level measurement was carried out using a system composed of an ultrasonic sensor and a float that runs inside a guide tube, both made of polyvinylchloride. The lower part of the float was located at the slurry/froth interface and its range varied from 0 to 2.0 meters (0 to 100%). The control of the froth layer thickness was achieved by the automated opening and closing of the valve installed in the discharge of the flotation column. The system aimed to maintain the level of the slurry/froth interface close to a set value. Figure 1 presents the slurry/froth interface level measurement and control system.
The column discharge flow took place along a barometric leg. This installation was used due to the different height between the bottom of the flotation column and the top of the pumping box system responsible for transferring the slurry to the next flotation stage. The barometric leg aimed to control the slurry flow in the column discharge. At its upper part, there is a vent to admit air into the pipeline as the slurry flows by gravity from this point.
2.2 Process data and mass balance
The particle size distribution of the samples collected in the scavenger column feed was obtained using Tyler series screens. The fraction passing in 38µm was analyzed in a Mastersizer Micro laser granulometer. Sodium hexametaphosphate (0.05% w/v) was used to disperse the particles.
The process data for the dimensional design were obtained from the flotation circuit mass balance using the BILMAT software. The iron content and the solid specific gravity were determined by dichromatometry (TiCl3 method) and picnometry, respectively. The circuit feed rate was considered as high as possible, for operation of the iron ore beneficiation plant under normal and unrestricted conditions.
The dynamic viscosity of the slurry was estimated using Equation 1 (Thomas, 1964ROUSE, H. Evaluation of boundary roughness. In: HYDRAULICS CONFERENCE, 2nd, 1943, Iowa. Proceedings[...]. Iowa: University of Iowa, 1943.).
Where: ms is the dynamic viscosity of the slurry; ml is the dynamic viscosity of the liquid (1.0030cP, for water); cv is the volumetric concentration of solids in the slurry; and e is Euler's number.
2.3 Diameter specification for tubes and control valve
The transport velocity of a slurry must meet two requirements: (i) producing the necessary turbulence to keep the solids suspended; (ii) being as small as possible to reduce friction with the pipe walls. According to Wasp and Slatter (2004)WASP, E. J.; SLATTER, P. Deposition velocities for small particles in large pipes. In: INTERNATIONAL CONFERENCE ON TRANSPORT & SEDIMENTATION OF SOLIDS PARTICLES, 12th, 2004, Prague, Czech Republic. Proceedings[...]. Prague : Institute of Hydrodynamics, Academy of Sciences of the Czech Republic, 2004. p. 20-24., the critical velocity of deposition can be determined by Equation 2.
Where: vd is the critical velocity of deposition; S is the relative specific gravity solid/liquid; d 95 is the interpolated diameter of 95% of the passing material; rS is the specific gravity of the solids; g is the standard value for the Earth's gravitational acceleration (g=9.81m/s2); Di is the internal pipe diameter; and ms is the dynamic viscosity of the slurry.
The transport velocity should be greater than the critical velocity (v>>vd ). According to Crane (1978)CRANE, C. Flow of fluids through valves, fittings, and pipe. New York: Crane CO, 1978., the average velocity through cross section of a tube is determined by Equation 3.
Where: Q is the volumetric flow; v 1 and v 2 are the average flow velocities at points 1 and 2, respectively; and A 1 and A 2 are the cross-section areas at points 1 and 2, respectively.
2.4 Dimensional design of the barometric leg
Finnemore and Franzini (2002)FINNEMORE, E. J.; FRANZINI, J. B. Energy in steady flow. In: FINNEMORE, E. J.; FRANZINI, J. B. Fluid mechanics with engineering applications. 10. ed. Boston: McGraw-Hill, 2002. p. 127-184. presented the equation for steady motion of a real fluid, which is applied to the constant flow of compressible and incompressible real fluids.
Where: p 1 and p 2 are the pressures at points 1 and 2, respectively; g is the standard value for Earth's gravitational acceleration (g=9.81m/s2); is the slurry density; v 1e v 2 are the average flow velocities at points 1 and 2, respectively; Z 1and Z 2 are the heights at points 1 and 2, respectively, relative to the initial height; and Dh is the total head loss. The head loss can be obtained using the Darcy-Weisbach method, according to Equation 5 (Rouse, 1943REIS Jr., J. B.; PERES, A. E. C. Industrial application of flotation columns in the concentration of a sulfide ore at Mineração Manati LTDA - Brazil. In: INTERNATIONAL CONFERENCE ON COLUMN FLOTATION, 1991, Sudbury. Proceedings[...]. Sudbury, Canada: Column '91 , 1991. v.2, p. 525-537.). This method only applies to Newtonian fluid.
Where: Dh is the total head loss; Cf is the head loss coefficient calculated by Swamee and Jain equation (1976)REYNOLDS, O. An experimental investigation of the circumstances which determine whether the motion of water shall be direct or sinuous and of the law of resistance in parallel channel. Philosophical Transactions of the Royal Society of London, v. 174, p. 935-982, 1883.; L is the pipe length; Di is the internal pipe diameter; Q is the flow rate; is the absolute roughness (⁄Di is the dimensionless relative roughness of the pipe, being the ratio between the absolute roughness and the internal pipe diameter); and Re is the dimensionless Reynolds number (Reynolds, 1883REYNOLDS, O. An experimental investigation of the circumstances which determine whether the motion of water shall be direct or sinuous and of the law of resistance in parallel channel. Philosophical Transactions of the Royal Society of London, v. 174, p. 935-982, 1883.) calculated using Equation 6. The most widely accepted nominal range for laminar flow in pipes is Re < 2000, while turbulent flow generally occurs for Re > 4000.
Where: Re is the dimensionless Reynolds number; r is the slurry density; v is the flow velocity; Di is the internal pipe diameter; and ms is the dynamic viscosity of the slurry.
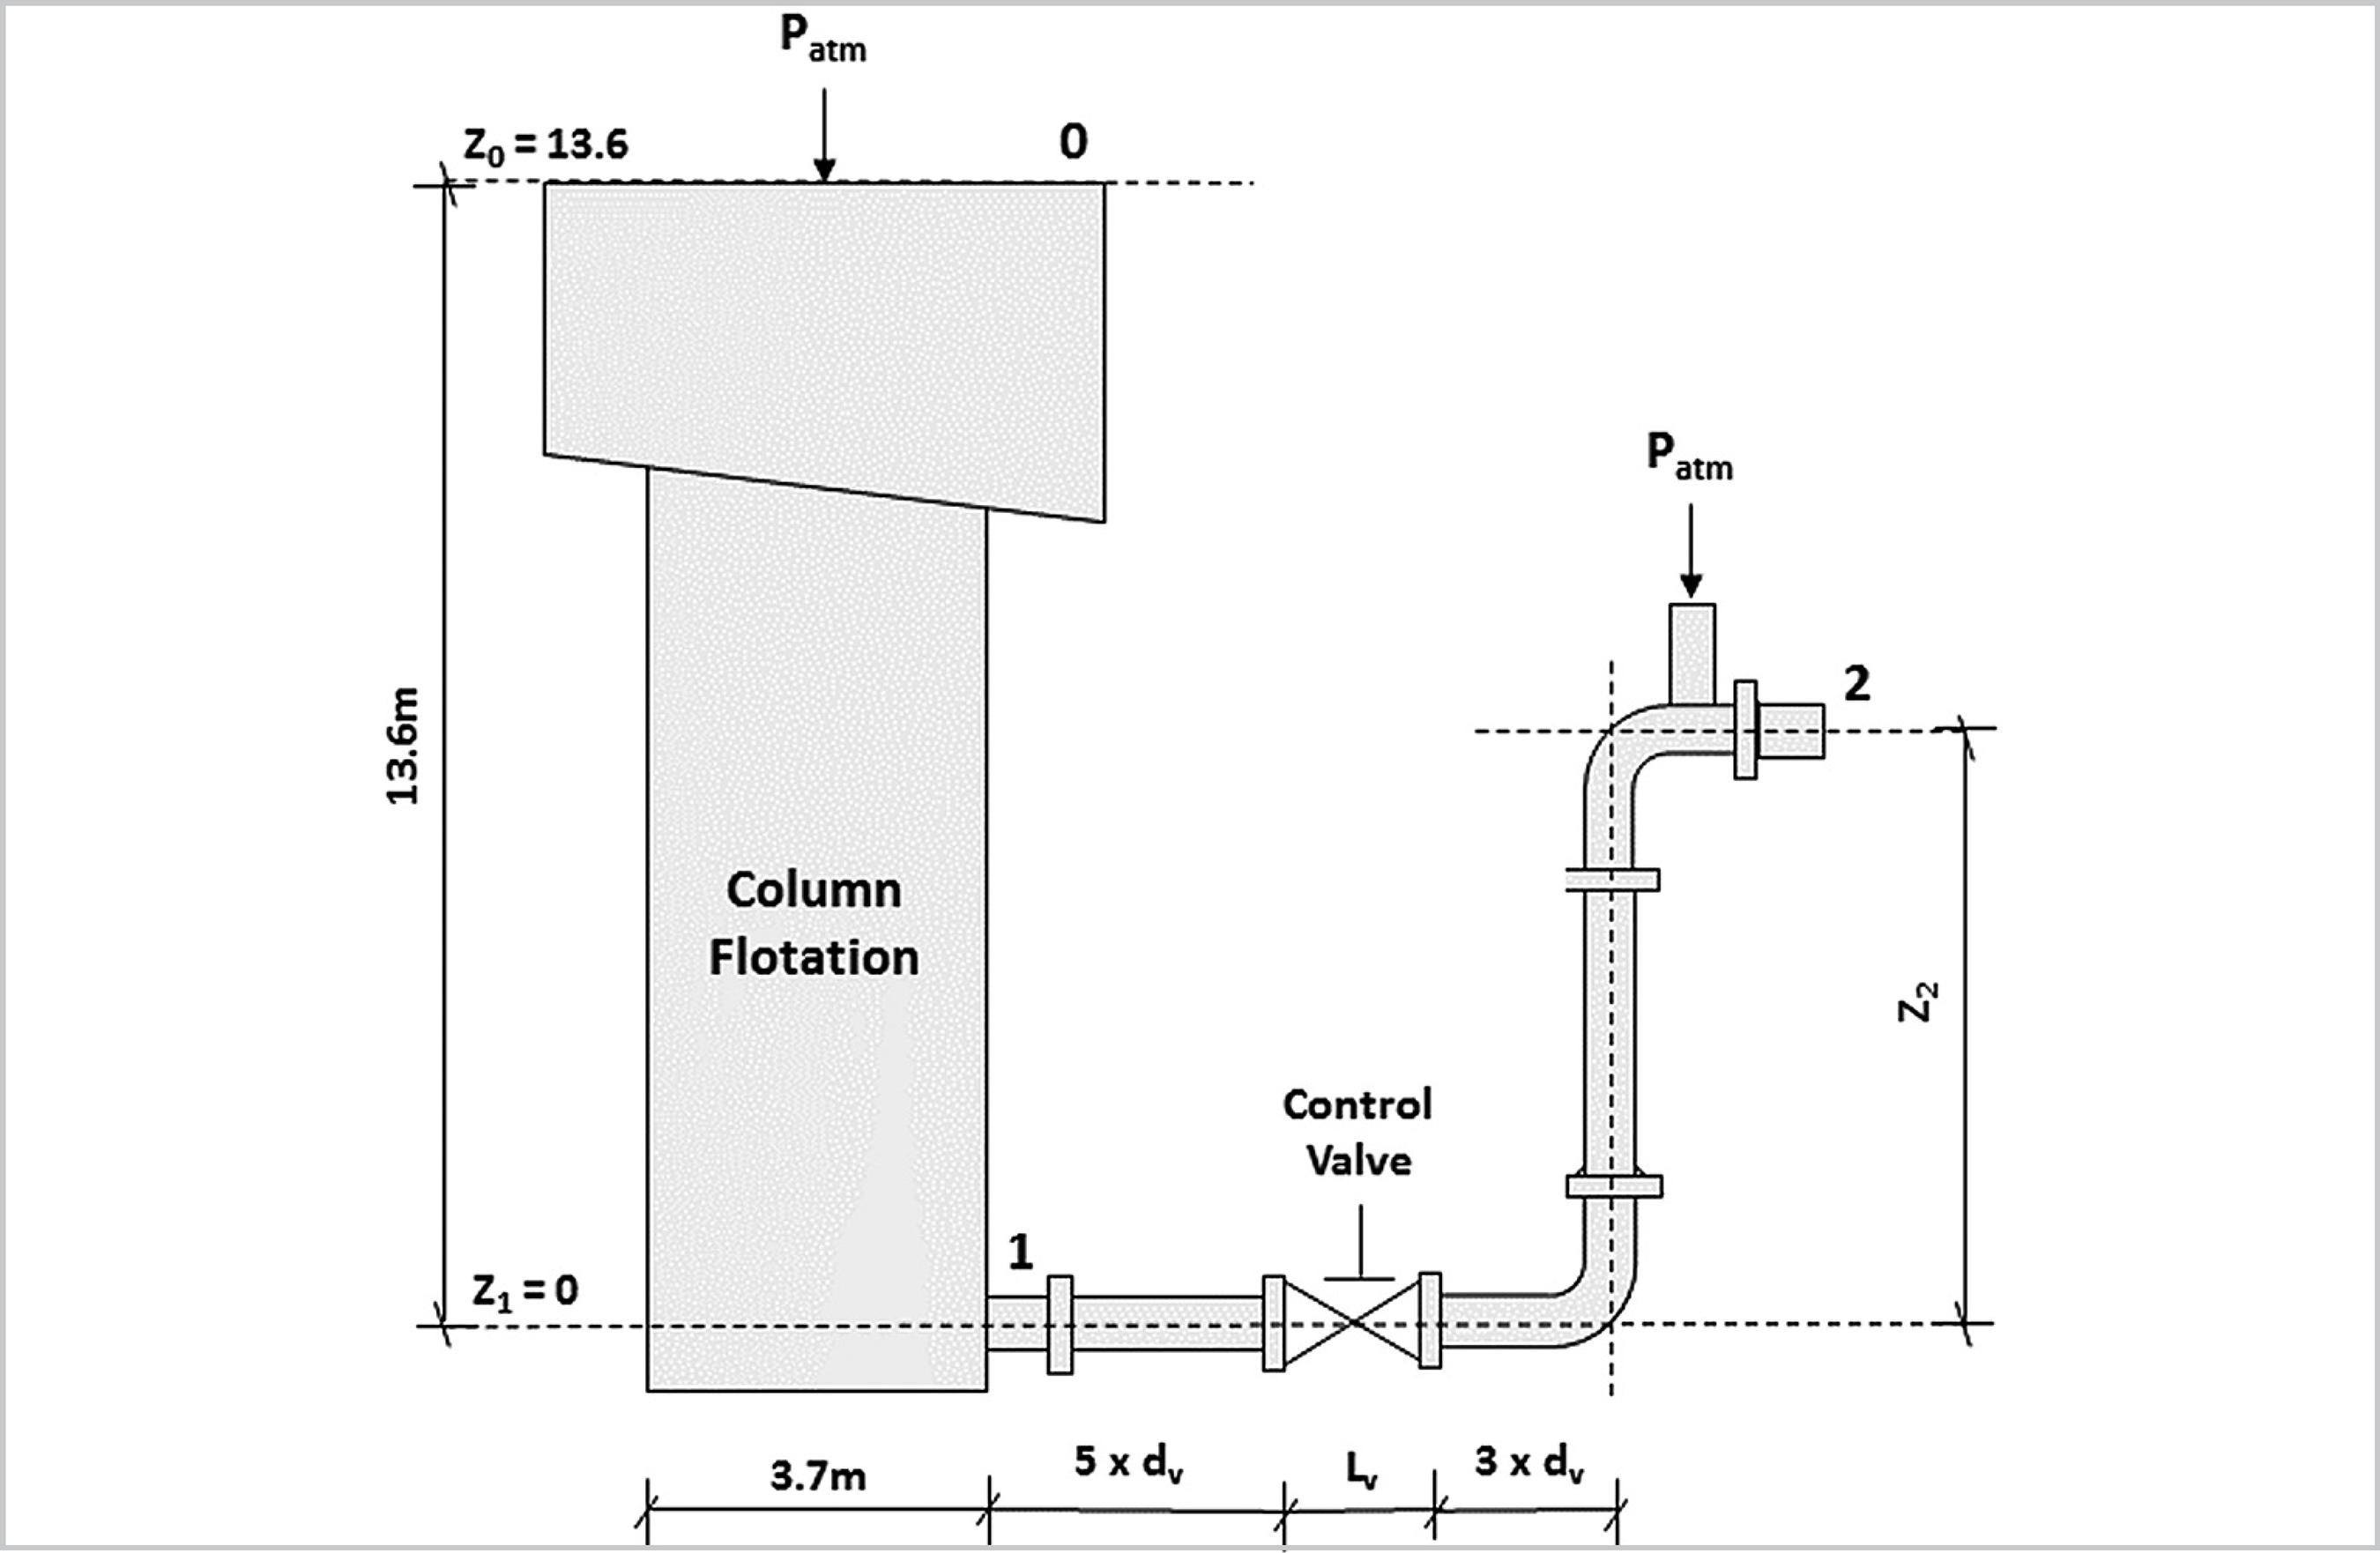
Equation 4, applied for steady motion of a real fluid, was used to develop an equation to size the barometric leg. The circular column dimensions and dimensional design criteria for pipeline, valve and barometric leg are presented in Figure 2.
Circular column dimensions and dimensional design criteria for pipeline, valve and barometric leg.
Based on design criteria of a recognized manufacturer of circular columns, the pipeline length between the column and the control valve is recommended to be at minimum five times longer than the diameter of valve is recommended (5×dv ). The minimum pipeline length after this instrument (in the horizontal section) should be three times longer than its diameter (3×dv ). Therefore, the barometric leg length is expressed by Equation 7.
The equation to determine the flotation column barometric leg maximum height (Equation 8), developed for the installations' dimensional design criteria presented in Figure 2, was obtained applying Equation 4 between points 0 and 1 and, then, between points 1 and 2.
It was considered: p 0 = p 2 = 0 (atmospheric pressure); v 1 = v 2; Z 1 = 0 (minimum height); and v 0 = 0 (the flow velocity v 0 will tend to zero due to the large diameter of the column).
2.5 Flotation performance evaluation
The iron content in the tailings and the iron recovery before and after the modifications of the slurry/froth interface level control system in the flotation column were evaluated using control charts. Minitab 17 software was used to generate the graphs and to measure the decrease in variability.
3. Results and discussions
3.1 Process data and mass balance
Figure 3 shows the mass balance of the large volume mechanical cells circuit from which the process data for the dimensional design of the slurry/froth interface control system of the scavenger column were extracted. The d 95 of the column feed material was found to be 75µm.
Level of slurry/froth interface of the column before and after modifying the barometric leg.
The slurry dynamic viscosity of the column discharge was found to be 1.7x10⁻³ kg/m.s, using Equation 1.
3.2 Diameter selection for tubes and control valve
Table 1 presents the main characteristics of the tubes installed in the barometric leg.
In order to evaluate if the installed diameter would meet the required process conditions, the flow velocity and the critical velocity of deposition, were calculated (using Equations 3 and 2) and found to be 5.1 and 1.73 m/s, respectively.
The condition v>vd was satisfied for the 6.0" diameter tubes (0.1234m internal diameter) and, based on the process knowhow, the flow velocity was considered acceptable because it does not cause premature wear of the pipe walls. It is important to notice that the installed control valve also had a 6.0" diameter and therefore no change was considered necessary. For the calculation of the maximum height of the barometric leg, the control valve internal diameter was considered equal to that of the tubes.
3.3 Dimensional design of the barometric leg
The conditions investigated in this study were applied in Equation 6, resulting in a Reynolds number of 5.2x10⁵.
In order to determine the relative roughness, an absolute roughness of 0.0005m was used for old lined steel pipe (installed condition). The relative roughness was then calculated to be 4.1x10⁻³.
The next step was to calculate the barometric leg dimensions. Equation 8 was used for this purpose. Firstly, the head loss coefficient was found to be 0.06, using the Swamee and Jain equation (1976)REYNOLDS, O. An experimental investigation of the circumstances which determine whether the motion of water shall be direct or sinuous and of the law of resistance in parallel channel. Philosophical Transactions of the Royal Society of London, v. 174, p. 935-982, 1883..
Replacing the total barometric leg length (equation 7) in Equation 5 and using the measured valve length (Lv = 0.5m), the total head loss was presented as a function of the maximum barometric leg height:
Finally, the maximum height of the barometric leg was calculated to be 3.4m, using equation 8. The height Z 0 was corrected discounting the volumetric air concentration because approximately 42.0% of the column flotation internal volume was filled with air. Table 2 shows this corrected height.
Based on the calculations above, a scheduled stoppage of the flotation circuit was carried out to replace some tubes, adjusting the horizontal length and the barometric leg height. The height was physically reduced from 4.6m to approximately 2.6m, being equivalent to the elevation for the pipe reaching the top of the pumping box system (mentioned in item 2.1). The choice of a slightly lower height than the calculated maximum was made to fully meet the slurry flow demanded by the process. It is also important to mention that any industrial operation contains variations and that changing the height of the barometric leg to exactly 3.4m would leave the system very close to the process demand.
3.4 The flotation performance
Figures 5 and 6 present the iron content in the tailings and the iron recovery before and after correcting the barometric leg.
The average iron content of the flotation circuit tailings decreased from 24.9% to 18.9% after modification of the barometric leg. The reduction in the iron content in the tailings, therefore, increased the average iron recovery from 97.9% to 98.7%, also followed by a reduction in iron content variability. These results are expected, since the slurry/froth interface level became better defined and more constant, leading to more efficient processes for the cleaning and collection zones inside the flotation column. Therefore, the problems which did not allow the column to perform properly (e.g.: flow of slurry through the overflow or poorly formed froth layer) were eliminated due to better control.
4. Conclusions
Hydraulic calculations were performed and showed that the installed 6.0" (15.24cm) diameter barometric leg tubes and the control valve were adequate for slurry flow along the barometric leg. An equation to determine the barometric leg maximum height was developed for the flotation column and calculations showed the need to reduce this height from 4.6m to a maximum of 3.4m. The barometric leg modification considerably decreased the variability of the slurry/froth interface level, reduced the iron content in the tailings from 24.9% to 18.9% and increased the iron recovery in the flotation stage from 97.9% to 98.7%.
Acknowledgement
This study was financed in part by the Coordenação de Aperfeiçoamento de Pessoal de Nível Superior - Brasil (CAPES) - Finance Code 001.
The authors acknowledge CNPq, FAPEMIG, CAPES and PROEX CAPES for supporting PPGEM.
References
- AGAR, G. E.; HULS, B. J.; HYMA, D. B. Foreword. In: INTERNATIONAL CONFERENCE ON COLUMN FLOTATION, 1991, Sudbury. Proceedings[...] Sudbury, Canada: Column '91, 1991. v. 1, 1991.
- AQUINO, J. A.; OLIVEIRA, M. L. M.; FERNANDES, M. D. Flotação em Coluna. In: LUZ, A. B.; FRANÇA, S. M. A.; BRAGA, P. F. A. Tratamento de Minérios 6. ed. Rio de Janeiro: CETEM, 2018. p. 463-510.
- BOUTIN, P.; TREMBLAY, R. J. Froth flotation method with counter-current separation US Patent 3339730. Filing Date: 1963-06-19. Publication Date: 1967-09-05.
- BOUTIN, P.; TREMBLAY, R. J. Apparatus for the separation and recovery of ores Canadian Patent 694547. Publication Date: 1964-09-15.
- CRANE, C. Flow of fluids through valves, fittings, and pipe New York: Crane CO, 1978.
- FINNEMORE, E. J.; FRANZINI, J. B. Energy in steady flow. In: FINNEMORE, E. J.; FRANZINI, J. B. Fluid mechanics with engineering applications 10. ed. Boston: McGraw-Hill, 2002. p. 127-184.
- REIS Jr., J. B.; PERES, A. E. C. Industrial application of flotation columns in the concentration of a sulfide ore at Mineração Manati LTDA - Brazil. In: INTERNATIONAL CONFERENCE ON COLUMN FLOTATION, 1991, Sudbury. Proceedings[...] Sudbury, Canada: Column '91 , 1991. v.2, p. 525-537.
- REYNOLDS, O. An experimental investigation of the circumstances which determine whether the motion of water shall be direct or sinuous and of the law of resistance in parallel channel. Philosophical Transactions of the Royal Society of London, v. 174, p. 935-982, 1883.
- ROUSE, H. Evaluation of boundary roughness. In: HYDRAULICS CONFERENCE, 2nd, 1943, Iowa. Proceedings[...] Iowa: University of Iowa, 1943.
- SWAMEE, P. K.; JAIN, A. K. Explicit equations for pipe-flow problems. Journal of the Hydraulics Division, New York: American Society of Civil Engineers, v. 102, p. 657-664, 1976.
- THOMAS, D. G. Turbulent disruption of flocs in small particle size suspensions. AIChE Journal, v. 10, p. 517-523, 1964.
- VIANA, P. R. M.; SILVA, J. P.; RABELO, P. J. B.; COELHO, A. G.; SILVA, V. C. Column flotation for the expansion of the flotation circuit at Samarco Mineração, Brazil. In: INTERNATIONAL CONFERENCE ON COLUMN FLOTATION, 1991, Sudbury. Proceedings[...] Sudbury, Canada: Column '91 , 1991. v. 1, p. 89-97.
- WASP, E. J.; SLATTER, P. Deposition velocities for small particles in large pipes. In: INTERNATIONAL CONFERENCE ON TRANSPORT & SEDIMENTATION OF SOLIDS PARTICLES, 12th, 2004, Prague, Czech Republic. Proceedings[...] Prague : Institute of Hydrodynamics, Academy of Sciences of the Czech Republic, 2004. p. 20-24.
Publication Dates
-
Publication in this collection
20 Dec 2019 -
Date of issue
Jan-Mar 2020
History
-
Received
2 July 2019 -
Accepted
25 Sept 2019