Abstract
The inclusion of grade uncertainty for multivariate mineral deposits is of great importance for the correct management of subsequent decisions involved in mining planning. Mapping grade uncertainties allows maximization of profit and resource extraction. In this article, the co-simulation turning band algorithm is applied with the aim of predicting multivariate grade uncertainties. Moreover, a probabilistic analysis in long term mining sequencing is proposed in order to select the best given grade scheduling uncertainty derived from the simulations. A case study in a phosphate mine shows that the correlation of co-simulated variables honors the original data and there is an improvement in the project by an increase in Net Present Value (NPV) planning considering grade uncertainties. A comparison is performed with the results derived from the selected schedule and the results using the model based on kriged grades.
keywords:
grade uncertainty; turning bands co-simulation; mine scheduling
1. Introduction
Traditional interpolation techniques in geostatistics (e.g., kriging or co-kriging) have been used to represent spatial grade distribution in a block model. Although these methods are appropriate for mineral resource estimations, the main disadvantage is that they generate smooth representations of the grade distributions, and therefore are unable to reproduce the in situ variability of the deposit under study, leading to a production expectation different from reality (Dimitrakopoulos et al., 2002DIMITRAKOPOULOS, R., FARRELLY, C. T., GODOY, M. C. Moving forward from traditional optimisation: grade uncertainty and risk effects in open pit mine design. Mining Technology, v. 111, Issue 1, p. 82-89, 2002.). Instead, geostatistical simulations (Journel, 1974JOURNEL, A. G. Geostatistics for conditional simulation of ore bodies. Economic Geology, v. 69, n. 5, p. 673-687, 1974.) aim to reproduce the in situ grade variability and spatial continuity of the original data, through the generation of equally probable scenarios, which reproduce first and second order statistics. Thus, the uncertainty space (delimited by the ergodic fluctuations) associated with the estimates can be evaluated (Goovaerts, 1997GOOVAERTS, P. Geostatistics for natural resource evaluation. New York: Oxford University Press, 1997. 483p.).
A model is not able to map all uncertainty sources, nor is there a true model of uncertainty: uncertainty is dependent on the model. This was discussed by Goovaerts (1997)GOOVAERTS, P. Geostatistics for natural resource evaluation. New York: Oxford University Press, 1997. 483p., Journel and Kyriakidis (2004)JOURNEL, A. G., KYRIAKIDIS, P. Evaluation of mineral reserves, a simulation approach. Oxford University Press, 2004. 216 p., among others. Usually, simulation models are not able to capture all uncertainty sources present in a resource model.
Mapping grade uncertainty for subsequent steps in mine planning is of great importance for the management of mining projects. This is partly due to the inherently large financial risk involved in decision making regarding production. Production scheduling over the life of mine aims at optimizing the material sequence extraction to be mined in space over time, and, beyond that, maximizing the net present value (NPV) of the project.
Due to the large number of parameters considered, mine planning is associated with numerous sources of uncertainty. It becomes necessary to understand and identify such sources to measure and control risks. (Dimitrakopoulos et al., 2007DIMITRAKOPOULOS, R., MARTINEZ, L., RAMAZAN, S. A maximum upside/minimum downside approach to the traditional optimization of open pit mine desgin. Journal of Mining Science, v. 43. p. 73-82, 2007.). These include internal uncertainties such as geological uncertainty from the mineral orebody and external uncertainties dependent on external factors, such as economic and socio-political uncertainties.
The traditional methodology of resource estimation and mining planning, which has been used over the years in the mining industry, has been established to deal with the modeling the spatial distribution of attributes in a mineral deposit, pit optimization and mining planning. In recent years, a methodology other than the traditional one has been researched.
The steps involved in a mining process can be seen as transfer functions, which are models used for description of operations or real systems (Godoy, 1998GODOY, M. C. Minimização de perdas em operações de lavra seletiva incorporando a incerteza da estimativa no controle de teores. Porto Alegre: Faculdade de Engenharia de Minas, Metalúrgica e de Materiais, Universidade Federal Rio Grande do Sul, 1998. 91 p. (Dissertação de Mestrado em Engenharia).). If the transfer function applied is non-linear (as in mining planning), the output generated on a non-linear process, such as scheduling when using the traditional orebody model (average of all possible values) as an input, is expected to be precisely wrong.
Rather than using a single input model for input data to be optimized and a correct evaluation of key design indicators, a set of equally probable mineral deposition models can be used. These models are conditioned to the sample data of the deposit and reproduce the statistical characteristics of the deposit. The use of equally probable models of a mineral deposit allows to evaluate the pit optimization sensitiveness and long-term mining sequencing due to geological uncertainty (Kent et al., 2007). In addition, the identification of such factors makes it possible to plan the ultimate pit and the sequencing of production with the net present value being substantially more realistic. In Godoy and Dimiktrakopoulos (2004)GODOY, M. C., DIMITRAKOPOULOS, R. Managing risk and waste mining in long-term production scheduling. SME Transactions, v. 316, p. 43-50, 2004., a case study is presented, applied to a gold mine, where a stochastic evaluation leads to a market improvement of 28% of the NPV over the life of the mine, compared to the traditional techniques for estimating resources, considering the same final pit limit. This scenario does not necessarily show an expectation of gain for all the cases considered, but an appreciation that the average model traditionally used in industry (kriging) may be far from reality when considering the uncertainty spectrum of the geological variables in a mineral deposit.
The next step, following the definition of the final pit, is the generation of pushbacks. A mining advance is a phase in the expansion of the mine, which must be developed under certain constraints (slope angle, berm width, feed rate at the plant, operating space, etc.) in order to ensure the proper sequence. The material quantity ratio to that adopted in the mining sequence is defined as the proportion of waste to be mined exposing an ore unit from the mineral deposit (stripping ratio). This can also be a partial relation, referring to a period, a pushback or a mining panel (Diedrich, 2012DIEDRICH, C. Incorporação da variabilidade dos teores para análise de risco de recursos minerais e sequenciamento de lavra. Porto Alegre: Faculdade de Engenharia de Minas, Metalúrgica e de Materiais, Universidade Federal Rio Grande do Sul, 2012. 188 p. (Dissertação de Mestrado em Engenharia).).
After the generation of the pushbacks, the mining sequence step is started, which, for open pit mines, is to define an order for extraction of blocks or panels throughout the life of the mine (LOM). It can be represented by a production schedule that aims at optimizing or balancing the extraction sequence with respect to the quantities of ore and waste extracted along each period, in order to obtain the highest net present value (NPV) when considering pre-determined operational parameters.
The production scheduling through traditional mining sequencing disregards the geological uncertainty, since it is performed with deterministic models, presenting significant differences between the calculated values and the reality.
Some concepts about risk analysis using stochastic simulation techniques were discussed by Ravenscroft (1993)RAVENSCROFT, P. J. Conditional simulation for mining: practical implementation in an industrial environment. In: ARMSTRONG, M., DOWD, P. A. (Eds.). Proceedings geostatistical simulations. Kluwer Academic Publishers, p. 147-177, 1993. in the context of assessing the impact of uncertainty and in situ variability of the contents in open pit projects through production schedules and economic evaluations.
The availability of stochastic simulation techniques for the quantification of geological uncertainty led to the development of programming techniques that integrate uncertainty into the mine planning process. Dimitrakopoulos and Ramazan (2004)DIMITRAKOPOULOS, R., RAMAZAN, S. Uncertainty based production scheduling in open pit mining. SME Transactions, v. 316, p. 106-112, 2004. developed an optimization technique that introduces a new concept of production programming, with geological risk discount. Ramazan and Dimitrakopoulos (2007)RAMAZAN, S., DIMITRAKOPOULOS, R. Stochastic optimization of long-term production scheduling for open pit mines with a new integer programming formulation. In: Orebody Modelling and Strategic Mine planning. (2nd Ed.). The Australian Institute of Mining and Metallurgy, v. 14, p. 385-392, 1997. developed an entire stochastic programming model that uses multiple simulated realizations to minimize deviations in the sequencing of ore production over the mine's lifetime, presenting the financial benefits.
The main idea for sequencing production that takes into account the uncertainty of the contents is relatively simple. Conventional optimizers work with deterministic models by constructing and evaluating a set of blocks, in order to decide when to stop mining, which blocks to extract, and so on, assuming that the economic values of the mined blocks (input data to the optimizer) are the actual values.
A stochastic optimizer, also using construction, evaluates a set of blocks, simultaneously through all possible combinations of economic values of the blocks in the considered grouping.
As a result, a considerable amount of local information is used to map the uncertainty, leading to more robust mining sequencing that can also maximize deposit potential (e.g. increase in metal output and NPV) and at the same time minimize (e.g. non-compliance with production targets and related losses).
In order to consider the uncertainty of the levels in the trench sequencing with conventional optimizers, and to incorporate the risks associated with reaching a certain NPV value, a classification index variation was used, initially proposed by Dimitrakopoulos et al. (2007)DIMITRAKOPOULOS, R., MARTINEZ, L., RAMAZAN, S. A maximum upside/minimum downside approach to the traditional optimization of open pit mine desgin. Journal of Mining Science, v. 43. p. 73-82, 2007..
In this context, a strategy is proposed for defining the mine scheduling, taking into account the variability of the main attributes of a phosphate deposit (P2O5 and CaO) and using co-simulation turning bands. For mine sequencing, economic parameters, together with physical and operational constraints, are considered. Finally, a comparison of the sequencing scenario obtained by the technique proposed here and the traditional method based on interpolation (kriging) is performed, or its equivalent represented by the mean block grades obtained from the simulations.
2. Methodology
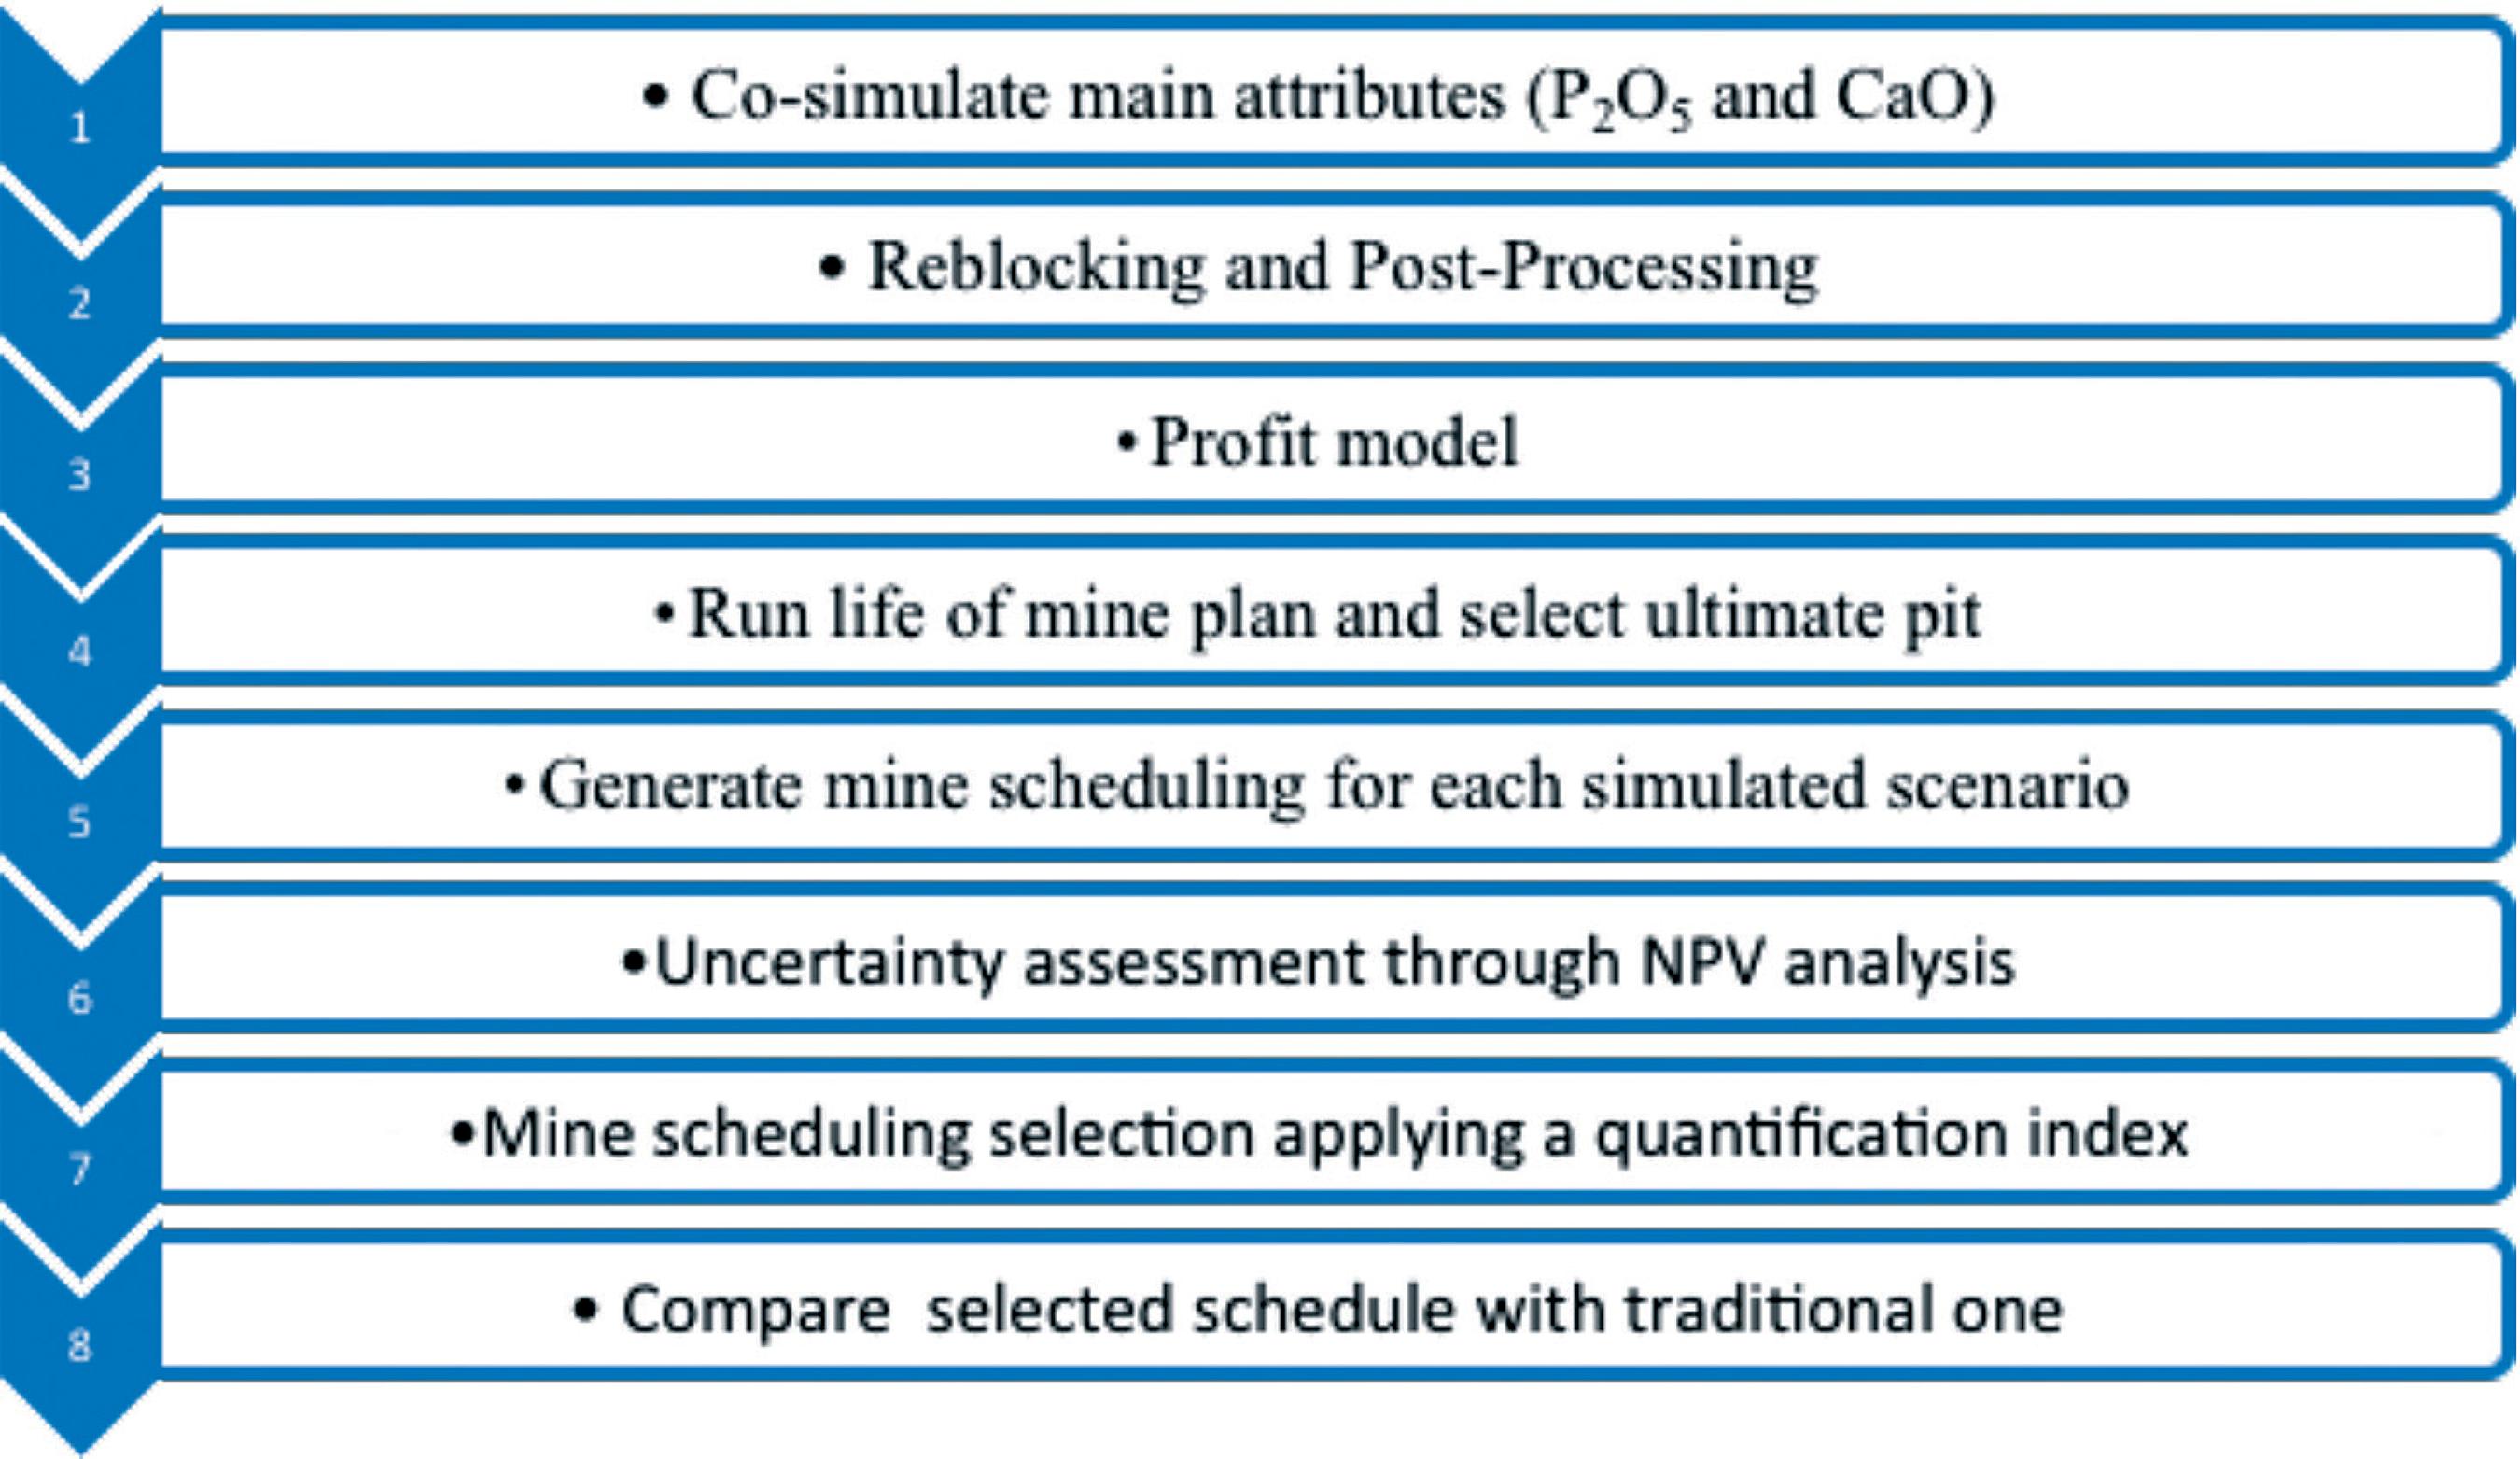
The workflow herein proposed is shown in Figure 1. It consists of selecting a mining schedule through the application of a probabilistic analysis based in co-simulation aiming to predict multivariate grade uncertainties.
2.1. Simulation
A turning band co-simulation algorithm using two variables was performed (Matheron, 1973MATHERON, G. The intrinsic random functions and their applications: advances in applied probability, v. 5, p. 439-468, 1973.; Journel, 1974JOURNEL, A. G. Geostatistics for conditional simulation of ore bodies. Economic Geology, v. 69, n. 5, p. 673-687, 1974.). A full description of this method can be found in Chilès and Delfiner (1999)CHILÈS, J. P., DELFINER, P. Geostatistics: modeling spatial uncertainty. New York: Wiley, , 1999. 695p.. For the deposit under study, co-simulation was performed to maintain the ratio CaO/P2O5 (RCP) which is used as a criterion for classifying a block as ore or waste. Furthermore, this ratio influences the performance at the mineral processing plant, interfering in ore flotation. Fifty simulated scenarios for P2O5 and CaO grades were generated, allowing for the prediction of grade uncertainties at each geologic domain, presented in the case study section.
In turning band simulation, the idea is to derive a value from a distribution based on the associated multigaussian random functions theory. The multigaussian model assumes, among other things, that for an attribute whose distribution of values presents a standard normal histogram, any combination of values of this attribute has a normal distribution. The cumulative local conditional distribution of probability is estimated by simple kriging, which defines the mean and variance of the distribution. Journel and Huijbregts (1978)JOURNEL, A. G., HUIJBREGTS, C. J. Mining geostatistics. London: Academic Press, , 1978. 600 p. describe in detail the theoretical concepts about the multigaussian model.
The use of the multi-Gaussian model to construct the normal distributions assumes that the attribute under study is standardly normal. However, in the majority of cases in geosciences, the original experimental distribution does not present a multi-Gaussian behavior. Thus, the experimental distribution of n information z (uα) (α = 1, ..., n) is transformed into a distribution of n values y (uα) (α = 1, ..., n) of normal transformation (Goovaerts, 1997GOOVAERTS, P. Geostatistics for natural resource evaluation. New York: Oxford University Press, 1997. 483p.).
Transforming the data into the Gaussian space does not guarantee that the data is a random, multi-normal function. This procedure only guarantees the univariate normality of the local conditional probability distribution and it is necessary to verify the normality. When the bi-normality is verified, through verification procedures, the hypothesis of the Gaussian multivariate model is assumed to be valid. The relationship between madogram (Euclidean) and the square root of the variogram will be used as verification procedure. Equation 1 presents this relationship whose result must approximate the constant 0.564 and must be verified for several distances h (lags), in the defined u-locations, where:
γ1(h) = E{| Y(u+h) - Y(u) |} is the madogram definition;
γ2(h) = E{| Y(u+h) - Y(u) |}2 is the variogram definition;
2.2 Upscale
Simulation was performed with ore blocks (size 25x25x10 m) discretized into grid nodes 6.25x6.25x5 m apart. Later, the simulated points were block averaged to the original block size of 25x25x10 m to obtain the reference grade model at the block support. Both models (grid nodes and blocks) have the same mean, but the variance is higher for the point-support case for each simulated scenario.
2.3 Mine planning
The definition of the optimum pit is usually carried out by applying the Lerchs and Grossmann (Lerchs & Grossmann, 1965LERCHS, H., GROSSMANN, L. F. Optimum design of open pit mines. Canadian Mining and Metallurgical Bulletin, Montreal, Canada, v. LXVIII, p.17-24, 1965.) or some other optimization algorithm (Kim, 1979KIM, Y. Open pit limit analysis, computer methods for the 80's in the mineral industry, SME-AIME, p. 297-303, 1979.), and applying a revenue factor ranging from 0 to 1 in the profit function (Whittle, 2011WHITTLE, D. Open-pit planning and design. In: DARLING, Peter. Mining Engineering Handbook. (3rd. Ed). Society for Mining, Metallurgy and Exploration (U.S.), p. 877-901, 2011.). This results in a set of nested pits, where the first incremental pit normally contains the most economically attractive ore and is the ore that is covered by the minimum amount of waste. The latest phases contain the least attractive ore, or the ore that is on the liberation sequence after the previous phases, or is even covered by a large amount of waste. At this point there are different methodologies for defining the optimal pit between the family of pits generated by the Lerchs and Grossman algorithm. A methodology that is widely used is sequencing these incremental pits over the years, where the mined blocks follow the order of the nested pits (Kim & Zhao, 1994KIM Y., ZHAO, Y. Optimum open pit production sequencing: the current state of the art. In: Proceedings SME Annual Meeting, Preprint Littleton, p. 94-224, 1994.).
Keep in mind that when the ultimate pit is generated with the E-type model, as is used in most mining industries, it isn't possible to capture all uncertainties derived from the simulations. There are various studies of alternatives to choose an ultimate pit based on stochastic simulations (David et al., (1974)DAVID, M., DOWD, P., KOROBOV, S. Forecasting departure from planning in open pit design and grade control. In: INTERNATIONAL CONFERENCE ON THE APPLICATION OF COMPUTERS AND OPERATIONAL RESEARCH IN THE MINING INDUSTRY (APCOM), 12. In: JOHNSON, T. B, GENTRY, D.W. (Eds.). APCOM CONFERENCE, 12. Colorado School of Mines, 1974. p. F131-F153., Dowd e Sarac (1994)DOWD, P. A., SARAC, C. An extension of the LU decomposition method of simulation. In: GEOSTATISTICAL SIMULATIONS, M. ARMSTRONG, P. A. DOWD, (Eds.). Kluwer, Dordrecht, Netherlands: 1994. p. 23-36., Rossi e Van Brunt (1997)ROSSI, M. E., VAN BRUNT, B. H. Optimizing conditionally simulated orebodies with Whittle 4D. Optimizing with Whittle 97. Perth: Whittle Programming Pty Ltd, 1997. p. 119-128., Farrelly (2002)FARRELLY, C. T. Risk quantification in ore reserve estimation and open pit mine planning. Brisbane: University of Queensland, 2002. 150 p. (MSc Thesis).). However, the aim of this study was to map and choose a schedule with less risk and upside potential gain. So, in this case study, the optimum pit was chosen considering the E-type model.
From this optimum pit, schedule scenarios from each simulated orebody model were generated. The next step to initiate the setting of the block extraction sequence is the generation of operational advances (pushbacks or phases). These are defined as a stage at the mine expansion phase that can be developed in practice and mined according to the sequence extraction observing certain geometric parameters (Peroni, 2002PERONI, R. L. Análise de sensibilidade do sequenciamento de lavra em função da incerteza do modelo geológico. Porto Alegre: Faculdade de Engenharia de Minas, Metalúrgica e de Materiais, Universidade Federal Rio Grande do Sul, 2002. 126 p. (Tese de Doutorado em Engenharia).). To generate the pushbacks, it is necessary to define the access conditions; that is, to determine the minimum distance between an advance and its predecessor. In addition, settings and possible restrictions are defined for the generation of operational phases, presented in Table 1.
After the generation of pushbacks, the parameters for the mining sequence were chosen. The ore mass was defined to be mined per year (6.5 million t) and the primary goal of sequencing, maximizing the NPV. Also, an attempt was made for the strip ratio waste/ore to be kept between 0.5 and 2.0. When it was not possible to achieve these stationary limits, due to the large amount of waste in the early years, this relationship can be attenuated over the years, allowing higher ratios during the initial years of production. For each simulated scenario, the block extraction sequence was generated over the life of the mine. In order to ensure a similarity of conditions for the results generated in all analyzed scenarios, the settings and restrictions are kept constant for all cases. The E-type scenario was also sequenced for the sake of comparison with simulated scenarios.
2.4 Classification index
Based on Dimiktrakopoulos et al. (2007), a classification index was proposed so that it is possible to determine a mining scheduling scenario based on the mapping of geological uncertainties, using stochastic simulation to quantify the risk of loss or opportunity for gain as the net present value initially planned for each scenario. The index is used to define the final schedule scenario, considering the distributions of possible project indicator values for the calculation of upside potential and downside risk applied to a reference point (for example, the minimum acceptable return - MAR). It is called downside risk, when the objective is to analyze the risk of loss and upside potential, when analyzing the possibility of gain associated with the project. The index is essentially based on the grades distribution analysis of each sequenced scenario from a pre-defined final pit according to the one used in the mining industry, obtained from the kriging model. Thus, it has been possible to analyze the NPV (key indicator project) values for each scenario. Equations 2 and 3 present the index that allows quantification of the upside potential and the downside risk, respectively:
where i is the simulation number, n is the total number of simulations, IC+ is the classification index for the potential return to be equal to or greater than the minimum acceptable return value; IC- is the classification index for the downside risk of achieving a return lower than the minimum acceptable return value; Xi: average of annual NPV value for simulations; Vm: minimum expected value defined; Pi: probability of Xi value being greater than the MAR value; CI: indicator that defines if Xi value is within the confidence interval of 90%, between percentile 5 and 95; R+: probability defined by the number of observations above the Vm; R-: probability defined by the number of observations below the Vm. where i is the simulation number, n is the total number of simulations, IC+ is the classification index for the potential return to be equal to or greater than the minimum acceptable return value; IC- is the classification index for the downside risk of achieving a return lower than the minimum acceptable return value; Xi: average of annual NPV value for simulations; Vm: minimum expected value defined; Pi: probability of Xi value being greater than the MAR value; CI: indicator that defines if Xi value is within the confidence interval of 90%, between percentile 5 and 95; R+: probability defined by the number of observations above the Vm; R-: probability defined by the number of observations below the Vm.
3. Case study
3.1 Dataset
A phosphate deposit with two main geostatistical domains (bebedourite and phoscorite) was used herein. The dataset contains 3722 samples from the bebedourite and 2136 samples from the phoscorite domains.
With these samples, a declustering was performed using the moving window cell technique (Isaaks and Srivastava, 1989ISAAKS, E. H., SRIVASTAVA, R. M. An introduction to applied geostatistics. New York: Oxford University Press, 1989. 547 p.). Next, an analysis was performed on the presence of extreme values, applying an upper cut for limiting the P2O5 and CaO variables. Finally, the method for choosing the upper limit value was taken from the cumulative probability plot graphs with the data bonded by the quantile 99. Table 2 shows the statistics for both domains considered for the original dataset and the samples with top capping applied.
The ratio between P2O5 and CaO is extremely important to predict the flotation yield. The correlation between these two variables was taken into account for both domains using co-simulation. Figure 2 shows the correlation coefficient at the bebedourite domain (0.42) and at the phoscorite (0.93). Note that there is a different CaO behavior for samples near to zero, showing no correlation with the attributes of P2O5. This fact is possibly due to a mixture of the CaO population values as well as laterization processes occurring within the bebedourite domain.
As can be seen in the figure above, the CaO attribute has the presence of two populations for both the bebedourite and the phoscorite domains. These near zero CaO samples do not form a divisible domain, due to the spatial arrangement of the samples present in each population and formation of a possible intern dilution within the orebody.
3.2 Spatial Continuity
For both geologic domains, the turning band co-simulation (Matheron, 1973MATHERON, G. The intrinsic random functions and their applications: advances in applied probability, v. 5, p. 439-468, 1973.; Journel, 1974JOURNEL, A. G. Geostatistics for conditional simulation of ore bodies. Economic Geology, v. 69, n. 5, p. 673-687, 1974.) method was used, and it was necessary to model direct and crossed correlograms/variograms for the variables of interest (P2O5 and CaO) in the original data and in the normal space. The two spherical structures were used to fit the experimental correlograms/variograms. The direct and cross correlogram equations for the original data at the bebedourite domain, as well as those for the direct and cross variogram equations at the phoscorite domain for P2O5 and CaO, are shown in Table 3:
The validation of the multi-Gaussian data transformation was done considering Equation 1 for P2O5 and CaO variables in both geological domains. The ratio was made from the omnidirectional variograms, using lags of 200 meters. The variable P2O5 and CaO for the bebedourite and phoscorite domain converged at 0.564, validating the data transformation into the normal space.
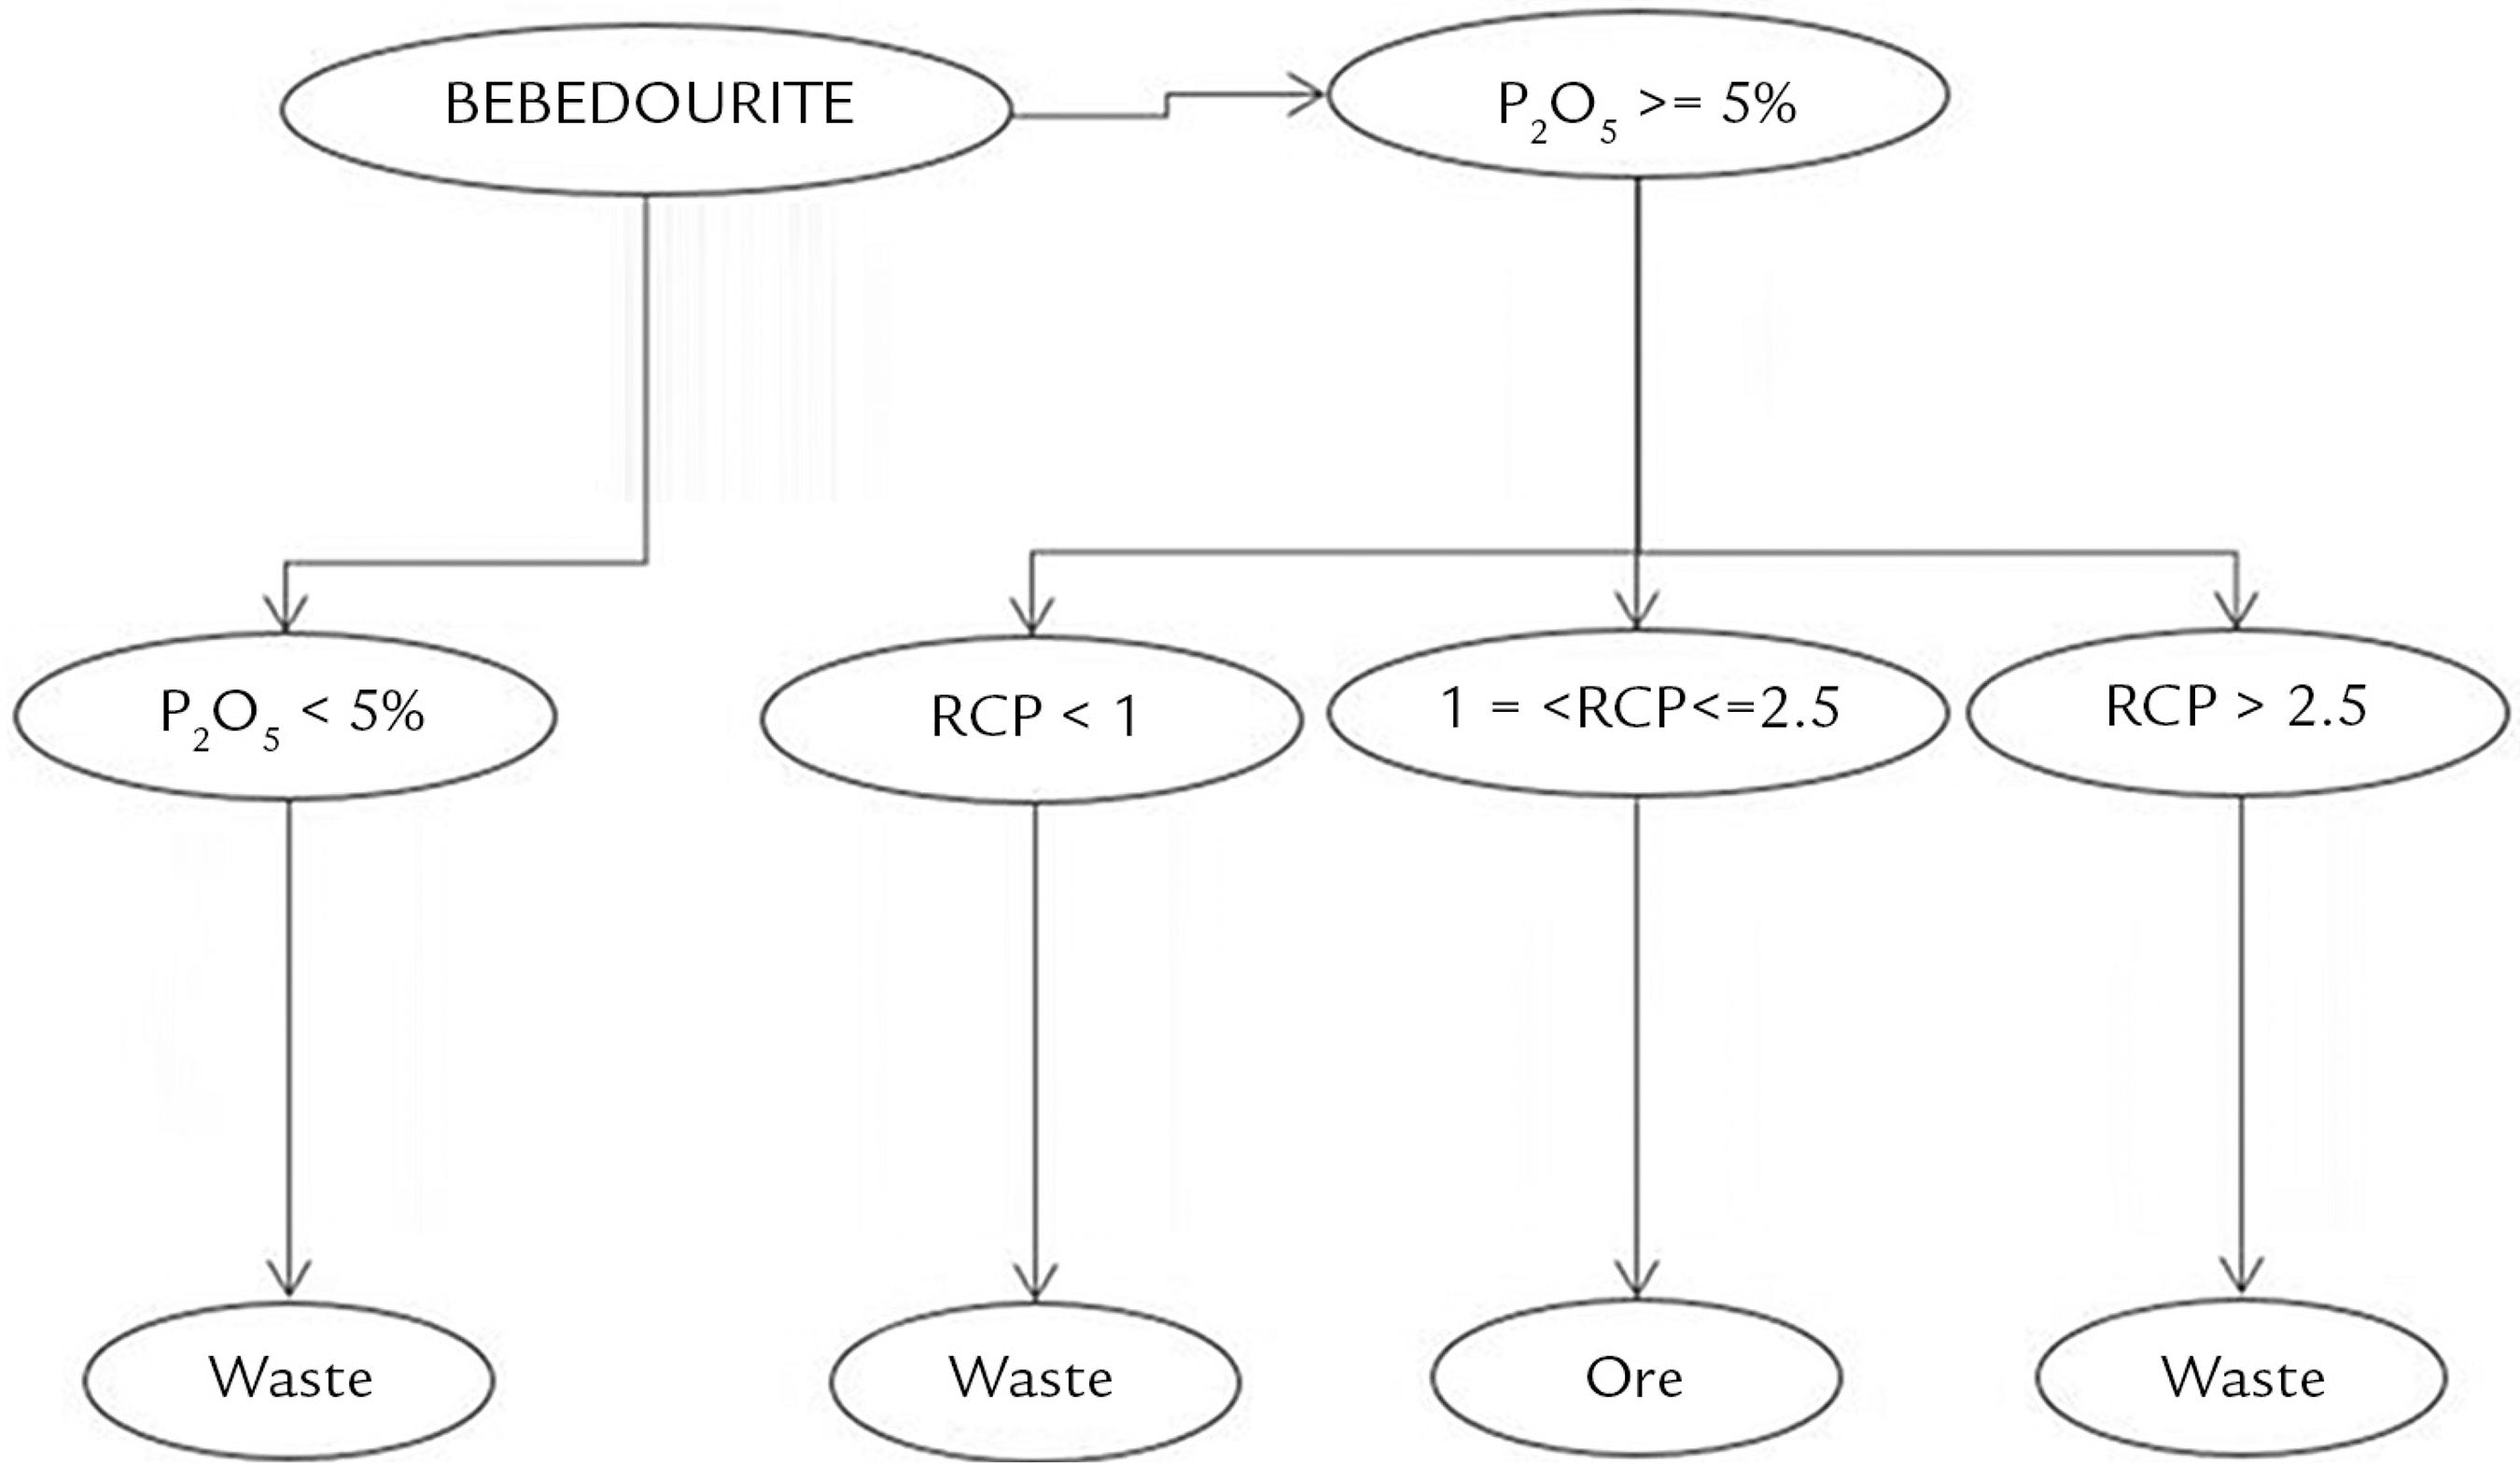
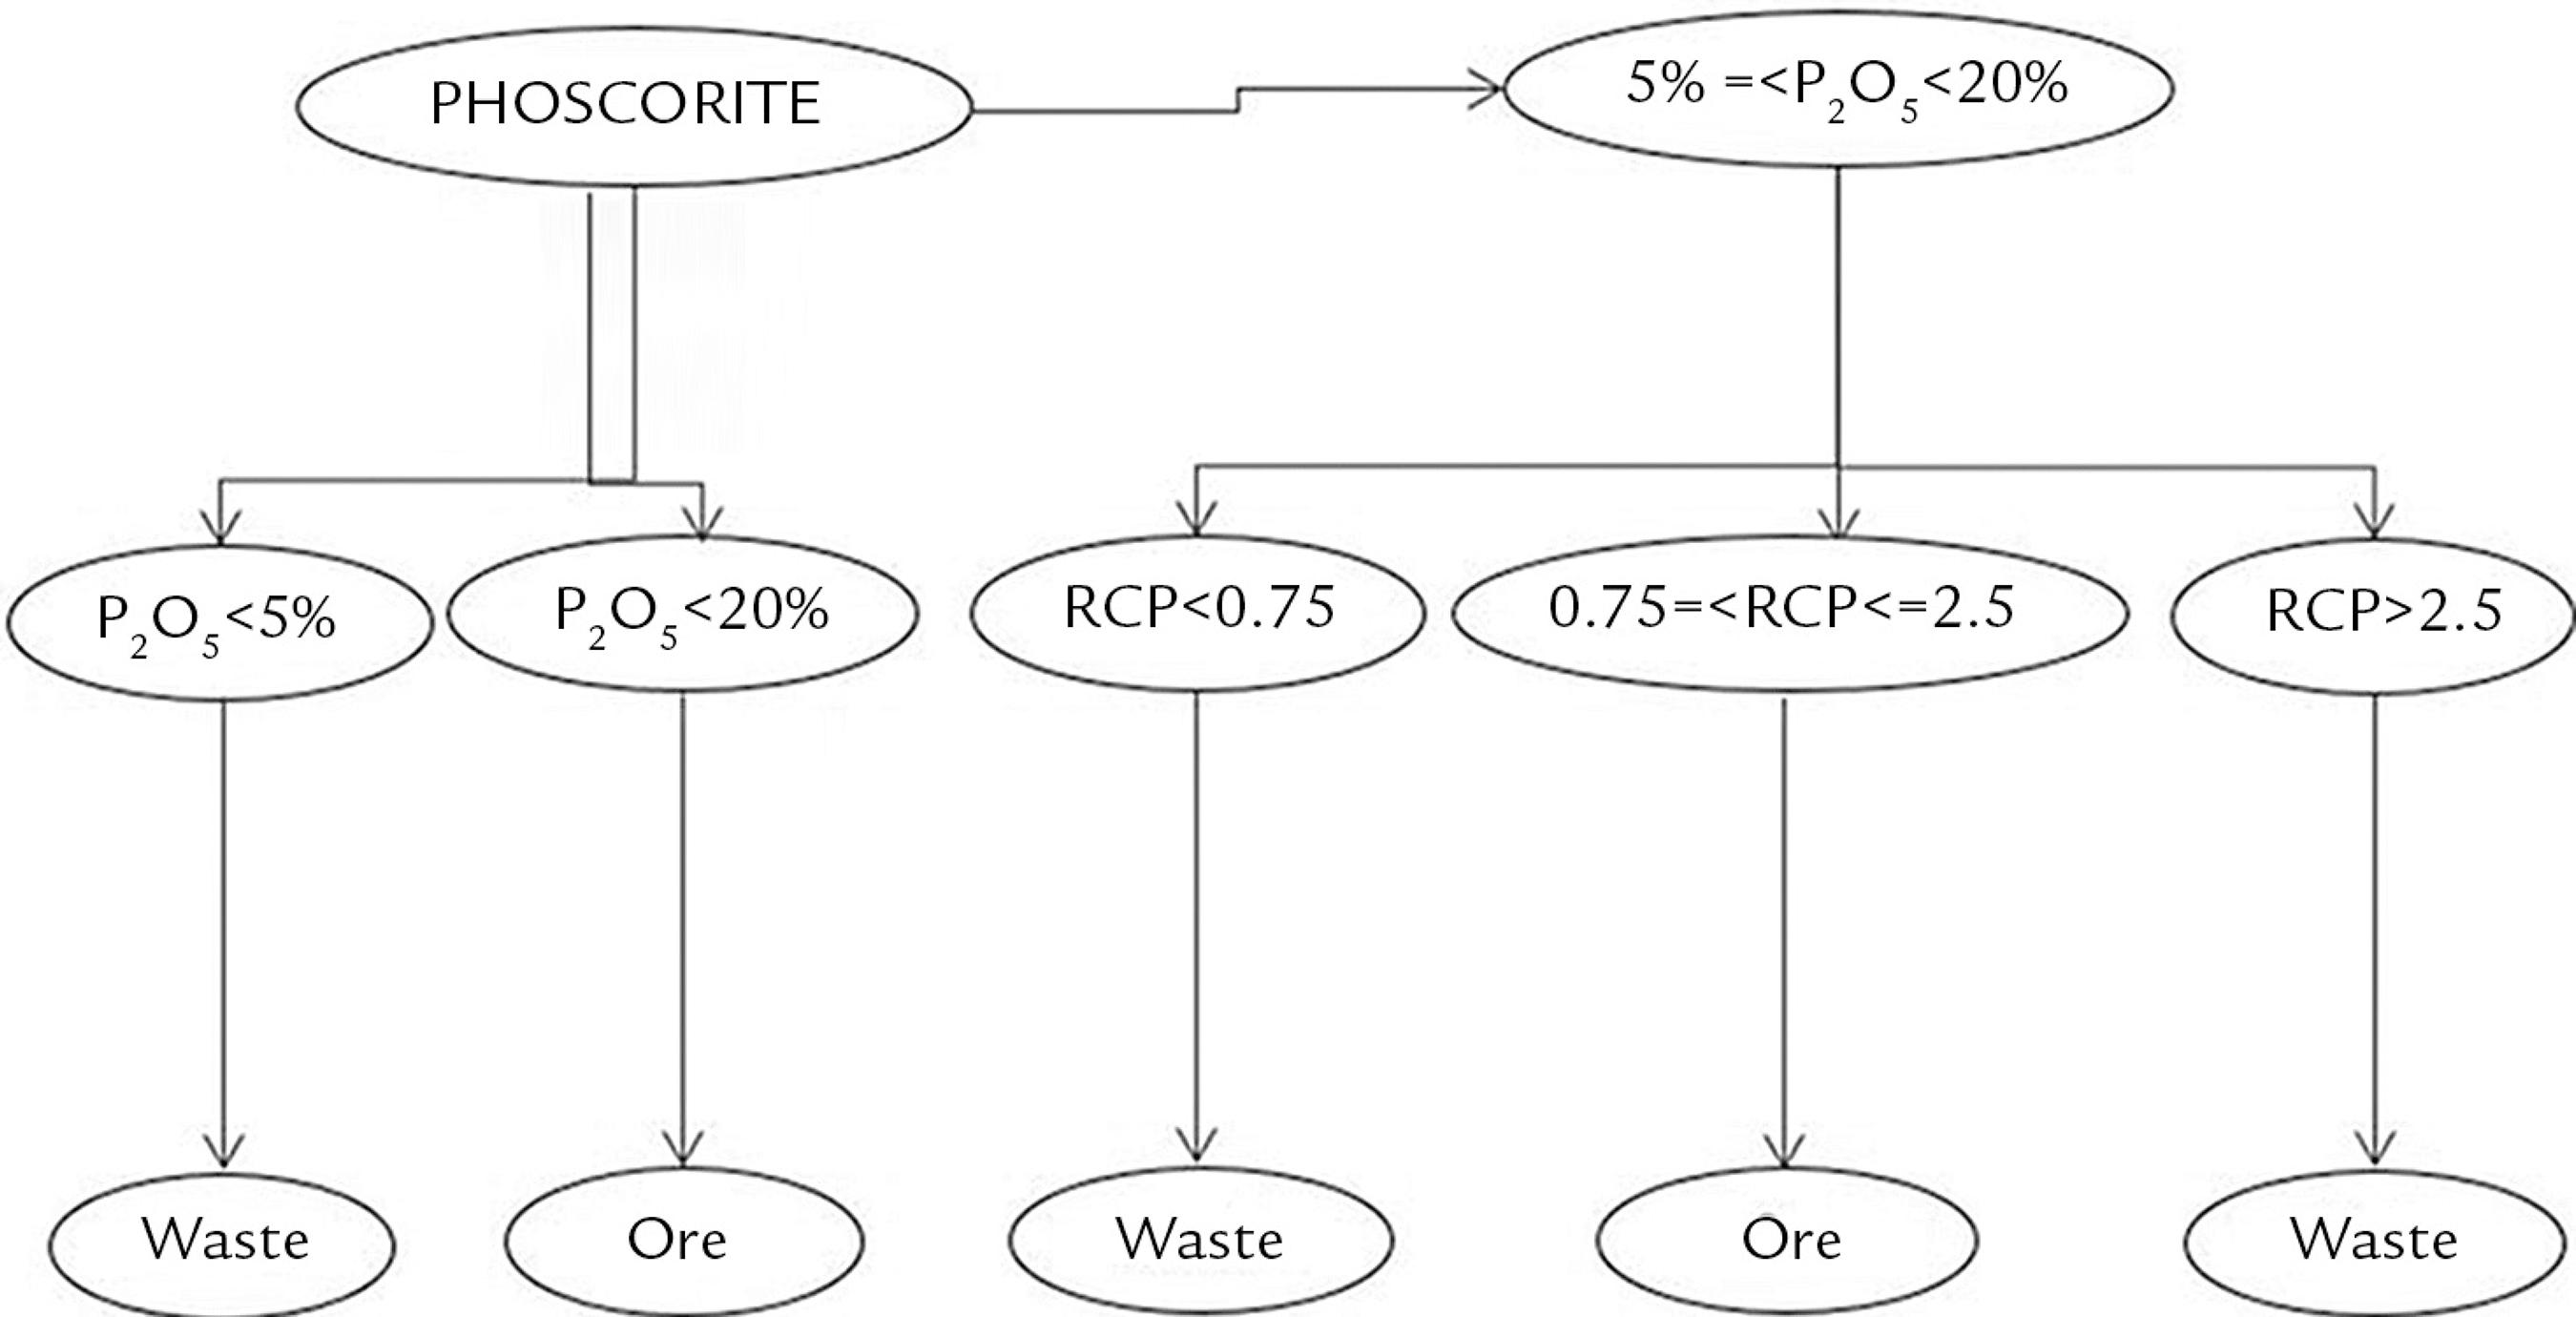
3.3 Ore/waste definition
The criteria used for defining ore and waste is based on P2O5 grades and on the calcium/phosphate (CPR) ratio. Figures 3 and 4 show the workflow applied for ore and waste classification at the two domains, i.e. bebedourite and phoscorite.
3.4 Profit model
Next, each grade model simulated was considered as an input for mine planning, assigning an economic result for each simulation. The profit model applied varies from the block classification as ore, marginal ore, or waste. For the waste blocks, the profit function represents only the cost to mine of that block. For ore blocks, in addition to all associated costs, all revenues are added from the mineral sales. The results of the profit model were calculated from the sales price (BRL/ton) and the products (defined as tons of products generated in the block). For this purpose, a mass recovery is considered in relation to P2O5 grades for the two products generated, the conventional concentrate and the ultrafine concentrate. The sales price is the customary one in the industry for long-term studies for this type of mineral deposit. For the calculation of revenues, all parameters used in the industry were considered, which will not be mentioned in detail in order to guarantee the confidentiality of company data.
For the issue of mining costs, the average transport distance was different in the benefit function of each domain. The costs considered are excavation and transportation, support equipment, drilling and dismantling, mine management custody, processing plant, transport, current investment, head of the chemical industry. From this stage, the economic model was used for the definition of pushbacks, and the mining sequencing using a predefined final pit. The main objective was to present the impact of mining planning of the geological uncertainty obtained in the variation of the P2O5 contents using stochastic simulation.
3.5 Final pit and life of mine scheduling
The final pit was chosen based on the E-type grade model, i.e., the pit was kept the same for all grade models simulated. The mine scheduling for the E-type model was compared against the scheduling derived from the simulations scenarios.
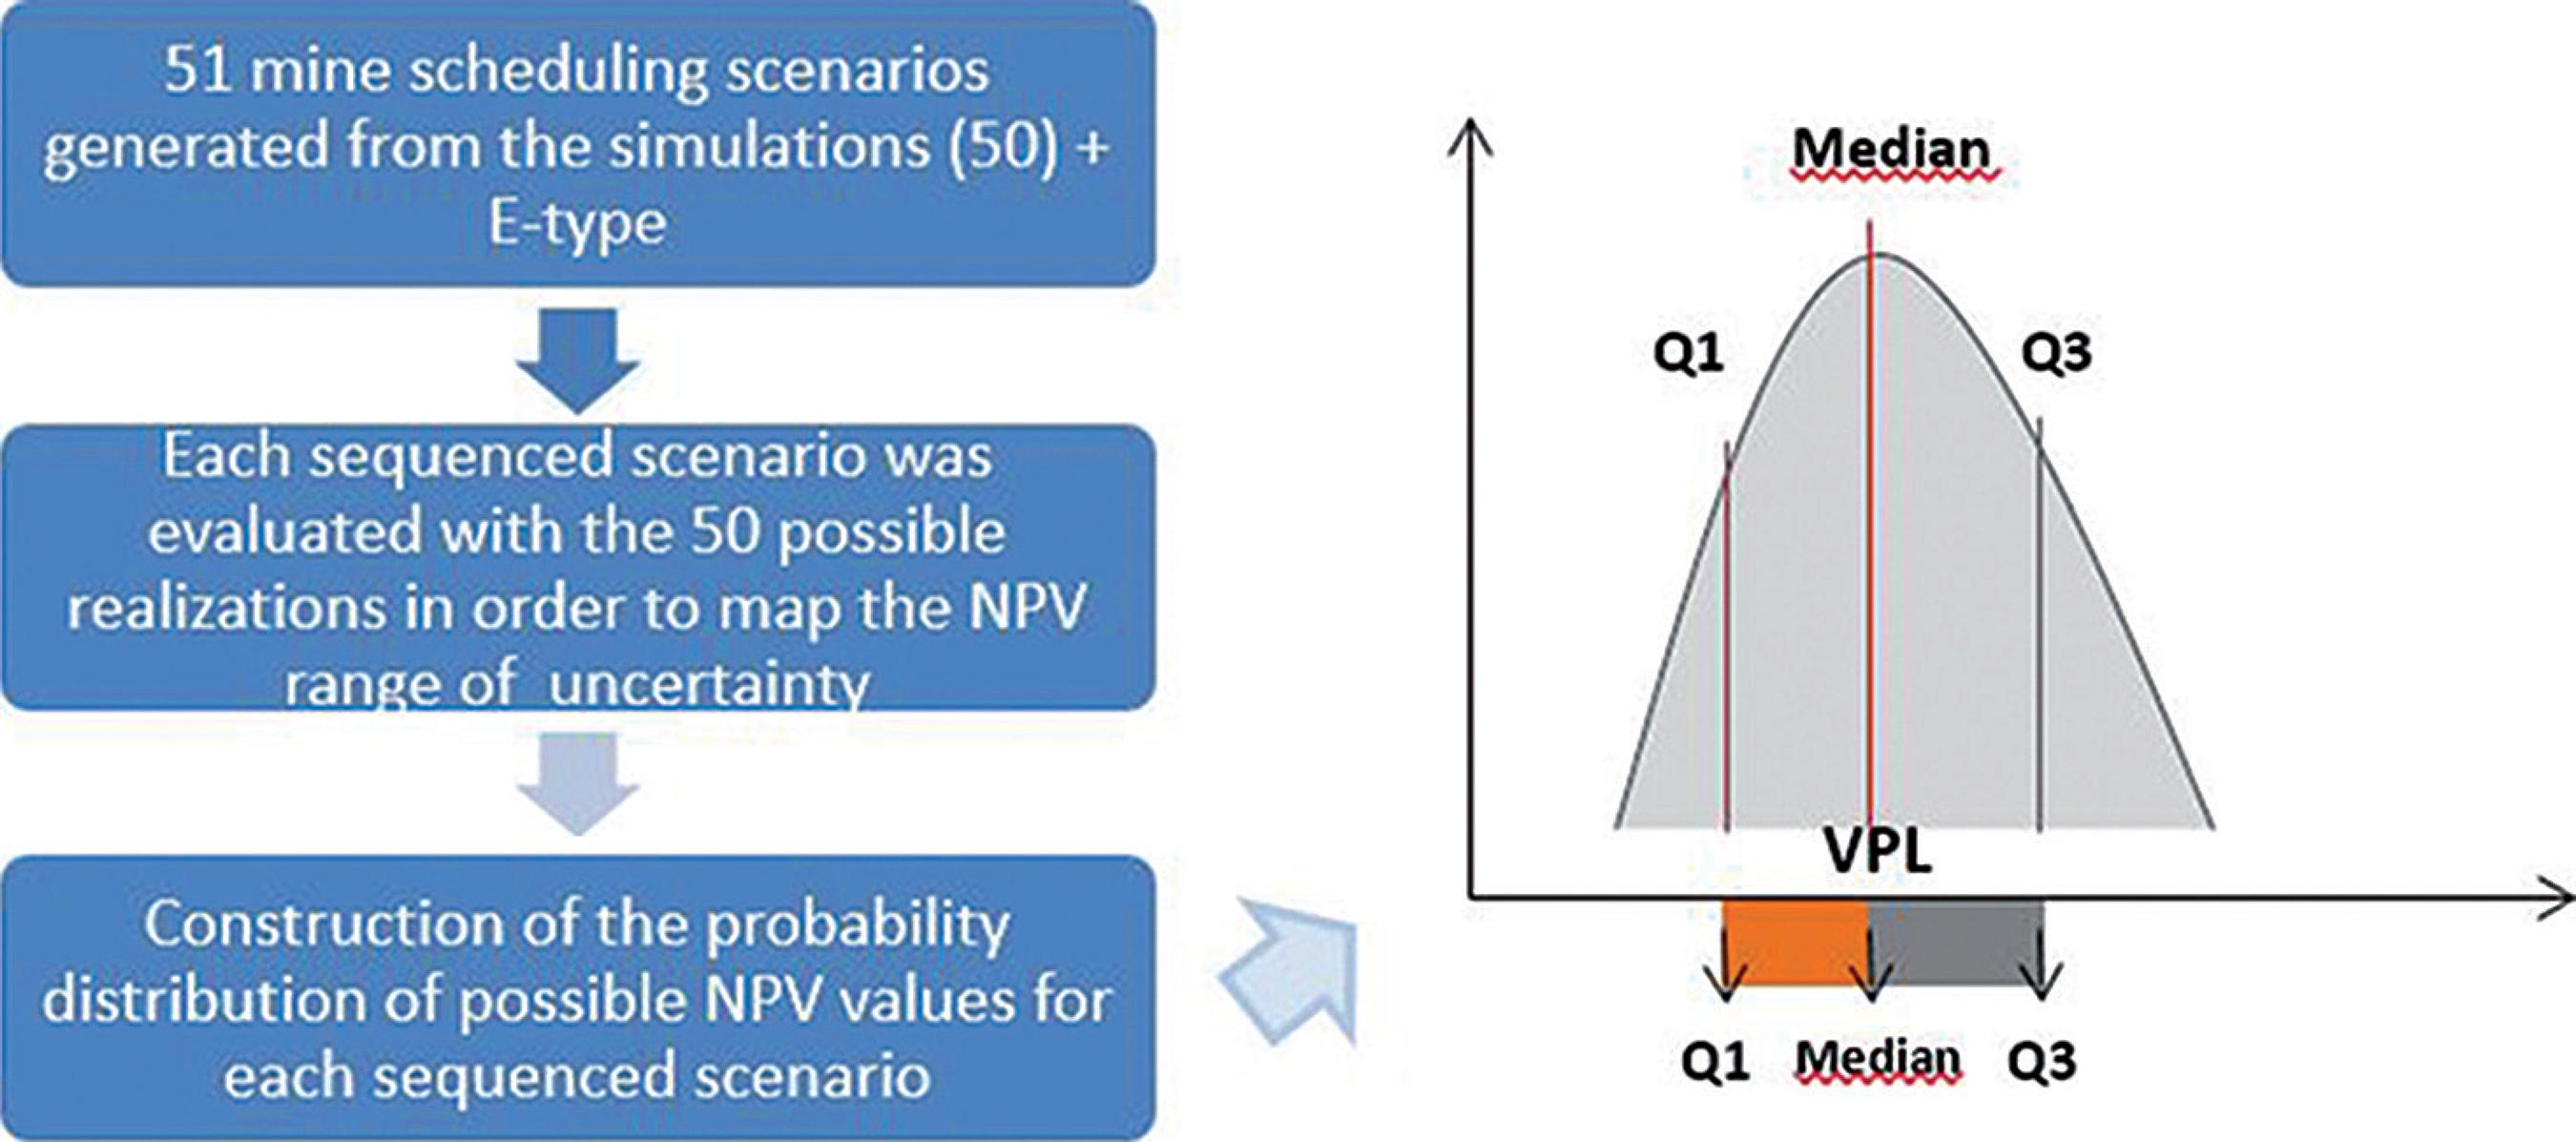
3.6 Scenario construction
Figure 5 shows a schematic representation used to construct the probability distributions for each mining sequencing scenario obtained.
Methodology used to construct the probability distribution for each mining sequencing scenario. Q1 and Q3 represent the upper and lower quartiles respectively
4. Results
4.1 Validation of simulations
Cumulative histograms, direct and cross correlograms/variograms and correlation matrix were some of the checks used in the validation of the simulations. In all cases, the simulation models satisfactorily reproduce the distribution of the original data.
4.2 Mine scheduling
Table 4 shows a comparison between the simulated models and the E-type model considering the life of the mine plan (LOM). The same input parameters were used and the production rate was configured as in the E-type model. Note that the E-type model overestimates the LOM, due to the smoothing degree it models for the CPR that is ultimately used for block classification as ore or waste. In addition, the NPV obtained for this model is, in general, smaller than all the NPVs obtained for the simulated scenarios. It was expected that since the E-type model has more ore blocks due to the CPR smoothness, the NPV would be higher when compared to the other scenarios. However, this is not observed in the results. This can be explained, because although there are more ore blocks, the grades are smoother leading to less high-grade blocks, resulting in lower monetary gains.
Figure 6 shows a graph quantifying the possible ore blocks for each scenario (simulated and E-type). For this, the graph was constructed considering all the blocks with a content of P2O5 greater or equal to 5% and classified according to the CPR that varies from 0.5 to 2.5. It is possible to verify that there are more blocks classified as ore for the E-type scenario (red line) due to the smoothing of the contents for both variables, resulting in a higher percentage of CPR values within the considered range of ore classification, repeating what was seen in Table 3.
Reserves as a function of different CPR values. Red line for the E-type, black lines for multiple simulations
4.3 Scenario analysis
Figure 7 shows the NPV values of 50 simulations plotted for each mining sequence selected. The results are in boxplot format highlighting the minimum value, first quartile, second quartile (median), third quartile, and maximum value. Thus, it is possible to visualize the dispersion of the data around the center. From the distributions, a minimum value for the first quartile was set at 15 billion reais for the NPV as the first criterion to choose among all possible scenarios, i.e., the boxplot orange bar should be higher than 15 billion reais in the vertical axis of the graph. This value was defined as the minimum return value that an investor expects to obtain with this project. With this, many scenarios are already eliminated, and their ratings are not necessary for classification, as can be seen in the figure below. After evaluating which scenarios reached the minimum established goal, 5 out of the 50 scenarios were chosen to continue with the methodological process until a single scenario of mining sequencing is selected. The scenarios chosen are circled and are the marked as number 4, 13, 25, 34, and 39.
After the evaluation of the possible NPV values for each generated mining sequence, it is necessary to quantify the risk due to grade uncertainty for each scenario. This was accomplished through the definition of the sequence which maximizes the earning potential and reduces the risk to achieve the established economic goal. For this, the classification index was used.
Figures 8 and 9 present the result of the index considering the benefit and the NPV, respectively, for the five scenarios analyzed, with their associated gains and losses. Note that the higher the value obtained for down, i.e., the closer to zero, the lower the risk. For up, the higher the value, the greater the potential economic gain. Analyzing the graphs above, it is verified that considering the benefit of the blocks mined annually along the mine, the number 4 sequence looks more advantageous, since it has a lower associated risk and a potential gain almost equal to the highest value obtained. When analyzing the NPV, it is also verified that the number 4 sequence is the most advantageous, for the same reasons.
Index calculated for the benefit of blocks mined annually over the life of the mine. The 'down' represents the potential risk of loss and 'up' the potential risk of economic gain
Index calculated for the NPV of blocks mined annually over the life of the mine. The 'down' represents the potential risk of loss and 'up' the potential risk of economic gain
5. Conclusion
Definition of an alternative to the traditional mine planning and scheduling methodology used in industry showed better results when decision making is done under grade uncertainty, through the analysis of the NPV for the chosen scenario. E-type or kriged models are known as a smoothed model, unable to provide the real variability and the spatial continuity of the phenomenon. When basing the mining plan and subsequent steps on a smoothed model, itsproduces considerable errors that are visible at the end of the project. Using a model with a probabilistic analysis, controllable risks (except political and social) can be mapped in advance making the mining project effective and reliable. The analyses presented herein were performed using long-term sequencing. Thus, we have an overall idea of the difference between the use of a medium level scenario and when using simulated models for the performance of mining planning, showing the importance of using simulated scenarios to plan the life of the mine.
References
- CHILÈS, J. P., DELFINER, P. Geostatistics: modeling spatial uncertainty. New York: Wiley, , 1999. 695p.
- DAVID, M., DOWD, P., KOROBOV, S. Forecasting departure from planning in open pit design and grade control. In: INTERNATIONAL CONFERENCE ON THE APPLICATION OF COMPUTERS AND OPERATIONAL RESEARCH IN THE MINING INDUSTRY (APCOM), 12. In: JOHNSON, T. B, GENTRY, D.W. (Eds.). APCOM CONFERENCE, 12. Colorado School of Mines, 1974. p. F131-F153.
- DIEDRICH, C. Incorporação da variabilidade dos teores para análise de risco de recursos minerais e sequenciamento de lavra Porto Alegre: Faculdade de Engenharia de Minas, Metalúrgica e de Materiais, Universidade Federal Rio Grande do Sul, 2012. 188 p. (Dissertação de Mestrado em Engenharia).
- DIMITRAKOPOULOS, R., FARRELLY, C. T., GODOY, M. C. Moving forward from traditional optimisation: grade uncertainty and risk effects in open pit mine design. Mining Technology, v. 111, Issue 1, p. 82-89, 2002.
- DIMITRAKOPOULOS, R., RAMAZAN, S. Uncertainty based production scheduling in open pit mining. SME Transactions, v. 316, p. 106-112, 2004.
- DIMITRAKOPOULOS, R., MARTINEZ, L., RAMAZAN, S. A maximum upside/minimum downside approach to the traditional optimization of open pit mine desgin. Journal of Mining Science, v. 43. p. 73-82, 2007.
- DOWD, P. A., SARAC, C. An extension of the LU decomposition method of simulation. In: GEOSTATISTICAL SIMULATIONS, M. ARMSTRONG, P. A. DOWD, (Eds.). Kluwer, Dordrecht, Netherlands: 1994. p. 23-36.
- FARRELLY, C. T. Risk quantification in ore reserve estimation and open pit mine planning Brisbane: University of Queensland, 2002. 150 p. (MSc Thesis).
- GODOY, M. C. Minimização de perdas em operações de lavra seletiva incorporando a incerteza da estimativa no controle de teores Porto Alegre: Faculdade de Engenharia de Minas, Metalúrgica e de Materiais, Universidade Federal Rio Grande do Sul, 1998. 91 p. (Dissertação de Mestrado em Engenharia).
- GODOY, M. C., DIMITRAKOPOULOS, R. Managing risk and waste mining in long-term production scheduling. SME Transactions, v. 316, p. 43-50, 2004.
- GOOVAERTS, P. Geostatistics for natural resource evaluation New York: Oxford University Press, 1997. 483p.
- ISAAKS, E. H., SRIVASTAVA, R. M. An introduction to applied geostatistics New York: Oxford University Press, 1989. 547 p.
- JOURNEL, A. G. Geostatistics for conditional simulation of ore bodies. Economic Geology, v. 69, n. 5, p. 673-687, 1974.
- JOURNEL, A. G., HUIJBREGTS, C. J. Mining geostatistics London: Academic Press, , 1978. 600 p.
- JOURNEL, A. G., KYRIAKIDIS, P. Evaluation of mineral reserves, a simulation approach Oxford University Press, 2004. 216 p.
- KIM, Y. Open pit limit analysis, computer methods for the 80's in the mineral industry, SME-AIME, p. 297-303, 1979.
- KIM Y., ZHAO, Y. Optimum open pit production sequencing: the current state of the art. In: Proceedings SME Annual Meeting, Preprint Littleton, p. 94-224, 1994.
- LERCHS, H., GROSSMANN, L. F. Optimum design of open pit mines. Canadian Mining and Metallurgical Bulletin, Montreal, Canada, v. LXVIII, p.17-24, 1965.
- MATHERON, G. The intrinsic random functions and their applications: advances in applied probability, v. 5, p. 439-468, 1973.
- PERONI, R. L. Análise de sensibilidade do sequenciamento de lavra em função da incerteza do modelo geológico Porto Alegre: Faculdade de Engenharia de Minas, Metalúrgica e de Materiais, Universidade Federal Rio Grande do Sul, 2002. 126 p. (Tese de Doutorado em Engenharia).
- RAMAZAN, S., DIMITRAKOPOULOS, R. Stochastic optimization of long-term production scheduling for open pit mines with a new integer programming formulation. In: Orebody Modelling and Strategic Mine planning. (2nd Ed.). The Australian Institute of Mining and Metallurgy, v. 14, p. 385-392, 1997.
- RAVENSCROFT, P. J. Conditional simulation for mining: practical implementation in an industrial environment. In: ARMSTRONG, M., DOWD, P. A. (Eds.). Proceedings geostatistical simulations Kluwer Academic Publishers, p. 147-177, 1993.
- ROSSI, M. E., VAN BRUNT, B. H. Optimizing conditionally simulated orebodies with Whittle 4D. Optimizing with Whittle 97. Perth: Whittle Programming Pty Ltd, 1997. p. 119-128.
- WHITTLE, D. Open-pit planning and design. In: DARLING, Peter. Mining Engineering Handbook (3rd. Ed). Society for Mining, Metallurgy and Exploration (U.S.), p. 877-901, 2011.
Publication Dates
-
Publication in this collection
Apr-Jun 2019
History
-
Received
18 Aug 2018 -
Accepted
29 Oct 2018