 Prediction of load transfer curves for single piles executed in granular soil profiles from field test measurements
Abstract
The load transfer methods are important tools for predicting the behavior of the load-displacement curve for piles. Several studies indicate that these curves in single piles can be well represented by hyperbolic functions. In this context, this research aims to predict the load transfer curves in single piles using hyperbolic functions based on easily obtainable parameters and measurements. For this purpose, data from 48 instrumented single piles (driven and bored), executed in granular soil profiles and subjected to static load tests were collected, obtaining the parameters of hyperbolic curves that define the t-z and q-z load transfer curves. Correlations of the parameters of the hyperbolic curves with measurements from cone penetration tests (CPT) or standard penetration tests (SPT), pile geometry, initial geostatic stresses, and deformation parameters of the load transfer curves were performed. Validation indicated results converging to the proposed predictions, and in general, predictions based on CPT measurements, and using deformation parameters Ms and Mb showed more convergent results.
Keywords:
load transfer methods; single pile; field tests; granular soils; hyperbolic functions.
1. Introduction
Pile foundations are engineering solutions widely used in civil engineering projects. The type of pile is chosen according to technical characteristics, economic factors, and specificities of each project. In general, piles are arranged in groups and must be designed to ensure safety against the failure of the soil-foundation system and to avoid excessive settlements. The load transfer mechanism from the pile to the soil occurs through the shaft, by means of lateral friction, and through the pile tip. This mechanism varies depending on the type of soil and pile installation procedures.
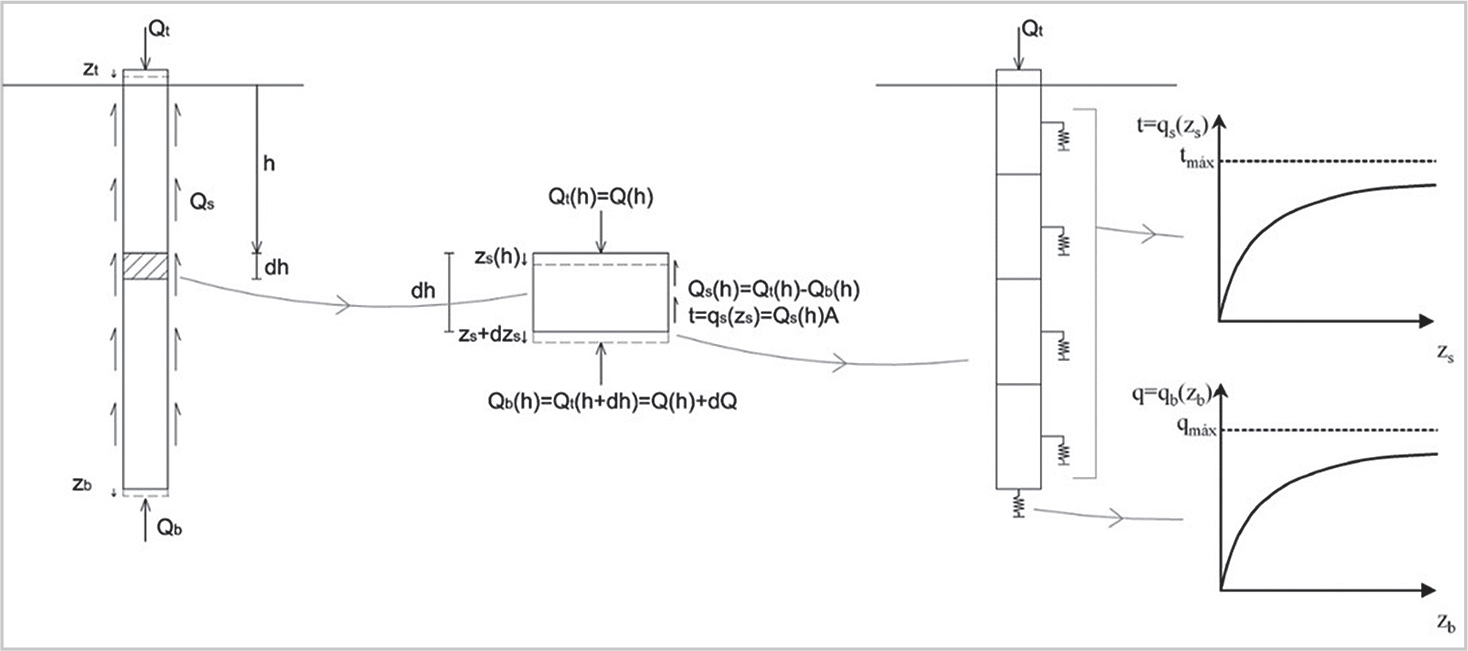
In this context, load transfer methods are techniques for predicting the behavior of piles. They employ models that attempt to represent the distribution of load applied to the pile of soil, through a discretization of the pile into segments supported by nonlinear springs. The behavior of the nonlinear springs is determined by the load transfer curves, or t-z and q-z curves, which are associated with the mobilization of resistance to lateral friction and tip, respectively, relative to displacement in the corresponding segment. Figure 1 illustrates the nonlinear spring model based on an element of length dh and the discretized model of the pile in segments supported by springs.
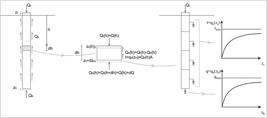
Load transfer method with representation of the pile segment, acting forces and displacements, and nonlinear spring model.
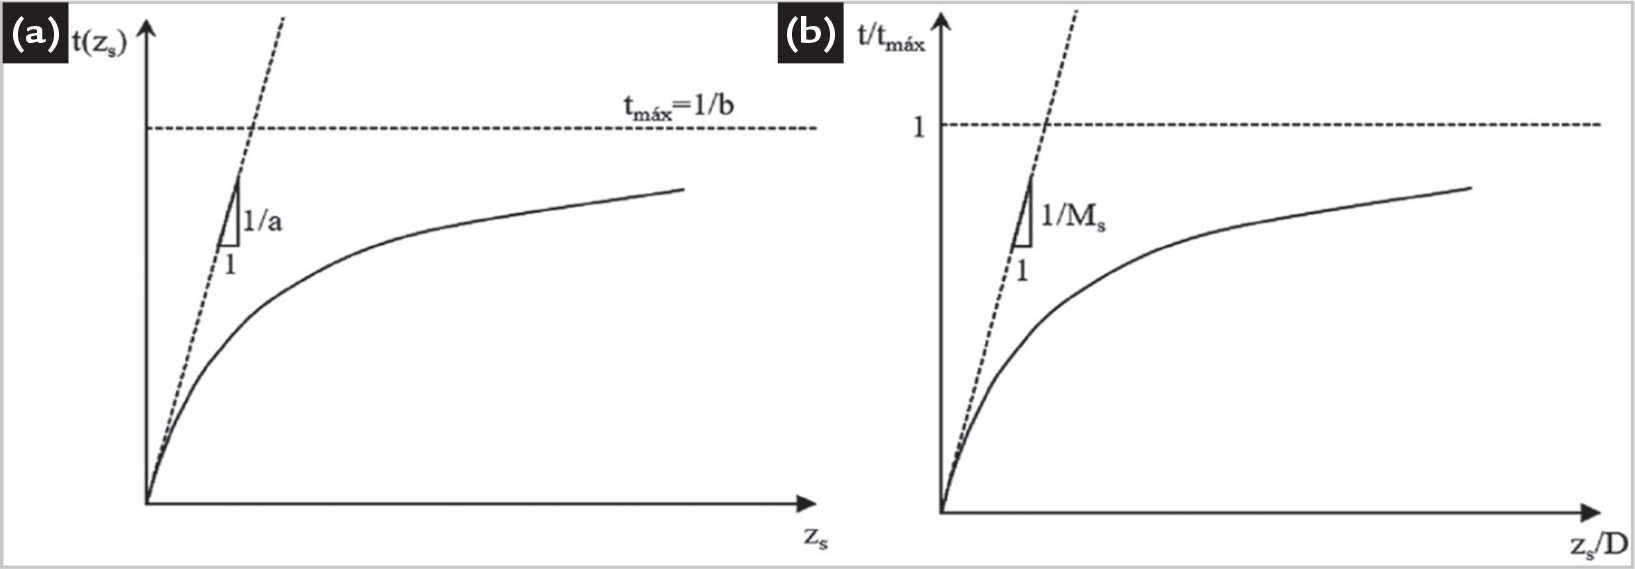
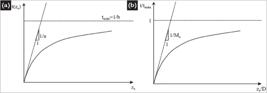
Several studies presented in literature indicate that load transfer curves in single piles can be represented by hyperbolic functions, among which are Fleming (1992), Liu et al. (2004), Zhang et al. (2014), and Bohn et al. (2016). Hyperbolic curves can be described by two parameters, one related to the initial stiffness of the curve and the other related to the curve's asymptote. Thus, Figure 2a presents the hyperbolic curve parameters, a and b, according to Zhang and Zhang (2012), for the t-z curve. Figure 2b presents the deformation parameter M, Ms for the t-z curve, based on the normalized curve, as presented by Bohn et al. (2016). It is worth noting that parameters a and M are related to the initial stiffness of the curve, and parameter b to the maximum mobilized resistance value (asymptote).
Zhang et al. (2014) used a simplified methodology for the nonlinear analysis of load transfer curves based on a hyperbolic function model. From the results of 19 load tests on instrumented piles, Zhang et al. (2014) found that the hyperbolic model can be used to represent normalized t-z and q-z curves by mobilized ultimate resistance parameters and pile displacement, tu and zs,u, respectively, regardless of subsurface characteristics and loading conditions, with approximate R2 values ranging from 0.81 to 0.84. Zhang et al. (2014) suggests using the analytical solution proposed by Randolph and Wroth (1979) to calculate parameters associated with the initial stiffness of load transfer curves, which, it is worth noting, is a function of the soil's shear modulus (Gs), which in turn is a function of soil deformations.
Furthermore, in analytical approaches, it is common to determine tmáx (maximum resistance mobilized by lateral friction) based on formulas using soil parameters obtained from laboratory and field tests or through the effective stress method based on Coulomb's friction law (Equation 1), which can be rewritten according to Yang et al. (2006) as Equation 2. As for the calculation of qmáx (maximum resistance mobilized by the pile tip), Zhang et al. (2014) suggests that this can be determined from the soil's friction angle and the increase in vertical effective stress at the pile base.
where K is the coefficient of lateral pressure, σv' is the increment of vertical effective stress, δ is the friction angle of the pile-soil interface, K0 is the coefficient of earth pressure at rest, and φ' is the internal friction angle of the surrounding soil.
In terms of simplified solutions for predicting t-z and q-z curves, Bezerra et al. (2021) compared settlement predictions obtained using the load transfer method by Coyle and Reese (1966) and through the Cambefort Laws modified by Massad (1992) using experimental results from a bored pile in a typical granular soil in Fortaleza, Ceará. For the load transfer method, Bezerra et al. (2021) adopted different calculation methodologies to obtain the soil modulus of elasticity and to define the load transfer curves proposed by the American Petroleum Institute (API). The soil modulus of elasticity was estimated through the correlation of Teixeira and Godoy (1996) and from the results of triaxial compression tests. As for defining the load transfer curves according to API (2007), these were estimated based on results from standard penetration tests (SPT), triaxial compression tests, and direct shear tests. The predictions made showed reasonable agreement in the elastic zone of soil behavior for all methodologies, and among the methodologies used in the Coyle and Reese method (1966) for the working load. The parameters obtained from the triaxial tests were the most convergent with the experimental results.
Bohn et al. (2016) analyzed the behavior of load transfer curves in piles based on experimental studies and formulations available in literature, using models of hyperbolic and cubic root functions for predicting t-z and q-z curves. The calibration of the parameters of the hyperbolic and cubic root load transfer curves was carried out based on data from 50 instrumented piles and validated against proposals from another 72 piles, not necessarily instrumented, with ultimate resistances estimated from the cone penetration test (CPT) and pressuremeter test (PMT) results. Specifically, regarding the hyperbolic curves, Bohn et al. (2016) calibrated the values of the parameter M, referred to as Ms and Mb (associated with the pile shaft and tip, respectively), obtaining values for the parameter M based solely on the type of soil and pile construction method.
Gomes Filho and Moura (2021) employed procedures like those of Zhang et al. (2014) in predicting load transfer curves in pile groups. For this purpose, they considered the hyperbolic curves developed by Bohn et al. (2016) for individual piles, using the interaction factors developed by Randolph and Wroth (1979) and Mylonakis and Gazetas (1998) for pile interaction within the group. Silva and Moura (2023), on the other hand, through data collection from 68 piles installed in granular soils, found that both individual and grouped piles exhibit load transfer curves that converge to hyperbolic functions. In the same study, the M parameters initially proposed by Bohn et al. (2016) for individual piles were reviewed, and new values were proposed for grouped piles.
In this context, the aim of this study is to predict the behavior of load-displacement curves in individual piles by correlating the parameters of hyperbolic t-z and q-z curves with field test measurements in profiles of granular soils.
2. Materials and methods
Initially, a database of experimental studies involving instrumented static load tests on piles was compiled. The selection was based on the availability of complete and reliable information regarding pile geometry, soil conditions, and load test measurements. For each selected case, the collected data included pile diameter, length, and installation conditions, as well as soil stratigraphy and in situ test results. Additionally, measurements obtained from instrumented load tests, including load distribution along the pile and corresponding displacements, were collected and organized. These data were used to support the calibration and evaluation of the proposed load transfer model.
Considering the adjustment and definition of the parameters a and b of the hyperbolic transfer curves, as well as the values of the deformation parameters Ms and Mb presented by Silva and Moura (2023), in addition to the collection of field test measurements, including standard penetration tests (SPT) and cone penetration tests (CPT), the prediction of load transfer curves in individual piles was conducted, and consequently, load-displacement curves were obtained. The correlations were validated through the results of three instrumented piles in terms of the load transfer curve and the load-displacement curve.
2.1 Locations of experimental studies collected
The development of this research was based on the collection of field test results from single, instrumented piles subjected to static load tests (SLT) and installed in profiles of granular soils. For this purpose, 18 experimental studies, also referred to as sites, were selected, totaling 51 instrumented piles, with 3 of them used for model validation. Table 1 presents the description of the locations of the experimental studies used in this research.
The selected experimental sites are located in different countries and continents, comprising soils formed under distinct geological and environmental conditions. These variations may influence soil properties, such as mineral composition, particle characteristics, and stress history, which can affect pile load transfer behavior. However, due to the limited availability of instrumented pile load test data in granular soils with complete documentation, it was necessary to include studies from different geographical regions. The influence of geological origin and local formation conditions was not explicitly considered as an independent variable in this study.
2.2 Characterization of the collected data
The geometric characterization of the selected piles from the experimental studies is presented in Table 2. It shows the pile identifications numbered according to the respective work, installation method (driven or bored), pile diameter (D), wall thickness (tw, for tubular piles), and embedded pile length in the soil (L).
The piles are generally driven with diameters ranging from 0.06 to 0.80 m and lengths between 1.22 and 21.0 m.
Only sites 1, 4, 6, 7, and 10 do not provide detailed location information for the strain gauge sensors. In these cases, it was assumed that there was the installation of two levels of instrumentation, one near the top of the pile and one near the tip. As for the other piles, there were observed 3 to 11 levels of instrumentation, allowing the obtention of t-z curves in various segments of the pile. The values of maximum resistance mobilized in the pile shaft, tmáx, ranged from 3.2 to 295 kPa, and for the maximum resistance mobilized at the tip, qmáx, there was a variation from 250 to 14,400 kPa.
Regarding the load tests conducted, except for piles 7-2, 11-1 (piles 2 and 1 of sites 7 and 11, respectively), and those belonging to sites 4, 12, and 16, they were of the slow loading type. The maximum loads obtained in the tests ranged from 2.3 to 4905 kN, with an average value of 870 kN.
Regarding the field investigations conducted before the load tests, of the 16 experimental studies used for model calibration, 8 included standard penetration tests (SPT), and 14 included cone penetration tests (CPT). Table 3 presents the mean values and quartiles of each field test measurement considered for predicting the t-z and q-z curves in the following chapter, namely, the standard penetration resistance index (NSPT, in blow counts), cone tip resistance (qc, in MPa), and sleeve friction resistance (fs, in kPa) from the cone penetration tests (CPT).
Since the experimental database included sites with either SPT or CPT measurements, the values were obtained from the results reported by the original authors, considering the in situ test (SPT or CPT) closest to the pile. For model calibration, these values were adopted as representative of the soil conditions in the evaluated region of the pile, whether along the shaft or at the pile tip.
3. Prediction of load transfer curves
To predict the hyperbolic t-z and q-z curves of piles subjected to axial compression loads in sandy soil profiles, the hyperbolic curve parameters a and b obtained by Silva and Moura (2023) through regression were used. For this purpose, it is defined that the parameters ai,t and ai,q correspond to the parameters a in single piles for the t-z and q-z curves, respectively. Similarly, the parameters bi,t and bi,q correspond to the parameters b of the hyperbolic curve for the t-z and q-z curves, respectively.
Thus, the aim is to predict the load transfer curves based on correlations of the parameters describing the hyperbolic t-z and q-z curves, ai,t, ai,q, bi,t, and bi,q. The correlations of the parameters a and b are conducted based on measurements from SPT and CPT tests, NSPT, qc or fs, the pile diameter (D), and initial geostatic stresses (σ'v0).
Thus, the correlations were developed through an empirical calibration procedure using the experimental database of instrumented piles. The selected variables were combined, and the products between them, as well as variations in their exponents, were manually evaluated through an iterative process to obtain the best agreement between predicted and experimental load transfer behavior. The proposed equations were defined based on the quality of fit, assessed by the coefficient of determination (R2), and the consistency of the distribution of experimental data relative to the fitted curves.
In addition to the correlations of parameter a, the prediction of this parameter was evaluated using the deformation parameters Ms and Mb obtained by Silva and Moura (2023) as shown in Table 4. Therefore, the estimation of parameters ai,t and ai,q would be according to Equations 3 and 4, respectively.
The experimental database includes both driven and bored piles, which are distinguished in the figures for visualization purposes. However, no consistent differences were observed in the load transfer trends between these installation methods within the analyzed dataset. Therefore, a single fitting curve was adopted for both pile types, as they exhibited similar behavior in relation to the considered variables and load transfer response.
The validations were conducted for piles 6-1, 7-1, and 7-2, with the others used for model calibration. These piles were selected because they present complete and well-documented experimental data, including detailed load transfer measurements and in situ test results. In particular, piles 7-1 and 7-2 include both SPT and CPT investigations, allowing validation of the proposed correlations using different types of in situ test parameters. Additionally, pile 6-1 was included because it represents the only experimental case in the database located in South America, corresponding to tropical soil conditions, thus contributing to the evaluation of the model under different regional soil environments.
For this purpose, comparisons were made between experimental and predicted values of parameters describing the load transfer curves and in terms of load-displacement curves. It is also worth noting that the calculation based on the load transfer method is performed using at least three segments with lengths of 1 meter or fractions, adopting a convergence of 10-6 m in displacement calculations, following the calculation methodology presented by Zhang et al. (2014).
3.1 t-z curves
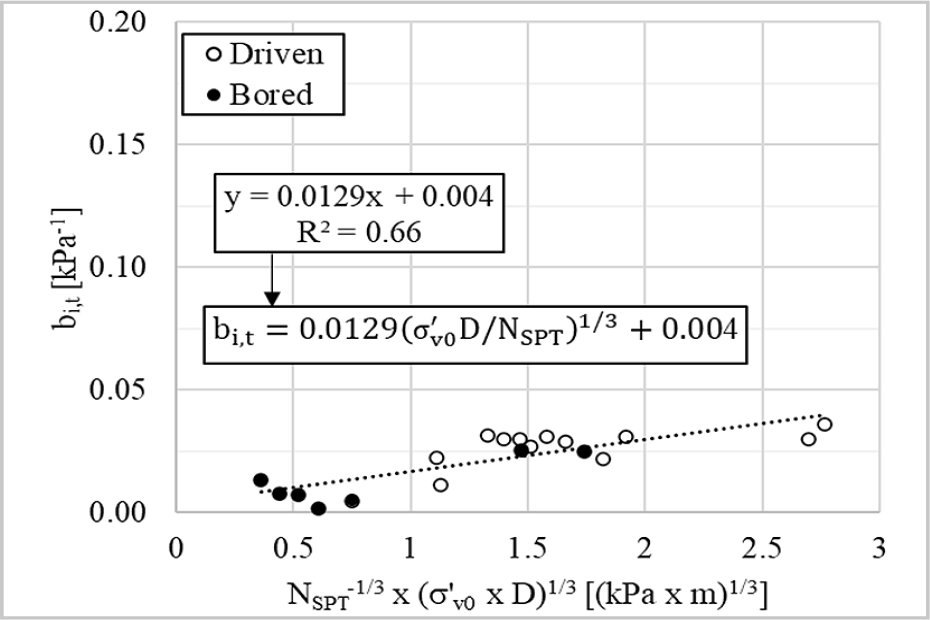
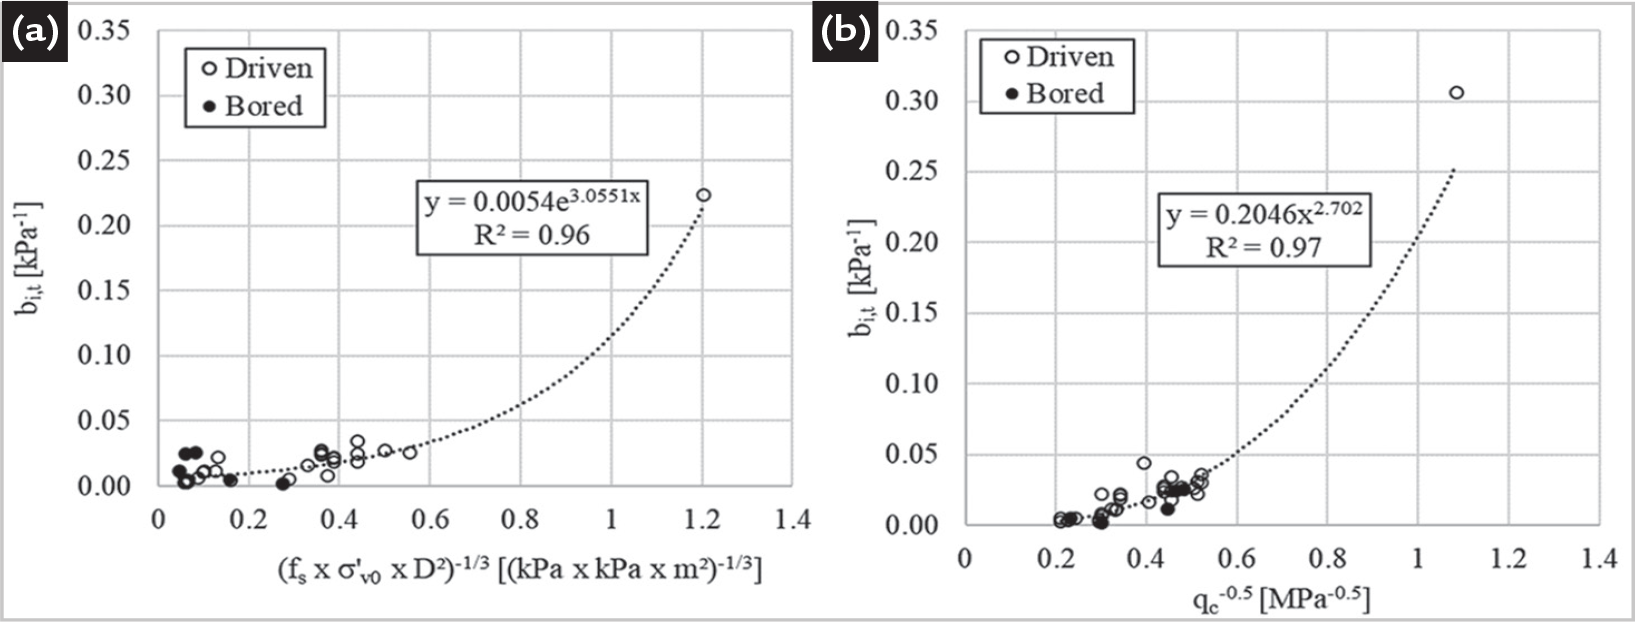
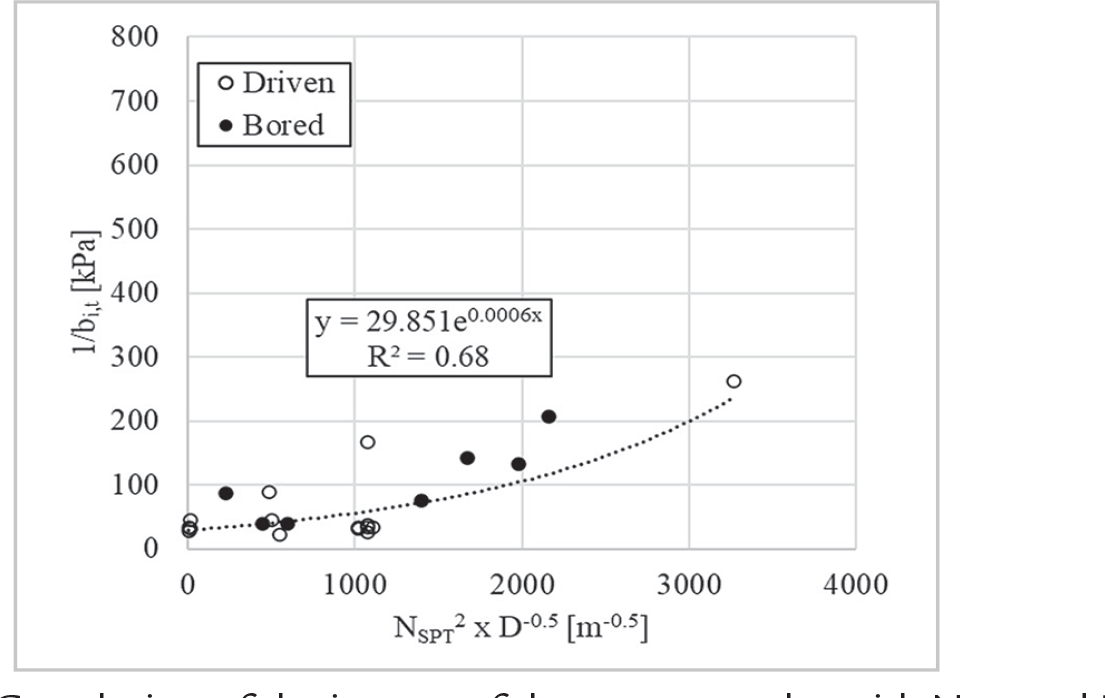
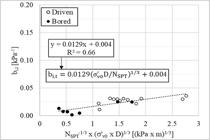
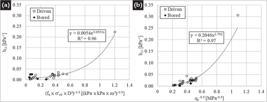
For parameter bi,t, correlations were made with NSPT, fs, or qc, obtaining the determination coefficients (R2), of the fitting curve as 0.66, 0.96, and 0.97, respectively, as shown in Figure 3 and Figure 4. Figure 3 presents the correlation obtained from NSPT, showing the equation that correlates parameter ai,t as a function of NSPT. It is worth mentioning that the correlated experimental points were represented by filled and unfilled markers to allow for the identification of the installation method of each pile (bored and driven, respectively). It is noteworthy that some points with scattered values were disregarded in the correlations.
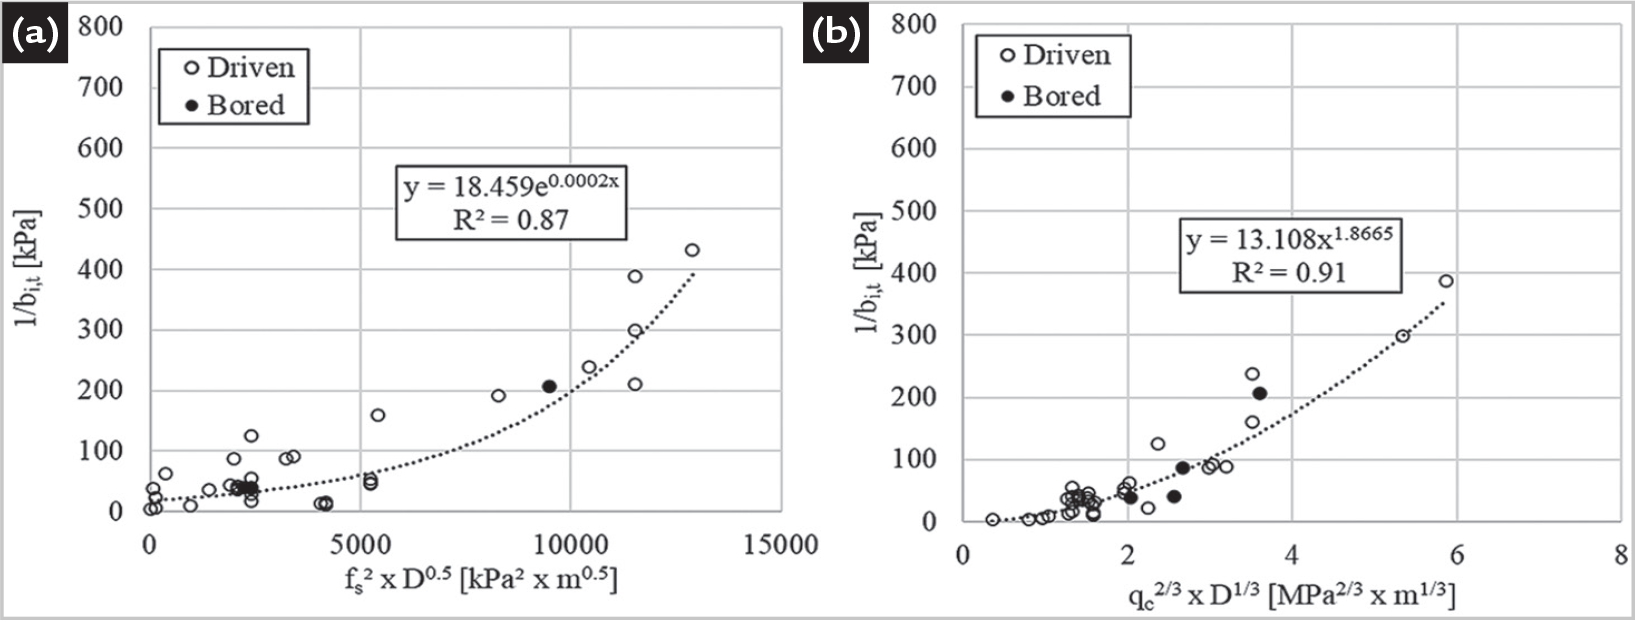
Correlation of the inverse of the parameter bi,t with CPT test measurements: (a) fs; (b) qc.
From Figure 4, it can be observed that the parameter bi,t showed a correlation with the field test measurements used. In Figure 4b, the correlation of bi,t directly with the square root of the inverse of qc is shown, while in the other correlations, D and σ'v0 were used. It is worth mentioning that the range of values with data used in the correlations was only up to 0.05. Therefore, this is the range where the correlation would provide more consistent predictions.
Furthermore, it is worth noting that the correlation based on NSPT showed a low determination coefficient (R2 = 0.66), while the correlations with fs and qc from the CPT test showed high R2 values, exceeding 0.95. However, in these cases, the distribution of correlated points is uneven. The inverse of the parameter bi,t was also related to the field test measurements, as can be observed in Figures 5 and 6.
In general, similar results were obtained for correlations based on the parameter bi,t, especially for correlations with NSPT. For the other correlations, there was a more regular distribution of points along the range of values and R2 values lower than those compared to correlations based on the parameter bi,t (Figure 6).
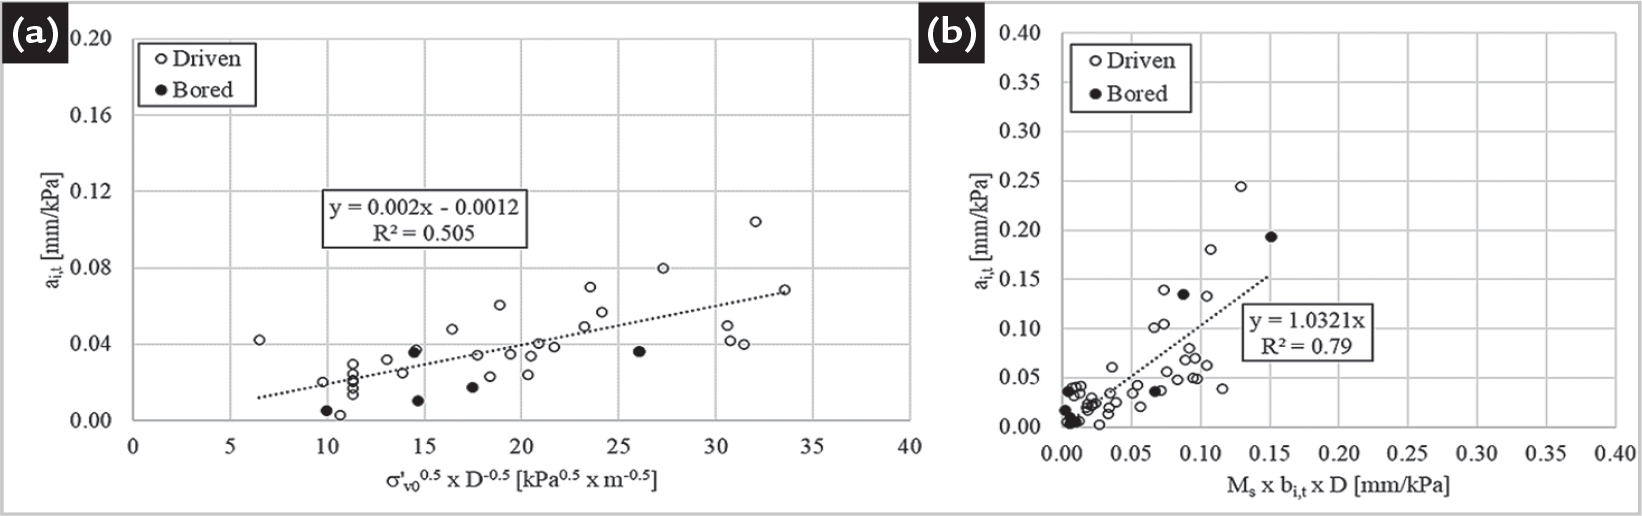
For the parameter ai,t, correlations with field test measurements were also performed, resulting in R2 values lower than 0.1. Moreover, correlations solely with D and σ’v0 yielded an R2 not exceeding 0.51, as shown in Figure 7a.
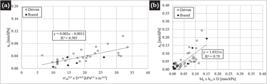
Thus, it is observed that the parameter ai,t is not correlatable with the field test measurements used. Therefore, the estimation of the parameter ai,t was conducted according to Equation 3. Figure 7b presents the comparison of the ai,t values obtained through hyperbolic regression to the experimental t-z and q-z curves and estimated through Equation 3 (Silva; Moura, 2023), using the bi,t values obtained by hyperbolic regression of the experimental t-z curve.
The figure shows that the fitting line has a slope close to unity and a determination coefficient, R2, of 0.79, indicating that there is a correlation between the obtained and estimated values using Equation 3.
3.2 q-z curves
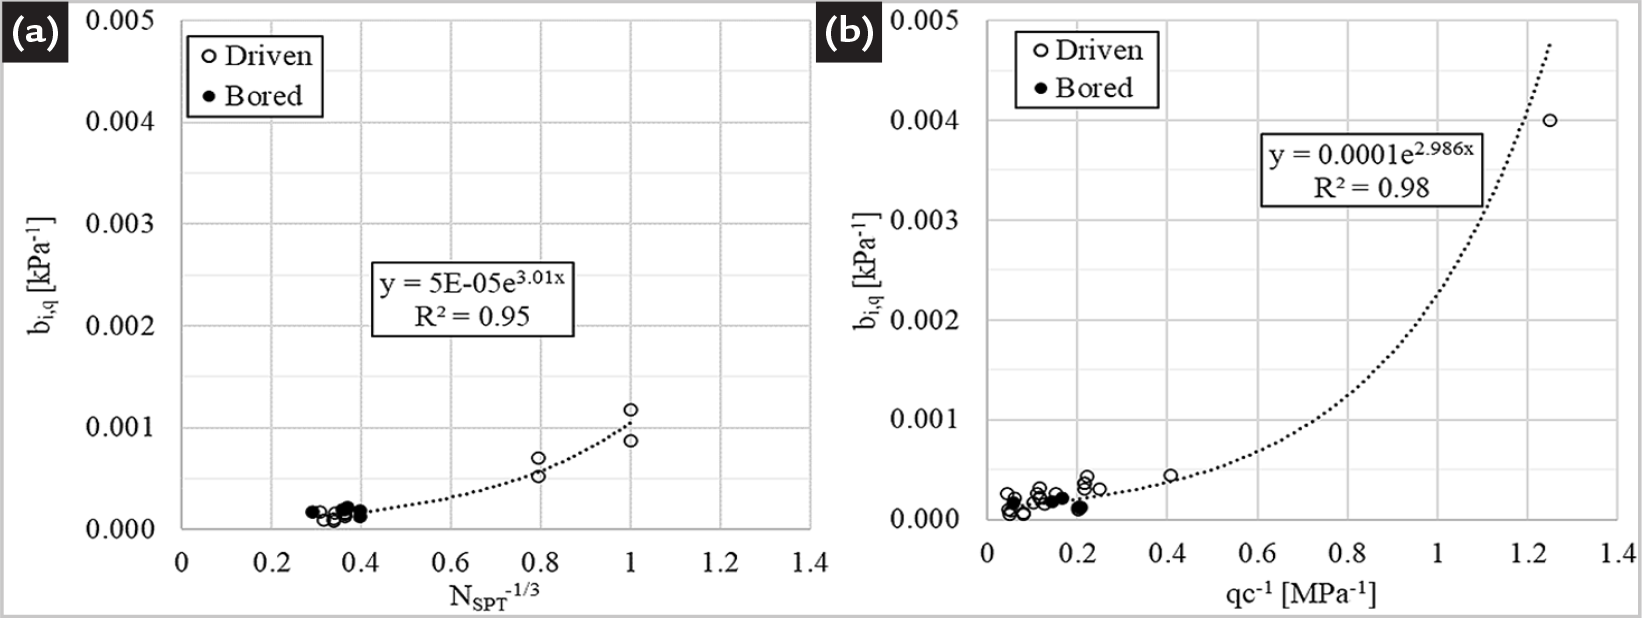
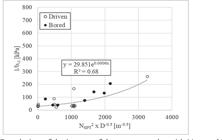
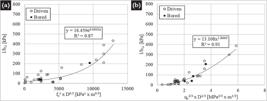
Similarly, the parameters of the q-z curve were analyzed, obtaining correlations of the parameter from the NSPT or measurements, as shown in Figure 8.
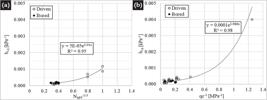
It is possible to observe that the parameter provided consistent correlations with the field test measurements, yielding R2 values exceeding 0.94, without the need to incorporate other variables (D and/or σ’v0) for predicting these parameters. It is noted that the correlation with showed higher convergence in the value of R2; however, the best distribution of points occurred in the correlation with NSPT. Due to the absence of points exceeding 0.0005 for the correlation with , it is recommended to limit the use of the correlation to values up to 0.0005.
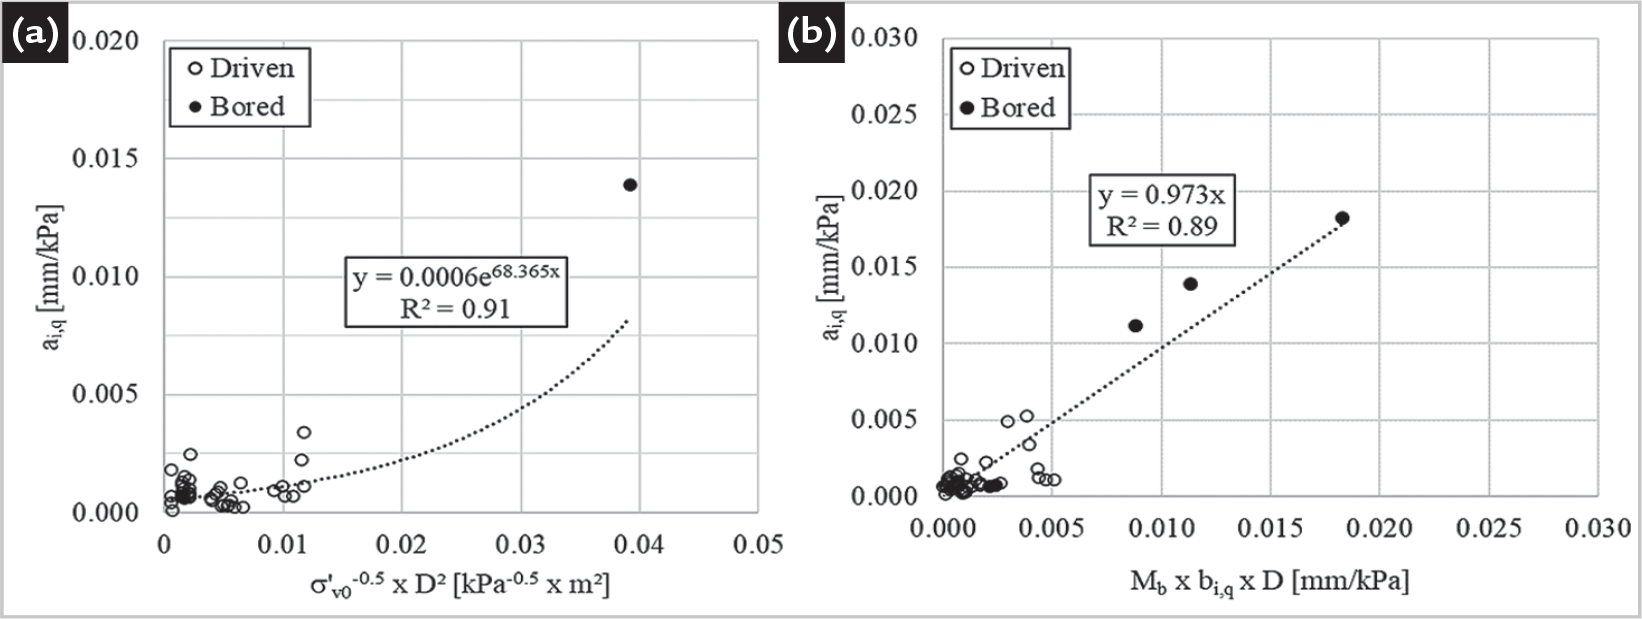
As for the parameter ai,q, correlations with NSPT and qc measurements yielded R2 values lower than 0.25. Once again, correlations were made with the diameter (D) and initial geostatic stress (σ'v0), as shown in Figure 9a, with an R2 of 0.91.
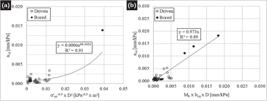
By the figure, a high dispersion for the range of values from 0 to 0.004 of ai,q is observed, so it is not possible to correlate the parameter ai,q with the proposed measurements and parameters. Proceeding, as done for the t-z curve, the prediction of the parameter ai,q was made from Equation 4, using the parameter bi,q obtained, as shown in Figure 9b.
The comparison of the obtained and estimated values in Figure 9b showed convergence in the values, indicating an R2 of 0.89 and a slope close to unity, providing smaller dispersions compared to the estimate based on σ’v0 and D (Figure 9a).
3.3 Validation in terms of load transfer curves
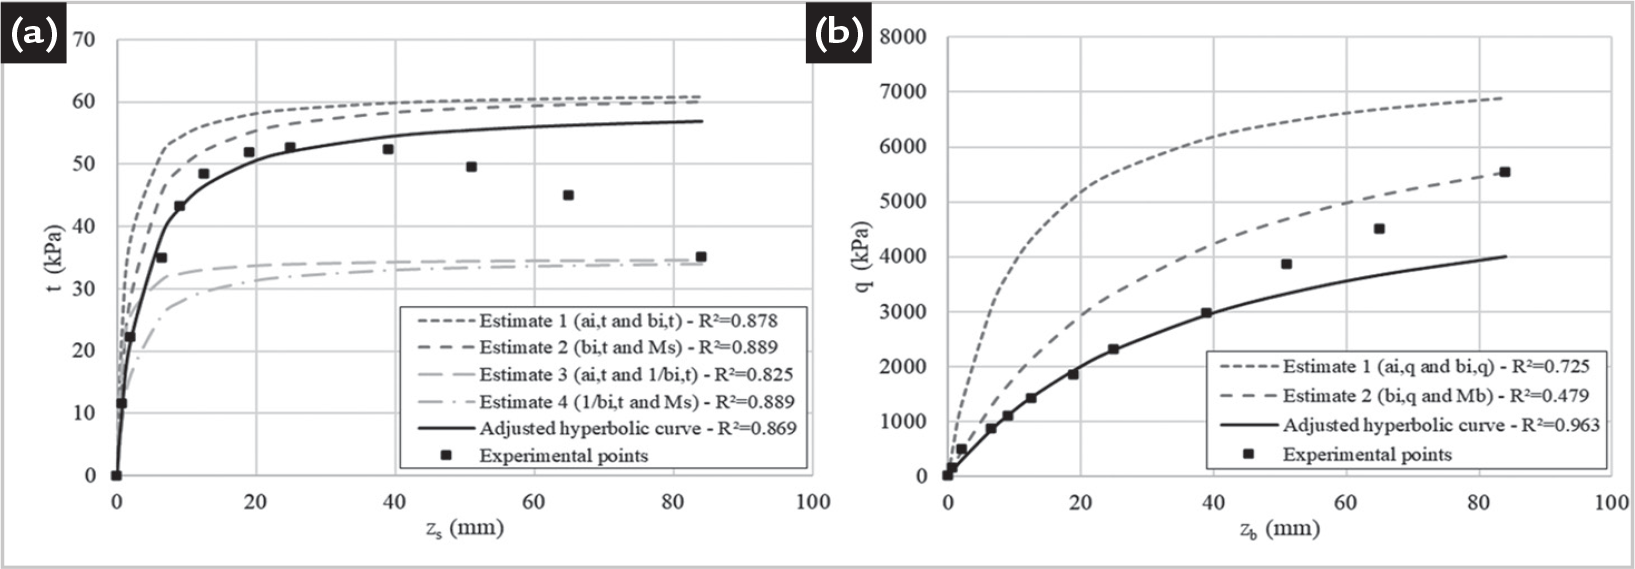
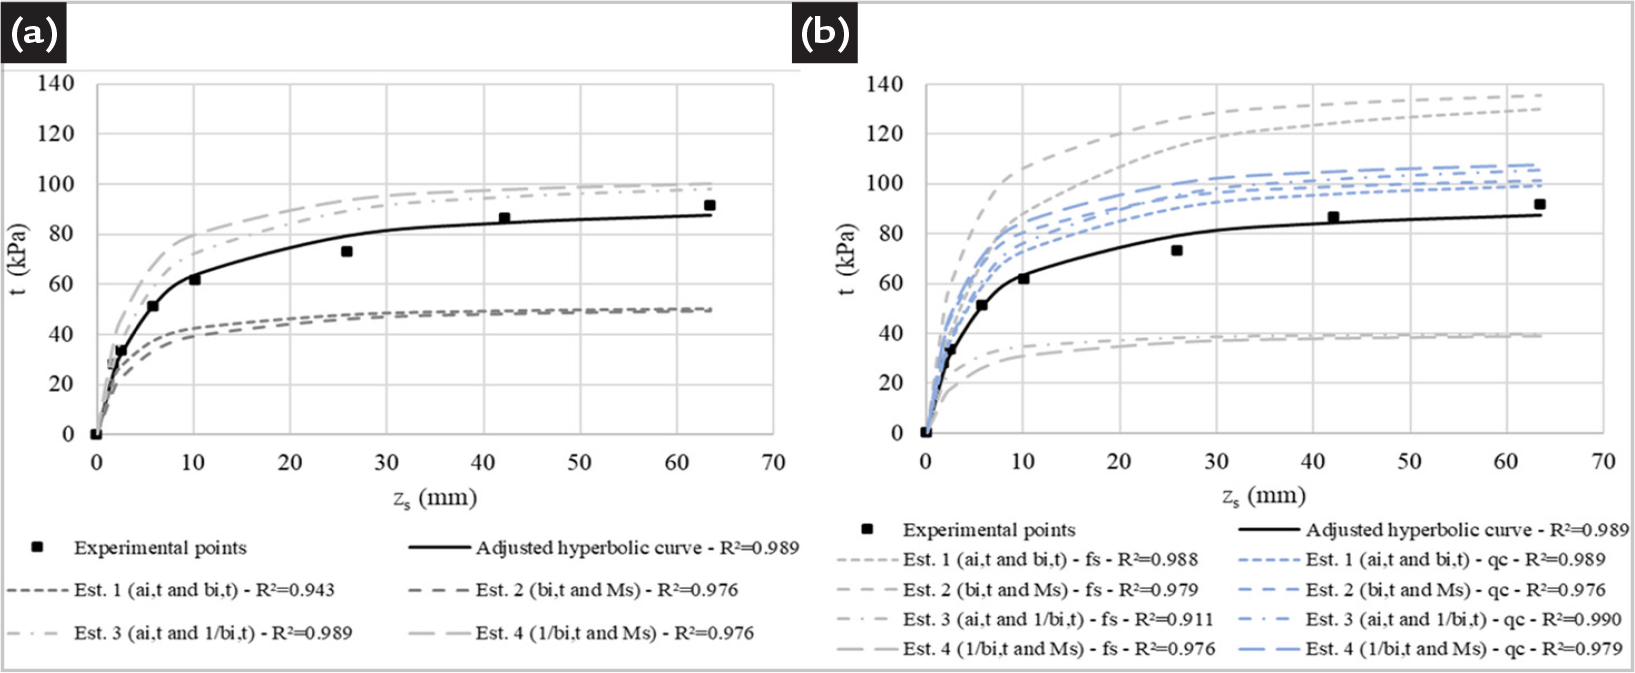
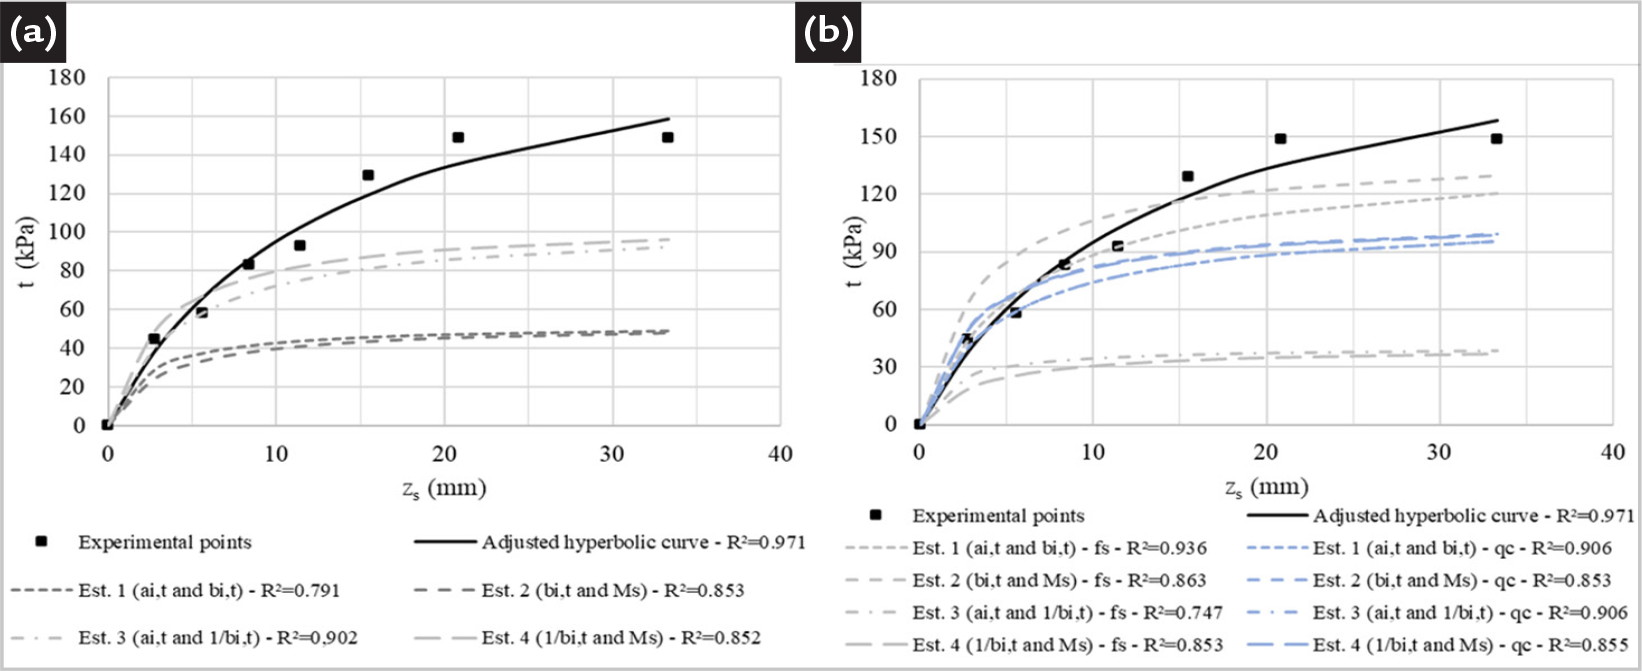
The validation was performed for piles 6-1, 7-1, and 7-2. For this purpose, the experimental load transfer curves were compared to the adjusted hyperbolic curves and estimates obtained through the proposed correlations. Thus, for each t-z curve, 4 estimates associated with each field measurement used in the study (NSPT, qc, or fs) were defined, and 2 estimates were made to obtain the q-z curves, as described in Table 5.
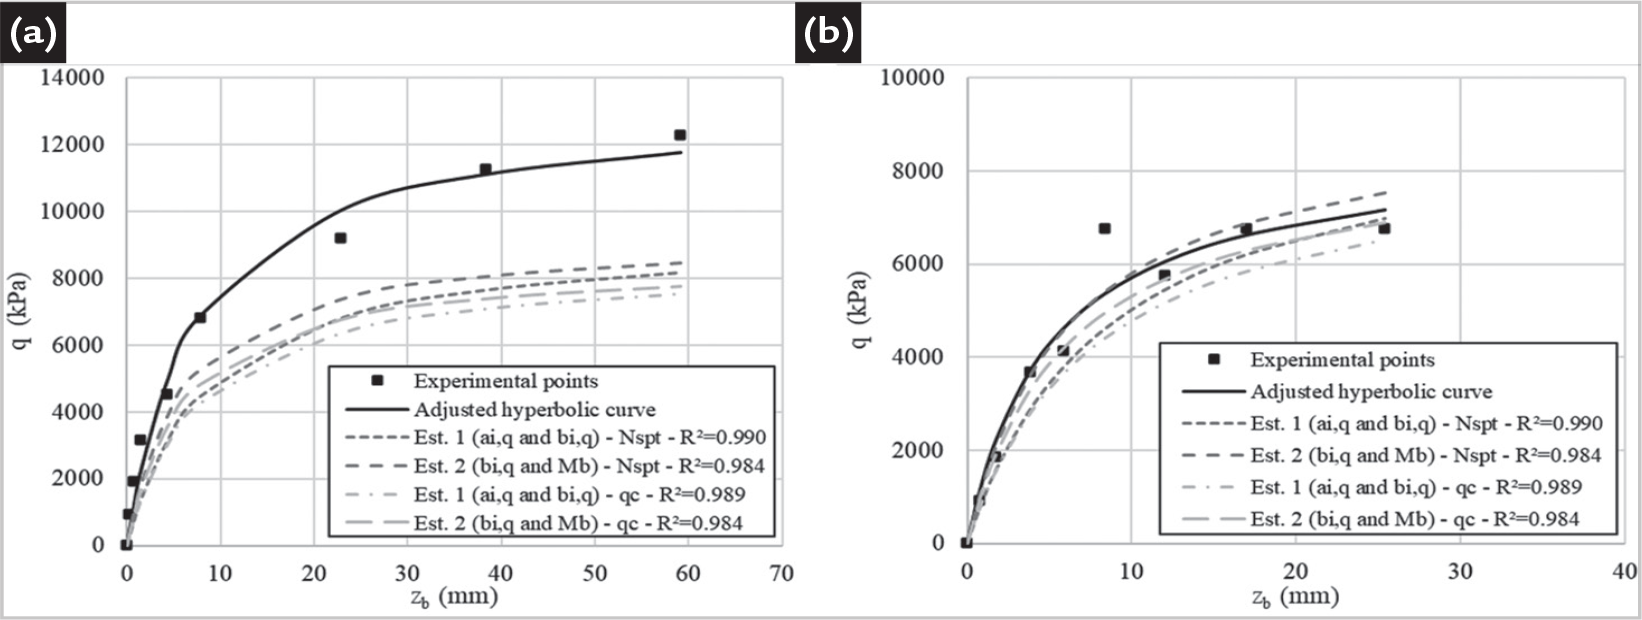
Initially, for pile 6-1, convergent estimates to the adjusted hyperbolic curves were obtained (Figure 10), with particular emphasis on the prediction of the t-z curve, estimate 2 made through the correlation of bi,t with NSPT (Figure 3), and definition of the parameter ai,t from Equation 3. As for the q-z curve, only estimate 2 using Equation 4 to define the parameter ai,q showed convergence with the experimental values.
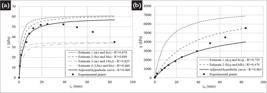
For the predictions of the t-z curves in pile 7-1, greater convergence was observed in estimate 3 when correlated with NSPT (Figure 11a). For the estimates made from the CPT test, greater convergence was observed in estimates 1 and 2 with qc (Figure 11b).
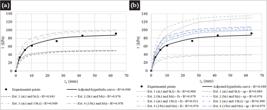
For pile 7-2 and the t-z curves, there was greater convergence of estimate 3 using correlations with NSPT (Figure 12a). For predictions made from CPT test results, it was noted that estimates 1 (using fs) and 2 and 4 (using qc) showed greater convergence with experimental results. It is noteworthy that these estimates converged only for small displacements (up to 10 mm).
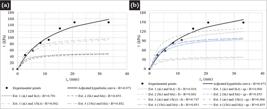
For the q-z curves, adherence of the predicted curves to the experimental ones of pile 7-1 is observed only for displacements lower than 5 mm (Figure 13a). For both piles, estimates 2 from correlations with NSPT or qc were the most convergent.
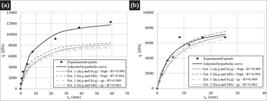
In general, for predictions of the t-z curves based on NSPT, estimates 2 and 3, and estimate 2 using qc provided the most convergent results. For the q-z curves, estimates 2 based on NSPT and qc provided the most convergent results for all piles used in the validation.
3.4 Validation in terms of load-displacement curve
Similarly, validation of the load-displacement curves was carried out using the most convergent estimates, as highlighted in the previous section. For this purpose, the estimates to be applied in the calculation of the load-displacement curve were defined according to Table 6, following the pattern defined for the t-z curve estimates.
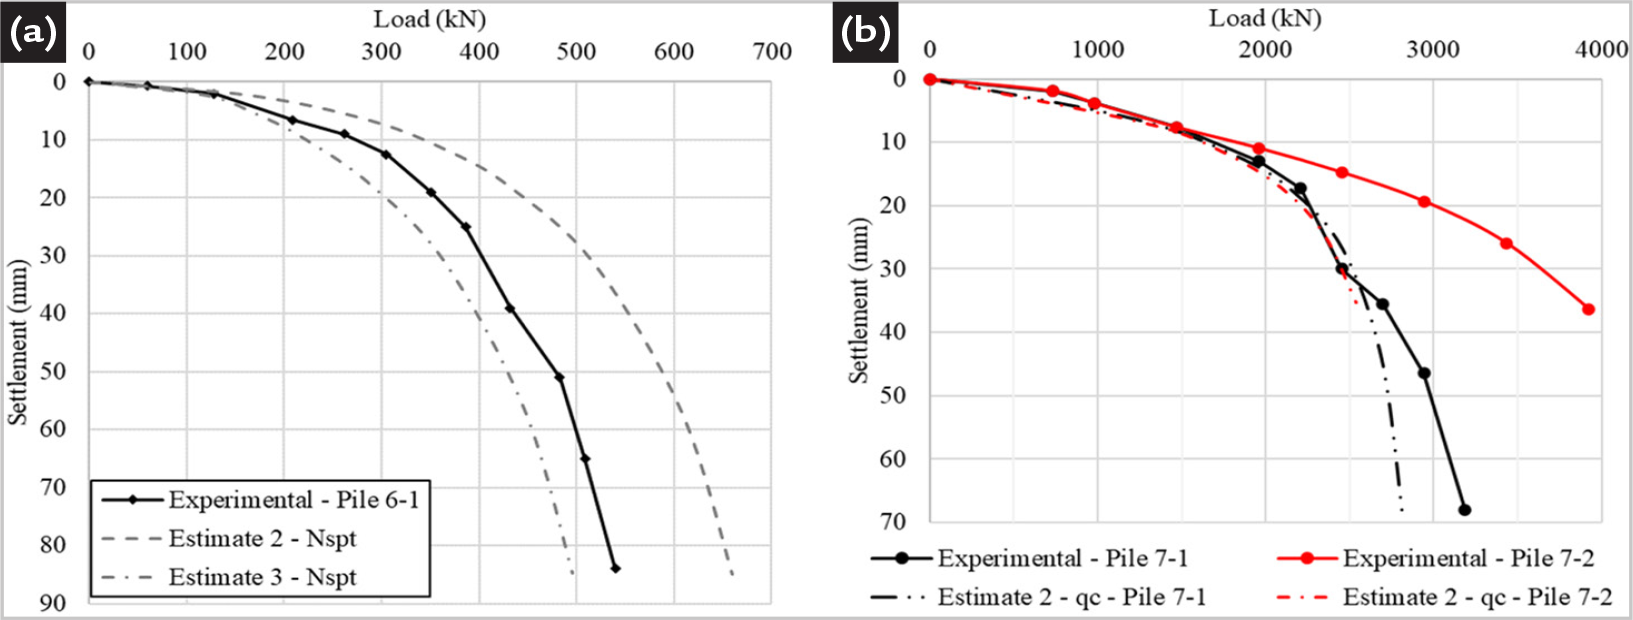
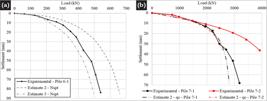
For pile 6-1 (Figure 14a), it was observed that the prediction made from estimate 3 with NSPT showed greater convergence along the entire curve. However, for piles 7-1 and 7-2, no adherence of the predicted curves to the experimental ones was obtained using correlations with NSPT. The lack of convergence of the correlations with NSPT for piles 7-1 and 7-2 may be associated with the divergence of predictions of the q-z and t-z curves, respectively, for displacements greater than 5 mm, as shown in Figures 13a and 12a. On the other hand, for predictions made from qc (Figure 14b), convergence to the experimental curves was achieved throughout the curve for pile 7-1 and for displacements up to 10 mm for pile 7-2.
4. Conclusions
Regarding the correlations performed to define the parameters of the hyperbolic t-z and q-z curves in single piles, it was observed that both driven and bored piles showed a common trend, indicating the possibility of predictions based on the same fitting curve.
Although the experimental database includes soils from different geographical regions, the use of in situ test parameters allows the proposed correlations to be based primarily on the measured mechanical soil behavior rather than solely on geological origin. However, the influence of local geological formation conditions was not explicitly evaluated and represents a limitation of the present study. Therefore, the applicability of the proposed method should be interpreted within the range of conditions represented in the experimental database.
As for the parameters ai,t and ai,q, this study indicates that they are not correlatable with field test measurements and show a trend when correlated with the diameter (D) of the pile and initial stress state (σ'v0). To estimate the parameters a using the parameters Ms and Mb defined by Silva and Moura (2023), predictions based on the parameters M and b estimated were also proposed.
For the parameters bi,t and bi,q, these were estimated based on field test measurements, showing convergence to correlations with R2 greater than 0.86, except for the predictions of the parameter bi,t from NSPT. Due to the correlations for the parameter bi,t showing lower convergence to the fitting curves, correlations associated with the inverse of the parameter bi,t were also evaluated, obtaining generally lower R2 values and better point distribution. All these scenarios were analyzed to evaluate the best methodology for calculating the load transfer curves.
The validation in terms of q-z curves indicated that predictions based on ai,q obtained through Equation 4 with Mb from Silva and Moura (2023) and using estimated bi,t, showed greater adherence to the hyperbolic fitting curve, especially for the estimation of bi,q from NSPT. The validation in terms of t-z curves showed that estimates based on the calculation of ai,t according to Equation 3 and estimated parameter bi,t from NSPT and qc, presented the most convergent results, as well as the estimate based on obtaining the parameter ai,t by correlation and 1/bi,t from NSPT. In terms of the load-displacement curve validation, it was found that the latter converged only for pile 6-1 and that predictions made based on qc provided more convergent results with those obtained experimentally.
Acknowledgments
The authors would like to thank the Post-Graduate Program in Civil Engineering (POSDEHA) and the Department of Hydraulic and Environmental Engineering of the Federal University of Ceará for encouraging and supporting this research, and to the Brazilian Federal Agency for Postgraduate Education (CAPES) and the Brazilian National Council for Scientific and Technological Development (CNPq) for the financial support, process number 130455/2020-2
-
Funding information
This research was supported by the Brazilian National Council for Scientific and Technological Development (CNPq), process number 130455/2020-2, through the granting of a scholarship to the corresponding author, Danton França da Silva.
Data availability
data-available can be obtained from the author’s dissertation, available at the Federal University of Ceará repository: https://repositorio.ufc.br/bitstream/riufc/70146/1/2022_dis_dfdsilva.pdf.
The authors state that this manuscript is based on the Master's Dissertation of the author, entitled "recalques de estacas com curvas de transferência de carga a partir de funções hiperbólicas em perfis de solos granulares" presented at the Federal University of Ceará, in the Graduate Program in Civil Engineering, with all data available at the following link: https://repositorio.ufc.br/bitstream/riufc/70146/1/2022_dis_dfdsilva.pdf
References
- ABDLRAHEM, M. A.; EL NAGGAR, M. H. Axial performance of micropile groups in cohesionless soil from full-scale tests. Canadian Geotechnical Journal, v 57, n.7, p. 1006-1024, Apr. 2020.
- API. Recommended practice for planning, designing, and constructing fixed offshore platforms - working stress design. 21 ed. Washington, DC: American Petroleum Institute, 2007.
- BEZERRA, P. H. L.; MOURA, A. S.; SILVA FILHO, F. C.; FILHO, F. V. C. G.; CERQUEIRA JUNIOR, E. Settlement’s prediction of piles in tropical soil. Geotechnical Engineering Journal of the SEAGS & AGSSEA, v. 52, n. 2, p. 48-55, June 2021.
- BOHN, C.; SANTOS, A. L.; FRANK, R. Development of axial pile load transfer curves based on instrumented load tests. Journal of Geotechnical and Geoenvironmental Engineering, v. 143, n. 1, 04016081, July 2016.
- BRIAUD J. L.; TUCKER L. M.; NG, E. Axially loaded 5 pile group and single pile in sand. In: INTERNATIONAL CONFERENCE ON SOIL MECHANICS AND FOUNDATION ENGINEERING, 12., Rio de Janeiro, 1989. Proceedings […]. Rio de Janeiro, 1989, v. 2, p. 1121-1124.
- COYLE, H. M.; REESE, L. C. Load transfer for axially loaded piles in clay. Journal of the Soil Mechanics and Foundations Division, v. 92, n. 2, p. 1-26, 1966.
- FELLENIUS B. H.; BRUSEY W. G.; PEPE F. Soil set-up, variable concrete modulus, and residual load for tapered instrumented piles in sand. In: ASCE SPECIALTY CONFERENCE ON PERFORMANCE CONFIRMATION OF CONSTRUCTED GEOTECHNICAL FACILITIES, Amherst, 2000. Proceedings […]. Amherst, 2000, p. 98-114.
- FLEMING, W. G. K. A new method for single pile settlement prediction and analysis. Géotechnique, v. 42, n. 3, p. 411-425, Sept. 1992.
- GAVIN, K. G.; CADOGAN, D.; CASEY, P. Shaft capacity of continuous flight auger piles in sand. Journal of Geotechnical and Geoenvironmental Engineering, v. 135, n. 6, p. 790-798, June 2009.
- GAVIN, K. G.; O’KELLY, B. C. Effect of friction fatigue on piles capacity in dense sand. Journal of Geotechnical and Geoenvironmental Engineering, v. 133, n. 1, p. 63-71, Jan. 2007.
- GAVIN, K.; DOHERTY, P.; TOLOOIYAN, A. Field investigation of the axial resistance of helical piles in dense sand. Canadian Geotechnical Journal, v. 51, n. 11, p. 1343-1354, June 2014.
- GOMES FILHO F. V. C.; MOURA A. S. Proposal for considering the group effect in the prediction of settlements in pile groups through load transfer methods. Soils and Rocks, v. 44, n. 2, e2021061320, 2021.
- GREGERSEN, O. S.; AAS, G.; DIBIAGIO, E. Load tests on friction piles in loose sand. In: INT. CONF. ON SOIL MECHANICS AND FOUNDATION ENGINEERING, 8., Moscow, 1973. Proceedings… Moscow, 1973, v. 2, p. 109-117.
- ISMAEL, N. F. Axial load tests on bored piles and pile groups in cemented sands. Journal of Geotechnical and Geoenvironmental Engineering, v. 127, n. 9, p. 766-773, Sept. 2001.
- KRASIŃSKI, A. Advanced field investigations of screw piles and columns. Archives of Civil Engineering, v. 57, n. 1, p. 45-57, 2011.
- KRASIŃSKI, A. Proposal for calculating the bearing capacity of screw displacement piles in non-cohesive soils based on CPT results. Studia Geotechnica et Mechanica, v. 34, n. 4, p. 41-51, 2012.
- LIU, J.; XIAO, H. B.; TANG, J.; LI, Q. S. Analysis of load-transfer of single pile in layered soil. Computers and Geotechnics, v. 31, n. 2, p. 127-135, Jan. 2004.
- LONG, P. D. Footings with settlement-reducing piles in non-cohesive soil. Report 43. Linköping: Swedish Geotechnical Institute, 1993.
- MASSAD, F. Sobre a interpretação de provas de carga em estacas, considerando as cargas residuais na ponta e a reversão do atrito lateral. Parte I: solos relativamente homogêneos. Solos e Rochas, v. 15, n. 2, p. 103-115, 1992.
- MAYNE, P. W.; HARRIS, D. E. Axial load-displacement behavior of drilled shaft foundations in Piedmont residuum. Report prepared for FHWA, McLean, Virginia: Federal Highway Administration, 1993.
- MYLONAKIS, G.; GAZETAS, G. Settlement and additional internal forces of Grouped Piles in Layered Soil. Géotechnique, v. 48, n. 1, p. 55-72, Feb. 1998.
- NORKUS, A.; MARTINKUS, V. Experimental study on bearing resistance of short displacement pile groups in dense sands. Journal of Civil Engineering and Management, v. 25, n. 6, p. 551-558, Apr. 2019.
- NOTTINGHAM, L. C. Use of quasi-static friction cone penetrometer data to predict load capacity of displacement piles. 1975. Tese (PhD) - University of Florida, 1975.
- PAIK, K.; SALGADO, R.; LEE, J.; KIM, B. Behavior of openand closed-ended piles driven into sands. Journal of Geotechnical and Geoenvironmental Engineering, v. 129, n. 4, p. 296-306, Apr. 2003.
- RANDOLPH, M. F.; WROTH, C. P. An analysis of the vertical deformation of pile groups. Geotechnique, v. 29, n. 4, p. 423-439, Dec. 1979.
- SILVA D. F.; MOURA A. S. Evaluation of fitting to hyperbolic functions of load transfer curves for piles in granular soil profiles. International Journal of Geotechnical Engineering, v. 17, n. 4, p. 339-351, Aug. 2023.
- SOARES, W. C.; COUTINHO, R. Q.; CUNHA, R. P. Behaviour of instrumented hollow auger pile groups in sandy soil. Geotechnical and Geological Engineering, v. 39, p. 5599-5618, May 2021.
- TAVENAS, F. A. Load tests result in friction piles in sand. Canadian Geotechnical Journal, v. 8, n. 1, p. 7-22, Feb. 1971.
- TEIXEIRA, A. H.; GODOY, N. S. Análise, projeto e execução de fundações rasas. In: HACHICH, W. et al. Fundações: teoria e prática. São Paulo: Pini, 1996.
- TUCKER, L. M.; BRIAUD, J. L. Analysis of the pile load test program at the Lock and Dam 26 replacement project. Final Report. St. Louis (MO): US Army Corps of Engineers, 1988.
- YANG, J.; THAM, L. G.; LEE, P. K. K.; CHAN, S. T.; YU, F. Behaviour of jacked and driven piles in sandy soil. Géotechnique, v. 56, n. 4, p. 245-259, May 2006.
- ZHANG, Q. Q.; LI, S. C.; LIANG, F. Y.; YANG, M.; ZHANG, Q. Simplified method for settlement prediction of single pile and pile group using a hyperbolic model. International Journal of Civil Engineering, v. 12, n. 2, p. 146-159, Apr. 2014.
- ZHANG, Q. Q.; ZHANG, Z. M. Simplified calculation approach for settlement of single pile and pile groups. Journal of Computing in Civil Engineering, v. 26, n. 6, p. 750-758, Nov./Dec. 2012.
Edited by
-
Associate Editor
Michèle Cristina Resende Farage