Abstract
Mine planning is dependent on the natural lithologic features and on the definition of their limits. The geological model is constantly updated during the life of the mine, based on all the information collected so far, plus the knowledge developed from the exploration stage up to the mine closure. As the mine progresses, the amount of available data increases, as well as the experience of the geological modeller and mine planner who deliver the short, medium, and long-term plans. This classical approach can benefit from the automation of the geological mapping on the mining faces and outcrops, improving the speed of repetitious work and avoiding exposure to intrinsic dangers like mining equipment, falling rocks, high wall proximity, among others. The use of photogrammetry to keep up with surface mining activities boarded in UAVs is a reality and the automated lithological classification using machine learning techniques is a low-cost evolution that might present accuracies above 90% of the contact zones and lithologies based on the automated dense point cloud classification when compared to the manual (or reality) classified model.
Keywords:
machine learning; photogrammetry; UAV; lithological classification
1. Introduction
The information acquired during the open pit development is essential to reduce uncertainty and adapt models through reconciliation between planning and execution. As the mine progresses, new data is collected and consequently, mineral resource and ore reserve calculations increase in accuracy to provide orientation for short, medium and long terms mine planning. Traditionally, geological mapping of the exposed mining faces is performed by mapping the visual lithological and structural characteristics in the field. This task might expose the professional to high wall proximity, weather conditions, dust, combustion gases, moving equipment and falling rocks. Besides this, productivity is affected as the individual needs to share space with production equipment and might not be able to observe the whole bench slope due to high wall height.
The mine's geological mapping can improve through the automation of the characteristic detection among lithologies or exposed materials. With visual differentiation of those characteristics, the automation can be performed on open pit imagery acquired by unmanned aerial vehicles (UAV).
Point clouds are used in industry to detect geotechnical attributes, for instance, as presented by Ferrero et al. (2009)FERRERO, A. M., FORLANI, G., RONCELLA, R., VOYAT, H. I. Advanced geostructural survey methods applied to rock mass characterization. Rock Mechanics and Rock Engineering, v. 42, p. 631-665, 2009., Roncella & Forlani (2005)RONCELLA, R., FORLANI, G. Extraction of planar patches from point clouds to retrieve dip and dip direction of rock discontinuities. International Archives of the Photogrammetry, v. 36, p. 162-167, 2005., Gigli & Casagli (2011)GIGLI, G., CASAGLI, N. Semi-automatic extraction of rock mass structural data from high resolution LIDAR point clouds. International Journal of Rock Mechanics and Mining Sciences, v. 48, p. 187-198, 2011., Lato & Vöge (2012)LATO, M. J., VÖGE, M. Automated mapping of rock discontinuities in 3D lidar and photogrammetry models. International Journal of Rock Mechanics and Mining Sciences, v. 54, p. 150-158, 2012., Maerz et al. (2013)MAERZ, N. H., YOUSSEF, A. M., OTOO, J. N., KASSEBAUM, T. J., DUAN, Y. A simple method for measuring discontinuity orientations from terrestrial LiDAR data. Environmental & Engineering Geoscience, v. 19, p. 185-194, 2013. and Riquelme et al. (2014)RIQUELME, A. J., ABELLÁN, A., TOMÁS, R., JABOYEDOFF, M. A new approach for semi-automatic rock mass joints recognition from 3D point clouds. Computers & Geosciences, v. 68, p. 38-52, 2014.. All the mentioned authors use point clouds from light detection and ranging (LiDAR). Walton et al. (2016)WALTON, G., MILS, G., FOTOPOULOS, G., RADOVANOVIC, R., STANCLIFFE, R. An approach for automated lithological classification of point clouds. Geosphere, v. 12, n. 6, p. 1833-1841, 2016. present application of automation methods through pattern detection algorithms for lithological classification, using LiDAR point clouds. With the progressive sophistication and miniaturization of UAVs and the portable sensors, several application areas are benefiting from cost reduction, accessibility and automation of procedures already established in the industry (COLOMINA & MOLINA, 2014COLOMINA, I., MOLINA P. Unmanned aerial systems for photogrammetry and remote sensing: a review. ISPRS Journal Of Photogrammetry And Remote Sensing, v. 92, p. 79-97, 2014.; DORN et al. 2016DORN, M., LESJAK, R., WIESSER, M. Improvement of the standard GNSS/IMU solution for UAVs using already existing redundant navigation sensors. In: EUROPEAN NAVIGATION CONFERENCE (ENC). Helsinki, 2016.).
There are several industrial applications that benefit from the development and improvement of the aircrafts, such as presented by Nonami (2007)NONAMI K. Prospect and recent research development for civil use autonomous unmanned aircraft. Journal of System Design and Dynamics. v. 1, n. 2, p. 120-128, 2007., Ouédraogo (2014)OUÉDRAOGO, M., DEGRÉ, A., DEBOUCHE, C., LISEIN J. The evaluation of unmanned aerial system-based photogrammetry and terrestrial laser scanning to generate DEMs of agricultural watersheds. Geomorphology, v. 214, p. 339-55, 2014., Javernick et al. (2014)JAVERNICK, L., BRASINGTON, J., CARUSO, B. Modelling the topography of shallow braided rivers using structure-from-motion photogrammetry. Geomorphology, v. 213, p. 166-82, 2014., Nishar et al. (2016)NISHAR, A., RICHARDS, S., BREEN, D., ROBERTSON, J., BREEN, B. Thermal infrared imaging of geothermal environments and by an unmanned aerial vehicle (UAV): a case study of the Wairakei - Tauhara geothermal field, Taupo, New Zealand. Renewable Energy, v. 86, p. 1256-1264, 2016.. In the mining industry, Salvini et al. (2016)SALVINI, R., ESPOSITO, G., MASTROROCCO, G., SEDDAIU, M. Using a remotely piloted aircraft system (RPAS) to analyse the stability of a natural rock slope. In: EGU GENERAL ASSEMBLY. Vienna, 2016, v. 18, p. 4409-4416., Hugenholtz et al. (2013)HUGENHOLTZ, C. H., WHITEHEAD, K., BROWN, O., BARCHYN, T., MOORMAN, B., LECLAIR, A., RIDDEL, K., HAMILTON T. Geomorphological mapping with a small unmanned aircraft system (sUAS): feature detection and accuracy assessment of a photogrammetrically-derived digital terrain model. Geomorphology, v. 194, p. 16-24, 2013., Silva et al. (2016)SILVA, C., DUARTE, C., SOUTO, M., SANTOS, A., AMARO, V., BICHO, C., SABADIA, J. A. Avaliação da acurácia do cálculo de volume de pilhas de rejeito utilizando VANT, GNSS e LiDAR. (Accuracy volumetry evaluation of tailings using UAV, GNSS and LiDAR), Boletim de Ciências Geodésicas, v. 22, p. 73-94, 2016., Peroni (2016)PERONI, R. Aplicações de mapeamento e modelagem de terreno com uso de VANTs em áreas de mineração (Application of mapping and modelling using UAV in mining areas). Florianopolis: Universidade Federal de Santa Catarina, 2016. 136p. (Relatório de Pós-Doutorado (Post-PhD. Report)). and Westoby (2012)WESTOBY, J., BRASINGTON, J., GLASSER, N., HAMBREY, M., REYNOLDS, J. Structure-From-Motion' photogrammetry: a low-cost, effective tool for geoscience applications. Geomorphology, v. 179, p. 300-314, 2012. also use make use of UAVs. Topographic surveying techniques, for instance, are already available and the solutions apply for several uses with similar accuracy and more definition when compared with traditional methods (BERETTA et al., 2017BERETTA, F., PERONI, R., COSTA, J. F. Stockpile volumetric survey using aircraft imagery in comparison with traditional methods. In: APPLICATION OF COMPUTERS AND OPERATIONS RESEARCH IN THE MINERAL INDUSTRY, Golden, 2017, p. 4_9-4_15, 38., 2018BERETTA, F., SHIBATA, H., CÓRDOVA, R., PERONI, R., AZAMBUJA, J., COSTA, J. F. Topographic modelling using UAVs compared with traditional survey methods in mining. REM: International Engineering Journal, v. 71, n. 3, p. 463-470, 2018.).
The automatic lithotype detection is performed by algorithms that use the geological characteristics as training data. Models in 2-D already have accessible alternatives for features detection. However, considering the 3-D space, typical in mining activities, the sampling selection can be an obstacle for the direct use of the algorithms available for pattern recognition. Some studies already use machine learning techniques in the mining industry, such as mineral differentiation (DALM et al., 2017DALM, M., BUXTON, N., RUITENBEEK, A. Discriminating ore and waste in a porphyry copper deposit using short-wavelength infrared (SWIR) hyperspectral imagery. Minerals Engineering, v. 105, p. 10-18, 2017.), metallurgical classification (EHRENFELD et al., 2017EHRENFELD, A., EGAÑA, A., GUERRERO, P., LIBERMAN, S., HANNA, V., VOISIN, L., ADAMS, M. Geometallurgical variables characterization using hyperspectral images and machine learning technics. In: APPLICATION OF COMPUTERS AND OPERATIONS RESEARCH IN THE MINERAL INDUSTRY, 38. Golden, 2017, p. 6_1-6_6.) and granulometric characterization (BAMFORD et al., 2017BAMFORD, T., ESMAEILI, K., SCHOELLIG, A. Aerial rock fragmentation analysis in low-light condition using uav technology. In: APPLICATION OF COMPUTERS AND OPERATIONS RESEARCH IN THE MINERAL INDUSTRY, 38 Golden, 2017, p. 4_1-4_8.).
2. Material and methods
Photogrammetry
Photogrammetry superposes images by camera displacement, which multiplies the amount of correspondent points among photos. This effect allows the reconstruction of high-fidelity 3-D models of objects or terrain. Dandois (2015)DANDOIS, J., OLANO, M., ELLIS, E. Optimal altitude, overlap and weather conditions for computer vision UAV estimates of forest structure. Remote Sensing, v.7, p. 13895-13920, 2015. shows that the parameters for image superposition, flight altitude and weather conditions are of great impact on the results.
Leite (2014)LEITE, R. Aplicação de estereoscopia em imagens digitais (Application of stereoscopy in digital imagery). Recife: Universidade de Pernambuco, 2014, 73p. Monografia de Bacharelado - Graduation Report). shows that from the Equation 1, it is possible to calculate relative distances in a pair of images. The fact that the camera position is registered with the image makes the calculation more accurate than just a relationship among points.
Where D is the orthogonal distance between the flight line and the common detected point on the ground; X is the segment between two camera positions; α is the angle between the flight line and the segment between the first camera position and the ground point; and β is the angle between the flight line and the segment between the second camera position and the ground point.
The register of the positions is made by a large number of points identified in each superposed portions of a pair of images (FOSTER & HALBSTEIN, 2014FOSTER, S., HALBSTEIN, D. Integrating 3D modelling photogrammetry and design. London: Springer Briefs in Computer Science, 2014. 111 p.). With hundreds of images, the number of superposed points is considerably high, which would make it impossible to process a whole model a few years ago, due to the computational requirements.
Nowadays, there are already several commercial software packages available, such as Mic Mac®, Context Capture® and Agisoft's PhotoScan®. After some tests, the last one was selected to process the images and create the point clouds. PhotoScan presents intuitive interface and workflow and higher processing performance when compared with the other packages. The aircraft used was a DJI's Phantom 4 Pro®, it has a 20Mpx camera, three-axis gimbal and complete telemetry built in.
Machine learning
Machine learning (ML) techniques were used to classify the materials that were visually different in the model. To classify, the supervised learning algorithms are indicated, which means that the input data are flagged with the expected final solution for the remaining data. Those answers are considered correct and used to train the model. In supervised learning, some data are reserved to measure the accuracy of the predicted categories. The ML algorithms are widely used for several modelling and classification methodologies.
With the ML state-of-the-art solutions, it is possible to separate and classify image patterns with no significant difficulty. However, mining activities have to consider the three dimensions and the surface or solid regular reading becomes an issue, as samples cannot be directly read in accumulated views. In order to read with the same support, the samples must be distributed as regular tiles over the whole surface of the point cloud mining front surface. Hence, regular grid nodes are projected on the three dimensions onto the surface. This creates a sparser and pseudo regular point cloud, where each point represents the centroid of the samples, as well as normal orientation for the sampling tile. The point's color estimate is done by interpolating the color components and then assigned to the center of the sample.
3. Methodology
Data acquisition
The flight mission was executed over a quarry and was planned upfront to cover the area of interest, mission time, flight altitude, longitudinal and lateral overlapping, number of ground control points (GCPs), weather conditions and legal use of the airspace. As shown in Figure 1-a, the model has been created as a point cloud with geodesic accuracy. A portion of the resulting point cloud is manually classified to be used as training and test dataset for the ML algorithms. Figure 1-b shows the classified portions as: diorite (in pink), granite (blue), soil (brown) and vegetation (green). In grey, represented are all the remaining points that will be automatically classified with the proposed methodology.
Point cloud representing the mining area after topographic reconstitution using photogrammetry.
The level of detail increases with the number of points in the cloud, but the computational requirements increase with the squared planar distance among points, which creates restrictions for the processing time and complexity of the output files. Closer camera takes to the object and/or lower altitudes flight missions are necessary to create higher resolution models. The photogrammetric point cloud for this model contains 2,797,386 points.
Data processing
To classify the lithotypes, a supervised learning approach has been adopted. This methodology uses an input dataset and the respective correct expected output used for comparisons. The materials were classified in four groups, according the designation used in this case study, namely diorite, granite, soil and vegetation.
The input dataset comprises the point cloud from the photogrammetry, as mentioned before. Each point carries the colour information as captured by the UAV camera, with red, green and blue (RGB) channels. As isolated points can be misclassified by the algorithm, another sparser cloud has been created and the new points will receive averages of the three channels.
For that, a 10x10 matrix has been positioned on the sample centroid and spatially oriented to fit the surface created by the original dense cloud. Using nearest neighbour interpolation, each cell in this matrix receives the average colours of the original points surrounding it. Thus, three matrices are created for each point of the sparser sample cloud, one for each colour channel. This results in 300 colour information to be transformed into vectors, as presented in Figure 2. The shades of grey for the cells represent the colour intensity for the channel.
As these averages also reflect the size of the search volume around the sample, the matrices were tested with different size factors. If the matrices are too large, the overlapping will affect the definition and consequently the model accuracy. In addition, large matrices would consider distant information to compose the average colour, affecting the accuracy again. If the matrices are too small, the neighbourhood behaviour could not be captured. To find the optimal sample size, a specific parameter related to the distances between points in the cloud was tested against the accuracy of the model for each algorithm. This parameter will be referred to as the sample matrix size factor and the number of cells in the matrix is always 10x10.
Model training and choice
Classification models were used to identify the different lithotypes for a sample point cloud. The implementation of the ML algorithms has been made through the Sci-kit Learn library (PEDREGOSA et al., 2011PEDREGOSA, F. et al. Scikit-learn: machine learning in Python. JMLR. v. 12, p. 2825-2830, 2011.). The algorithms used for the accuracy comparison were:
-
Support Vector Machine: This algorithm defines hyperplanes between different classes in training data. These hyperplanes aim to maximize the gap between the groups, considering the frontier points. Two kernels were used in the SVM: the linear kernel and the RBF kernel;
-
K-Nearest Neighbour: It predicts a desired point using the values of the first K neighbours of the point in question. K = 6 was used in this work;
-
Random Forest. It is one of the ensemble methods of Machine Learning. The Random Forest method creates a certain amount of decision trees (100 was used) and establishes the classification by the majority outcome of the trained decision trees. It is a method known to be robust to the effect of overfit which is observed for a single decision tree;
-
Gradient Tree Boost. In this method a decision tree is trained and then a new decision tree is trained based on the weaknesses of the previous one. That procedure is repeated a number of times determined by the user (100 times in this work).
The training performances are presented as accurate, which represents the amount of points correctly predicted by model, considering the testing data. To separate the data in the training and test groups, the technique k-fold has been used with k=5. This means that one fifth of the manually classified dataset has been used to check the accuracy five times. The resulting accuracy is the average accuracy for each test group.
The algorithms ran in two scenarios. The first scenario considers the four classes (diorite, granite, soil and vegetation). The second scenario is binary and considers only two classes: ore and waste, where ore comprises diorite and granite and waste groups soil and vegetation. It is expected that the binary scenario presents higher accuracy than the multiclass if, considering the same testing conditions. This is due to the reduction of the points near the borders.
4. Results and discussion
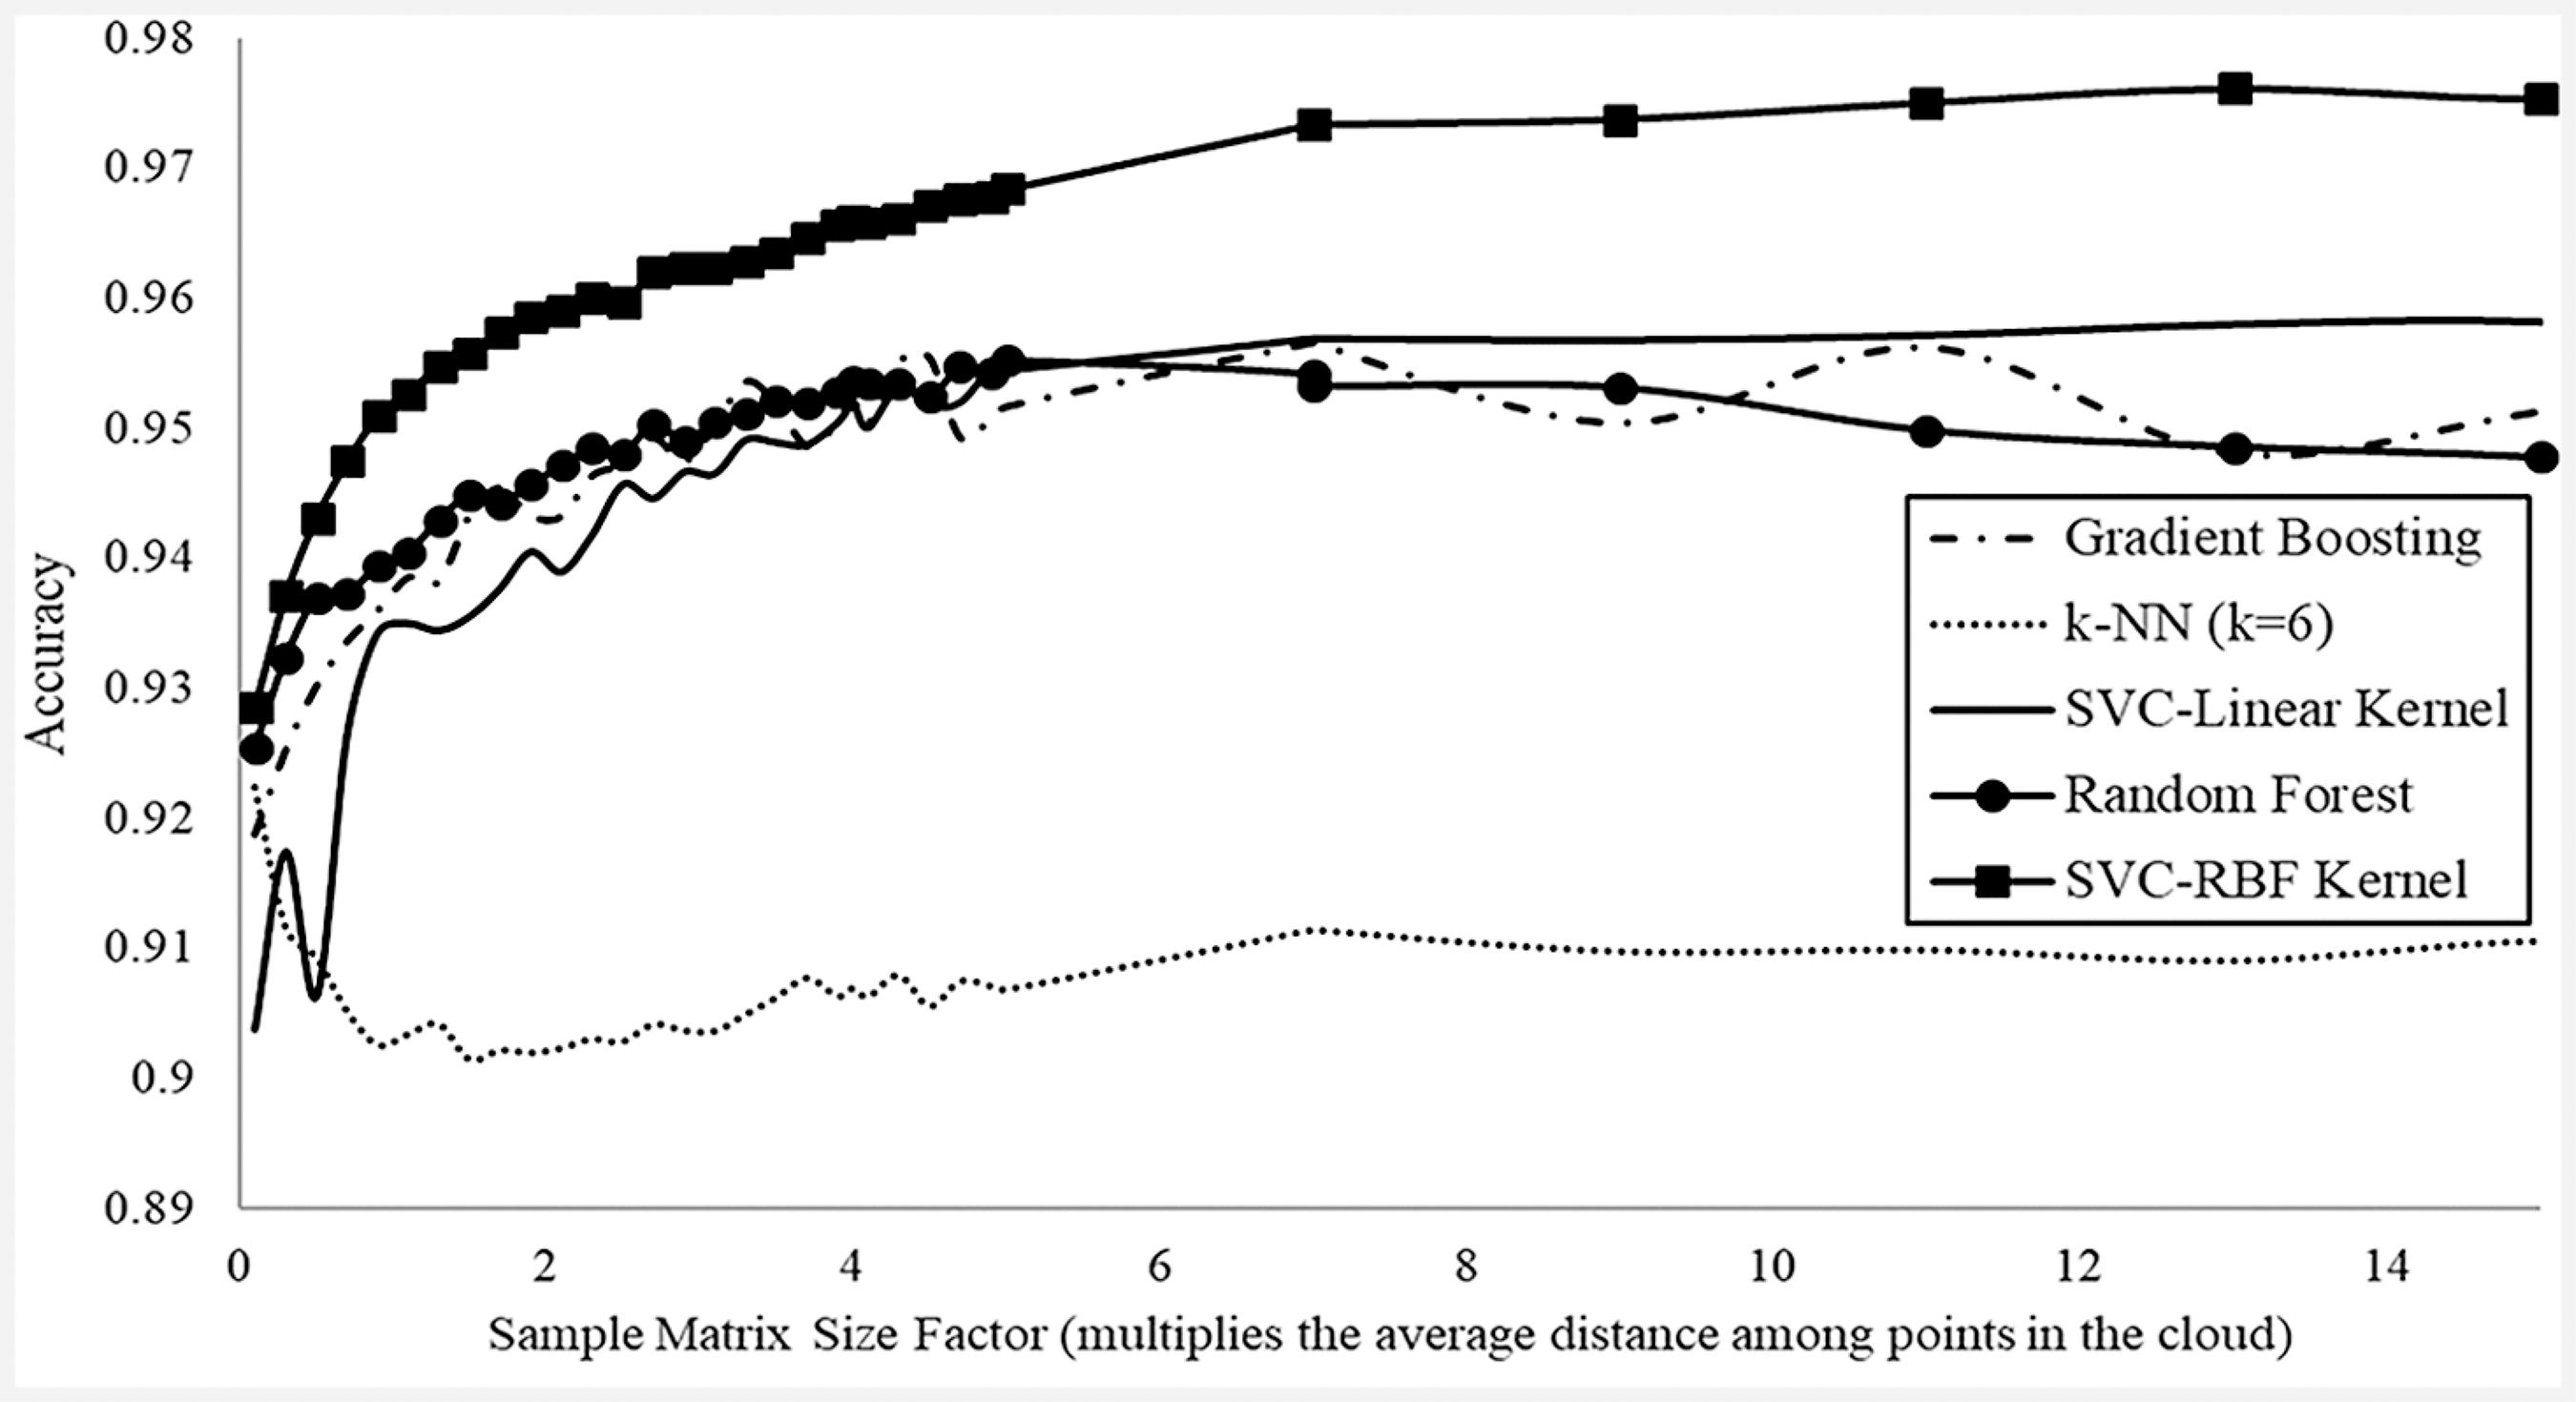
The resulting accuracy for the multiclass scenario is presented in Figure 3. These accuracy values are related to the manually selected training groups. The accuracy presented reflects the prediction capability of the model considering diorite, granite, soil and vegetation.
The results show that all the algorithms achieved more than 90% of accuracy in their output models. The model that shows the highest accuracy is the Support Vector Machine with Radial Basis Function using the default parameters in the library, and a sample matrix size factor of 12. SVM-RBF is also the most consistent algorithm with different sample sizes. SVM RBF is followed by SVM Linear, Gradient Boosting and Random Forest in accuracy; all of them with sample sizes around 7.
The k-NN model was the algorithm with the lowest accuracy among the tested ones, which corroborates Pestov (2012)PESTOV, V. Is the k-NN classifier in high dimensions affected by the curse of dimensionality?, 2012, arXiv:1110.4347., who mentions that k-NN is not the best option to model points in a high-dimension space. In this case, a dimensionality reduction, such as Principal Component Analysis, could positively impact the k-NN results. Considering the mentioned literature, k-NN was used as an inappropriate model to observe the behaviour of its results compared with others algorithms.
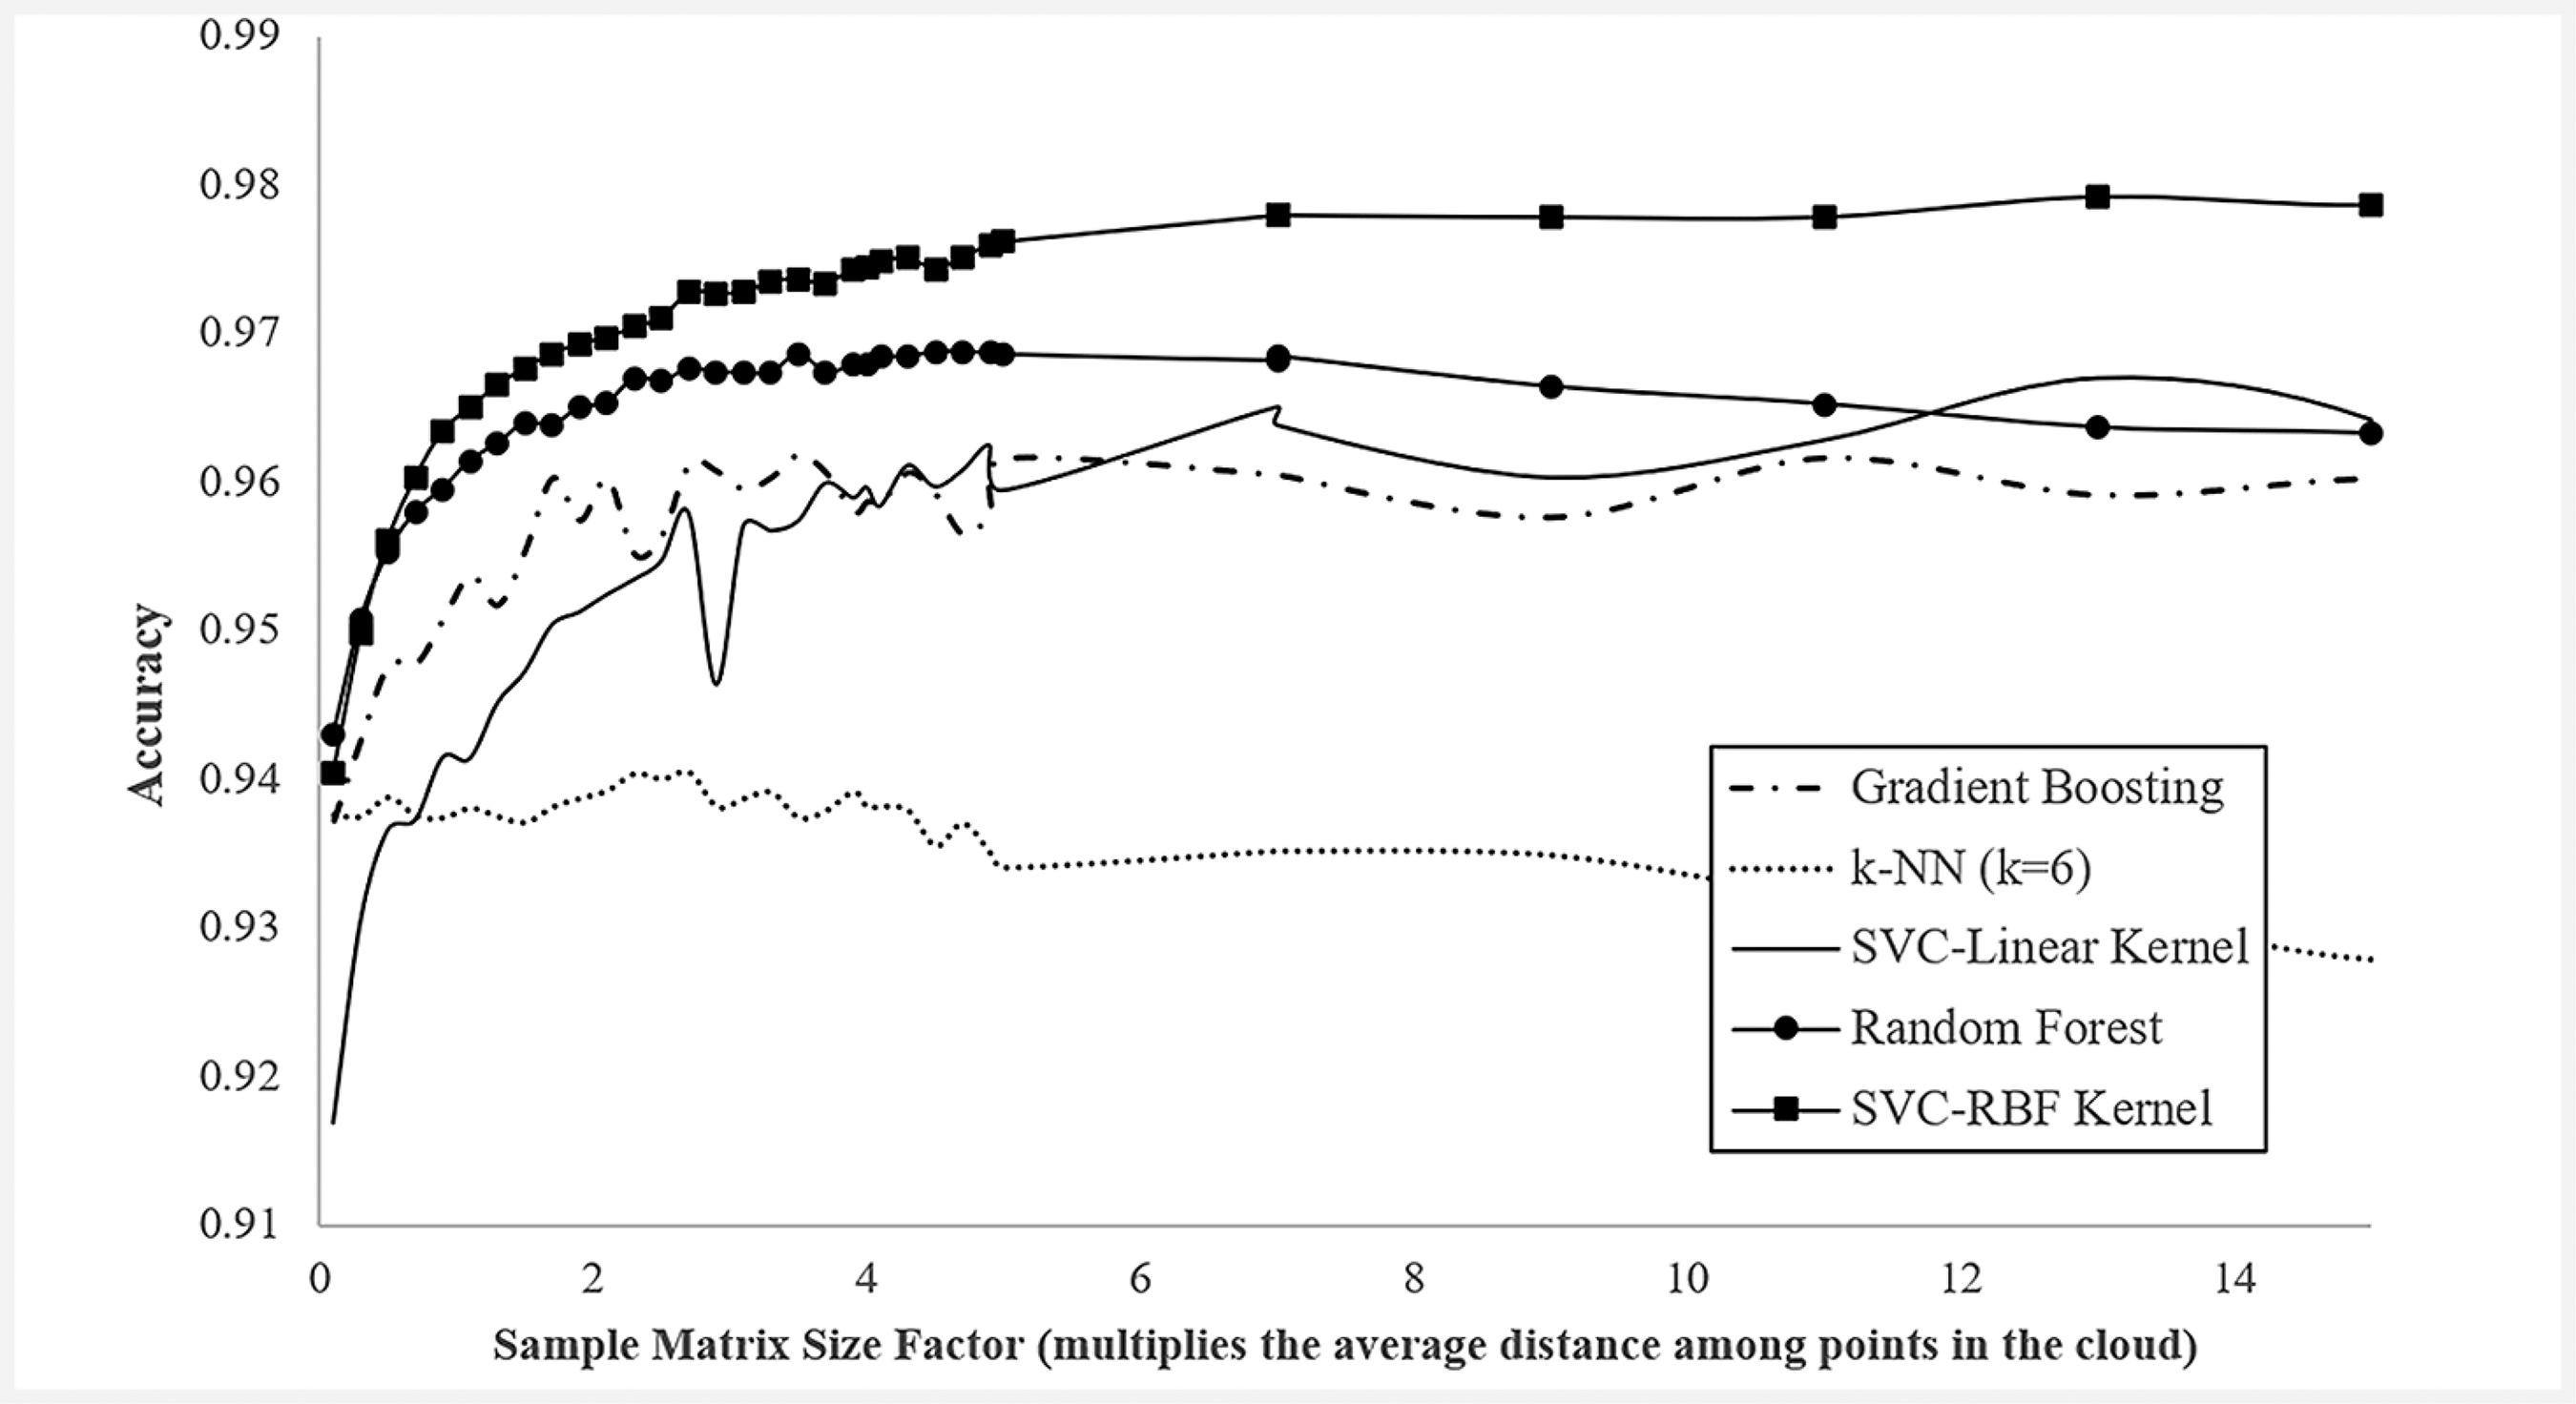
All the models practically reached their maximum accuracy values around the sample size of seven. This means that from this point, there is a saturation of information obtained by the input matrix. Figure 4 shows the resulting accuracies for the binary scenario, which reflects ore and waste only. Again, the most accurate algorithm was SVM-RBF, even though the accuracy gain was not significant when compared with the multiclass.
Accuracy curves for the different classification algorithms as the sample size increases. These results reflect the binary scenario.
SVM-RBF is followed by Random Forest, with the accuracy stabilized around the sample size of 5. As observed in the multiclass scenario, there is a reduction of accuracy between sample sizes of 10 and 15. This is due to the matrices overlapping and capture of information too far from the sample centre.
The model validation goes beyond the numerical results and was submitted to a visual inspection. Figure 5-a shows the SVM-RBF model with the sample size of 7 and Figure 5-b presents the level of confidence for the chosen model. As there are four classes, a complete blind shot would present a minimum of 25% confidence on the chosen class.
a) Output predicted model with the highest accuracy for the multiclass scenario; and b) confidence level of the algorithm for the chosen class.
It is noticeable that the accuracy deteriorates in border zones between classes or in areas where the points have colour variation or shades.
5. Conclusion
Different usual machine learning algorithms were tested to classify the point cloud as four classes. The highest accuracy was observed with the Support Vector Machine algorithm with Radial Basis Function kernel. This result shows the influence of the variability for any kind of visual identification among the lithological materials.
The regular sampling issue in 3-D has been solved with pseudo-regular samples, with spacing between points floating around the average distance of the original dense cloud.
The method can be applied with low investment and operational costs, considering the value of the UAV and the computational costs currently available. The implementation costs are diluted as the mining activity advances and the accuracy tends to increase as the database is updated. For each mine, a new database must be built, so the results can present higher accuracy.
The local knowledge of the geology is dynamic and constantly refined with the collected data and technical revaluation. Just as happens with the traditional mapping, the database used for ML techniques also needs constant feedback for the accuracy improvement.
For future works, the authors recommend the use of other electromagnetic wavelengths, such as long-wave infra-red or any other length that shows contrast between materials. Other classification algorithms can also be tested and fine-tuned, as well as the input data.
References
- BAMFORD, T., ESMAEILI, K., SCHOELLIG, A. Aerial rock fragmentation analysis in low-light condition using uav technology. In: APPLICATION OF COMPUTERS AND OPERATIONS RESEARCH IN THE MINERAL INDUSTRY, 38 Golden, 2017, p. 4_1-4_8.
- BERETTA, F., PERONI, R., COSTA, J. F. Stockpile volumetric survey using aircraft imagery in comparison with traditional methods. In: APPLICATION OF COMPUTERS AND OPERATIONS RESEARCH IN THE MINERAL INDUSTRY, Golden, 2017, p. 4_9-4_15, 38.
- BERETTA, F., SHIBATA, H., CÓRDOVA, R., PERONI, R., AZAMBUJA, J., COSTA, J. F. Topographic modelling using UAVs compared with traditional survey methods in mining. REM: International Engineering Journal, v. 71, n. 3, p. 463-470, 2018.
- COLOMINA, I., MOLINA P. Unmanned aerial systems for photogrammetry and remote sensing: a review. ISPRS Journal Of Photogrammetry And Remote Sensing, v. 92, p. 79-97, 2014.
- DALM, M., BUXTON, N., RUITENBEEK, A. Discriminating ore and waste in a porphyry copper deposit using short-wavelength infrared (SWIR) hyperspectral imagery. Minerals Engineering, v. 105, p. 10-18, 2017.
- DANDOIS, J., OLANO, M., ELLIS, E. Optimal altitude, overlap and weather conditions for computer vision UAV estimates of forest structure. Remote Sensing, v.7, p. 13895-13920, 2015.
- DORN, M., LESJAK, R., WIESSER, M. Improvement of the standard GNSS/IMU solution for UAVs using already existing redundant navigation sensors. In: EUROPEAN NAVIGATION CONFERENCE (ENC). Helsinki, 2016.
- EHRENFELD, A., EGAÑA, A., GUERRERO, P., LIBERMAN, S., HANNA, V., VOISIN, L., ADAMS, M. Geometallurgical variables characterization using hyperspectral images and machine learning technics. In: APPLICATION OF COMPUTERS AND OPERATIONS RESEARCH IN THE MINERAL INDUSTRY, 38. Golden, 2017, p. 6_1-6_6.
- FERRERO, A. M., FORLANI, G., RONCELLA, R., VOYAT, H. I. Advanced geostructural survey methods applied to rock mass characterization. Rock Mechanics and Rock Engineering, v. 42, p. 631-665, 2009.
- FOSTER, S., HALBSTEIN, D. Integrating 3D modelling photogrammetry and design London: Springer Briefs in Computer Science, 2014. 111 p.
- GHOSH, S. Fundamentals of computational photogrammetry New Delhi: Concept Publishing Company, 2005. 254p.
- GIGLI, G., CASAGLI, N. Semi-automatic extraction of rock mass structural data from high resolution LIDAR point clouds. International Journal of Rock Mechanics and Mining Sciences, v. 48, p. 187-198, 2011.
- HUGENHOLTZ, C. H., WHITEHEAD, K., BROWN, O., BARCHYN, T., MOORMAN, B., LECLAIR, A., RIDDEL, K., HAMILTON T. Geomorphological mapping with a small unmanned aircraft system (sUAS): feature detection and accuracy assessment of a photogrammetrically-derived digital terrain model. Geomorphology, v. 194, p. 16-24, 2013.
- JAVERNICK, L., BRASINGTON, J., CARUSO, B. Modelling the topography of shallow braided rivers using structure-from-motion photogrammetry. Geomorphology, v. 213, p. 166-82, 2014.
- LATO, M. J., VÖGE, M. Automated mapping of rock discontinuities in 3D lidar and photogrammetry models. International Journal of Rock Mechanics and Mining Sciences, v. 54, p. 150-158, 2012.
- LEITE, R. Aplicação de estereoscopia em imagens digitais (Application of stereoscopy in digital imagery) Recife: Universidade de Pernambuco, 2014, 73p. Monografia de Bacharelado - Graduation Report).
- MAERZ, N. H., YOUSSEF, A. M., OTOO, J. N., KASSEBAUM, T. J., DUAN, Y. A simple method for measuring discontinuity orientations from terrestrial LiDAR data. Environmental & Engineering Geoscience, v. 19, p. 185-194, 2013.
- NISHAR, A., RICHARDS, S., BREEN, D., ROBERTSON, J., BREEN, B. Thermal infrared imaging of geothermal environments and by an unmanned aerial vehicle (UAV): a case study of the Wairakei - Tauhara geothermal field, Taupo, New Zealand. Renewable Energy, v. 86, p. 1256-1264, 2016.
- NONAMI K. Prospect and recent research development for civil use autonomous unmanned aircraft. Journal of System Design and Dynamics v. 1, n. 2, p. 120-128, 2007.
- OUÉDRAOGO, M., DEGRÉ, A., DEBOUCHE, C., LISEIN J. The evaluation of unmanned aerial system-based photogrammetry and terrestrial laser scanning to generate DEMs of agricultural watersheds. Geomorphology, v. 214, p. 339-55, 2014.
- PEDREGOSA, F. et al. Scikit-learn: machine learning in Python. JMLR v. 12, p. 2825-2830, 2011.
- PERONI, R. Aplicações de mapeamento e modelagem de terreno com uso de VANTs em áreas de mineração (Application of mapping and modelling using UAV in mining areas) Florianopolis: Universidade Federal de Santa Catarina, 2016. 136p. (Relatório de Pós-Doutorado (Post-PhD. Report)).
- PESTOV, V. Is the k-NN classifier in high dimensions affected by the curse of dimensionality?, 2012, arXiv:1110.4347.
- RIQUELME, A. J., ABELLÁN, A., TOMÁS, R., JABOYEDOFF, M. A new approach for semi-automatic rock mass joints recognition from 3D point clouds. Computers & Geosciences, v. 68, p. 38-52, 2014.
- RONCELLA, R., FORLANI, G. Extraction of planar patches from point clouds to retrieve dip and dip direction of rock discontinuities. International Archives of the Photogrammetry, v. 36, p. 162-167, 2005.
- SALVINI, R., ESPOSITO, G., MASTROROCCO, G., SEDDAIU, M. Using a remotely piloted aircraft system (RPAS) to analyse the stability of a natural rock slope. In: EGU GENERAL ASSEMBLY. Vienna, 2016, v. 18, p. 4409-4416.
- SILVA, C., DUARTE, C., SOUTO, M., SANTOS, A., AMARO, V., BICHO, C., SABADIA, J. A. Avaliação da acurácia do cálculo de volume de pilhas de rejeito utilizando VANT, GNSS e LiDAR. (Accuracy volumetry evaluation of tailings using UAV, GNSS and LiDAR), Boletim de Ciências Geodésicas, v. 22, p. 73-94, 2016.
- WALTON, G., MILS, G., FOTOPOULOS, G., RADOVANOVIC, R., STANCLIFFE, R. An approach for automated lithological classification of point clouds. Geosphere, v. 12, n. 6, p. 1833-1841, 2016.
- WESTOBY, J., BRASINGTON, J., GLASSER, N., HAMBREY, M., REYNOLDS, J. Structure-From-Motion' photogrammetry: a low-cost, effective tool for geoscience applications. Geomorphology, v. 179, p. 300-314, 2012.
Publication Dates
-
Publication in this collection
Jan-Mar 2019
History
-
Received
20 Aug 2018 -
Accepted
6 Nov 2018