Abstract
Fundamental Sampling Error (FSE) is generated whenever a sample is taken from a lot of particulate material and is caused by an intrinsic characteristic of every mineral deposit: the constitutional or intrinsic heterogeneity of the ore. FSE is the only error that can never be eliminated in sampling processes, but it can be reduced to acceptable values. The optimisation of sampling protocols is based on the minimisation of FSE and is essential to reduce the deviations of grade estimates for mine planning, process control and mine-to-mill reconciliation. In order to calculate minimum sample masses and to optimise sampling protocols, heterogeneity studies have been developed. The original heterogeneity test (HT), proposed by Gy (1967) and Pitard (1993; 2009), is an experimental method of obtaining the intrinsic heterogeneity (IHL). Most of the heterogeneity studies available in Brazilian literature have been performed on gold deposits, which have higher intrinsic heterogeneity due to the nugget and cluster effects and low grades, unlike base metal deposits. Nickel ores have never been the focus of heterogeneity studies in Brazil or worldwide. Therefore, the factors that compose IHL have never been validated for nickel ores, which was the objective of this article. Based on the results of the heterogeneity test performed on a nickel ore from Niquelandia, Brazil, the standard deviations of FSE were calculated at each stage of the sampling protocol. An optimised protocol is proposed herein, in which the total deviation of FSE is below the maximum value recommended by Pierre Gy’s Theory of Sampling (TOS).
Keywords:
heterogeneity test; sampling protocol; Theory of Sampling
1. Introduction
This article presents an optimisation study at the plant feed of a nickel mine in Brazil, in order to characterise the intrinsic heterogeneity of the ore fed to the plant and to optimise the current sampling protocol by reducing the Fundamental Sampling Error to the limits recommended by Pitard (1993PITARD, F. F. Pierre Gy’s sampling theory and sampling practice: heterogeneity, sampling correctness, and statistical process control. 2nd ed. Boca Raton: CRC Press, 1993. 488p.; 2013)PITARD, F. F. Pierre Gy’s sampling theory and C.O. Ingamells’ Poisson process approach. 2009. 309 f. Doctoral thesis - Aalborg University, Esbjerg, 2009. . As previously cited, nickel ores have never been the focus of heterogeneity studies in Brazil and, therefore, the factors that compose IHL (the sampling constant K and the exponent a of d in Gy’s formula; see Equation 6) have never been validated for nickel ores. Most of the heterogeneity studies have been performed on gold deposits, with much higher variability than base metal deposits. The test proposed in this study is the standard heterogeneity test (HT) developed by Gy (1967)GY, P. M. L’Echantillonnage des minerais en vrac: théorie générale. Saint-Etienne: Société de l’Industrie Minérale, 1967. v. 1 and Pitard (1993GY, P. Sampling for analytical purposes. 2nd ed. West Sussex: Wiley, 1998. 153p.; 2009)GY, P. M. Sampling of heterogeneous and dynamic material systems: theories of heterogeneity, sampling and homogenizing. Amsterdam: Elsevier, 1992. 653p., which is the only experiment that isolates the Fundamental Sampling Error. Other tests have been proposed over the years (Minnitt, Rice & Spangenberg 2007MINNITT, R. C. A.; FRANÇOIS-BONGARÇON, D.; PITARD, F. F. Segregation free analysis for calibrating the constants K and a for use in Gy’s formula. In: WORLD CONFERENCE ON SAMPLING AND BLENDING, 5th, 2011, Santiago, Chile. Proceedings […]. Chile: Gecamin, 2011. p. 133-150.; Minnitt, 2011MINNITT, R. C. A.; RICE, P. M.; SPANGENBERG, C. Part 2: Experimental calibration of sampling parameters K and alpha for Gy’s formula by the sampling tree method. Journal of The Southern African Institute of Mining and Metallurgy, v. 107, p. 513-518, 2009.), but it was proven that their results include both the Fundamental Sampling Error and the Grouping and Segregation Error.
The current sampling protocol of the nickel plant feed includes the following stages: primary sampling, crushing, division, pulverisation and selection of an analytical sample (Figure 1). The mass of the primary sample is about 10 kg and represents an initial lot of approximately 100 tons of ore, with a nominal top size, or d95, of 5 cm. The primary sample is crushed to 0.2 cm and an aliquot of 250 g is taken for pulverisation, which reduces the size of the fragments to 0.0149 cm. Finally, an analytical sample of 0.8 g is selected from the pulverised material for nickel content determination.
The relative standard deviations of FSE in each stage of the current sampling protocol are shown in Table A1 to Table A3 of the Appendix, where the sum of the relative variances and the total relative standard deviation of the protocol are indicated in the last lines of the tables. The critical protocol stages are the ones which have a relative standard deviation sFSE higher than 10%, the maximum value recommended by Pitard (1993PITARD, F. F. Pierre Gy’s sampling theory and sampling practice: heterogeneity, sampling correctness, and statistical process control. 2nd ed. Boca Raton: CRC Press, 1993. 488p.; 2013)PITARD, F. F. Pierre Gy’s sampling theory and C.O. Ingamells’ Poisson process approach. 2009. 309 f. Doctoral thesis - Aalborg University, Esbjerg, 2009. for grade control of nickel ores. Hence, the critical stages must be adjusted so that the relative standard deviation is lowered to accepted values.
The results of the heterogeneity tests for the nickel ore, as well as the calculation of the relative standard deviations of FSE at each step of the process, allowed the optimisation of the sampling and sample preparation protocol by reducing the errors to values below the recommended limits.
2. Methodology
The constant factor of constitutional heterogeneity, IHL, can be obtained experimentally or by the multiplication of five factors, defined by Gy (1998)GY, P. Sampling for analytical purposes. 2nd ed. West Sussex: Wiley, 1998. 153p.:
where c is the mineralogic factor, l is the liberation factor, f is the shape factor, g is the granulometric factor and d is the nominal diameter or the maximum fragment diameter (d95). Due to the difficulty of estimating these factors accurately, an experimental method of obtaining IHL, referred to as the heterogeneity test (HT), was proposed by Gy (1967)GY, P. M. L’Echantillonnage des minerais en vrac: théorie générale. Saint-Etienne: Société de l’Industrie Minérale, 1967. v. 1 and Pitard (1993PITARD, F. F. Pierre Gy’s sampling theory and sampling practice: heterogeneity, sampling correctness, and statistical process control. 2nd ed. Boca Raton: CRC Press, 1993. 488p.; 2009)PITARD, F. F. Pierre Gy’s sampling theory and C.O. Ingamells’ Poisson process approach. 2009. 309 f. Doctoral thesis - Aalborg University, Esbjerg, 2009. .
The heterogeneity test was performed on three different samples from two different geological domains in Niquelandia, which are: silicate ore, oxidized ore and blended ore (Figure 2), the latter obtained from a blend of the oxidized and silicate ores in the same proportion for minimising the oscillation of the nickel content and mineralogical composition of the plant feed.
For each type of ore, a representative sample of approximately 400 kg was collected and screened using four different sieves: 9.50 mm, 6.35 mm, 4.75 mm and 3.35 mm, generating the size fractions shown in Table 1. The samples were collected on the conveyor belt after the primary crusher, with a top size of 9.5 mm. Each sample was composed of eight increments of approximately 50 kg each, collected from the stopped conveyor belt.
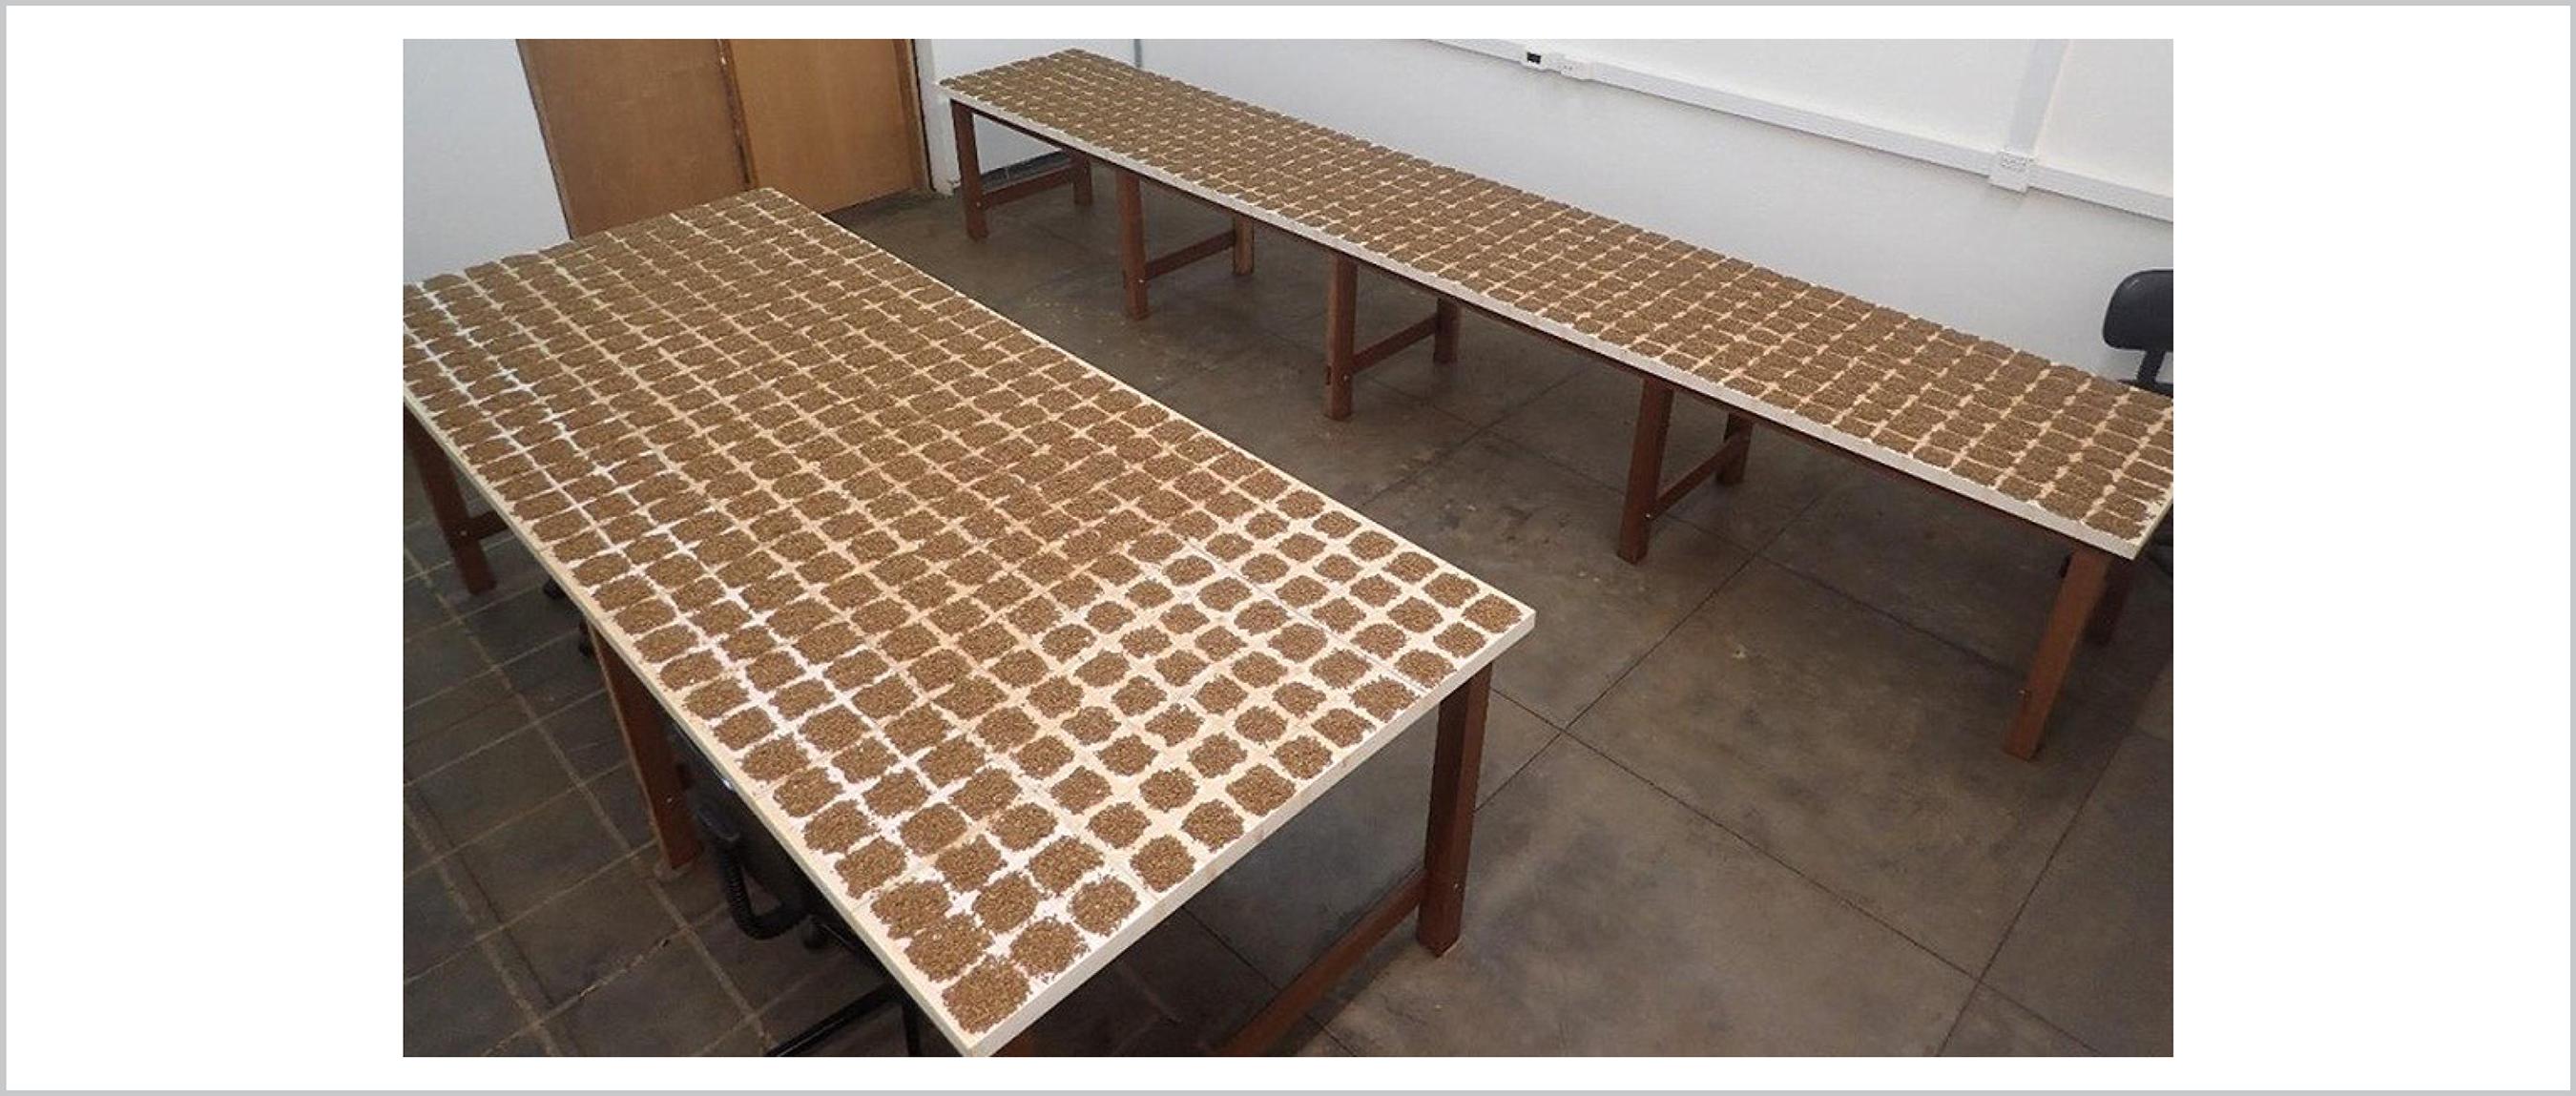
Following Bortoleto et al. (2014)BORTOLETO, D. A.; CHIEREGATI, A. C.; PEREIRA, A. H. R.; OLIVEIRA, R. C. The application of sampling theory in bauxite protocols. Revista Escola de Minas, v. 67, p. 215-220, 2014., the material of each size fraction was evenly spread on two tables where a grid was previously drawn using a tape (Figures 3, 4 and 5). The fragments were distributed in such a way that no particle stacked over others and all particles were equally accessible to be sampled.
The fine fraction was spread over two tables and divided into 744 squares of 10 cm × 10 cm (Figure 3). The intermediate fraction was spread on 384 squares of 10 cm × 10 cm (Figure 4). The coarse fraction was spread on 96 squares of 20 cm × 20 cm (Figure 5).
After spreading the material on the tables, 50 samples with 96 fragments (coarse), 384 fragments (intermediate) and 744 fragments (fine) each, collected one by one at random from each square, were selected (Figure 6). Each sample was composed of Q particles, an Mq mass and an aq average content. The 50 samples of each size fraction were then sent to the physical and chemical laboratories for mass and nickel content determination.
For a sample to be representative of the lot from which it was taken: (1) the sampling procedure must be correct, which can be done by eliminating systematic errors, and (2) the standard deviation of the Fundamental Sampling Error must be sufficiently small, which can be done by minimising random errors. Pitard (2009PITARD, F. F. Pierre Gy’s sampling theory and C.O. Ingamells’ Poisson process approach. 2009. 309 f. Doctoral thesis - Aalborg University, Esbjerg, 2009. ; 2013)PITARD, F. F. Guidelines for acceptable allotted sampling uncertainty. In: WORLD CONFERENCE ON SAMPLING AND BLENDING, 6th, 2013, Lima. Proceedings […]. Lima: Gecamin, 2013. p. 89-98. recommends the following guidelines:
-
Under no circumstances should sFSE be larger than 16% relative, since, above this value, we leave the domain of normality and slowly enter the domain of Poisson processes. All the formulas presented in the Theory of Sampling are not valid for Poisson processes.
-
A maximum relative sFSE of 16% is suggested for exploration and grade control of precious metals, trace elements and environmental sampling.
-
For exploration and grade control of base metals, and for process control in general, a maximum relative sFSE of 10% is suggested.
-
For mass or metallurgical balances, a maximum relative sFSE between 5% and 7% is suggested.
3. Results and discussion
Following Pitard (1993)PITARD, F. F. Pierre Gy’s sampling theory and sampling practice: heterogeneity, sampling correctness, and statistical process control. 2nd ed. Boca Raton: CRC Press, 1993. 488p., the estimate of the constant factor of constitutional heterogeneity, EST.IHL, was calculated for each size fraction, according to Equation 2:
where Mq is the mass of each group or sample of Q fragments, aq is the nickel content of each sample, MQ is the total mass submitted to the test and aQ its average content. The granulometric factor g is 0.55, defined by Gy (1992)GY, P. M. Sampling of heterogeneous and dynamic material systems: theories of heterogeneity, sampling and homogenizing. Amsterdam: Elsevier, 1992. 653p. for calibrated or screened material. MQ and aQ were calculated according to Equations 3 and 4:
The result of the heterogeneity test allows the correlation of the material’s nominal diameter with the constant factor of constitutional heterogeneity, IHL. The nominal diameter is calculated according to Equation 5:
where d1 and d2 are the openings of the sieves used for screening the material. The values of EST.IHL for each nominal diameter are shown in Table A4 in the Appendix Appendix Table A1 Current protocol - silicate ore. Current protocol - silicate ore Initial mass (g) Final mass (g) dN (cm) IHL (g) Rel. var. (s2FSE) Rel. dev. (sFSE rel) 1. Primary sampling 100, 000,000 10,000 5.0 9,52x10^+02 0.095247 30.86% 2. Primary crushing 10,000 10,000 0.2 3,13x10^-03 0.000000 0.00% 3. Division 10,000 250 0.2 3,13x10^-03 0.000012 0.35% 4. Pulverization 250 250 0.0149 1,18x10^-07 0.000000 0.00% 5. Selection of analytical sample 250 0.8 0.0149 1,18x10^-07 0.000000 0.04% TOTAL (s2FSE) 0.095259 30.86% Table A2 Current protocol - oxidized ore. Current protocol - oxidized ore Initial mass (g) Final mass (g) dN (cm) IHL (g) Rel. var. (s2FSE) Rel. dev. (sFSE rel) 1. Primary sampling 100,000,000 10,000 5.0 1,38x10^+03 0.138435 37.21% 2. Primary crushing 10,000 10,000 0.2 1,27x10^-03 0.000000 0.00% 3. Division 10,000 250 0.2 1,27x10^-03 0.000005 0.22% 4. Pulverization 250 250 0.0149 1,72x10^-08 0.000000 0.00% 5. Selection of analytical sample 250 0.8 0.0149 1,72x10^-08 0.000000 0.01% TOTAL (s2FSE) 0.138440 37.21% Table A3 Current protocol - blended ore. Current protocol - blended ore Initial mass (g) Final mass (g) dN (cm) IHL (g) Rel. var. (s2FSE) Rel. dev. (sFSE rel) 1. Primary sampling 100,000,000 10,000 5.0 8,30x10^+02 0.083029 28.81% 2. Primary crushing 10,000 10,000 0.2 3,34x10^-03 0.000000 0.00% 3. Division 10,000 250 0.2 3,34x10^-03 0.000013 0.36% 4. Pulverization 250 250 0.0149 1,48x10^-07 0.000000 0.00% 5. Selection of analytical sample 250 0.8 0.0149 1,48x10^-07 0.000000 0.04% TOTAL (s2FSE) 0.083042 28.82% Table A4 IHL related to each size fraction. Fraction (mm) Nominal diameter (cm) IHL - silicate ore IHL - oxidized ore IHL - blended ore <4.75>3.35 mm 0.417 0.0636 0.0405 0.0675 <6.35>4.75 mm 0.566 0.146 0.0673 0.135 <9.50>6.35 mm 0.823 0.894 0.725 0.903 Table A5 Optimised protocol - silicate ore. Suggested protocol - silicate ore Initial mass (g) Final mass (g) dN (cm) IHL (g) Rel. var. (s2FSE) Rel. dev. (sFSE rel) 1. Primary sampling 100,000,000 100,000 5.0 9.53x10^+02 0.009516 9.76% 2. Primary crushing 100,000 100,000 1.25 4.14x10^+00 0.000000 0.00% 3. Secondary crushing 100,000 100,000 0.20 3.13x10^-03 0.000000 0.00% 4. Division 100,000 250 0.20 3.13x10^-03 0.000012 0.35% 5. Pulverization 250 250 0.0149 1.18x10^-07 0.000000 0.00% 6. Selection of analytical sample 250 0.8 0.0149 1.18x10^-07 0.000000 0.04% TOTAL (s2FSE) 0.009529 9.76% Table A6 Optimised protocol - oxidized ore. Suggested protocol - oxidized ore Initial mass (g) Final mass (g) dN (cm) IHL (g) Rel. var. (s2FSE) Rel. dev. (sFSE rel) 1. Primary sampling 100,000,000 140,000 5.0 1.38x10^+03 0.009875 9.94% 2. Primary crushing 140,000 140,000 1.25 3.48x10^+00 0.000000 0.00% 3. Secondary crushing 140,000 140,000 0.20 1.27x10^-03 0.000000 0.00% 4. Division 140,000 250 0.20 1.27x10^-03 0.000005 0.23% 5. Pulverization 250 250 0.0149 1.72x10^-08 0.000000 0.00% 6. Selection of analytical sample 250 0.8 0.0149 1.72x10^-08 0.000000 0.01% TOTAL (s2FSE) 0.009880 9.94% Table A7 Optimised protocol - blended ore. Suggested protocol - blended ore Initial mass (g) Final mass (g) dN (cm) IHL (g) Rel. var. (s2FSE) Rel. dev. (sFSE rel) 1. Primary sampling 100,000,000 100,000 5.0 8.30x10^+02 0.008295 9.11% 2. Primary crushing 100,000 100,000 1.25 3.94x10^+00 0.000000 0.00% 3. Secondary crushing 100,000 100,000 0.20 3.34x10^-03 0.000000 0.00% 4. Division 100,000 250 0.20 3.34x10^-03 0.000013 0.36% 5. Pulverization 250 250 0.0149 1.48x10^-07 0.000000 0.00% 6. Selection of analytical sample 250 0.8 0.0149 1.48x10^-07 0.000000 0.04% TOTAL (s2FSE) 0.008309 9.12% .
The results of the tests are presented on a di-log graph, correlating the fragment nominal diameter with IHL, as shown in Figure 7 and according to Equation 6:
where K is a constant specific to a given ore type at a given grade (Minnit, Rice & Spangenberg, 2009MINNITT, R. C. A.; RICE, P. M.; SPANGENBERG, C. Part 2: Experimental calibration of sampling parameters K and alpha for Gy’s formula by the sampling tree method. Journal of The Southern African Institute of Mining and Metallurgy, v. 107, p. 513-518, 2009.) and a is a parameter unique to every ore type. Both sampling parameters K and a indicate the amount of constitutional heterogeneity of the ore and can be derived from the regression line passing through the three results of EST.IHL for each type of ore. The higher the values of K and a, the greater the heterogeneity of the ore.
The equations of the regression lines shown in Figure 7, on a bi-log graph, can be expressed as Equation 7 for the silicate ore, Equation 8 for the oxidized ore, and Equation 9 for the blended ore:
These equations represent the calibration of the sampling constants K and a by the heterogeneity test, a more accurate method than the application of Gy’s factors (c, l, f, and g). As expected, the value of the constant K for the blended ore was intermediate to the values of the individual ores, and the value of the constant a was lower than both values of the individual ores, proving the advantages of blending different types of ore to reduce the heterogeneity and, consequently, the grade oscillation in the plant feed.
3.1 Optimised sampling protocol
In order to evaluate if the nickel sampling protocol is suitable for the plant feed samples, the standard deviations of the Fundamental Sampling Error at each of its stages were quantified, from the primary sampling stage to the selection of the analytical sample. The relative variance of the Fundamental Sampling Error is calculated by Equation 10, while the relative standard deviation is calculated by Equation 11.
Each step of the protocol must present a relative standard deviation below the maximum value of 10% for grade control of base metals, such as nickel ore, as recommended by Pitard (1993PITARD, F. F. Pierre Gy’s sampling theory and sampling practice: heterogeneity, sampling correctness, and statistical process control. 2nd ed. Boca Raton: CRC Press, 1993. 488p.; 2013)PITARD, F. F. Guidelines for acceptable allotted sampling uncertainty. In: WORLD CONFERENCE ON SAMPLING AND BLENDING, 6th, 2013, Lima. Proceedings […]. Lima: Gecamin, 2013. p. 89-98..
In order to reduce the total relative standard deviations of FSE, a larger primary sample mass must be collected for the three ore types. It is also recommended to add a new crushing stage at the laboratory to diminish the size reduction ratio to 4. The optimised sampling protocols for each type of ore are shown in Tables A5 to A7 Appendix.
For the silicate ore, the increase in mass of the primary sample from 10 kg to 100 kg reduced the relative standard deviation of FSE from 30.86% to 9.76%. For the oxidized ore, the increase in mass of the primary sample from 10 kg to 140 kg reduced the relative standard deviation of FSE from 37.21% to 9.94%. For the blended ore, the increase in mass of the primary sample from 10 kg to 100 kg reduced the relative standard deviation of FSE from 28.81% to 9.11%.
3.2 Minimum sample masses
The calibration of IHL by the heterogeneity test is essential to estimate correct minimum sample masses. This statement can be proved when comparing the minimum primary sample masses calculated by Equation 10 using the calibrated IHL (Equation 6), with the same masses calculated using Gy’s factors (Equation 1). The results are shown in Table 2, considering the maximum standard deviation of FSE 10% and the following factors: r = 2.5 (garnierite density), g = 0.25 (uncalibrated material, i.e., product of the crushing stage), l = 0.2 (Pitard, 1993PITARD, F. F. Pierre Gy’s sampling theory and sampling practice: heterogeneity, sampling correctness, and statistical process control. 2nd ed. Boca Raton: CRC Press, 1993. 488p.) and f = 0.5 (Pitard, 1993PITARD, F. F. Pierre Gy’s sampling theory and sampling practice: heterogeneity, sampling correctness, and statistical process control. 2nd ed. Boca Raton: CRC Press, 1993. 488p.).
As a result of applying factors for calculating the intrinsic heterogeneity of the lot, the minimum sample masses are underestimated, which would most likely cause losses to the operation, as a consequence of the poor precision of the nickel content estimates from the plant feed samples.
4. Conclusions
The Fundamental Sampling Error, generated in all stages of sampling and sample preparation protocols, is specifically related to the constitutional heterogeneity of the ore and is the only error that never cancels. In other words, it is the smallest error when sampling is conducted under optimum conditions (Chieregati, 2007CHIEREGATI, A. C. Reconciliação pró-ativa em empreendimentos mineiros. 2007. 201 f. Tese (Doutorado em Engenharia) - Escola Politécnica, Universidade de São Paulo, 2007. ).
Based on guidelines recommended by Pitard (2009PITARD, F. F. Pierre Gy’s sampling theory and C.O. Ingamells’ Poisson process approach. 2009. 309 f. Doctoral thesis - Aalborg University, Esbjerg, 2009. ; 2013)PITARD, F. F. Guidelines for acceptable allotted sampling uncertainty. In: WORLD CONFERENCE ON SAMPLING AND BLENDING, 6th, 2013, Lima. Proceedings […]. Lima: Gecamin, 2013. p. 89-98. and knowing that the objective of the sampling process presented herein is grade control and reconciliation of nickel ore, a base metal, a maximum relative standard deviation of the Fundamental Sampling Error of 10% is recommended.
The objective of this study was to quantify the intrinsic heterogeneity of the ore by the heterogeneity test and optimise the sampling and sample preparation protocols, ensuring that a maximum relative standard deviation of FSE is generated in each step of the protocol. When increasing the mass of the primary sample to 100 kg for the silicate and blended ores, and to 140 kg for the oxidized ore, the relative standard deviations of FSE are significantly reduced, reaching acceptable values and guaranteeing that the samples are sufficiently representative of the initial lot.
Improvements in mining processes generally do not happen without increasing costs, in this case, it was due to the larger primary sample mass and to the inclusion of an extra crushing stage in the physical laboratory. However, such costs will certainly be compensated by guaranteeing the sample representativeness and, consequently, by increasing the reliability of nickel content estimates, which are essential for effective mine planning, process control and mine-to-mill reconciliation.
Appendix
References
- BORTOLETO, D. A.; CHIEREGATI, A. C.; PEREIRA, A. H. R.; OLIVEIRA, R. C. The application of sampling theory in bauxite protocols. Revista Escola de Minas, v. 67, p. 215-220, 2014.
- CHIEREGATI, A. C. Reconciliação pró-ativa em empreendimentos mineiros 2007. 201 f. Tese (Doutorado em Engenharia) - Escola Politécnica, Universidade de São Paulo, 2007.
- GY, P. Sampling for analytical purposes 2nd ed. West Sussex: Wiley, 1998. 153p.
- GY, P. M. L’Echantillonnage des minerais en vrac: théorie générale. Saint-Etienne: Société de l’Industrie Minérale, 1967. v. 1
- GY, P. M. Sampling of heterogeneous and dynamic material systems: theories of heterogeneity, sampling and homogenizing. Amsterdam: Elsevier, 1992. 653p.
- MINNITT, R. C. A.; FRANÇOIS-BONGARÇON, D.; PITARD, F. F. Segregation free analysis for calibrating the constants K and a for use in Gy’s formula. In: WORLD CONFERENCE ON SAMPLING AND BLENDING, 5th, 2011, Santiago, Chile. Proceedings […] Chile: Gecamin, 2011. p. 133-150.
- MINNITT, R. C. A.; RICE, P. M.; SPANGENBERG, C. Part 2: Experimental calibration of sampling parameters K and alpha for Gy’s formula by the sampling tree method. Journal of The Southern African Institute of Mining and Metallurgy, v. 107, p. 513-518, 2009.
- PITARD, F. F. Pierre Gy’s sampling theory and sampling practice: heterogeneity, sampling correctness, and statistical process control. 2nd ed. Boca Raton: CRC Press, 1993. 488p.
- PITARD, F. F. Pierre Gy’s sampling theory and C.O. Ingamells’ Poisson process approach 2009. 309 f. Doctoral thesis - Aalborg University, Esbjerg, 2009.
- PITARD, F. F. Guidelines for acceptable allotted sampling uncertainty. In: WORLD CONFERENCE ON SAMPLING AND BLENDING, 6th, 2013, Lima. Proceedings […] Lima: Gecamin, 2013. p. 89-98.
Publication Dates
-
Publication in this collection
17 Apr 2020 -
Date of issue
Apr-Jun 2020
History
-
Received
24 Mar 2019 -
Accepted
03 Oct 2019