Abstract
The work analyzes the political/institutional links and technological formats of agroforestry systems in the Caí and Taquari river valleys of the Brazilian state of Rio Grande do Sul in an effort to determine a value for their ability to endure: their sustainability. Sustainability indicators are created for the analysis of these systems. The indicator values will be used to create a Sustainability Index (SI) for each studied agroforestry system and to identify each system’s sustainability pattern. The different agroforestry systems will also be classified according to their structural characteristics. Analysis of the identified patterns and indexes will reveal the adequacy of the methodology employed and the consequence of each system’s institutional arrangement, technological format, and sustainability pattern. The agro forestry system that combines exotic forest species with watermelon and the system that combines native forest species with citrus fruit stand out as being most sustainable while, from an institutional perspective, those systems that were linked in an "associative" arrangement had the highest sustainability index values.
Agroforestry Systems; Institutional Arrangements; Sustainability Indicators
Methodology for comparative analysis of sustainability in agroforestry systems
Saulo Barbosa LopesI; Jalcione AlmeidaII
IForest engineer, Master Scientist in Rural Development; Researcher, Rio Grande do Sul Zoo Botanic Foundation. E-mail: jbotanico@fzb.org.br
IIAgricultural engineer, sociologist, teacher, and researcher, Masters Program Rural Development (PGDR) and Agronomy, Federal University of Rio Grande do Sul (UFRGS). E-mail: jal@ufrgs.br
ABSTRACT
The work analyzes the political/institutional links and technological formats of agroforestry systems in the Caí and Taquari river valleys of the Brazilian state of Rio Grande do Sul in an effort to determine a value for their ability to endure: their sustainability. Sustainability indicators are created for the analysis of these systems. The indicator values will be used to create a Sustainability Index (SI) for each studied agroforestry system and to identify each systems sustainability pattern. The different agroforestry systems will also be classified according to their structural characteristics. Analysis of the identified patterns and indexes will reveal the adequacy of the methodology employed and the consequence of each systems institutional arrangement, technological format, and sustainability pattern. The agro forestry system that combines exotic forest species with watermelon and the system that combines native forest species with citrus fruit stand out as being most sustainable while, from an institutional perspective, those systems that were linked in an "associative" arrangement had the highest sustainability index values.
Key words: Agroforestry Systems, Institutional Arrangements, Sustainability Indicators.
1. Introduction
Debate about sustainability always includes a discussion of agriculture and environmental conservation, unavoidably making agricultural production methods a major focus while bypassing the concern of agricultural producers: can your sustainability sustain us and our way of life1 1 For more details on the treated theme in the small space of this article, see Lopes (2001). .
This work examines the comparative sustainability of agricultural production systems, particularly agroforestry systems, and the institutional arrangements through which those productive systems are conceived, implemented, and developed. The object of this paper is to analyze (a) the systems of sustainable agroforestry that exist in the study area and (b) the influence of the technological patterns and institutional arrangements on the development, operation, and sustainability of these systems.
The empiric area of study includes the Caí and Taquari river valleys in the metropolitan area of Porto Alegre, Rio Grande de Sur, Brazil, the first area in Brazil colonized by Germans. These German settlers farmed using traditional agricultural systems based on deforestation, abundant land, and the long term multi-copping of subsistence foods. In the 1970s, this area underwent intense industrializing, which caused changes in the social, economic, and environmental conditions.
According to Schneider (1994), the expansion of the leather-shoe industry in the 1970s quickly urbanized this rural area, creating a local market of products, services, and employment. With that, entirely new flows of inputs, products, and work processes were generated and a new set of cultural and community values were created (a process called "diffuse" industrialization by some authors).
Over this period of industrialization, open space was converted to perennial crops, such as fruit, lumber and lumber products, and flowers and ornamental plants. This change in agricultural production was brought about in a search for improved income though product diversification, to meet the demand that negative environmental impacts be lessened (such as a decrease in soil fertility, destruction of natural resources, environmental degradation, and negative effects on the farmers' and his familys health), and as an adaptation to deteriorating conditions in the agricultural sector. Among the regions new agricultural productive systems, agroforestry stands out.
Agroforestry uses less labor than most other agricultural pursuits. This permits an increase in the local labor forces availability for industrial work and the continued maintenance of a profitable primary activity. Agro-foresters are then able to maintain the characteristic social and cultural traditions of family agriculture while using less of their and others time, and time had become more valuable commodity.
The main agroforestry systems developed in this region make use of several crop combinations: (a) exotic forest species (acacia, eucalyptus) + subsistence crop cultivation (corn, bean, cassava, English potato); (b) exotic forest species + watermelon; (c) exotic forest species + cattle; (d) citrus fruits + forest species; (e) citrus fruits + subsistence crop cultivation; and (f) Yerba mate + subsistence crop cultivation. Though political considerations affect each of these agroforestry systems, they are implanted and developed through three basic types of institutional arrangement.
Individual arrangement: in this type of business arrangement, producers operate individually, without obligations to any company, association, or cooperative. This option is generally associated with the producers belief that he can obtain a larger number of economic, productive, or social advantages through direct control of production, sales, and timing, while maintaining freedom in the development of productive systems and flexibility in relations with suppliers, buyers, and banks.
In this arrangement, the relationships that most influence productive decisions are those within the family and with neighbors. When the decisions are of more universal importance, the producer also turns to friends, his group or club, his church, or occasionally, to municipal public powers, technical advisers, and the social workers of EMATER-RS. There are also cases of family farmers that have a rich net of commercial relationships or have a relative who has the knowledge needed to give direction to the initial productive arrangement. These cases are generally related to above average family capitalization that permits the children's technical education and increased spending for production technology and increased scale
Integrated arrangement: in this business arrangement, producer strategies are influenced by an outside agro-industrial concern that supplies or subsidizes farm inputs and technical assistance and, in compensation, receives some determined portion of the farms production. Industries that have entered into this type of arrangement include Seta and Tanac, tannin extraction concerns, Riocell, a producer of cellulose and paper, Satipel, a eucalyptus lumber miller, and some citrus fruit processors.
The integrated arrangement begins with a network of relationships that is basically agro- industrially oriented and, as such, is directed by the needs of industrial producers to meet their markets demands. Industrial orientation is reflected in the agroforestry productive systems by the demands of quali-quantitative industrial requirements. In the cases of a growing number of industrial companies, production is affected by the markets demand for superior quality and concern for environmental and social conditions (mainly in the case of sellers into the international forest products markets, which often necessitates some of form of lumber certification). These market demands condition the production patterns followed by the basic input producers.
Associative arrangement: in this type of business arrangement, individual producers are united in associations or cooperatives. The reasons for uniting with this type of organization vary according to the producers individual vision and the organizations basic philosophy and verified results.
The decision to join this type of business arrangement rather than one of the other types arises from the producers broader needs; needs which are not met by production and distribution improvements alone. Given the great range of cooperative organizations, the actual relationship between producer and organization is determined by their needs and strategies at the specific moment of union. The extended needs thought to be met by associating with a cooperative are linked with the producers desire for an improved quality of life (a fundamental tenant of the associative philosophy), increased political strength, and the sense of being part of a culturally similar group.
Commonly, cooperatives are greatly affected by pubic powers, notably municipal city halls, official technical assistance organs (EMATER-RS), wholesalers, such as CEASA, and CEAGE-SP, research institutions, universities, non-government institutions, buyers, and vendors. The advantages of affiliation with an associative organization are improved product commercialization, more available technical attendance, lower cost acquisition of inputs and equipment, and better access to credit and social assistance (health, education, and welfare).
2. Methodology
Analysis of the agroforestry systems under study was conducted as follows.
-
A general characterization of the area of study was made using available secondary data from public institutions (IBGE, Foundation of Economy and Statistics of Rio Grande do Sul (FEE), EMATER, others) and the materials and resources of institutions directly linked with the producers under study (associations, cooperatives, companies, or public powers);
-
A characterization of the structures, operations, and production systems employed by the 40 studied family agroforestry establishments aided by structured interviews with these units owners and semi-structured interviews with 15 mediators linked to the institutional objective of this research, between the months of June and July 2000;
-
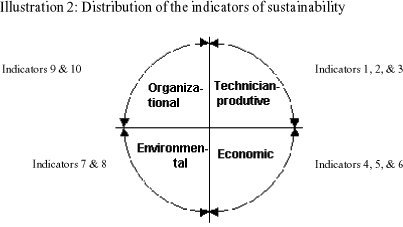
The construction of a graph of the values of the indicators used to measure the quali-quantitative aspects of each agroforestry system. These aspects are related to the studied units productive, economic, environmental, and organizational practices. Each graph is composed of ten sustainability indicators (Box and illustration 1), the value of each being the harmonic average of its descriptors values.
-
The calculation of each units Sustainability Index (SI), which is the harmonic average of the values registered for each indicator (standardized) by each producing unit. The graphs axes correspond to the indicators, with the indicators value determining the point of intersection between graph line and axis. Higher indicator values indicate higher sustainability values (Illustration 1), and the harmonic average of the standardized registrations of all indicators will be the SI value.
-
The classification of the units of production into groups by agroforestry system practiced and by institutional arrangement, for later comparative analysis.
-
A comparative analysis beginning with the indexes and sustainability patterns presented by the production units to determine if the sustainability patterns verified are related to institutional arrangement and to better understand the influences of technology and productive practices.
Each of the indicators chosen for this analysis can be linked with one of four aspects of sustainability, as shown in Illustration 2:
3. Results
Results for Agroforestry Systems
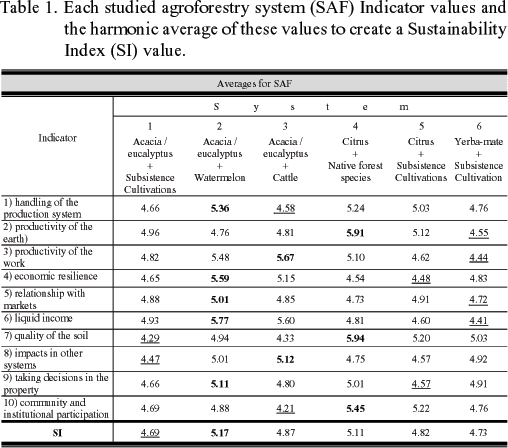
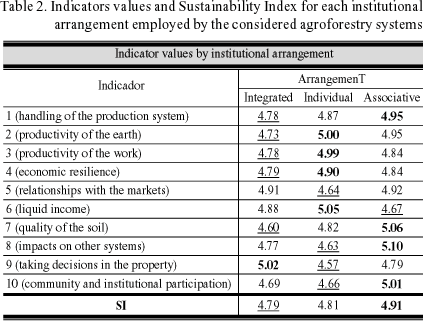
Table 1 shows the indicators values for each of the studied agroforestry systems. The averages in boldface are maximum indicator values and the underlined values are the minimum indicator values. The last line gives the harmonic average of all indicator values for each system: the systems Sustainability Index (SI).
It is noted that, while the minimum values of each indicator are relatively well distributed among the studied systems, the highest values are concentrated in three systems. These systems also have the higher Sustainability Indexes.
Although the SI values for each system show little differentiation, the sustainability patterns are shown to be extremely differentiated. Each of the studied systems presents strength in different aspects of sustainability as defined by this study.
In general, while a high value for the harmonic average of the indicators of sustainability, expressed as the Sustainability Index (SI), is a sign of more likely system sustainability, it is also assumed that the more balanced the values of the different indicators, the more sustainable the system.
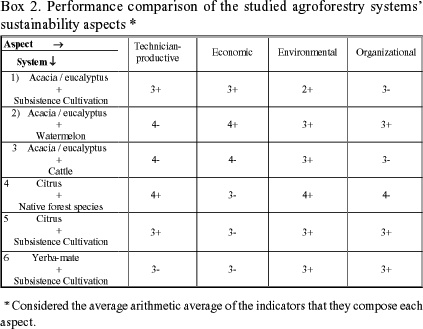
a. Agroforestry system 1: Acacia / Eucalyptus + Subsistence Cultivations

In this graph, we see that system 1s strongest indicators are 6 (liquid income), 2 (productivity of the earth), and 5 (relationships with markets) with the 9th indicator (taking decisions in the property) also presenting a significant value. Indicators 7 (quality of the soil) and 8 (impacts on other systems) show this systems smallest values. The indicator values imply that the system is sustained more by its technician-productive and economic aspects while its organizational and environmental aspects weak.
This agroforestry system has the most critical [lowest] sustainability index among the studied systems. The values of the systems indicators are generally low: its two highest indicator values are only average, and its environmental quadrants indicators (7 & 8) are the lowest among the studied systems.
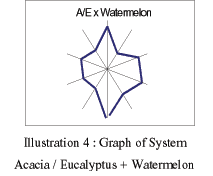
b. Agroforestry system 2: Acacia / Eucalyptus + Watermelon
As it is observed in the graph to the side, the indicators that stand out positively are 1 (handling of the production system), 3 (productivity of the work), 4 (economic resilience) and 6 (liquid income) while the ones that indicate poor performance are 2 (productivity of the earth), 7 (quality of the soil) and 10 (community and institutional participation).
This system has highest Sustainability Index and presents the best general performance among the studied agroforestry systems. It has five of the ten highest indicator values and none of the lowest values (Table 1 and Illustration 4). Even this systems weak indicators present medium to superior values when compared to the values of the other systems indicators, and its more significant registrations, those on which the systems sustainability pattern is "anchored," are well distributed among the four considered aspects.
This systems performance is largely due to the values presented by the three indicators in the economic quadrant, the highest of all the systems studied. Also presenting high values are indicators 1 (handling of the production system), 8 (impacts on other systems) and 9 (taking decisions in the property). The two indicators in the economic quadrant and the three cited in the preceding sentence have the greatest influence on this systems pattern and its Sustainability Indexs value.
c. Agroforestry system 3: Acacia / Eucalyptus + Cattle

This systems strong points are found in indicators 2 (productivity of the earth), 3 (productivity of the work), 4 (economic resilience), 6 (liquid income), and 8 (impacts on other systems). Its weakest points are found in indicators 1 (handling of the production system), 5 (relationships with the markets), 7 (quality of the soil), and 10 (community and institutional participation).
We can see that the system possesses a certain balance with a slight tilt toward the indicators in the technician-productive-economic hemisphere; though, there are some contradictions. This system has the studys highest registrations for indicators 3 (productivity of the work) and 8 (impacts in other systems) and the lowest registrations for indicators 1 (handling of the production system) and 10 (community and institutional participation). The systems Sustainability Index was of medium value, above the SI value of three studied systems and below the SI value of the two others.
d. Agroforestry system 4: Citrus + Native Forest Species

Indicators 2 (productivity of the earth), 7 (quality of the soil), and 10 (community and institutional participation) stood out positively in this system. Indicators 4 (economic resilience), 5 (relationships with the markets) and 6 (liquid income) can be considered weak. In a general way, most of this systems indicators present important values. Its strongest points have the studys highest relative registrations and are in three of the four aspects of sustainability. The system shows slight weakness in its economic aspect but it still has second highest sustainability index among the studied systems.
The system also introduces the second smallest relative value for indicator 5 (relationships with the markets), which, when taken together with the low and medium registrations of the other two indicators in its economic quadrant, indicates that this systems economic orientation is the weakest link in its sustainability pattern.
e. Agroforestry system 5: Citrus + subsistence Cultivation

The strong points of this agroforestry system are found in indicators 2 (productivity of the earth), 5 (relationships with the markets), 7 (quality of the soil). Its weakness is shown in indicators 6 (liquid income), 8 (impacts on other systems) and 9 (taking decisions in the property).
None of this systems sustainability indicator values were the relative highest in our study, and indicators 4 (economic resilience) and 9 (taking decisions in the property) presented the lowest values for these indicators. The systems Sustainability Index value was neither particularly high nor low. Its strong and weak points were well distributed among four sustainability aspects, making it the most well balanced of all the studied systems.
f.. Agroforestry system 6: Yerba mate + subsistence Cultivations

Indicators 4 (economic resilience), 7 (quality of the soil), 8 (impacts in other systems) and 9 (taking decisions in the property) present the most significant (larger) indicator values in this system. The systems weak points are found in indicators 2 (productivity of the earth), 3 (productivity of the work) 5 (relationships with the markets), and 6 (liquid income), all showing the lowest values for these indicators among the six studied agroforestry systems. This systems strongest indicators are only of average strength.
It can also be observed that this system conforms to a "graphic pattern" in which indicators in the organizational and environmental quadrants (organizationalenvironmental hemisphere) stand out positively. These indicators are relatively high and balanced. Indicator values in this systems economic and technician-productive quadrants (economictechnician-productive hemisphere) are medium to very weak.
Box 2, below, gives a performance comparison of the studied agroforestry systems four aspects of sustainability.
Results for Institutional Arrangements
Table 2 shows the indicators values for each of the studied institutional arrangements. The maximum values of each indicator are in boldface and the minimum values of each indicator are underlined. The last line contains the Sustainability Index for each one of the studied arrangements, which is the harmonic average of each institutional arrangements indicator values.
It is observed that the highest indicator values are relatively well distributed by institutional arrangement. The Integrated arrangement has the highest concentration of the lowest indicator values and, for this reason, has the lowest SI value of all institutional arrangements. However, this arrangement presents the highest registration for indicator 9 (taking decisions in the property).
The Individual arrangement is extremely unbalanced: it registers the highest values for four indicators, all in the technician-economic hemisphere; and the lowest values for four other indicators, three of which in the environmental quadrant. This arrangement has a SI value that is slightly above the Integrated arrangements and below the Associative arrangements.
The Associative arrangement presents four of the maximum indicator registrations, distributed in three of the four considered aspects. It also has the lowest value for indicator 6 (liquid income). This arrangement has the highest SI value of the three studied arrangements.
a. Integrated Institutional arrangement
In the graph to the side and with the aid of the Table 2, we see that this arrangements strongest points are found in its economic indicators, 4 (economic resilience), 5 (relationships with the markets), and 6 (liquid income), and indicator 9 (taking decisions in the property). The arrangements weakest indicators are 7 (quality of the soil), 8 (impacts on other systems) and 10 (community and institutional participation).This arrangement has lowest SI value of all those studied: 4.79.
This arrangements best indicator registrations are, in the majority, lower than the same indicator values in the other arrangements, and it has the lowest values for five of the ten indicators. The lowest indicator performances of this arrangement are in the technician-productive and environmental quadrants. Surprisingly, this arrangement obtains the studys highest registration for indicator 9 (taking decisions in the property). T
The general weakness in the sustainability of this arrangement is made clear by its graphic representation (Illustration 9). In the graph, indicator 4 (economic resilience) is shown to be one of the arrangements stronger points, although, its registration is the smallest for this indicator among the three studied institutional arrangements
b. Individual Institutional arrangement

Indicators 1 (handling of the production system), 2 (productivity of the earth), 3 (productivity of the work), 4 (economic resilience), and 6 (liquid income) are the most prominent in the graph of this arrangements indicator values. Indicators 5 (relationships with the markets), 8 (impacts on other systems), 9 (taking decisions in the property) and 10 (community and institutional participation) are its most critical and weakest points.
We see that all indicators in this arrangements technician-productive quadrant present important values, making this the systems strongest aspect. Two indicators in this quadrant, 2 (productivity of the earth) and 3 (productivity of the work), register the highest values for these indicators among the studied arrangements.
Two indicators in this arrangements economic quadrant, indicators 4 (economic resilience) and 6 (liquid income), also have the highest relative registrations. The low value for economic indicator 5 (relationships with the markets), the lowest for this indicator in our study, highlights a weakness in this arrangements economic aspect. The two indicators in this arrangements organizational quadrant also had the lowest values for these indicators among the studied arrangements.
The combination of high and low indicator values in this arrangement create a Sustainability Index of intermediate value (4.81) when compared with the other studied arrangements
c. Associative Institutional arrangement
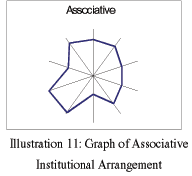
As seen in the graph to the side and by the values presented in Table 2, this arrangements strongest indicators are 1 (handling of the production system), 2 (productivity of the earth), 5 (relationships with the markets), 7 (quality of the soil), 8 (impacts on other systems), and 10 (community and institutional participation). Indicator 6 (liquid income) can be considered the most critically damaging to the sustainability of this arrangement.
The Associative institutional arrangement is very balanced, although it shows its greatest strength in the environmental quadrants variables. This arrangement contains the largest number (5) of maximum indicator registrations; and they are well distributed, appearing in three of the four considered aspects of sustainability.
Due to this convergence of admirable factors, the associative arrangement presents the highest Sustainability Index of all studied arrangements. In this arrangement, only indicator 6 (liquid income) presents weaknesses, as its value is the lowest for this indicator in the institutional arrangement segment of our study.
Indicator 9 (taking decisions in the property) presents a medium value. This was surprising, as we had expected that this arrangement would show the best performance in this indicator due to its well expressed organization characteristics, confirmed by the good performance registered by indicator 10 (community and institutional participation).
In Box 3 below, a performance comparison is made among the studied institutional arrangements four aspects of sustainability.
4. Considerations on the methodology and the indicators
To facilitate comparisons among systems, the methodology we use generates a numeric index as a function of the chosen indicators and local factors. An examination of the studys results then tempts one to affirm that one system is more or less sustainable than another. However, if other indicators were chosen, the results may have been significantly different, even to the extent of complete reversal. A system that appears sustainable if examined using one combination of indicators, need not using another combination. There is also the temptation to create a very large number of indicators, but, due to data collection, segregation, comparison, and analysis difficulties, it is unlikely that this would improve the studys usefulness or aid in the creation of public policies to reinforce general agrarian or specific production systems2 2 It is the case of some studies where the obtaining of the sustainability index pure is and simply privileged, without a larger concern of, as it is made her in this work, to explicite and to analyze the relationships among the indicators and enter the descriptors. .
To obtain an index that is a close reflection of reality and to give a more complete evaluation of sustainability, it is appropriate to use an index of indicators that are generated by composed related variables since a larger number of variables can be introduced. On the other hand, the creation of an index made up of these related indicators hinders more punctual analyses of individual variables and/or attributes of sustainability and makes the creation and monitoring of targets for specific variables difficult.
It is also noted that the tendency to affirm that one production system is better than another based only on the value of any quantitative sustainability index may be a mistake. Local economic, environmental, and organizational factors influence the formation of sustainability patterns. These local factors, their conditions, and their combinations are site specific. What may be sustainable in one locale may not be in another. The quantitative value of a universally applied index that indicates system sustainability in one region may lead to the erroneous assumptions about the same systems success in another region. A system with low sustainability index values that is adapted to specific local and regional conditions may generate a more harmonic, balanced sustainability pattern that perhaps more closely approaches the global conception of sustainability than a system that shows high index values obtained using artifice to transform qualitative attributes into quantities3 3 The notion of "sustainability contexts" (Gliessman, 2000) it is useful when we intend to consider the adaptation of the productive systems to the agroecologic and socioeconomic local conditions. .
The creation a sustainability index and the evaluation of system sustainability are also conditioned a priori by the analysts notion of sustainability, starting from the choice of variables and their composition in the indicators. The realities to be studied and the comparisons that will be made affect the analysts choice of variables. The analysts sensitivity and knowledge will affect the creation of all indices making the indices themselves more subjective than their results absolute numbers can indicate.
5. About the agroforestry systems and the institutional arrangements
We saw that the systems sustainability patterns are very differentiated. Each agroforestry system had its own strengths, weaknesses, and pattern of sustainability. The Acacia / Eucalyptus + watermelon, Citrus + native forest species, and Acacia / Eucalyptus + cattle systems presented the best results, followed closely by the Citrus + subsistence cultivations system. These systems not only present higher Sustainability Indexes but also show more balanced patterns than the other studied systems.
The acacia systems noted in the paragraph above have been in practice for almost a century. Under the specific local conditions, the three traditional agroforestry systems show the largest number of favorable conditions for long term maintenance of all studied systems: they have been adapted to best succeed in their environment and show the highest Sustainability Indexes. However, the newly developed Citrus + native forest species system, in existence for less than ten years, also shows indicator values that are balanced among the four aspects of sustainability and achieved our studys second highest SI value, demonstrating that its has excellent potential for sustainability. This system is adapted to the socio-cultural environment in which it was developed and is productively efficient, economically viable, and environmentally suited.
On another hand, the old traditional systems Acacia / eucalyptus + subsistence cultivation and Yerba mate + subsistence cultivation, although they possess good balance among some aspects of sustainability and have adapted to local and regional production conditions, are generally weak. It is most probably due to their production objective, subsistence, that these agroforestry systems show the studys lowest Sustainability Indexes and present the most unbalanced sustainability patterns.
The most important objective of subsistence agriculture is family reproduction, pure and simple, with a secondary search for some surplus to exchange for manufactured products and, as much as possible, capitalization. About 50% of the interviewees that farm using the two systems mentioned in the preceding paragraph state that the objective of using an agroforestry system is only to adapt production to the quali-quantitative realities of their labor force.
The Acacia / Eucalyptus + Watermelon agroforestry system surprisingly had the highest Sustainability Index in our study group, largely due to the systems strength in the economic quadrant. The registrations for the systems three economic indicators were the highest among the studied systems, which was somewhat expected. The unexpected fact that the system also showed great performance in indicators 1 (handling of the production system) and 9 (taking decisions in the property) boosted the systems global performance to the top of the group. Indicators making up this systems environmental aspect presented very low performance, due to the use of chemical inputs on large scale.
The Yerba mate + subsistence cultivation system presented the second lowest Sustainability Index value, caused by its very low performances in the technician-productive and economic quadrants. Three of the six indicators making up these two quadrants presented the study groups minimum registrations, while the remaining three indicators had only medium values at best. This is partially related to the low prices received for the systems products, the large number of producers producing these products, and the cartelization of agroindustry. As this system uses few inputs and needs little cultural intervention, it would be expected that it would present environmental performance much better than it actually did (third best in the study group) and higher general performance. However, not only are this systems environmental and SI values low, its other indicators performances are only medium.
That the Yerba mate + subsistence cultivation systems environmental results are low when compared with the other studied systems may give an incorrect impression. Many believe that this system should have a high environmental rating as it its products are native perennials. Native plants are in balance with the ecosystem and suffer from few diseases and infestations that call for the intense use of herbicides and pesticides. Unfortunately, the chosen indicators and the makeup of their respective descriptors only portray a facet of the complex environmental dimension.
Our frustration with results that show this system to perform poorly in the environmental arena was tempered by the fact that in the study area this system was usually associated with other cultivation systems, cultivation systems with completely different characteristics, as a part of the faming families attempt to guarantee survival. This heterogeneity of faming systems improved the performance of some the Yerba mate + subsistence cultivation systems sustainability indicators while masking or decreasing the performance of others.
Of the studied institutional arrangements, the Associative arrangement stands out. It presents the most balanced pattern made up of relatively high, if not the highest, indicator values. This arrangement has its greatest strength in the organizational-environmental hemisphere, in which it presents the best performance among all studied arrangements.
By associating with what is typically a cooperative, producers are led to design their productive systems not only for economic maximization and productive autonomy but to also meet the needs of their community of associates, to improve the organization with which they are associated, and to better their quality of life as part of a culturally similar group. The effect of the multiple roles that association membership entails is made very clear by this institutional arrangements strength in indicator 10, community and institutional participation.
Associations and cooperatives seem to stimulate the general improvement of their members productive systems, perhaps due to the technical development that the organization fosters. These types of organizations also attend to their members cultural development by encouraging member interaction. Members gather to discuss not only production and commercialization but also the family, education, and health issues, which diversifies and balances their interests and goals and stimulates their participation in local societys growth.
The Individual arrangement presents the second highest Sustainability Index. The arrangement shows four of the highest indicator levels, two in the technician-productive quadrant and two in the economic quadrant; although, economic indicator 5 (relationships with the markets) showed the studys lowest value for this indicator. The values for three of the four indicators that comprised this arrangements environmental -organizational hemisphere were also the lowest in our study.
The low value of indicator 5 (relationships with the markets) highlights the dilemma faced by producers who have opted for this productive arrangement: how does an individual consistently market a product while occupied in the production of that product? These producers have more product sale flexibility than those linked with outside institutions. This flexibility allows them to sell for the best offer, which is reflected in their liquid income, the largest among the studied arrangements. However, more than 80% of these producers sell to "whomever appears," whether the final consumer, industry, cooperative, or, most of the time, middlemen. These farmers can exploit market opportunities that arrive at their doorstep, but they very vulnerable to unsettled or shrinking markets.
The Integrated arrangement presents the weakest and most unbalanced global performance, though not far distanced from the Individual arrangements performance, with extremely low values for indicators in the environmental, technician-productive, and economic quadrants. In the case of the technician-productive aspect, the low productivity of both earth and labor is a result of the low per hectare value of their harvest. The low performance of the indicators making up this systems economic aspect, though a reflection of product value, could also be associated to these producers lack of economic or productive flexibility should abrupt political, economic, or market disturbances negatively affect their industrial partner.
Our study results indicate that attendance to agro industrial quality and quantity standards reduces the earths and the farmers productivity, keeps the farmers liquid income low, and, through the demand for intensive "optimized" use of natural resources, negatively impacts the environment.
6. Conclusions
It can be affirmed that the chosen methodology was effective for the proposed work. It permitted clear differentiation of the studied agroforestry systems by technological and organizational format and the determination of these systems sustainability patterns. The methodology also identified the studied agroforestry systems strong and weak points, clarified the relationship between Sustainability Indexes, institutional arrangement, and technological format, and allowed comparison of different systems and institutional arrangements.
However, the concept of economic "sustainability" is new and constantly being redefined. The results from practical studies of system sustainability cannot be generalized with accuracy, as systems under study have adapted to site specific characteristics. Further complicating the creation of a comprehensive index of sustainability, the researchers subjective understanding of both "sustainability" and the world determine the choice, constitution, and composition of sustainability indicators. A different researchers simple alteration of the selected indicators composition, let alone the substitution of indicators, can make one studys sustainable system unsustainable or turn two or more systems into incomparable realities.
The analysis of agro ecosystem sustainability is made more difficult by changing parameters, especially the social indicators, not only between locations but also over time. What is inappropriate and unacceptable in one place or time, may be appropriate and acceptable in another place or at another time. Agricultural system elements also develop over time, altering the relationships among system components and between these components and the environment. What is clear is that the identification of sustainability parameters and determination of the indicators composition is complicated.
Improvement in the method of choosing and combining indicators and the variables that make up these indicators could be the object of specific interdisciplinary studies over several years. It is highly probable, though, that the determination of a generic group of indicators and descriptors that define "sustainability" over a wide group of productive systems will prove impossible. A more useful pursuit may be the development of methodologies that signal changes that have occurred in important aspects of the specific reality under study.
In light of the preceding discussion of the relative value of sustainability indicators, we see limited possibility that we can point to one of our indicators and affirm that it is more or less appropriate than any other. In the current work, the choice of indicators and their composition through descriptors doesn't constitute more than an entrance to the subject of sustainability, leaving countless obscure points for further determination. At the least, this study employed approaches and decision rules so that its results clearly meet its defined "sustainability" parameters.
Our Sustainability Index is both an expression of the maintainable operation of an agro ecosystem, property, or organization and an indicator that can lead to the recognition of areas that need improvement. From this perspective, the Sustainability Index and its components could assist the development of public policies by focusing attention on the weak areas of particular agroforestry systems. The citrus + native forest species agroforestry system for example, given its adaptability to local conditions, balance, productive efficiency, and economic viability, could be justifiably supported by and included in proposed public politics that seek to improve economic performance and support amplification by the aggregation of new producers.
In relation to the studied institutional arrangements, the Associative arrangement, confirming our expectations, was found to be the most balanced. It showed the highest levels of organization, cultural acceptability, and environmental concern. It is the most appropriate arrangement for assistance by public policies that seek to increase the levels of local and regional sustainability.
We should remind the reader that our concept of institutional arrangement stressed the importance of associativism in the form of partnerships, cooperatives, and general social participation. Our view is that partnerships, supporters, and relationships with government and non-governmental institutionsthe "institutions" in "institutional arrangements"are, in the last analysis, what galvanize and reinforce a company in its effort to reach proposed productive, organizational, economic, and environmental goals. Thus, the institutional space forged makes possible the development and diffusion of characteristics, organizational presuppositions, technologies, and methods intended to increase productive system sustainability and socio-cultural satisfaction.
When positive local development takes place, it is almost always in a favorable political and social environment brought about by the convergence of local societys actors around certain development priorities and orientations: when local actors believe in development. In the same way, changes in agricultural practices and cultivation techniques are bought about by changes in the agricultural sectors general social context: the adoption of sustainable farming techniques will occur when the farmers believe that sustainable farming brings rewards.
- ACSELRAD, H. Desenvolvimento sustentável: a luta por um conceito. Proposta, Rio de Janeiro, n.56, 1993. pp.5-8.
- ALTIERI, M.A. Agroecology: the Science of Sustainable Agriculture. 2.ed. Boulder: Westview, 1995. 433p
- CARVALHO, H.M. Padrões de sustentabilidade: uma medida para o desenvolvimento sustentável. Curitiba, 1993. mimeo.
- FERNANDEZ, X.S. A sustentabilidade nos modelos de desenvolvimento rural: uma análise aplicada de agroecossistemas Lagoas-Marcosende: Vigo University, 1995. 265p. Tesis (Economy Doctored) - Universidade de Vigo, Dep. de Economia Aplicada, Lagoas-Marcosende, 1995.
- GLIESSMAN, S.R. Agroecologia: processos ecológicos em agricultura sustentável Porto Alegre, Editora da Universidade (UFRGS), 2000.
- LOPES, Saulo B. Arranjos institucionais e a sustentabilidade de sistemas agroflorestais: uma proposição metodológica Porto Alegre, Programa de Pós-Graduação em Desenvolvimento Rural (PGDR/UFRGS), agosto de 2001. (Master Degree Dissertation).
- REDCLIFT, M. Sustainable Development: Concepts, Contradictions and Conflicts, in: ALLEN, P. Food for the Future:conditions and contradictions of sustainability. New York: Wiley, 1993. pp. 1-16.
- SCHNEIDER, S. Os Colonos da indústria calçadista: expansão industrial e as transformações da agricultura familiar no Rio Grande do Sul Campinas-SP: UNICAMP/IFCH/PPG Sociologia, 1994. (Master Degree Dissertation).
Publication Dates
-
Publication in this collection
15 July 2003 -
Date of issue
Mar 2003