 Did the soybean expansion increase the creation of formal jobs in agricultural frontier areas of Brazil (1996-2018)?
Abstract
Abstract Recent literature shows ambiguous socioeconomic effects of soybean expansion in Brazil, but this literature often fails to establish causality. Because the adoption of soybeans is an endogenous process, we employ a novel strategy, based on Synthetic Control Matching and a control group composed of municipalities not producing soybeans but with the geographical conditions to do so, to estimate the effects of the expansion on formal employment, a sector that has also experienced significant growth in the country in recent decades. Our analysis focuses exclusively on the municipalities that comprise the Brazilian agricultural frontier. Results indicate that soybean expansion led to small increases in agricultural jobs, with significant heterogeneities among municipalities, but no effects on other sectors. Our findings also point to economies of specialization in the states of Mato Grosso and specific zones in Bahia, Goiás, and Pará.
Keywords:
agriculture; jobs; soybean; synthetic control
Resumo
Resumo A literatura recente evidencia efeitos socioeconômicos ambíguos devido à expansão da soja no Brasil, ainda sem estabelecer causalidade. Como a adoção desse cultivo constitui-se em um processo endógeno, emprega-se uma estratégia inovadora fundamentada no Método de Controle Sintético e em um grupo controle a fim de estimar os impactos desse processo sobre o emprego formal, que nas últimas décadas também experimentou um crescimento relevante no país. Os resultados indicam que a sojicultura gerou aumentos modestos de trabalhos no setor agrícola, com heterogeneidades significativas entre municípios, sem repercussões nos demais setores. As conclusões também ressaltam a formação de economias especializadas nos estados de Mato Grosso e partes específicas da Bahia, Goiás e Pará.
Palavras-chave:
agricultura; emprego; soja; controle sintético
1 Introduction
Soybean is one of Brazil’s most important crops, not only for its economic contribution but also for its role in developing the country’s agricultural sector. Production began in the South and expanded westward in the 1970s (Mato Grosso and Goiás), later reaching the North and Northeast. This expansion was enabled by new soybean varieties adapted to different climates and soils and the use of limestone in the Cerrado to correct soil pH (Cunha & Espíndola, 2015). Over the past 30 years, states in tropical zones, such as Maranhão, Tocantins, Piauí, Pará, Amapá, and Rondônia, also began producing soybeans (Martinelli et al., 2017). Production in these states is referred to as the agriculture frontier in Brazil, as these states comprise the new soybean producers in the country (see Figure A.1).
This expansion was mainly driven by farmers from Rio Grande do Sul, Santa Catarina, and Paraná targeting foreign markets (Goldsmith & Hirsch, 2006; Choi & Kim, 2016). These farmers benefited from cheap land, improved transportation, favorable international prices, and government programs promoting frontier agriculture. They also had access to credit and technical experience, unlike local households, which were mostly low-income and dependent on livestock (Choi & Kim, 2016). The expansion helped Brazil become the world’s largest soybean producer, with output rising from 566 million bushels in 1991 to 4,965 million in 2021 (Colussi & Schnitkey, 2021).
This research examines the impact of soybean expansion on formal employment. Our methodological framework addresses some limitations of previous studies. We apply Synthetic Control Matching (SCM), following Abadie & Gardeazabal (2003) and Abadie et al. (2010, 2015), along with more recent extensions proposed by Xu (2017) and Ben-Michael et al. (2021). We also draw from Spatial Economics tools to analyze how treated municipalities evolve relative to neighboring areas. Treated municipalities are defined as those experiencing rapid, substantial increases in soybean production between 2005 and 2014. Control municipalities are those with suitable geographic conditions for soybean production but without significant production during the period. The methodology section details our empirical approach.
This paper contributes to the limited literature on the causal socioeconomic effects of soybean expansion. We investigate whether the expansion fostered economic diversification in Brazil’s agricultural frontier, as some studies suggest but do not demonstrate causally. Specifically, we estimate whether soybean expansion increased formal employment in key non-agricultural sectors. Focusing on the agricultural frontier rather than on all producing municipalities also allows us to infer potential effects in areas that have not yet adopted soybean cultivation. Finally, we contextualize the causal estimates with regional economics insights. We examine formal employment because soybean production is capital-intensive and frontier regions exhibit high informality1.
Our study has some limitations. First, the use of SCM requires long pre‑intervention data series to construct credible synthetic controls. This constraint forces us to exclude large, established soybean‑producing municipalities that began cultivating soybeans in the early 1990s, including major producers such as Barreiras and Luís Eduardo Magalhães in Bahia. Consequently, our analysis focuses on municipalities located in the agricultural frontier. Second, our empirical strategy requires long pre-intervention time series for the outcome variables. In this context, formal employment is the only suitable measure, as educational indicators, such as standardized test scores or enrollment, are not available for Brazilian municipalities in the early 2000s. Finally, we only analyze formal jobs, despite the high levels of informality that characterize the region under study.
2 Theoretical Foundation
Despite the growth, the soy expansion in Brazil is often criticized due to its association with deforestation and environmental degradation (Vander Vennet et al., 2016; Russo Lopes et al., 2021; Bicudo da Silva et al., 2021). While environmental impacts are well studied, socioeconomic analyses remain more limited. Some research highlights positive effects, such as increases in productivity and welfare due to the economic growth in the region, which could improve the diversification of local economies (Weinhold et al., 2013) and economic growth via GDP per capita (Andrade Neto & Raiher, 2024). In Mato Grosso, there is evidence of significant growth in non-agricultural sectors, such as services, commerce, construction, education, and health (Richards et al., 2015). This diversification transformed small towns into regional hubs with agro-industrial clusters and export infrastructure (Siani & Hayashi, 2021; Oliveira & Santana, 2012; Brum et al., 2009; Oliveira et al., 2020). As a result, indicators such as GDP per capita, employment, and the Human Development Index (HDI) are generally higher in soybean municipalities compared to others (Brum et al., 2009; Orlandi et al., 2012; VanWey et al., 2013; Lima-de-Oliveira & Alonso, 2017; Silva Filho et al., 2020).
However, there are also negative outcomes. Conflicts, violence, and pressure on small farmers to abandon their lands were common (Heredia et al., 2010). Studies also document rising income inequality (Weinhold et al., 2013; Almeida & Mattos Junior, 2016; Bolfe et al., 2016; Pereira et al., 2018), decreases in life expectancy in rural areas (Andrade Neto & Raiher, 2024), and mixed results for poverty: while Choi & Kim (2016) find increases in the North, Weinhold et al. (2013) observe reductions in the Amazon. Additional negative effects include water pollution from agrochemicals, reductions in crop diversity due to pesticide drift, environmental costs and increased gender disparities, as most jobs in the soybean sector are occupied by men (Russo Lopes et al., 2021; Bicudo da Silva et al., 2021).
An important limitation of the existing literature is that the estimated effects cannot be causally attributed to soybean expansion. Some studies are qualitative and focus on respondents’ perceptions (Russo Lopes et al., 2021). Most quantitative studies are descriptive or correlational, comparing municipalities by soybean production levels (Weinhold et al., 2013; Martinelli et al., 2017) or contrasting soybeans with other agricultural production such as sugarcane or livestock (Garrett & Rausch, 2016). Only three studies employ causal inference using difference-in-differences: Choi & Kim (2016), Andrade Neto & Raiher (2024), and Bragança (2018). The former two rely on the 1991, 2000, and 2010 population censuses and thus exclude the expansion that took place in the North in the early 2000s. Andrade Neto & Raiher (2024) and Bragança (2018) are the only studies examining impacts in the North using annual municipal GDP data (1999–2012) and census data from 2000 and 2010 to assess changes in household assets, access to public goods and the Human Development Index (HDI).
A second limitation concerns the choice of comparison municipalities. Most studies include all Brazilian municipalities, with Bragança (2018) and Andrade Neto & Raiher (2024) as the exceptions. The former selects municipalities outside the Cerrado biome as the control group, whereas the latter introduces variables to account for the likelihood of producing soybeans using Propensity Score Matching (PSM). Soybean production is concentrated in clusters of contiguous municipalities (Santos de Araújo et al., 2019) and these clusters differ in socioeconomic characteristics and production systems. Southern production, for example, features smaller farms, greater crop diversification, higher rural labor intensity, and higher yields (Bicudo da Silva et al., 2020). Hence, including all municipalities in comparison groups or assigning them homogeneous weights (as in correlational studies or standard difference-in-differences) leads to biases, as these areas vary widely in development. Moreover, difference-in-differences approaches struggle to meet the parallel trends assumption where continuous data are lacking, as with decennial census data. A third limitation is the staggered timing of soybean adoption across and within regions (Vander Vennet et al., 2016; Oliveira et al., 2020). To our knowledge, no other study has considered a staggered setting to analyze the adoption of soybean production at the municipal level. Our approach aims to tackle these limitations.
3 Methodology
3.1 Data
We use data from various sources. Formal employment information comes from the Annual Social Information Report (RAIS) from the Ministry of Economics of Brazil. Most of the information at the municipal level comes from the Brazilian Institute of Geography and Statistics (IBGE), the Institute of Applied Economy Research (IPEA), and the Central Bank of Brazil (BACEN), all available online (Instituto de Pesquisa Econômica Aplicada, 2026; Banco Central do Brasil, 2026). We complement this information with raster maps for rainfall data from the Climate Hazards Center from the University of California in Santa Barbara (CHIRPS), land flatness from the Geological Service of Brazil (SGB), and pasture areas from MapBiomas Project 6.0 collection (University of California at Santa Barbara, 2026; MapBiomas, 2026; Serviço Geológico do Brasil, 2026; Table 1).
3.2 Study area
This paper focuses on municipalities located in the North (except Amazonas and Acre), North-East (except Alagoas, Ceará, Paraíba, Pernambuco, Rio Grande do Norte, and Sergipe), and Middle-West (except Mato Grosso do Sul and Distrito Federal) regions of Brazil. This procedure incorporated two established agricultural states (Mato Grosso and Goiás) and MATOPIBA (for the states of Maranhão, Tocantins, Piauí, and Bahia), a well-known soybean expansion area, and excluded parts of other recent farming regions in Brazil, such as SEALBA (for the states of Sergipe, Alagoas, and Bahia) and AMACRO (for the states of Amazonas, Acre, and Rondônia) because soy still plays a minor role in their economic bases. The main outcome is formal employment from 1996 to 2018. We choose 1996 as the initial year because most of the municipalities analyzed had been founded by then2.
3.3 Selection of treatment (analyzed) and control (comparison) groups
We define treated (analyzed) municipalities as those experiencing rapid and substantial increases in soybean production. These municipalities provide an ideal setting to assess the upper bounds of soybean‑driven effects because rapid production shifts leave less time for producers to anticipate changes and adjust hiring decisions. Consequently, we expect stronger employment responses than in contexts where production grows gradually. We define significant production as municipalities producing at least 60,000 tons of soybeans in 20183. To identify rapid expansion, we examine production series for trend breaks (“kinks”) and classify the kink year as the moment of treatment assignment (see Figure 1).

We then apply several filters to exclude municipalities whose expansions were either gradual or followed by volatility or declines. These filters are detailed in Figure 1. Municipalities with expansions beginning before 2005 are excluded, as our empirical strategy requires long pre‑intervention periods; For example, panel (a) shows Barreiras (Bahia), which expanded in the early 1990s. We also exclude municipalities with declining trends or inverted U-shaped trajectories, such as Edeia (Goiás) in panel (b). Panels (c) and (d) illustrate two additional excluded patterns: municipalities with nearly constant production over time (Acreúna in Goiás, where the post-expansion production slope is less than twice as large as the pre-expansion slope) and those with highly volatile series (Monte Alegre do Piauí, with yearly production variations of more than 100%). We define a change in trend when the post‑intervention slope is at least twice the pre‑intervention slope. Panels (e) and (f) present the types of municipalities included as treated. In panel (e), Ipiranga do Norte (Mato Grosso) exhibits similar pre‑ and post‑intervention slopes but shows a sharp production jump between 2004 and 2005, shifting the intercept; we allow such cases when production increases exceed 60,000 tons. Panel (f) shows the most common pattern: rapid growth following a specific year (2012 in this example), as in Alto Boa Vista (Mato Grosso).
Out of the 1,610 municipalities in the region of analysis, 188 produced more than 60,000 tons of soybeans at some point between 1996 and 2018. Out of these 188 municipalities, all of them had less than 30% of the area covered by Caatinga, 99.5% had more than 900mm of precipitation per year, 87.2% had mostly flat lands and 92.5% adequate soils for agriculture. Thus, 156 of these municipalities (83.0%) satisfied the four conditions, 24 (12.8%) had three conditions and only 8 (4.3%) had two conditions.
To complete the sample selection, we consider municipalities with 5,000 or more inhabitants in 2010, and we restrict the treated municipalities to those that were “treated” prior to 2014. The first condition is used as unpopulated municipalities are unlikely to have linkage effects, which are one of the main outcomes in this research (as measured through the creation of formal jobs and changes in the municipal GDP). The second condition is used to have a window of at least 4 years to evaluate the effects of the expansion of the last treated units. The final sample comprises 39 treated municipalities and 262 municipalities in the control or comparison group.
The control group comprises municipalities that had the conditions to produce soybeans but had no or insignificant production during the analyzed period. It is selected as follows: of the 1,610 municipalities, 249 lacked population data for 1996, 389 produced more than 5,000 tons of soybeans at some point, and 133 had fewer than 5,000 inhabitants in 2010. This leaves 839 municipalities. Of these, 34% lacked a suitable biome, 36% lacked adequate flatness, 25% had inadequate soil, and 37% had insufficient rainfall. In total, 575 municipalities (69%) were excluded for not meeting all environmental requirements for soybean cultivation. The final sample consists of 264 municipalities, with two additional observations dropped due to missing values in other variables used in the analysis.
Regarding the outcome variables, jobs are categorized according to the firm’s sector. Thus, if a firm is classified as “agricultural,” all reported positions within that firm are considered agricultural jobs, regardless of whether some roles, such as engineers or sales staff, are non‑agricultural in nature. Based on this classification, we create two job categories: direct and indirect. Direct jobs refer to those directly affected by soybean expansion, primarily agricultural positions. Indirect jobs capture the “multiplicative effect” of the expansion and are not necessarily linked to the soybean value chain. This group includes employment in sales (retail and wholesale), industry (mechanical, chemical, and non‑mineral manufacturing), and services (including transportation and communications, food and beverages, commerce, public administration, and education). We also examine total employment.
Additionally, we explore whether soybean expansion generated substitution effects with livestock‑related jobs. Because the control group does not produce soybeans (by construction), we report estimates both including and excluding soybean jobs to assess whether changes in agricultural employment extend to crops other than soybeans. All job indicators are measured per thousand inhabitants using estimated population data. As covariates, we use the share of agriculture in municipal GDP, the percentage of rural population, and municipal GDP.
3.4 Empirical strategy
Our main empirical strategy is Synthetic Control Matching (SCM), originally proposed by Abadie & Gardeazabal (2003). SCM constructs a control unit as a weighted average of donor units that best reproduces the treated unit’s pre-treatment trajectory. Compared with other non-experimental techniques, SCM makes the selection of control units transparent, since weights are explicitly reported and are based solely on pre-treatment characteristics, preventing any influence from post-treatment outcomes (Abadie, 2021). In addition, SCM precludes extrapolation by requiring weights to be non-negative and sum to one, ensuring that the counterfactual is built only from similar donor units. In other words, SCM calculates a counterfactual for each treated unit and each outcome variable using the observations from the donor set during the pre-treatment period. During this process, usually a sample of the units from the donor set (and not all of them) receive a weight greater than zero.
The original SCM framework (Abadie & Gardeazabal, 2003; Abadie et al., 2010, 2015) has limitations in our setting. It is designed for a single treated unit, whereas our setting involves many municipalities affected by soybean expansion. Estimating a separate synthetic control for each municipality and conducting permutation tests for confidence intervals is computationally demanding and may not yield accurate counterfactuals for all treated units. Extensions of the baseline SCM allow for multiple treated units (see Abadie, 2021). In this research, we use the approaches proposed by Xu (2017) and Ben-Michael et al. (2021, 2022), which are particularly suitable for staggered adoption settings, as municipalities began producing soybeans in different years.
Xu’s procedure differs from the standard SCM in various aspects. First, it only estimates one counterfactual for all the treated units, different from the standard SCM that forces the estimation of one counterfactual for each of the treated units. Second, the matching procedure estimates latent factors () rather than weights, producing errors and confidence intervals using a parametric bootstrap procedure instead of the permutation method. These two aspects make the GSC more efficient computationally. Third, extrapolation is allowed because the method does not impose the non‑negativity and adding‑up constraints of traditional SCM. The approach proposed by Ben-Michael et al. (2021), known as the Augmented Synthetic Control (ASC) method, follows a doubly robust framework: it combines standard SCM (Abadie et al., 2010, 2015) with a bias‑correction term to improve pre‑treatment fit. A detailed description of both models and their functional forms is provided in Supplemental Material A1.
Apart from the established functional forms, the models analyzed have some implicit assumptions. First, they assume that there is no serial autocorrelation of the error term. In cases of strong serial dependence, such as unit root processes, the models will not provide reliable estimations. Thus, the error term must have zero mean. Second, the assignment to treatment can depend on pre-treatment outcomes, but it cannot depend on post-treatment outcomes. Mathematically, where denotes any latent variable estimated in the models. Intuitively, these assumptions mean that if there is an external shock experienced by the treatment group in the post-treatment period, this shock will be the same on average for the control group4. Additionally, it means that there are no latent factors (or unobserved characteristics) that could affect both the assignment to treatment and the outcomes analyzed. We do not find evidence of autocorrelations of the error terms during the pre-treatment period for any of the variables analyzed. The magnitude of the estimated effects using SCM also depends on the set of control municipalities. Because we restrict the control group to those municipalities that have the potential to become soybean producers, the estimated effects could be interpreted as a comparison between soybean producers and potential soybean producers.
We use the R packages gsynth and multisynth and complement these analyses with panel fixed‑effects estimations, using the annual soybean production of each municipality as the treatment variable and restricting the sample to the municipalities included in the synthetic control procedures. A key caveat of the methods described above is that the estimated weights—or latent factors—vary across outcome variables. To assess model fit, we use the pre‑treatment fit index proposed by Adhikari & Alm (2016). Values near zero indicate good fit, whereas values close to or above 1 suggest unreliable synthetic control estimates. Following their recommendation, we retain only estimations with fit values below 0.1. Most of our estimates meet this criterion (see Supplemental Material A1).
3.5 Regional context
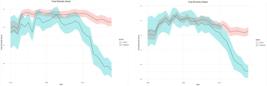
The purpose of this section is twofold. The first is to show that the identification of the treatment year in our empirical strategy is sound. We do so by analyzing the effects of soybean expansion on crop diversity5. If the treated municipalities only increased the production of soybeans and not that of other crops, the crop diversity index is likely to decrease. Furthermore, if these increases in the production of soybeans occurred at time , we would expect significant decreases in the crop diversity index only thereafter. The second purpose is to show the growth of the municipalities included in the treatment group relative to other neighboring municipalities in terms of jobs per capita. For the second purpose, we compare the treated municipalities with both soybean-producing and non-producing municipalities, also considering the relative importance of each municipality within the region in terms of its economic attraction (region of influence). We also use Moran’s I to check whether job growth is absorbed by some municipalities or is spread across neighboring municipalities. We describe the methodology used in Supplemental Material A2.
We show that around 2010, there is a noticeable and significant decrease in the crop diversity index for the treatment group, both in terms of area and value (see Figure 2). Thus, given these significant changes in the agricultural production in the treated municipalities, our goal is to analyze whether these changes were large enough to produce significant increases in formal jobs in the treated municipalities6. We also observe that the treated municipalities had increases in formal jobs above average when compared to other municipalities that do not produce soybeans and are located within the same areas (or regions of influence). However, when compared to more established soybean producers, the treated municipalities had on average smaller growth rates (except for jobs in livestock). The results are presented in Table A.1 (Supplemental Material). Similarly, there is no indication that the effects of the expansion for the treatment group are “absorbed” by the neighbors. Overall, the results suggest that there is homogeneity in the treated municipalities and their neighbors, such that if a municipality experienced significant increases in jobs, it is likely that its neighbors experienced the same growth (see Supplemental Material - Figure A.3). In fact, the existence of clusters concentrated in certain areas could suggest the existence of economies of specialization among the municipalities7. Although the analysis of economies of specialization and whether soybean production is incentivizing specialization among the municipalities are beyond the reach of this paper, these could be interesting areas for future research.
3.6 Which municipalities should have the largest effects?
We hypothesize that if there exist any effects attributed to the expansion, these effects may vary depending on the characteristics of each municipality. We expect that municipalities with larger increases in the production of soybeans (intensity in the production), higher investments (both in terms of mechanization and financial resources), and a larger formal sector would have the largest effects. For example, in terms of jobs, higher mechanization means that more workers are needed to operate the machines8. Mechanization is measured through the number of machines (tractors, seeders, harvesters, and fertilizer spreaders) per capita for the Brazilian Agricultural Census in 2017. Financial resources include the average value between 2014 and 2018 of rural credits (through banks), private transfers, and credits transferred through the Programa Nacional de Fortalecimento da Agricultura Familiar (Pronaf)9, a program designed to incentivize family farms10. In Figure B.2 (Supplemental Material) we show the municipalities included in the treatment group by “year of treatment” in terms of production intensity, investments, and percentage of formal jobs in agriculture. Note that three municipalities usually have the three largest values in each of these categories: Porto dos Gaúchos (MT), São José do Xingu (MT), and São Félix do Araguaia (MT). We expect that these municipalities would exhibit the largest effects. Additionally, we expect municipalities where the soybean expansion arrived earlier to have larger effects. In this way, we estimate average cohort effects using ASC.
4 Results and Discussion
4.1 Descriptive statistics
First, we analyze the composition of the control (comparison set) and treatment (analyzed municipalities) group for two different periods: 1996 to 2000, which is equivalent to the pre-treatment period (before the analyzed municipalities produced significant amounts of soybeans), and 2014 to 2018 (post-treatment), when all the units in the treatment group experienced the expansion of soybean production. Figure 3 shows the main agricultural activities by group, based on the production value11. For the period 1996 to 2000, livestock (production of meat and milk) was the main economic activity, while soybeans were the main agricultural production for only one municipality. For the period 2014 to 2018, soybeans became the most important economic activity for the treated group. Nevertheless, livestock remained the main activity for around half of these municipalities. Most of the treated municipalities are in the state of Mato Grosso, the largest producer of agricultural commodities in Brazil, whereas the majority in the control group are in the states of Pará, Maranhão, and Piauí. Although livestock is the main economic activity in the control group, other activities are also significant, such as yucca and sugarcane in the state of Maranhão.

Table 2 compares the control and treatment groups across a set of socio-economic variables. The control group is intentionally larger (262 municipalities) to guarantee that each observation in the treatment group (39) has a good counterfactual. In general, the municipalities in the treatment group tend to have better socioeconomic outcomes (lower illiteracy rate, higher income per capita), and their economic activity is mainly agricultural, with significant differences relative to the control group in terms of agricultural GDP and jobs in agriculture. Although the treatment group tends to have smaller populations, the differences are not significant. These differences support the use of methodological approaches such as SCM over techniques like difference-in-differences. In fact, as a robustness check, we show that the differences between treatment and control are significantly reduced (except for soybean production) when we use the municipal weights calculated using ASC for agricultural jobs (see Table A.5 of Supplemental Material).
4.2 Aggregated estimations
We present two types of estimations: using ASC (Ben Michael et al., 2021) and GSC (Xu, 2017). Table 3 summarizes the results, including only the average effect for the post-treatment period (ATT). In this table, we include a column that shows the p-value for the null hypothesis that the effects are equal to zero. Our results show that there are no significant increases in formal jobs in any of the categories that could be validated with both estimation methods (ASC and GSC). While GSC shows significant effects for jobs in agriculture, livestock, and services (at 5% level), the estimations using ASC are not statistically different from zero for all outcomes. In this sense, we do not find evidence of direct or multiplicative effects, nor do we find evidence of substitution effects between formal jobs in agriculture and formal jobs in livestock for the whole group of municipalities analyzed. In Figure B.3 (Supplemental Material) we show graphically the estimations for the variables analyzed.
4.3 Analysis of heterogeneity
In this section, we change the composition of the treatment group and calculate the same models described in the previous sections by keeping the same set of control municipalities. We create the following treatment groups based on the latest available data. The number of municipalities is in parentheses12: i) High investments and machinery per capita (8), ii) Highest production of soybeans (7), iii) Highest percentages of formal jobs in agriculture (6), iv) Intersection of i) to iii) (4).
The estimations from this section reflect significant heterogeneities among the municipalities analyzed. In this sense, the estimations show significant effects of the expansion on formal agricultural jobs. However, there is no evidence of multiplicative effects for any of the groups analyzed. Thus, municipalities with higher investments, higher size of the formal sector in agriculture, or higher production of soybeans did not experience significant increases in formal jobs in sectors other than agriculture. The estimations show increases in agricultural jobs ranging from 23 to 46 jobs per thousand inhabitants for the whole period of analysis, with the largest effects for the subsample of municipalities that had higher values in all three categories (group iv).
4.4 Panel estimations
The estimations using panel data with fixed effects show correlations and not causal effects13. Our results suggest that a higher production of soybeans is correlated with more jobs per capita in every category analyzed, except for jobs in industry. The panel exercise also reflects the difference between correlations and causal estimations (see Table 4). Thus, even though municipalities with a higher production of soybeans tend to have more formal jobs per inhabitant, we cannot causally attribute the creation of formal jobs to the soybean expansion in the region of analysis, at least not in sectors other than agriculture. Also note that in the panel estimations there is a positive correlation of soybean production with jobs in livestock, indicating that it is unlikely to find substitutability between jobs in this sector and formal jobs in the production of soybeans, which is in line with our estimations using SCM.
4.5 Additional estimations
As a robustness exercise, we estimate the effects for the total number of formal jobs (not in per capita terms), using the estimated population as a covariate. The estimations, presented in Table A.3 of Supplemental Material, show the effects for the whole population (Panel A) and for the municipalities with the largest investments, soybean production, and formal sector size, or group iv) from our previous section (Panel B). Overall, the estimated effects of the expansion are not significantly different from zero in any category of formal jobs for both ASC and GSC. The outcome variables in per-capita terms are our preferred specification. This is because the synthetic control procedures treat covariates and outcome variables differently. For example, the ASC only uses the average values for covariates during the pre-treatment period, eliminating any time component. Thus, migrations driven by job opportunities are not accounted for in the estimations that use the municipal population as a covariate14. Additionally, we calculate the effects by cohort using ASC, but these estimations are indistinguishable from zero. The lack of significant results could be explained by differences in other characteristics, such as investments or size of soybean production, being more relevant at explaining heterogeneous effects than cohort effects (see Table A.4 – Supplemental Material).
5 Conclusions
This research analyzes the effects of soybean expansion on formal employment in Brazil’s agricultural frontier between 1996 and 2018. Our empirical strategy applies synthetic control matching, addressing key shortcomings in previous studies: identifying causal effects rather than correlations, carefully selecting control municipalities based on geographic suitability for soybean cultivation, and using methods that accommodate staggered adoption. We find that the expansion generated increases in formal agricultural employment (direct effects) in a subset of municipalities, but we observe no multiplicative effects in other sectors, indicating that the soybean expansion does not automatically foster local economic diversification as some studies suggest. We also do not find evidence of substitution between agricultural and livestock jobs, at least for formal employment.
To better understand these results, we conduct two complementary analyses. First, using tools from regional economics, we compare formal employment growth in the analyzed (or treated) municipalities with that of neighboring areas or municipalities linked through goods flows and population exchanges (regions of influence). The analyzed municipalities show above-average growth in formal agricultural jobs relative to non-soybean municipalities within their region of influence, but below-average growth relative to established soybean producers excluded from the analysis due to the lack of a pre-intervention period. We complement this with Local Moran’s I statistics, which indicate that the analyzed municipalities tend to be surrounded by others exhibiting similar employment dynamics. For instance, municipalities with strong gains in jobs per thousand inhabitants are typically clustered with others showing comparable increases. While regional tools do not provide causal estimates, the evidence suggests that neighboring municipalities are unlikely to be absorbing the effects of soybean expansion.
We then complement the regional analysis with the estimation of heterogeneous effects of the soybean expansion. We measure heterogeneity across four dimensions: investment levels (machinery and financial resources), production intensity (tons produced), the size of the agricultural formal workforce, and a combined index of these three characteristics. We expect larger employment effects in municipalities with higher values in these dimensions. Consistent with this expectation, only these municipalities exhibit significant increases in formal agricultural employment. However, we do not detect multiplicative effects in non‑agricultural sectors. For the municipalities with the highest levels across the three dimensions, the average effect ranges from 35 to 46 agricultural jobs per 1,000 inhabitants. Given average populations of around 10,000 inhabitants, this implies the creation of more than 350 formal agricultural jobs attributable to soybean expansion.
Our findings suggest that the municipalities analyzed specialize in agricultural staples and soybeans, with limited diversification into other sectors. We propose two potential explanations. First, the development of linkages to non-agricultural sectors takes time; only municipalities that began producing soybeans in the 1990s appear to have developed such sectors. Second, the largest benefits of expansion may accrue to early producers or to municipalities that initially established industrial or service activities tied to soybean production. For instance, municipalities that began producing soybeans in the 1990s show the highest increases in formal jobs per capita in the regions where our treated municipalities are located.
From a public policy perspective, our results do not point to enacting diversification policies to generate multiplicative effects. If specialization reflects a comparative advantage, public investment may instead focus on improving local amenities, services, and urban infrastructure rather than sectoral transformations. This study has limitations and avenues for extension. The main limitations are the exclusion of informal employment and the lack of data on other socioeconomic indicators, such as health or education, that could complement the analysis. With additional years of data and the 2022 population census, future research could examine outcomes such as internal migration. Although our findings suggest increasing economic specialization, our framework cannot determine whether soybean expansion contributed to this specialization. Finally, given the literature documenting rising inequality in soybean-producing regions, future work should examine the types of jobs created and whether they reach the poorest households. If these households lack access to newly created formal jobs, this could be a channel for increasing inequality.
Data availability:
The Supplemental Materials referenced throughout this manuscript are available at: https://figshare.com/articles/online_resource/Supplemental_Materials_-_Did_the_soybean_expansion_increase_the_creation_of_formal_jobs_in_agricultural_frontier_areas_of_Brazil_1996-2018_/33126806
Acknowledgements
We extend our sincere gratitude to Mary-Paula Arends-Kuenning for her invaluable guidance in this study. We appreciate the insightful contributions of Angela Lyons, Catalina Herrera-Almanza, and Marcelo Cunha Medeiros, who reviewed the first versions of this manuscript and greatly enriched this research. We are also thankful for the comments received by Alex Winter-Nelson, Waldecy Rodrigues, Stefan H. Dorner, and Rodrigo Estevam Munhoz de Almeida, and the participants of the IPAD seminar at the University of Illinois Urbana-Champaign.
-
1
Maranhão, Piauí, and Tocantins had formal employment rates below 30%, compared with more than 45% in Santa Catarina, Rio Grande do Sul, and Paraná. These rates include all economic sectors (Instituto Brasileiro de Geografia e Estatística, 2012). It is also worth noting that the country has made progress in formal employment. Based on calculations from IBGE using the 2017 Agricultural Census, formal private‑sector employment reached 50.3% in Maranhão and 52.0% in Piauí, still well below the national average of 74.3%. Overall, all states included in the analysis, except Mato Grosso, remain below the national average, indicating significant room for improvement. See: Agência de Notícias IBGE (2019).
-
2
Another solution is to use the Minimum Comparable Areas (or AMC) proposed by Ehrl (2017) to aggregate municipalities between 1872 and 2010. In Brazil, the number of municipalities has increased significantly. According to IBGE, there were 4,491 municipalities in 1991. This number increased to 5,507 in 2000 and 5,565 in 2010.
-
3
We selected this cutoff to ensure a sufficiently large group of treated municipalities. Among more than 1,600 municipalities in the study region, only 582 produced soybeans in 2018, and 60,000 tons corresponds to the 70th percentile of this distribution. This threshold also implies production areas close to 20,000 hectares, given average regional yields slightly above 3 tons per hectare. It excludes about 5% of municipalities in the sample whose total area is smaller than the minimum production area required. As discussed in the methodology section, we also estimate effects for the largest producers and for municipalities expected to experience the strongest impacts; these estimates provide an upper bound for our analysis.
-
4
Note that the penalization parameter used by Ben-Michael et al. (2022) addresses this problem, as the counterfactual is forced to rely on the weights of more control units, instead of only a few. Thus, this adjustment reduces the bias in the estimations if for example one of these units experiences a large shock.
-
5
Crop diversity is calculated using the Shannon diversity index (SDI) following Bicudo da Silva et al. (2020), such that , where is the proportion of crop in each municipality. We use a total of 69 crops to calculate the index. We calculate two types of : one based on the proportional value of each crop in the municipality, the other one based on the proportional area planted.
-
6
This result is in line with other studies that show reductions in crop diversity in the areas producing soybeans (Russo Lopes et al., 2021; Bicudo da Silva et al., 2020).
-
7
As a complementary exercise, we analyze whether the closeness of a municipality to the crushing and refining facilities has any correlation with growth in jobs. We use data from Trase Supply Chains (https://supplychains.trase.earth/logistics-map), measuring the distances with respect to the centroid for each polygon (municipality) to calculate the distances. Our results point to a small (if any) correlation between closeness to these facilities and growth in jobs per capita.
-
8
We believe this is the right mechanism. Note that the production of soybeans in our setting was highly mechanized from the beginning. It is possible that there was substitution between labor and machines in crops other than soybean. Nevertheless, in most of the analyzed municipalities the main economic activity was livestock. Thus, we could think that the production of soybeans follows a fixed proportions production (or Leontief) function, where the expansion of the total production requires proportional increases in both labor and machinery.
-
9
All monetary variables are deflated using the Consumer Price Index (CPI), with 2010 as the base year.
-
10
Introduced in the 1990s, Pronaf is Brazil’s main policy instrument supporting family agriculture. It finances all crop types through three channels: production, infrastructure and municipal services, and training (Junqueira & Lima, 2008). Family farmers are defined as households operating 5–110 hectares (by region), relying mainly on family labor, and earning most income from agriculture. Projects must comply with environmental regulations; households in environmentally sensitive areas (e.g., the Caatinga biome) are excluded (Zeller & Schiesari, 2020). Pronaf targets diverse groups, including land‑reform settlers (Group A), poor households (Group B), and higher‑income family farmers (Group V), subject to income, labor, and employment limits.
-
11
The information from IBGE does not include the produced value for livestock for each municipality (only by state). We impute this value following the methodology proposed by the Institute of Agricultural Economics (IEA), described in “Valor da Produção Agropecuária: a geografia da agricultura e da pecuária brasileira em 2012” (Instituto de Economia Agrícola, 2026). This imputation is performed by multiplying the proportion of heads of livestock in each municipality relative to the total heads in the state by the price of meat (in Kg) produced in Brazil. This procedure is done by year. All values were deflated using the CPI for 2010.
-
12
Group i): Porto dos Gaúchos (MT), Formosa do Rio Preto (BA), São Félix do Araguaia (MT), São José do Xingu (MT) Ribeirão Cascalheira (MT), Peixe (TO), Figueirópolis (TO), and Vila Bela da Santíssima Trindade (MT); Group ii): Porto dos Gaúchos (MT), Formosa do Rio Preto (BA), São Félix do Araguaia (MT), Paragominas (PA), São José do Xingu (MT), Ribeirão Cascalheira (MT), and Dom Eliseu (PA); Group iii) Porto dos Gaúchos (MT), Ulianópolis (PA), São José do Xingu (MT), São Félix do Araguaia (MT), Vila Bela da Santíssima Trindade (MT), and Figueirópolis (TO); Group iv) Porto dos Gaúchos (MT), São José do Xingu (MT), São Félix do Araguaia (MT), Vila Bela da Santíssima Trindade (MT).
-
13
Different from SCM, panel data with fixed effects estimations do not meet the necessary conditions to interpret the results as causal. Thus, the control group is not equivalent to the treatment group in the absence of the treatment. This means that the estimations using panel data do not isolate causal effects, as these effects are contaminated by differences in unobserved characteristics and differences in trends.
-
14
In Figure B.4 of Supplemental Material, we show that inter-municipal migration is an important aspect in our setting. Between the 2000 and 2010 population censuses, in 4 municipalities the population grew above 50% and 3 municipalities experienced decreases in population of more than 10%. Most of the treated municipalities had growth rates ranging between -4% and 20% (21 out of 39). We believe that since these changes occurred over 10 years, larger differences are expected in the municipalities between 1996 and 2018.
-
How to cite:
Montoya Castano, A., & Oliveira, T. J. A. (2026). Did the soybean expansion increase the creation of formal jobs in agricultural frontier areas of Brazil (1996-2018)? Revista de Economia e Sociologia Rural, 64, e305841. https://doi.org/10.1590/1806-9479.2026.305841
-
Financial support:
Nothing to declare.
-
Ethics approval:
Not applicable.
-
JEL Classification:
O13, J20, R11, R13.
6 References
-
Abadie, A. (2021). Using synthetic controls: Feasibility, data requirements, and methodological aspects. Journal of Economic Literature, 59(2), 391-425. https://doi.org/10.1257/jel.20191450
» https://doi.org/10.1257/jel.20191450 -
Abadie, A., & Gardeazabal, J. (2003). The economic costs of conflict: a case study of the Basque Country. The American Economic Review, 93(1), 113-132. https://doi.org/10.1257/000282803321455188
» https://doi.org/10.1257/000282803321455188 -
Abadie, A., Diamond, A., & Hainmueller, J. (2010). Synthetic control methods for comparative case studies: Estimating the effect of California’s tobacco control program. Journal of the American Statistical Association, 105(490), 493-505. https://doi.org/10.1198/jasa.2009.ap08746
» https://doi.org/10.1198/jasa.2009.ap08746 -
Abadie, A., Diamond, A., & Hainmueller, J. (2015). Comparative politics and the synthetic control method. American Journal of Political Science, 59(2), 495-510. https://doi.org/10.1111/ajps.12116
» https://doi.org/10.1111/ajps.12116 -
Adhikari, B., & Alm, J. (2016). Evaluating the economic effects of flat tax reforms using synthetic control methods. Southern Economic Journal, 83(2), 437-463. https://doi.org/10.1002/soej.12152
» https://doi.org/10.1002/soej.12152 -
Agência de Notícias IBGE. (2019). Quarterly Continuous PNAD: unemployment decreases in 10 of the 27 Federation Units in Q2 2019. Retrieved in 2026, February 24, from https://agenciadenoticias.ibge.gov.br/en/agencia-press-room/2185-news-agency/releases-en/25218-quarterly-continuous-pnad-unemployment-decreases-in-10-of-the-27-federation-units-in-q2-2019
» https://agenciadenoticias.ibge.gov.br/en/agencia-press-room/2185-news-agency/releases-en/25218-quarterly-continuous-pnad-unemployment-decreases-in-10-of-the-27-federation-units-in-q2-2019 -
Almeida, J. G., & Mattos Junior, J. S. (2016). A dinâmica da produção de soja no município de Brejo (MA) e seus reflexos na produção agrícola camponesa. Revista Campo-Território, 11(24), 374-399. https://doi.org/10.14393/RCT112416
» https://doi.org/10.14393/RCT112416 -
Andrade Neto, A. O., & Raiher, A. P. (2024). Impacto socioeconômico da cultura da soja nas áreas mínimas comparáveis do Brasil. Revista de Economia e Sociologia Rural, 62(1), e267567. https://doi.org/10.1590/1806-9479.2022.267567
» https://doi.org/10.1590/1806-9479.2022.267567 -
Banco Central do Brasil – BACEN. (2026). Matriz de dados do crédito rural. Retrieved in 2026, February 24, from https://www.bcb.gov.br/estabilidadefinanceira/micrrural
» https://www.bcb.gov.br/estabilidadefinanceira/micrrural -
Ben-Michael, E., Feller, A., & Rothstein, J. (2021). The augmented synthetic control method. Journal of the American Statistical Association, 116(536), 1789-1803. https://doi.org/10.1080/01621459.2021.1929245
» https://doi.org/10.1080/01621459.2021.1929245 -
Ben-Michael, E., Feller, A., & Rothstein, J. (2022). Synthetic Controls with Staggered Adoption. Journal of the Royal Statistical Society. Series B, Statistical Methodology, 84(2), 351-381. https://doi.org/10.1111/rssb.12448
» https://doi.org/10.1111/rssb.12448 -
Bicudo da Silva, R. F., Batistella, M., Millington, J. D., Moran, E., Martinelli, L. A., Dou, Y., & Liu, J. (2020). Three decades of changes in Brazilian municipalities and their food production systems. Land, 9(11), 422. https://doi.org/10.3390/land9110422
» https://doi.org/10.3390/land9110422 - Bicudo da Silva, R. F., Viña, A., Moran, E. F., Dou, Y., Batistella, M., & Liu, J. (2021). Socioeconomic and environmental effects of soybean production in metacoupled systems. Nature Portfolio, 11, 18662.
- Bolfe, É. L., Victória, D. d., Contini, E., Bayma-Silva, G., Spinelli-Araujo, L., & Gomes, D. (2016). Matopiba em crescimento agrícola Aspectos territoriais e socioeconômicos. Revista de Política Agrícola, 25, 38-62.
-
Bragança, A. (2018). The economic consequences of the agricultural expansion in MATOPIBA. Revista Brasileira de Economia, 72(2), 161-185. https://doi.org/10.5935/0034-7140.20180008
» https://doi.org/10.5935/0034-7140.20180008 - Brum, A. L., Dalfovo, W. C., & Azuaga, F. L. (2009). Alguns impactos da expansão da produção de soja no município de Sorriso-MT. Desenvolvimento em Questão, 7, 173-200.
-
Choi, S., & Kim, H. (2016). The impact of conglomerate farming on the poor: empirical evidence from the Brazil soy sector. International Area Studies Review, 19(2), 147-164. https://doi.org/10.1177/2233865915611571
» https://doi.org/10.1177/2233865915611571 - Colussi, J., & Schnitkey, G. (2021). New soybean record: historical growing of production in Brazil. Farmdoc Daily, 11, 49.
- Cunha, R. C., & Espíndola, C. J. (2015). A dinâmica geoeconômica recente da cadeia produtiva da soja no Brasil e no mundo. GeoTextos, 11(1), 217.
-
Ehrl, P. (2017). Minimum comparable areas for the period 1872-2010: an aggregation of Brazilian municipalities. Estudos Econômicos, 47(1), 215-229. https://doi.org/10.1590/0101-416147182phe
» https://doi.org/10.1590/0101-416147182phe -
Garrett, R. D., & Rausch, L. L. (2016). Green for gold: social and ecological tradeoffs influencing the sustainability of the Brazilian soy industry. The Journal of Peasant Studies, 43(2), 461-493. https://doi.org/10.1080/03066150.2015.1010077
» https://doi.org/10.1080/03066150.2015.1010077 - Goldsmith, P. D., & Hirsch, R. (2006). The Brazilian soybean complex. Choices, 21, 97-104.
-
Heredia, B., Palmeira, M., & Leite, S. P. (2010). Sociedade e economia do “agronegócio” no Brasil. Revista Brasileira de Ciências Sociais, 25(74), 159-176. https://doi.org/10.1590/S0102-69092010000300010
» https://doi.org/10.1590/S0102-69092010000300010 - Instituto Brasileiro de Geografia e Estatística – IBGE. (2012). Censo demográfico 2010: resultados gerais da amostra Rio de Janeiro: IBGE.
-
Instituto de Economia Agrícola – IEA. (2026). Valor da Produção Agropecuária: a geografia da agricultura e da pecuária brasileira em 2012. Retrieved in 2026, February 24, from http://www.iea.sp.gov.br/ftpiea/AIA/AIA-64-2014.pdf
» http://www.iea.sp.gov.br/ftpiea/AIA/AIA-64-2014.pdf -
Instituto de Pesquisa Econômica Aplicada – IPEA. (2026). Banco de dados do IPEA (IPEADATA). Retrieved in 2026, February 24, from https://www.ipeadata.gov.br/Default.aspx
» https://www.ipeadata.gov.br/Default.aspx - Junqueira, C. P., & Lima, J. F. (2008). Políticas públicas para a agricultura familiar no Brasil. Semina. Ciências Sociais e Humanas, 29(2), 159-176.
-
Lima-de-Oliveira, R., & Alonso, M. L. (2017). Fueling development? Assessing the impact of oil and soybean wealth on municipalities in Brazil. The Extractive Industries and Society, 4(3), 576-585. https://doi.org/10.1016/j.exis.2017.06.001
» https://doi.org/10.1016/j.exis.2017.06.001 -
MapBiomas. (2026). Collection 6. Retrieved in 2026, February 24, from https://brasil.mapbiomas.org/en/map/colecao-6/
» https://brasil.mapbiomas.org/en/map/colecao-6/ -
Martinelli, L. A., Batistella, M., Silva, R. F., & Moran, E. (2017). Soy expansion and socioeconomic development in municipalities of Brazil. Land, 6(3), 62. https://doi.org/10.3390/land6030062
» https://doi.org/10.3390/land6030062 -
Oliveira, C. M., & Santana, A. C. (2012). A governança no Arranjo Produtivo de Grãos de Santarém e Belterra, estado do Pará: uma análise a partir do grão soja. Revista de Economia e Sociologia Rural, 50(4), 683-704. https://doi.org/10.1590/S0103-20032012000400006
» https://doi.org/10.1590/S0103-20032012000400006 - Oliveira, T. J., Dörner, S. H., & Schneider, M. B. (2020). Desenvolvimento econômico no Matopiba: os arranjos produtivos locais da soja. Revista Economia Ensaios, 35(2), 67-81.
- Orlandi, M., Willers, E. M., Staduto, J. A., Eberhardt, P. H., & Piacenti, C. A. (2012). Caminos de soja y desarrollo rural en Paraná y Mato Grosso. Revista de Política Agrícola, 21, 75-90.
-
Pereira, C. N., Porcionato, G. L., & de Castro, C. N. (2018). Aspectos socieconômicos da região do Matopiba. Ipea. Retrieved in 2026, February 24, from https://repositorio.ipea.gov.br/handle/11058/8462
» https://repositorio.ipea.gov.br/handle/11058/8462 -
Richards, P., Pellegrina, H., VanWey, L., & Spera, S. (2015). Soybean development: the impact of a decade of agricultural change on urban and economic growth in Mato Grosso, Brazil. PLoS One, 10(4), e0122510. https://doi.org/10.1371/journal.pone.0122510
» https://doi.org/10.1371/journal.pone.0122510 -
Russo Lopes, G., Bastos Lima, M. G., & Reis, T. N. (2021). Maldevelopment revisited: Inclusiveness and social impacts of soy expansion over Brazil’s Cerrado in Matopiba. World Development, 139, 105316. https://doi.org/10.1016/j.worlddev.2020.105316
» https://doi.org/10.1016/j.worlddev.2020.105316 -
Santos de Araújo, M. L., Sano, E. E., Bolfe, E. L., Santos, J. R., Santos, J. S., & Silva, F. B. (2019). Spatiotemporal dynamics of soybean crop in the Matopiba region, Brazil (1990-2015). Land Use Policy, 80, 57-67. https://doi.org/10.1016/j.landusepol.2018.09.040
» https://doi.org/10.1016/j.landusepol.2018.09.040 -
Serviço Geológico do Brasil – SGB. (2026). Dados, Informações e produtos. Retrieved in 2026, February 24, from https://geosgb.sgb.gov.br/geosgb/downloads.html
» https://geosgb.sgb.gov.br/geosgb/downloads.html - Siani, S. R., & Hayashi, C. (2021). Transformações urbanas no sudeste do Pará e os impactos recentes trazidos pelas fazendas de soja. Research, Society and Development, 10(10), e47101018416.
- Silva Filho, L. A., Pereira, D. d., & Miyamoto, B. C. (2020). Disparidade de renda do trabalho agropecuário no Matopiba. Revista de Política Agrícola, 29, 98.
-
University of California at Santa Barbara. Climate Hazards Center. (2026). Data sets. Retrieved in 2026, February 24, from https://www.chc.ucsb.edu/data
» https://www.chc.ucsb.edu/data -
Vander Vennet, B., Schneider, S., & Dessein, J. (2016). Different farming styles behind the homogenous soy production in southern Brazil. The Journal of Peasant Studies, 43(2), 396-418. https://doi.org/10.1080/03066150.2014.993319
» https://doi.org/10.1080/03066150.2014.993319 -
VanWey, L. K., Spera, S., de Sa, R., Mahr, D., & Mustard, J. F. (2013). Socioeconomic development and agricultural intensification in Mato Grosso. Philosophical Transactions of the Royal Society of London. Series B, Biological Sciences, 368(1619), 20120168. https://doi.org/10.1098/rstb.2012.0168
» https://doi.org/10.1098/rstb.2012.0168 -
Weinhold, D., Killick, E., & Reis, E. J. (2013). Soybeans, poverty and inequality in the Brazilian Amazon. World Development, 52, 132-143. https://doi.org/10.1016/j.worlddev.2012.11.016
» https://doi.org/10.1016/j.worlddev.2012.11.016 -
Xu, Y. (2017). Generalized synthetic control method: causal inference with interactive fixed effects models. Political Analysis, 25(1), 57-76. https://doi.org/10.1017/pan.2016.2
» https://doi.org/10.1017/pan.2016.2 -
Zeller, M., & Schiesari, C. (2020). The unequal allocation of PRONAF resources: which factors determine the intensity of the program across Brazil? Revista de Economia e Sociologia Rural, 58(3), 1. https://doi.org/10.1590/1806-9479.2020.207126
» https://doi.org/10.1590/1806-9479.2020.207126
Edited by
-
Associate Editor:
Daniel Arruda Coronel

 Source: Authors’ calculations. Notes: This figure shows the selection process for selecting the municipalities in the treatment group. Panels a) to d) show cases of municipalities excluded. The reasons for exclusion are: a) the expansion started before 2005, b) and d) high volatility in production, c) soybean production never took off or followed a linear pattern (and it cannot be labeled as an “expansion”). Panels e) and f) show the types of municipalities included as treated.
 Source: Authors’ calculations. Notes: Panels a) and b) show changes in crop diversity for the treatment and control groups. Crop diversity is calculated using the Shannon Index for the proportion of the value or harvested area for 69 crops. The black lines show the unweighted averages. Confidence intervals (at 5% level) are calculated using t distributions.
 Source: Authors’ calculations.