 Design and verification of evaluation method for storage stability of sealant
ABSTRACT
The components of the sealant are diverse and complex, and there are differences in the relative molecular weight and solubility parameters of each component, which is a thermo-dynamic unstable system. Under long-term static storage and service conditions, the joint sealant is prone to automatic condensation and segregation, which degrades its road performance. At present, little attention is paid to the storage stability of the joint sealants. The current specifications have no clear requirements for this performance, which limits the service life of the joint sealant to a certain extent. This paper investigates the influence of sealant segregation on its macroscopic properties, microstructure and components was investigated, and reveals the reasons for the segregation behavior of the sealant. At the same time, based on the shortcomings of the existing evaluation methods for storage stability and in combination with the segregation behavior of the sealant, the viscosity difference is proposed as a supplementary evaluation index for storage stability, the viscosity difference at 180 °C with a recommended threshold of 2 Pa·s, together with a softening point difference threshold of 5 °C. The segregation test conditions are optimized to a tube diameter of 50 mm, temperature of 185 °C, and duration of 8 h.
Keywords:
Asphalt pavement; Sealant; Segregation behavior; Stable storage; Evaluation method
1. INTRODUCTION
Polymer-modified asphalt sealant (referred to as “sealant”) is widely used by maintenance departments for crack repair, improving driving quality, and increasing road service life [1, 2]. Different countries have developed relevant standards in order to evaluate the field performance of hot-poured sealants [3,4,5]. ASTM sets forth relatively comprehensive testing methods and technical requirements [6,7,8,9], which represent the main sealant standard system worldwide. However, joint sealant is a mixture obtained by high-speed shearing of multiple components, with differences in relative molecular weight, solubility parameters, and chemical structure among the components. Sealant is an unstable thermodynamic system, and after the removal of shear force at the end of production, the dispersed phase will undergo spontaneous condensation and segregation. There is a density difference between the components of the sealant, and there is relative movement between the components dynamically, and the degree of separation is related to time. In order to ensure continuous supply, sealant manufacturers generally maintain a certain inventory. Most sealant is stored for a year or even longer before construction, and during this period there is a certain degree of separation between the components. Before joint grouting construction, it is necessary to heat the sealant to a temperature generally around 190°C. To ensure construction efficiency, it is necessary to continuously heat a sufficient amount of sealant [10, 11]. Some maintenance departments start heating at night before construction, but due to limitations in maintenance equipment and funds, many maintenance departments cannot fully mix the sealant, further exacerbating segregation. This results in varying properties of the sealant along the crack direction during joint grouting, and weak areas are prone to failure. During long-term service, the sealant will also undergo a certain degree of segregation in the vertical direction due to component density differences [12, 13].
The segregation of sealant has a significant impact on its performance, severely limiting its service life [14,15,16,17,18,19,20,21,22,23]. However, there is currently a low level of attention paid to the storage stability of sealant. The current specifications for hot poured sealant do not have clear requirements for storage stability, which can easily lead researchers, product manufacturers, and maintenance departments to overlook overlook this property.
At present, the evaluation of sealant segregation mainly refers to the softening point difference obtained from modified asphalt segregation tests to characterize sealant storage stability [9]. This method has problems such as low experimental temperature, small segregation size, and incomplete evaluation indicators of sealant, making it difficult to accurately characterize the storage stability of sealant. On the one hand, the heating temperature of the sealant is generally around 185°C, while the segregation test temperature of polymer modified asphalt is 163 ± 5°C, resulting in less representative test results. On the other hand, sealant generally contains components such as styrenebutadienestyrene (SBS) and rubber powder. After the thermal storage segregation test, the light components such as SBS inside the sealant tend to float up, while denser components such as rubber powder sink, resulting in significant differences in the composition of the upper and lower parts of the modifier. However, since both parts belong to polymer-modified asphalt sealant, and the macroscopic softening point difference may not be significant. Therefore, it is difficult to rely on this method to evaluate its storage stability [24,25,26,27].
To date, systematic studies on the optimization of evaluation methods for the storage stability of sealants in China are very limited. Most evaluation methods are still in the experimental stage, and corresponding performance evaluation standards for these methods have not been proposed. Some scholars have found through research on the storage stability of SBS modified asphalt that the difference in softening point cannot comprehensively evaluate storage stability. Others have proposed to qualitatively evaluate the storage stability of modified asphalt through microscopic means such as infrared spectroscopy and microscopic image analysis, based on the existing evaluation methods for softening point differences.
Although the storage stability of sealant is a noteworthy issue, there is limited research providing extensive analysis of performance evaluation methods and judgment standards. Therefore, this study first investigated the effects of indoor segregation behavior of sealants on their macroscopic properties, microstructure, and composition. At the same time, based on the shortcomings of existing storage stability evaluation methods and the segregation behavior of sealants, viscosity difference is proposed as a supplementary evaluation indicator for storage stability. Subsequently, a separation test device for sealant was designed, and the separation conditions were adjusted to a diameter of 50 mm, a temperature of 185°C, and a time of 8 hours. Finally, an evaluation standard for the storage stability of sealant was proposed. This study provides technical support for the performance evaluation of sealants.
2. MATERIALS AND METHODS
2.1. Materials
In this study, sealant-K was used to study the room temperature segregation behavior; sealant-K was obtained from [Shandong Kaimei Technology Co., Ltd.], and its performance indicators are shown in Table 1. Petroleum asphalt, styrene-butadiene-styrene (SBS), rubber, plasticizer, and stabilizer were selected to prepare sealant-G. The performance of the raw materials is shown in Table 2 and Figure 1.

2.2. Method
2.2.1. Low-temperature tensile tester (LITT)
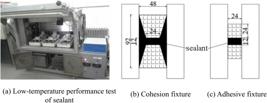
The low-temperature performance of the sealant is measured using a low-temperature performance tester for road sealant materials developed by Harbin Institute of Technology. The tensile speed is 100 mm/h, and the test temperature was –20°C. The stress and strain values of the low-temperature deformation of the sealant are obtained through the tensile test to evaluate its low-temperature deformation performance. The testing instrument and fixture are shown in Figure 2.
2.2.2. Gel permeation chromatography (GPC)
The gel permeation chromatography (GPC) test was carried out on the joint sealant using a Waters1515 gel permeation chromatograph. The test temperature was 25°C, the mobile phase was tetrahydrofuran (THF), and the flow rate was 1.0 mL/min. After passing through a certain length of chromatographic column, molecules are separated based on their relative molecular weight, with those of higher molecular weight eluting in the front (i.e. shorter elution time) and those of lower relative molecular weight in the back (i.e. longer elution time).
2.2.3. Fluorescence microscopy (FM)
The fluorescence microscopy method is based on the difference in fluorescence performance between petroleum asphalt and polymers to observe the internal component distribution characteristics of modified asphalt systems. When preparing the test sample, the sealant is first heated to 185°C until it flows well. A small amount of sealant is taken on a glass slide and briefly heated until the surface of the sample is smooth. The magnification of the experiment is 400.
2.2.4. Fourier transform infrared spectroscopy (FT-IR)
Functional groups are specific groups that describe the chemical properties of materials. By testing the changes in functional groups of materials, it is possible to determine whether a chemical reaction has occurred in the material. In order to analyze the impact of segregation behavior on material properties and reveal the mechanism behind the segregation behavior of sealant, a Nicolet iS50 Fourier transform infrared spectrometer was used in attenuated total reflection mode to test the sealant before and after segregation.
2.2.5. Storage stability test method
The storage stability of the sealant indicates the separation degree of its components after long-term thermal storage. At present, the domestic method for evaluating the storage stability of hot-poured joint sealant references the polymer modified asphalt segregation test (JTG E 20-2011 T0661). The test steps are:
-
Inject a certain amount of joint sealant into the segregation aluminum tube of the specified size and seal the nozzle (as shown in Figure 3), and place it vertically in the oven at 163 ± 5 ° C for 48 hours;
-
After heating, put the separation tube into the refrigerator for 4 hours, and after the sample is solidifies, divide it into three sections;
-
Test the softening point of the upper and lower samples, and take the difference to characterize the storage stability of the sealant.
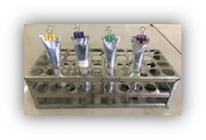
After prolonged thermal storage, less dense components such as SBS float up and gather in the upper part of the tube, while denser components such as asphaltene sink and gather in the lower part. The softening points of the upper and lower parts are different due to the change of component proportion. This method is simple to operate and intuitively shows the storage stability of modified asphalt (SBS, SBR modified asphalt) when mixed with a single modifier.
2.2.6. Viscosity measurement method
The viscosity at 180°C was measured using a Brookfield DV2T rotational viscometer (Brookfield Engineering, USA) with a SC4-27 spindle. The test was conducted according to ASTM D4402 / D4402M-15 (Standard Test Method for Viscosity Determination of Asphalt at Elevated Temperatures Using a Rotational Viscometer). Approximately 10.5 g of sealant sample was placed in the thermally controlled chamber, and the viscosity was recorded after stabilization at 180 °C for 15 min.
3. RESULTS AND DISCUSSIONS
3.1. Segregation behavior of sealant
When stored for a long time at room temperature, the components of the joint sealant undergo relative movement, resulting in changes in the relative content of the components in different parts of the sealant and affecting its road performance. In order to evaluate the effect of room temperature segregation on the performance of joint sealant, sealant-K was stored at room temperature for a long time (2 years) and then divided vertically into three equal parts (see Figures 4 and 5).

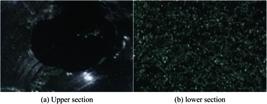
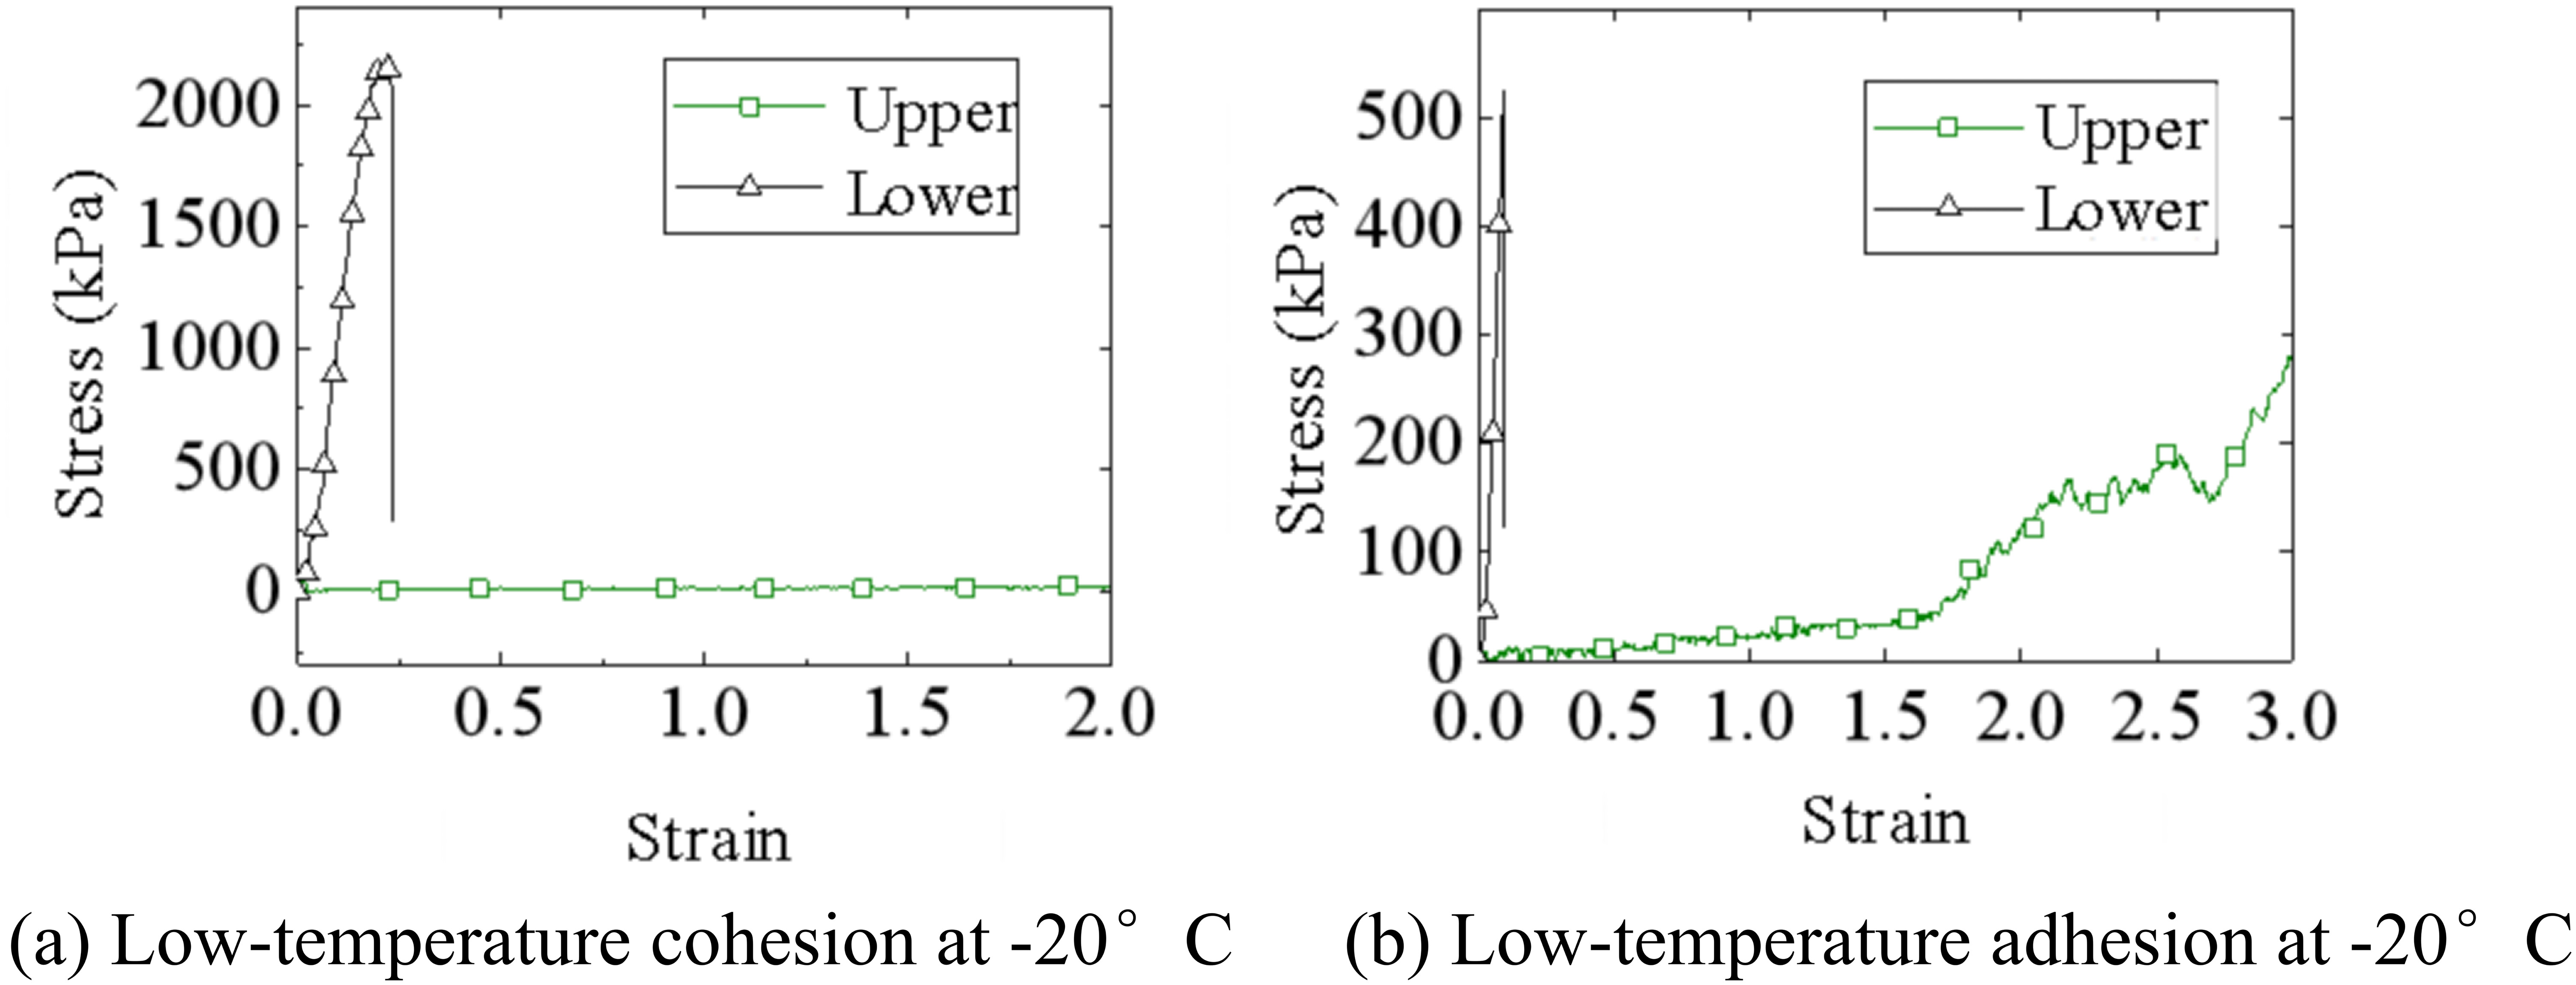
The upper and lower section of the joint sealant were taken for testing of softening point, penetration, elastic recovery, low-temperature cohesion and low-temperature adhesion. Relevant tests and results are shown in Table 3 and Figure 6.

The results of the road performance test of the upper and lower section of the sealant after segregation show that there are obvious differences between the upper and lower sections of the sealant after segregation. The upper section of the sealant is soft, and the lower section of the sealant has an obvious granular feel; their road performance shows different degrees of attenuation.
For the upper section of the sealant, the softening point after segregation is still at a high level (more than 90°C), and the cone penetration is significantly increased to 182 (0.1 mm), which is greater than the upper limit of the specification, indicating that when the sealant bears force after segregation, it will undergo large deformation and damage. Its ability to recover deformation is at a good level, with an elastic recovery rate of 59.2%. A low-temperature tensile test was conducted at –20°C, and the test piece did not fail, indicating that the upper section of the sealant still has good low-temperature deformation ability after segregation.
For the lower section of sealant, the softening point decreased to approximately 80.9°C, and the difference from the upper section is 11.2°C, which indicates that the high-temperature performance of the upper and lower sections differs significantly. The difference in cone penetration is also very significant. The cone penetration of the lower section is only 27 (0.1 mm). In the elastic recovery test, the penetration ball cannot be inserted into the test piece, and the elastic recovery test cannot be carried out, which indicates that the sealant is hard and does not meet the technical index of the sealant. In terms of deformation properties, the failure strains from the low-temperature adhesion test were 0.09 and 0.11 respectively, indicating that the deformation capacity of the sealant is insufficient, and cracking failure is easy to occur during service.
To further reveal the segregation behavior of the sealant, the upper and lower sections of the sealant were tested by infrared spectroscopy, and the test results are shown in Figure 7.
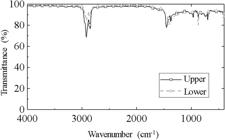
It can be seen from the test results that the absorption peaks of the separated sealant have different intensities, but the positions of the absorption peaks are the same, indicating that the segregation of the sealant is due to the relative movement of the components. The infrared spectrum characteristics of the upper section of the sealant mainly show strong SBS characteristic absorption peak (699 cm–1 and 966 cm–1) and aromatic characteristic absorption peak (1600 cm–1 and 723 cm–1) , while the lower section shows strong sulfate S-O absorption (873 cm–1) and sulfite S-O absorption (711 cm–1). This indicates that after separation, light components and SBS are mainly concentrated in the upper section, while rubber powder and asphaltene are mainly concentrated in the lower section. Therefore, the macro marking is that the upper section of the joint sealant is soft after segregation, and the lower section of the joint sealant is hard and has an obvious grain sense.
3.2. Study on supplementary evaluation index of storage stability
3.2.1. Limitations of existing evaluation methods
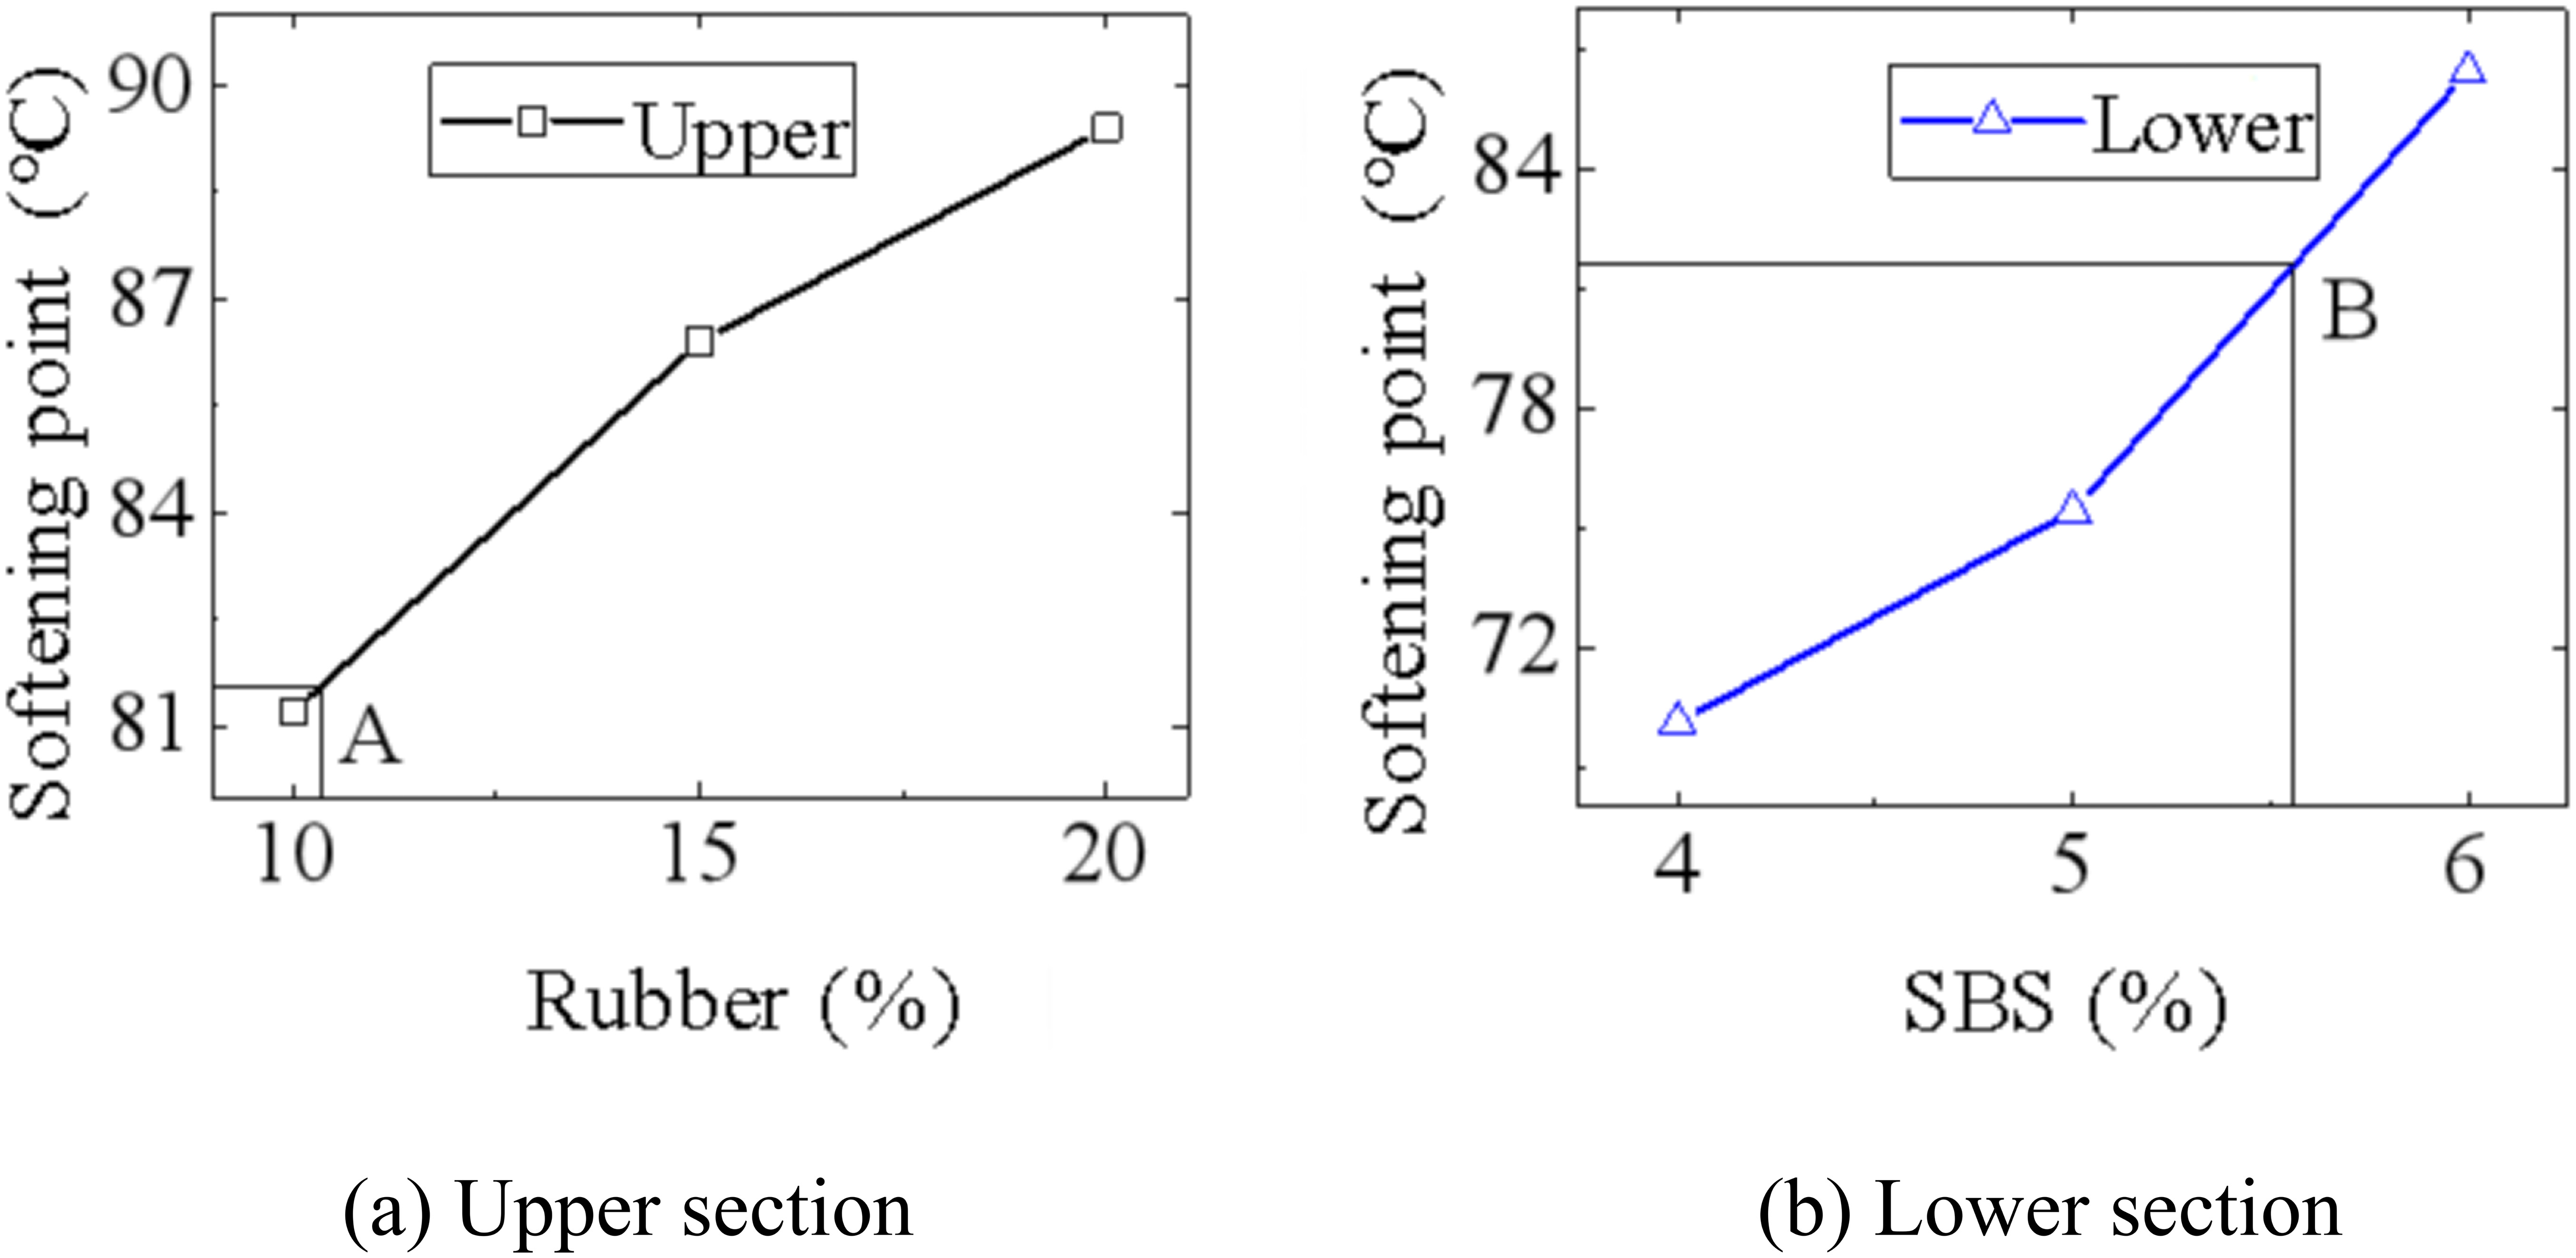
After the segregation of the joint sealant, the light component and SBS content increase in the top part, while asphalt and rubber powder increase in the bottom part. Both SBS and rubber powder can improve the high-temperature performance of the matrix asphalt to a certain extent. Therefore, there is a possibility that the softening point of the sealant in the upper and lower sections may be the same after segregation. To demonstrate the limitation of evaluating the storage stability of sealant using the softening point difference value as an indicator, a sealant was prepared with a rubber powder content of 15% and SBS content of 4%, 5%, and 6%, respectively, to simulate the lower stage of sealant after segregation. At the same time, sealant was prepared with 6% SBS and rubber powder contents of 10%, 15%, and 20% to simulate the upper section. Their softening points were tested separately, and the results are shown in Figure 8.

Points A and B with the same softening point were selected from the two sets of tests. They indicate that the softening point of the sealant prepared with 15% rubber powder and 5.5% SBS, and the content of 10.5%, and that prepared with 10.5% rubber powder and 6% SBS, are both 81.5°C. That is, even though the SBS and rubber powder contents differ after segregation, the softening point may be the same, so the softening point difference alone is difficult to use to evaluate storage stability.
3.2.2. Selection of supplementary evaluation indicators
The conventional evaluation indicators of joint sealant include softening point, cone penetration, elastic recovery, and fluidity, etc. Cone penetration is characterized by the depth that the standard cone penetration into the sample at 25°C, and the elastic recovery rate is characterized by the degree of recovery after the standard cone is withdrawn from a specified depth at 25°C. The effect of additives in the joint sealant on the two indicators is consistent, and its difference is small at room temperature, which is difficult to characterize the degree of segregation. Fluidity refers to the fluidity of the sealant at 60°C. This index varies widely, which easily leads to irregular evaluation results. The above indices are difficult to use to reflect the storage stability of the sealant.
After the segregation of the sealant, the light components of the base asphalt and SBS float and gather in the upper part, while rubber powder and other heavy components sink and gather in the lower part of the sealant. At temperatures above 180°C, the SBS in the upper sealant is fully melted (T>Tg2) and the content of light components is high, so the viscosity of the upper joint sealant is low. However, the lower part of the sealant contains less light components. In addition, the rubber powder sinks in the lower part, resulting in an increase in its content. The rubber powder is not fully swelled. Under the action of the external force field, the internal friction is large, and the resistance to deformation is strong. With the increase of heating temperature, the rubber powder softens, and the viscosity difference between the upper and lower sections becomes smaller. Therefore, the viscosity difference at the normal construction temperature of the sealant (180°C) can be used as a supplementary evaluation index to intuitively and conveniently judge the degree of performance difference between the upper and lower sections of the sealant, namely the degree of segregation.
The degree of segregation of sealant increases with the increase of segregation time. To verify the consistency between the segregation evaluation index and the degree of segregation, the sealant-K is subjected to segregation tests at different times (6 h, 12 h, 24 h, 36 h, 48 h) to evaluate its softening point difference and 180°C viscosity difference. The test results are shown in Figure 9.
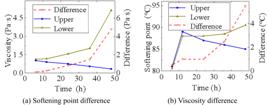
It can be seen from the test results that the softening point difference value increases with the increase of the separation time, but the softening point of the upper and lower sections changes nonlinearly. The softening point of the upper section of the sealant increases first and then decreases, indicating that the increase of SBS in the early stage improves the high-temperature performance. With increasing separation time, the light component content in the upper section becomes very high, causing its softening point to decrease, while the softening point of the lower section increases. Based on the previous study (large softening point difference, crack sealant segregation, small softening point difference does not necessarily mean no segregation), it can be seen that when the segregation time is greater than 12 h, the sealant has undergone a certain degree of segregation, and the separation of components causes the softening point to change.
For the viscosity difference, the viscosity of the upper section of the joint sealant decreases with the increase of the separation time, and the viscosity of the lower section of the joint sealant increases with the increase of the separation time. This is because with the increase of the separation time, the light components and SBS are more concentrated in the upper part of the separation tube, while the lower part contains progressively less rubber powder and light components. Therefore, with the increase of the separation time, the viscosity of the upper section decreases, and the viscosity of the lower section increases. The viscosity difference increases with the increase of the separation time. Thus, the viscosity difference increases as the degree of segregation increases.
Therefore, 180°C viscosity difference can be used as a supplementary evaluation index to evaluate the degree of segregation.
3.3. Development of segregation test mould
The segregation condition of the sealant has an important impact on the test results. The current segregation diameter is too small, which limits the movement of the polymer and affects the test results. In order to explore the influence of the size of the separation tube on the storage stability of the seam sealant, and then determine the test conditions for the storage stability, and considering that an excessively large separation tube would waste material and reduce test operability, the diameter of the separation tube is set in this section to be 25 mm, 35 mm, 50 mm and 65 mm in this section. The separation tube was designed as a three-section sleeve with an effective height of 50 mm per section to ensure uniform sample separation; the total effective height of the separation tube is 150 mm, Both the upper and lower base plates are provided with grooves matching the outer diameter of the sleeve, and silica gel gaskets with matching dimensions are provided between the sleeves and between the sleeve and the base plate as sealing materials to prevent the sample from flowing out from the side wall during separation. The design and renderings are shown in Figure 10.

Using the developed segregation test mold, segregation test were carried out on the self-made joint sealant, and the softening point difference, viscosity difference and fluorescence microscope images were compared. The results are shown in Figure 11.

From the analysis of softening point difference, generally, the larger the size of the separation tube, the more obvious the degree of separation. For the different tube diameters, the softening point differences were: 3.0°C (25 mm), 9.5°C (35 mm), 5.5°C (50 mm), and 7.5°C (65 mm). The value does not increase monotonically, showing the rule of first increasing, then decreasing, and then increasing. On the one hand, it shows that different degrees of segregation have occurred in the sealant, on the other hand, it shows that the softening point difference is not enough to characterize the segregation degree of the sealant; The viscosity difference increases with the increase of the segregation size, but tends to be flat, indicating that the segregation degree of the sealant increases, but the influence of segregation size on the degree of segregation diminishes.
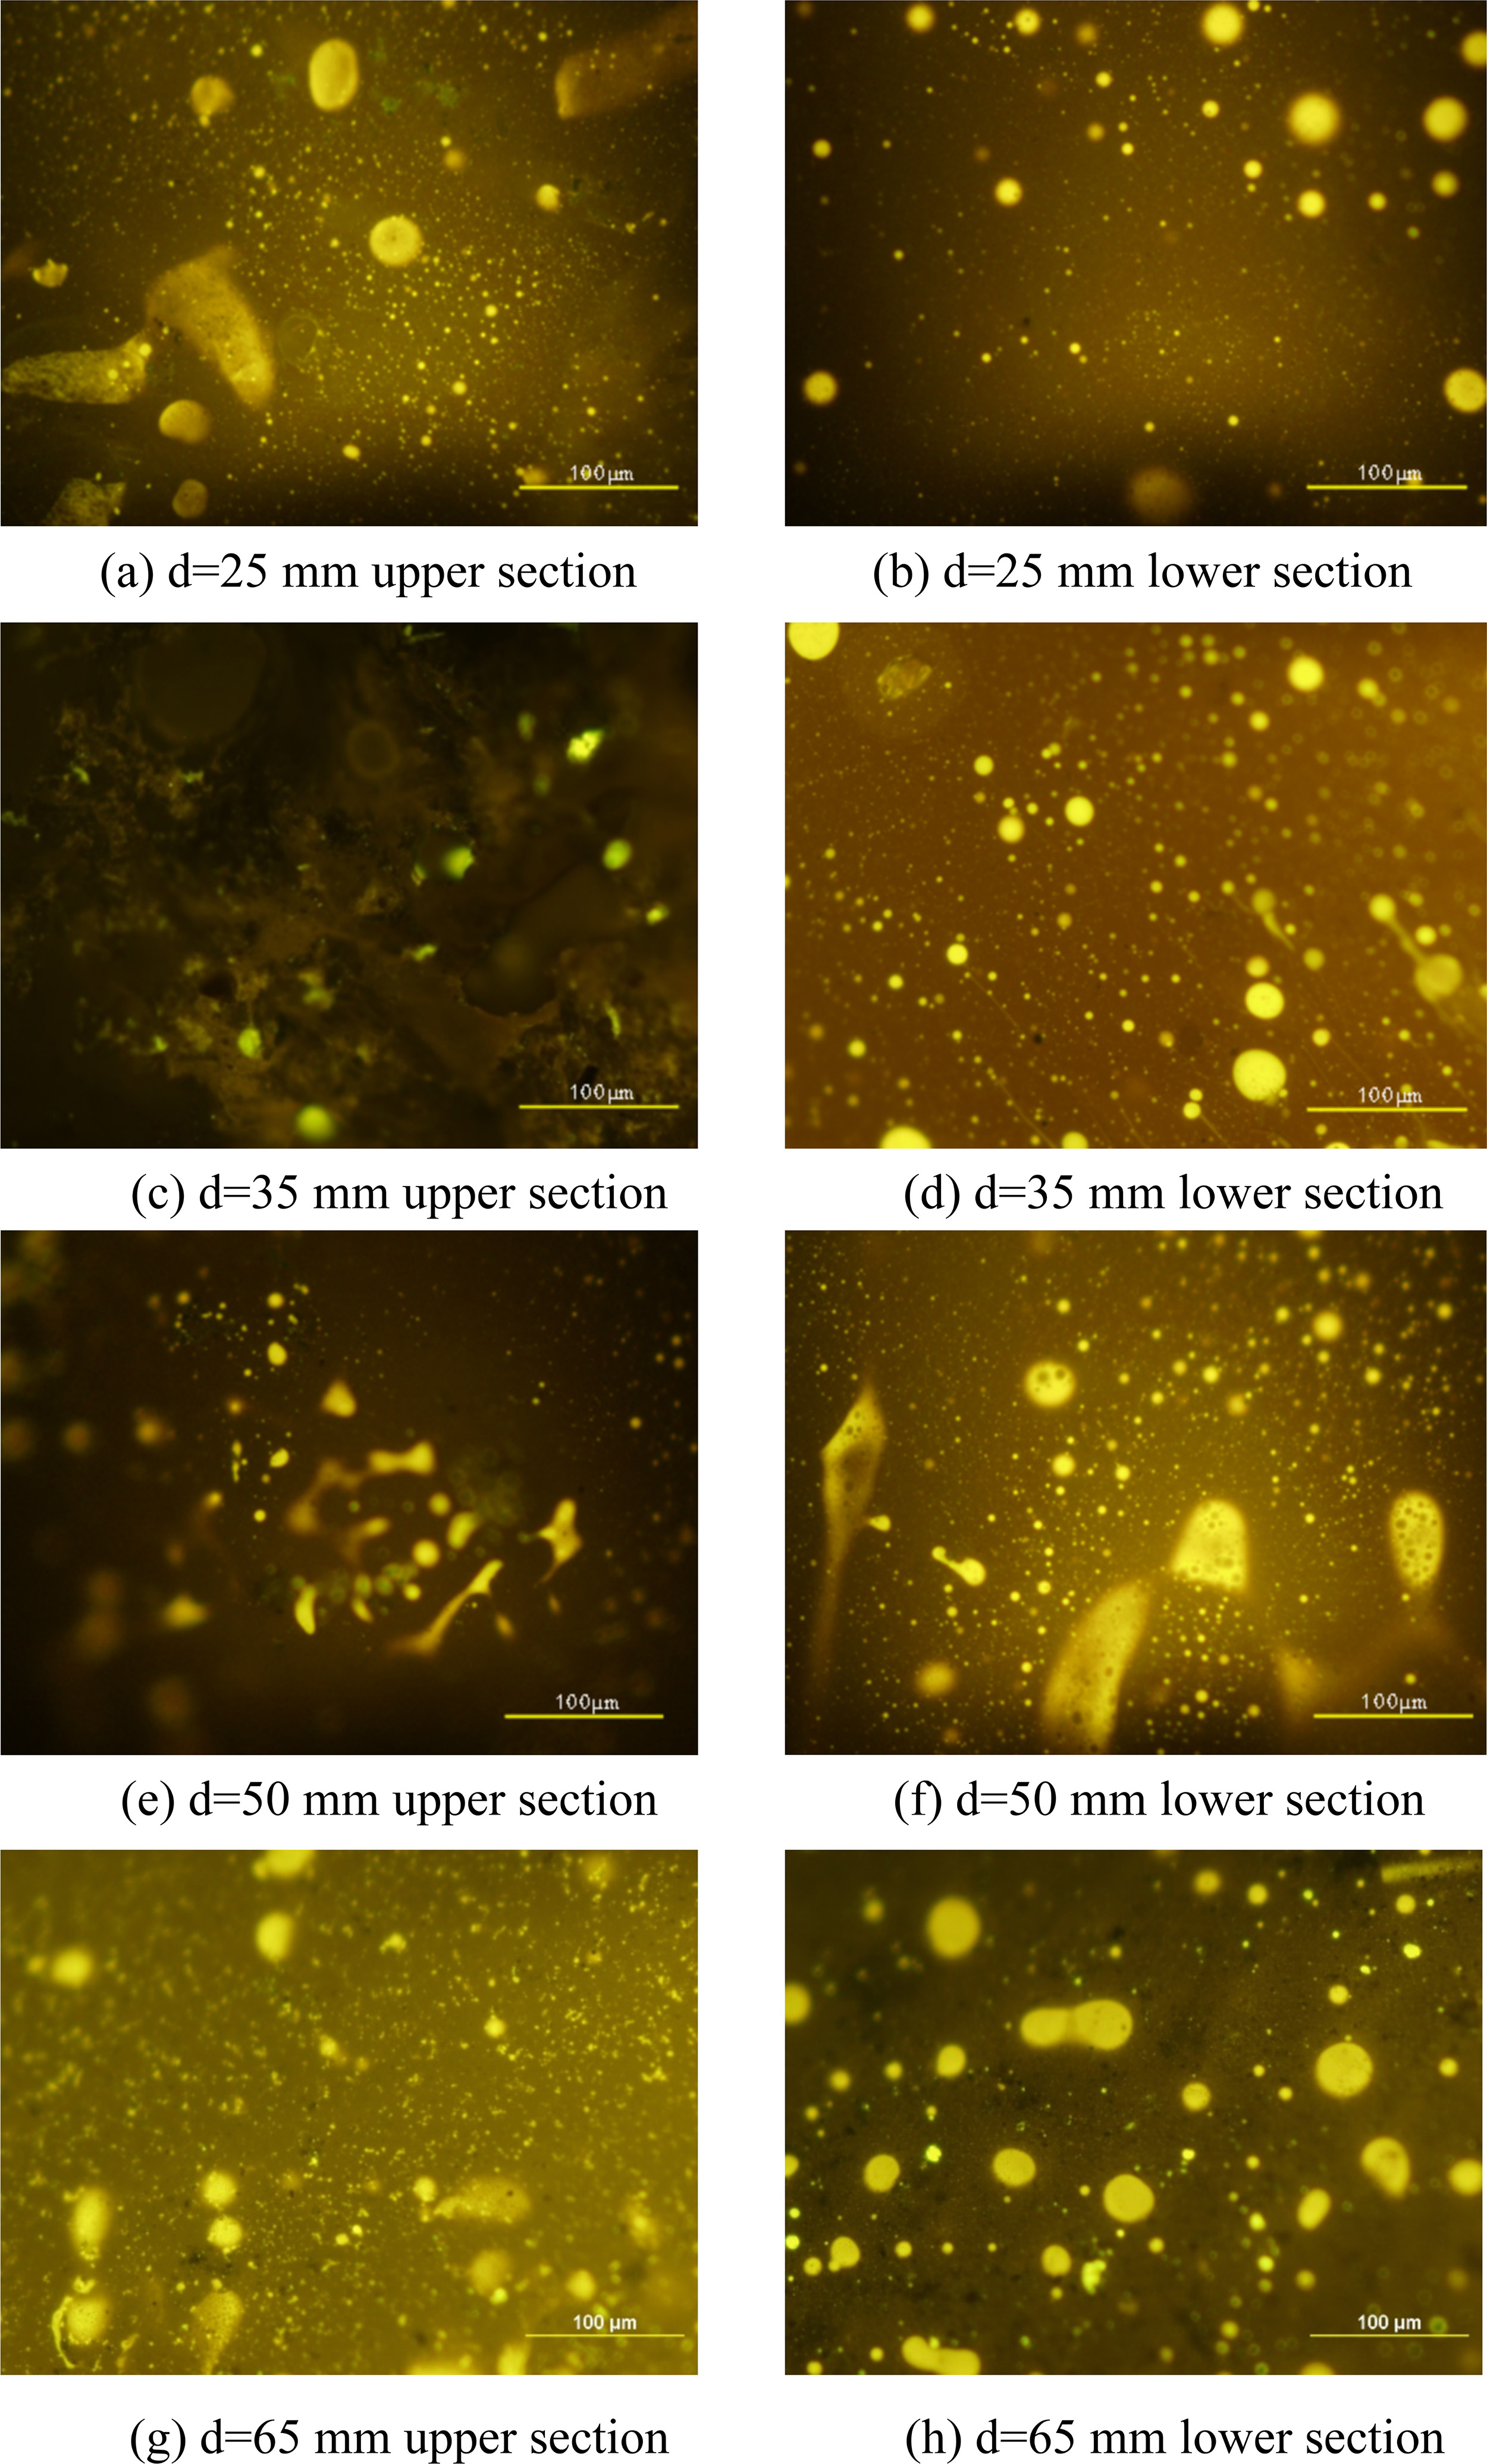
The microstructure of the upper and lower sections of the seam sealant after thermal separation was observed using a fluorescence microscope at 200x magnification. The test results are shown in Figure 12.
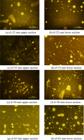
Rubber powder and SBS in the sealant exhibit fluorescence. It can be seen from the fluorescent microscope test results that for the 25 mm separation tube, the light spots with different sizes in the upper section are distributed separately, and the fluorescent light spots of the lower section are more than the upper section, indicating that the content of polymer (SBS and rubber powder) in the lower section is greater than that in the upper section after separation, and the joint sealant has a certain degree of separation; For the seam sealant of 35 mm separation tube, the fluorescence phenomenon of the upper and lower sections of the seam sealant is significantly different, and the same phenomenon also occurs for the upper and lower sections of the seam sealant under the separation diameter of 50 mm and 65 mm. With the increase of the separation diameter, the small fluorescence point of the upper section increases, the fluorescence phenomenon increases and there is a tendency to agglomerate; With the increase of the segregation diameter, the small fluorescent spots of the lower section of the seam sealant decrease, and there are always irregular blocky fluorescent areas. It is characterized that the degree of segregation of the seam sealant increases with the increase of the segregation diameter. In addition, it can be speculated that the small and small fluorescent spots of the upper seam sealant are mainly SBS, and the irregular block structure is agglomerated SBS; The regular block structure in the lower section of the joint sealant is mainly rubber powder dissolved in asphalt.
To semiquantitatively compare the segregation degree at different diameters, the fluorescence micrographs were analyzed using ImageJ software. For each image, the area fraction of fluorescent polymer phase (SBS and rubber powder) was calculated. For d = 25 mm, the uppertolower area fraction ratio was 0.68; for d = 35 mm, it was 0.42; for d = 50 mm, it decreased to 0.23; and for d = 65 mm, it reached 0.19. The sharp decrease from d = 35 mm to d = 50 mm indicates that increasing the diameter to 50 mm effectively allows full segregation, while further increase to 65 mm gives only marginal additional separation. This semiquantitative trend supports the selection of 50 mm as the optimal diameter.
In summary, when the size of the separator tube increases to 50 mm, the influence of size effect on the segregation degree of the sealant is reduced to a small extent. In addition, the increase of the diameter results in the increase of material consumption and practical concerns; therefore, the final diameter of the separator tube is determined to be 50 mm in this paper. In addition, combined with the actual construction conditions of the joint sealant, the final test conditions are determined as follows: the separation time is 8 h, and the separation temperature is 185°C.
3.4. Research on storage stability evaluation standards
As the degree of segregation of the sealant increases, its performance degradation also increases. In addition, existing studies have shown that the failure mode that occurs during the service process of the sealant is mainly adhesion. Therefore, this article establishes a correlation between different degrees of segregation and the adhesion of the sealant in order to develop evaluation standards for storage stability.
The low-temperature adhesion of the sealant before segregation is shown in Figure 13, with a failure strain of 1.53. To simulate different degrees of segregation, sealant-K was subjected to segregation tests at different times (aluminum tube, 8 hours, 12 hours, 16 hours, 20 hours) to test the softening point, viscosity, and low-temperature adhesion failure strain of its upper and lower segments. The test results are shown in Table 4 and Figure 14.


By characterizing different degrees of segregation by segregation time, combined with previous research, it can be concluded that the greater the degree of segregation, the greater the viscosity difference. For low- temperature deformation capacity, when conducting low-temperature adhesion tensile test at –20°C, the failure strain of the adhesive test specimen reached 1.53. After varying degrees of segregation, the adhesion of the upper and lower sections of the joint sealant changed to varying degrees. The upper section of the joint sealant was still relatively soft at low temperatures due to the floating of light components, and could deform well without fracture. Therefore, the low-temperature adhesion of the upper section was maintained at a good level or even improved. The lower segment undergoes varying degrees of attenuation. Under the conditions of a softening point difference of 4.9°C and a viscosity difference of 1.724 Pa·s for the degree of segregation, the adhesive adhesion of the lower segment grouting adhesive decreases less, with a failure strain of 1.02 at –20°C, which is 33.3% lower than before segregation; The softening point difference reaches 6.8°C, and the viscosity difference is 4.01 Pa·s. Under this degree of segregation, the adhesion of the lower section of the grouting adhesive has undergone significant attenuation. The failure strain at –20°C is 0.77, and the attenuation degree reaches 49.7%. Moreover, as the viscosity difference increases, the attenuation degree of the adhesion failure strain at the lower section is close to or even greater than 50%.
Based on the quantitative relationship between viscosity difference / softening point difference and the percentage reduction in lowtemperature adhesion failure strain, the thresholds of 2 Pa·s and 5 °C were identified as the points beyond which the lowersection sealant exhibits more than 40 % loss in failure strain, indicating unacceptable performance degradation.
4. CONCLUSIONS
This study mainly explores an evaluation method of storage stability of sealant. In view of the shortcomings of the existing evaluation methods and indicators, this paper proposes supplementary evaluation indicators and adjusted test conditions, and proposes evaluation criteria for the storage stability in combination with the attenuation of road performance. The main research findings and conclusions are as follows:
-
The shortcomings of the current evaluation method for the storage stability of seam sealant are analyzed, and it is verified that the softening point difference is not suitable for evaluating the storage stability of seam sealant.
-
The segregation behavior of the sealant was studied. It was revealed that the segregation of the sealant was the behavior of SBS and light components floating up and rubber powder sinking.
-
The viscosity difference at 180°C is proposed as an additional evaluation index of storage stability, and its rationality is verified by different separation time tests.
-
By setting different segregation diameters, the influence rule of segregation diameter on the index of storage stability of sealant was explored, and the segregation diameter was determined to be 50 mm. According to the actual construction characteristics of the joint sealant, the segregation temperature is 185°C and the segregation time is 8 h.
5. ACKNOWLEDGMENTS
This work was supported by the National Natural Science Foundation of China with Grant No. 52308455, the National Key Research and Development Program of China with Grant No. 2022YFE0137300, the Gansu Province Major Science and Technology Special Plan with Grant No. 22ZD6GA010, the Central Public-Interest Scientific Institution Basal Research Fund (20247502), and the Guangxi Key Research and Development Program under grant number AB24010335, and the Guangxi Key Research and Development Program under grant number AB25069312.
6. DATA AVAILABILITY
All data supporting the findings of this study are provided in full within the paper.
7. BIBLIOGRAPHY
- [1] MASSON, J.F., Construction technology update, Ottawa, National Research Council, 2001.
- [2] AL-QADI, I.L., Development of performance-based guidelines for selection of bituminous-based hot-poured pavement crack sealant: an executive summary report, Richmond, Virginia Transportation Research Council, 2009.
- [3] UNITED STATES, Federal specification SS-S-1401C sealant, joint, non-jet-fuel-resistant, hot-applied, for portland cement and asphalt concrete pavements, Washington D.C., 1984.
- [4] RUSSIA, GOST 30740-2000 Sealing materials used in joints of aerodrome coat, Moscow, 2000.
- [5] BRITISH STANDARDS INSTITUTION, EN 14188–2004 Joint fillers and sealants, London, 2004.
- [6] AMERICAN SOCIETY FOR TESTING AND MATERIALS, ASTM standard test methods for sealants and fillers, hot-applied, for joints and cracks in asphaltic and portland cement concrete pavements, v. 04.03, West Conshohocken, ASTM, 2015.
- [7] AMERICAN SOCIETY FOR TESTING AND MATERIALS, ASTM standard specification for joint and crack sealants, hot-applied, for concrete and asphalt pavements, v. 04.03, West Conshohocken, ASTM, 2015.
- [8] AMERICAN SOCIETY FOR TESTING AND MATERIALS, ASTM standard specification for crack filler, hot-applied, for asphalt concrete and Portland cement concrete pavements, v. 04.03, West Conshohocken, ASTM, 2016.
- [9] CHINA, JT/T 740-2015 hot-poured sealants for pavement, Beijing, China Communications Press, 2015.
- [10] COLLINS, P., MASSON, J.F., AL-QADI, I.L., “Cooling rates in hot-poured bituminous sealants”, In: Proceedings of the 85th Annual Meeting of the Transportation Research Board, Washington, D.C., January 2006.
-
[11] MASSON, J.F., COLLINS, P., LOWERY, M., “Temperature control of hot-poured sealants during the sealing of pavement cracks”, Construction & Building Materials, v. 19, n. 6, pp. 423–429, 2005. doi: https://doi.org/10.1016/j.conbuildmat.2004.09.001.
» https://doi.org/10.1016/j.conbuildmat.2004.09.001 - [12] MASSON, J.F., “Degradation of bituminous sealants due to extended heating before installation: a case study”, In: Proceedings of the 85th Annual Meeting of the Transportation Research Board, Washington, D.C., January 2006.
-
[13] MASSON, J.F., LAUZIER, C., COLLINS, P., et al, “Sealant degradation during crack sealing of pavements”, Journal of Materials in Civil Engineering, v. 10, n. 4, pp. 250–255, 1998. doi: https://doi.org/10.1061/(ASCE)0899-1561(1998)10:4(250).
» https://doi.org/10.1061/(ASCE)0899-1561(1998)10:4(250) -
[14] SOLIMAN, H., SHALABY, A., KAVANAGH, L., “Performance evaluation of joint and crack sealants in cold climates using DSR and BBR tests”, Journal of Materials in Civil Engineering, v. 20, n. 7, pp. 470–477, 2008. doi: https://doi.org/10.1061/(ASCE)0899-1561(2008)20:7(470).
» https://doi.org/10.1061/(ASCE)0899-1561(2008)20:7(470) -
[15] SOLIMAN, H., SHALABY, A., “Characterizing the low-temperature performance of hot-pour bituminous sealants using glass transition temperature and dynamic stiffness modulus”, Journal of Materials in Civil Engineering, v. 21, n. 11, pp. 688–693, 2009. doi: https://doi.org/10.1061/(ASCE)0899-1561(2009)21:11(688).
» https://doi.org/10.1061/(ASCE)0899-1561(2009)21:11(688) -
[16] AL-QADI, I.L., LOULIZI, A., AREF, S., et al, “Modification of bending beam rheometer specimen for low-temperature evaluation of bituminous crack sealants”, Transportation Research Record: Journal of the Transportation Research Board, v. 1933, n. 1, pp. 95–106, 2005. doi: https://doi.org/10.1177/0361198105193300111.
» https://doi.org/10.1177/0361198105193300111 - [17] AL-QADI, I.L., “Development of crack sealant bending beam rheometer (CSBBR) testing to characterize hot-poured bituminous crack sealant at low temperature”, Electronic Journal of the Association of Asphalt Paving Technologists, v. 76, pp. 85–121, 2007.
-
[18] AL-QADI, I.L., FINI, E.H., “Development of a crack sealant adhesion test (CSADT) specification for hot-poured bituminous sealants”, Journal of Testing and Evaluation, v. 39, n. 2, pp. 1–7, 2011. doi: https://doi.org/10.1520/JTE103108.
» https://doi.org/10.1520/JTE103108 -
[19] YANG, S.H., AL-QADI, I.L., MCGRAW, J., et al, “Threshold identification and field validation of performance-based guidelines to select hot-poured crack sealants”, Transportation Research Record: Journal of the Transportation Research Board, v. 2150, n. 1, pp. 87–95, 2010. doi: https://doi.org/10.3141/2150-11.
» https://doi.org/10.3141/2150-11 -
[20] OZER, H., YOUSEFI, S.S., AL-QADI, I.L., et al, “Field validation of laboratory-predicted low-temperature performance of hot-poured crack sealants”, Transportation Research Record: Journal of the Transportation Research Board, v. 2431, n. 1, pp. 57–66, 2014. doi: https://doi.org/10.3141/2431-08.
» https://doi.org/10.3141/2431-08 -
[21] HU, X.D., ZHOU, F.J., HU, S., et al, “A new laboratory evaluation method for the adhesive performance of crack sealants”, Journal of Testing and Evaluation, v. 39, n. 2, pp. 1–7, 2011. doi: https://doi.org/10.1520/JTE102845.
» https://doi.org/10.1520/JTE102845 - [22] LI, F., HUANG, S.C., “Low-temperature stress relaxation evaluation index of asphalt pavement crack sealants”, Journal of Tongji University, v. 40, n. 8, pp. 1185–1188, 2012.
-
[23] OZER, H., YOUSEFI, S.S., AL-QADI, I.L., et al, “Field aging and development of aging model for hot-poured crack sealants”, Transportation Research Record: Journal of the Transportation Research Board, v. 2481, n. 1, pp. 90–99, 2015. doi: https://doi.org/10.3141/2481-12.
» https://doi.org/10.3141/2481-12 -
[24] AL-QADI, I.L., FINI, E.H., ELSEIFI, M.A., et al, “Viscosity determination of hot-poured bituminous sealants”, Transportation Research Record: Journal of the Transportation Research Board, n. 1958, pp. 74–81, 2006. doi: https://doi.org/10.1177/0361198106195800109.
» https://doi.org/10.1177/0361198106195800109 -
[25] LI, F., LI, L., LI, T.G., “Viscosity evaluation index of hot-applied sealant for asphalt pavement”, Transportation Research Record: Journal of the Transportation Research Board, v. 2481, n. 1, pp. 83–89, 2015. doi: https://doi.org/10.3141/2481-11.
» https://doi.org/10.3141/2481-11 -
[26] WANG, Y., WEI, J., CHI, F., et al, “Evaluation of fatigue behavior in asphalt mixtures using bidirectional splitting and indirect tensile testing”, Matéria, v. 30, e20250035, 2025. doi: https://doi.org/10.1590/1517-7076-rmat-2025-0035.
» https://doi.org/10.1590/1517-7076-rmat-2025-0035 -
[27] ZHAO, L., ZHU, R., LI, W., et al, “Preparation and properties of optimized waterborne epoxy resin mixed with SBR modified emulsified asphalt”, Matéria, v. 30, e20240734, 2025. doi: https://doi.org/10.1590/1517-7076-rmat-2024-0734.
» https://doi.org/10.1590/1517-7076-rmat-2024-0734