 Study of dislocation density and residual stresses on spot welded joints of advanced high strength steel
ABSTRACT
The knowledge of the residual stresses generated in the welding process is especially important in the performance and service life of the welded structures and components. In this context, the present work aims to study the residual stresses generated in welded joints of advanced high strength steel (22MnB5), with Fe-Zn alloy coating, called GA (galvannealed), utilizing the resistance welding process. Residual stresses were experimentally analyzed using X-ray diffraction, employing the sen2psi technique. Vickers microhardness analyses were conducted, and the obtained measurements were incorporated into mathematical formulations to estimate the dislocation density in the analyzed region, employing a model based on microhardness measurements. Microstructural characterizations were carried out using optical microscopy (OM) and scanning electron microscopy (SEM), correlating with the residual stress results. The dislocation density results were approximately ρt = 7.42 × 10¹⁵ m2 for the weld metal and 7.05 × 10¹⁷ m2 for the base metal. The residual stress indicated compressive values with mean measurements ranging from 250 to 450 MPa, accompanied by hardness values spanning from 200 to 600 HV. These results demonstrate that the proposed technique holds promise for dislocation density evaluation.
Keywords:
Residual stress; Dislocation density; 22MnB5 steel welded joint; Vickers microhardness; Electric resistance welding process
1. INTRODUCTION
The electric resistance welding (ERW) process is widely used in the automotive and aeronautical industries, among other sectors. This process is in continuous development, due to its importance as a manufacturing process, as it has, in its different modalities, characteristics that are beneficial to the industry interest, such as high degree of automation and/or robotization, high productivity, low deformation level (when compared to other welding processes).
One of the most important mechanisms of plastic deformation is sliding between atomic planes. This slip, in turn, depends on the pre-existence of dislocations and on their respective mobility in the most favorable directions. The increase in material resistance will depend on the presence of elements that block the movement of these dislocations, such as the intersection of dislocations with a different direction of movement, generating potential sources of Frank-Read, or cross sliding (crosslip). Furthermore, the presence of elements in solid solution or precipitates will also help in blocking and generating new dislocations [1]. ZHOU et al. [2] found that the motion of screw dislocations in close-packed planes governs plasticity in BCC metals. Interfaces, such as grain boundaries, have been shown to play a key role in material strength. Interfaces are barriers to glide dislocations, and the dislocations pile up at interfaces, increasing the strength and causing loss of ductility [3]. Therefore, it is important to describe the behavior and movement trend of dislocations, which will occur during the welding process, in order to obtain an additional parameter of the mechanical resistance of the welded joint.
Among the advanced high-strength steels, hot-stamped steel, called HF, was developed to combine good fracture toughness and high strength. Such steel is an alternative to the limitations of dual-phase (DP) steel and involves the manufacture of a material with high ductility and good hardenability characteristics. During the stamping process, the material undergoes quenching and tempering treatments, that greatly increases the ultimate tensile strength with little residual deformation when subjected to impacts. The elastic recovery effect is also minimized, due to the forming process being carried out at high temperatures [4].
The deformation of the material increases the formation of dislocations movement and their accumulation. The hardening of the material comes from the accumulation of dislocations that occur in regions of uniform plastic deformation and in a random way are called statistically accumulated dislocations (SSD). Dislocations that accommodate displacement mismatches in a polycrystal caused by plastic strain gradients are referred to as geometrically necessary dislocations (GND). The existence of GNDs is necessary in order to provide compatible deformations in crystals boundary. ABU et al. [5] also point out that GNDs and SSDs are not similar since both are different in nature. The GNDs are originated as a function of accommodation of deformation gradients resulting from the curvature of the crystal lattice [5,6,7].
The density of SSDs is characteristic of the material, i.e., crystal structure, shear modulus, stacking fault energy, etc. The density of GNDs is characteristic of the microstructure, that is, of the geometric arrangement and size of the grains and phases.
This work aims to evaluate the behavior of residual stresses measured experimentally by X-ray diffraction in resistance welds of advanced high-strength steel plates GA (galvannealed) and its correlation with the variation in the dislocation density, measured by microhardness analyzes. Tension shear tests were carried out to know the mechanical properties of the welded specimens.
The methodology used is justified because the calculation of dislocations, through microhardness measurements, is a recently developed procedure that can be an interesting alternative to more complex techniques, such as transmission electron microscopy (TEM) and Electron backscatter diffraction (EBSD). A model based on microhardness measurements of the base metal and weld metal was used. Furthermore, residual stress analyzes were carried out to compare with the calculated dislocation density. Microstructural analyzes by optical microscopy (OM) and scanning electron microscopy (SEM) complement the study.
2. MATERIALS AND METHODS
In this work, spots welded joints made of advanced high-strength steel 22MnB5, coated with a Zn-Fe alloy, 1,8 mm thick, were studied. Tables 1 and 2 provide detailed information on the chemical composition and mechanical properties of the steel, respectively.
The spot welding operations were carried out using the MAS IB 1 PA75/500 SA machine, a stationary spot welder manufactured by Arcservice, with a maximum average output power of 150 KVA. The electrode caps used in this study for the welds are of type 2 (RWMA 2.18200), with a composition of Cu/Cr and a hardness of 75HRB.
For the measurement of time, voltage, and welding current, a Miyachi MM-380A analyzer was used. A Miyachi MA-771 digital current sensor was used for current calibration.
A calibration procedure for the spot welder was conducted before the start of experiments to ensure the accuracy of the welding parameters (time, current and pressure). A resistance weld checker tester (Advanced Handheld Weld Checker – MM-380A), was used to provide fast, precise, and comprehensive measurements of the resistance welding process. This checker utilizes a weld sensor to simultaneously measure the current, voltage and force between the electrodes.
The spot-welding process parameters are shown in Tables 3 and 4.
To find the best condition of power versus time cycles, tensile tests were carried out at 60%, 65%, 70%, 75%, 80%, 85% and 90% of welding power with welding times (measured in time cycles): 10 cycles, 15 cycles, 20 cycles, 25 cycles and 30 cycles. After the initial tensile tests, the best conditions were chosen in terms of weldability, and the chosen ones were 65% and 85%.
One group of samples was prepared with machine power adjusted to 65% and another group adjusted to 85% of maximum power.
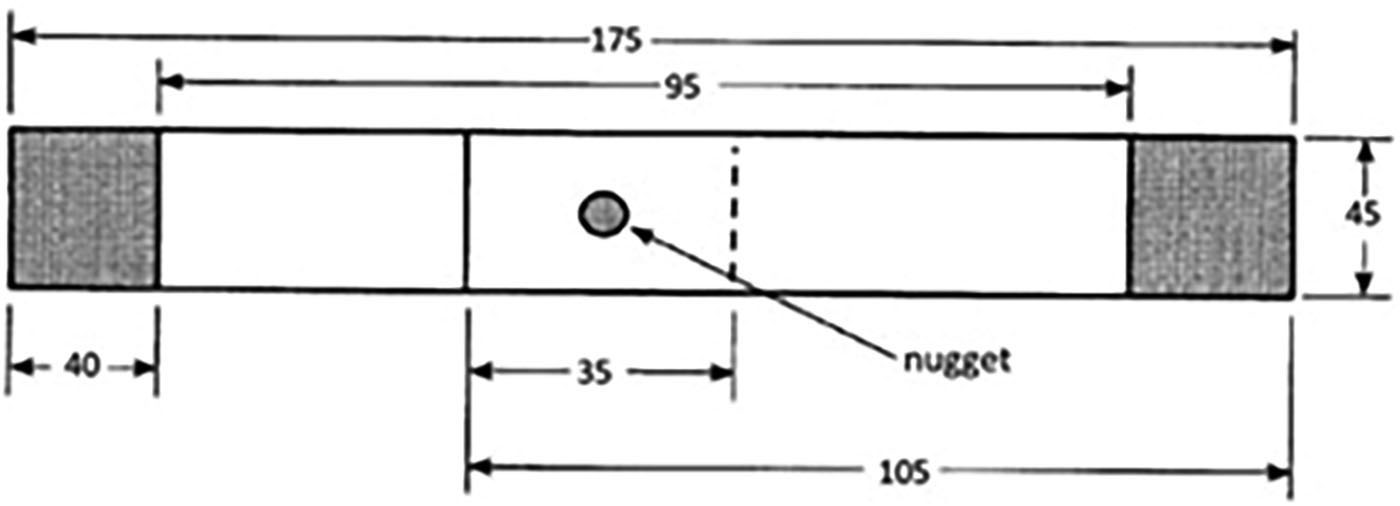
The specimens were submitted to shear tests, in the INSTRON model 5985 machine in dimensions accordingly sketch in Figure 1, according to the standard D8.9 [8].

Samples preparation for microhardness testing and microstructural analyzes followed the standard procedure using 220, 320, 400, 500, 600 and 1200 sandpaper, followed by polishing with 6, 3 and 1 μm diamond paste. The specimens were attacked with 2% Nital. Microstructural analyzes were performed by optical microscopy (OM) and some measures with scanning electronic microscopy (SEM), to validate the OM measurements.
The standard microhardness testing was carried out in a machine of Wilson Instruments, Model 422 MVD, load of 300 kgf, with measurements taken on the base metal, HAZ and FZ (nugget), resulting in a hardness profile.
Analyses of surface and subsurface residual stresses were carried out on the welded samples, according to the points indicated in Figure 2a (in the center of the fusion zone - FZ and on the edges of the nugget). Knowledge of the behavior of subsurface residual stresses, in depth, is important for comparison with the stress fields present in the transverse section of the weld metal, after cold cutting and electrolytic polishing. Cold cutting followed by electrolytic polishing of the layer affected by the cut was used to minimize the effect of cutting on residual stresses. After sample preparation, residual stress measurement was realized in points 1, 2 and FZ, as depicted in Figure 2b.

Samples with indication of the residual stress measure points: (FZ: fusion zone): (a) after welding, with dimensions; (b) transverse section of sample.
A residual stress analyzer of the XStress 3000 model, manufactured by Stresstech, was used. The method used for analysis was sen2ψ, with Crkα radiation, diffracting the plane (211) of the ferrite, with a voltage of 30 kV and a current of 6.7 mA (ref. Software User´s Guide 3000 v.1,22e). The equipment provides, through the X3000 software, the residual stress value at the measured point.
A methodology for dislocation density calculation was applied, according to equations (1)–(7) [9]:
Where:
H0 = Bulk material hardness,
HSSD = hardness due the statically trapped dislocations,
Hmi = Microhardness of material,
HISE = Hardness due the superposition of SSDs and GNDs.
Where
HSSD = Hardness resulting from SSDs.
M = Taylor factor
α = Nye factor = 2.0
b = Burgers, vector module
G = Shear module,
ρS = SSD density
Θ = indentator face angle
f = factor considered as 1.0
The SSD density is calculated by the following equation and procedure:
In the base metal (MB) specimens, indentations were made with load variations of 1000, 500, 300, 200, 100, 50, 25 and 10 gf, and the graph of HV (Vickers microhardness) vs. h (indentation depth) was generated. The hardness assessment for loads less than 100 gf was made by amplifying the image of the indentations with a 100X objective from optical microscope. For each region of the sample, 10 indentations were carried out for each load, in order to obtain statistically coherent values.
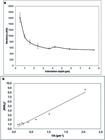
Two graphs were generated, one for analyzing the HVi x hi relationship, and the other using the Nix-Gao relationship [10]. When the relation (H/H0)2 × 1/h is plotted, being H the Hi hardness at depth hi, a linear regression was performed to obtain the line whose slope is the characteristic parameter h*, to evaluate the Indentation Size Effect (ISE) region. The characteristic parameter h* was checked.
The Nix and Gao model was applied, so that the characteristic parameters H0 and h* are obtained. The density of GNDs is calculated by Equation (6), for each indentation.
The SSDs density is calculated by Equations (8)-(10), making the following preparations:
Applying the formulation of the Newton-Raphson method, the process of obtaining the unknown x, for each indentation, is obtained through continuous iterations, following the formulation shown in Equation (11).
The constants used in the formulations are shown in Table 5.
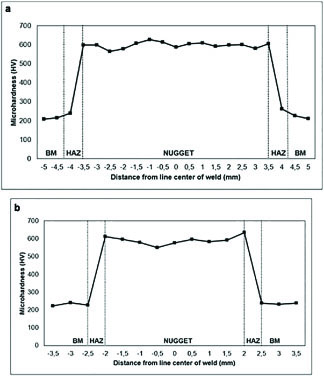
An assessment was also made along the welded joint to verify the microhardness variation along the base metal, HAZ and fusion zone.
3. RESULTS AND DISCUSSION
3.1. Shear test
Shear tests results are depicted in Figure 3. Analyzing the Figs. 3a and 3b, it can be seen that the 85% welded specimens show a better resistance than the 65% ones (24000 N against 21000 N). These results are in agreement with the literature [12, 13]. The possible cause is the melted region to be bigger due the increased welding power. Authors had used the methods similar to those studied in the present work, as BUDIARSA et al. [1], LIU et al. [14], [1] and TANAKA et al.[15]. MORITO et al. [16], TAKEBAYASHI et al. [17], NODEH et al. [18], FLOREA et al. [19], RAATH et al. [20], ANASTASSIOU et al. [21] and AFSHARI et al. [22] studied other types of alloys such as martensite in Fe-C and Fe-Ni alloys. COLOMBO et al. [23], AO et al. [24], JANARDHAN et al. [25], SHRAGER [26] and BLONDEAU [27], found results similar to this work. LIU et al. [14] got values of about 24000 N. These curves of load displacement were realized of similar manner.

3.2. Microstructural analysis
Figures 4 to 9 show the micrographs of a specimen welded with 85% power. Figs. 5 and 6 illustrated SEM micrographs of base metal. These are similar to the ones shown by SHRAGER [26], with the ferritic grains surrounded by the perlitic concentrations. Figures 8 and 9 exhibit the aspect of the fusion zone with different amplifications. Are the regions that raise the maximum temperature, reach the liquidum phase and solidifying in epitaxial format [27]. Typical optical micrographs in various zones of joints made on prestressed sheets are shown in Figure 9. It can be noted the elongated grains [27]. Both the optical and SEM images of FZ (nugget) indicate the presence of coarse and lath martensite. It is important to highlight that no defects were found, such as microcracks and pores.


3.3. Hardness profiles
It is possible to note an increase in hardness when inspecting the curve from base metal to weld metal, see Figure 10. It is coherent with the hardness profiles presented by JANARDHAN et al. [25], where the hardness has a minimum value in base metal region, having an ascending curve in HAZ region and maintaining a mean maximum value in region of nugget (FZ). In this work the base metal hardness starts with 200 HV, having a transition to 600 HV in nugget. The values start in 200 HV (metal base) and go to 600 HV (nugget). The microhardness profiles of the spot-welded steel sheets are shown in Figure 10(a). It is observed that the microhardness increases from base metal to FZ through HAZ. The magnitude of the microhardness is maximum in the FZ due to the formation of lath martensite and the presence of ferrite in combination with a higher fraction of martensite packets in the microstructure of this region of the joint. The microhardness of the base metal is lowest because it does not undergo any microstructural changes due to the thermal cycle of the welding process [28].

It is possible to note an increase of hardness when inspecting the curve from base metal to weld metal and it is coherent with the hardness profiles presented in other work.
This hardness behavior is related to ISE. BUDIARSA et al. [1] made an association of the ISE effect with the hardening factor of the material, through finite element modeling and experimental procedures, obtaining coherent values with those obtained in the present work.
3.4. Dislocation density
For base metal, the hardness shows an increase accordingly with the depth indentation reduction, as shown in Figure 11(a). In Figure 11(b), it is showed the linear relationship H/H0 and 1/h.
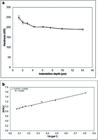
As presented in Figure 11 for the base metal, two graphs (Figure 12) were generated for the weld metal from sample J1, Welding Power of 85%.
In order to minimize lecture errors, it has been verified the utilization of the scanning electronic microscope to read of diagonals of the 5 indentations for the smallest loads, however, very little difference was found. A comparison is shown in Table 6 and Figure 13. The results confirmed the precision of the measurements of microdurometer lenses.

An example of an indentation view at SEM is shown in Figure 13.
It is well known that the variation of the hardness related to a material increases when the indentation depth is very small. It is reported that from an indentation depth h onwards, the hardness tends to increase as h decreases, especially in the sub-micrometer regime. This phenomenon is called the Indentation Size Effect (ISE). The explanation about the ISE is based on the fact that large deformation gradients occur in the region of small indentations, creating GNDs which in turn cause a greater hardening effect [11].
For base metal, Equation (8) was solved by Newton-Raphson method, and the value of ρS was estimated as 6.69 × 10¹⁷ m-2. From Equation (6) it was calculated the ρG = 4.65 × 10¹⁴ m-2.
Accordingly, with RASHID et al. [5], the total dislocation density is calculated by equation (12):
So, for base metal, ρT = 7.05 × 10¹⁷.
These values were compared with the obtained by AMERI et al. [9] and TANAKA et al. ([13] in Table 7).
The explanation for ρT value to be greater than the works of Ameri et al. [9] and Tanaka et al. [15] is because the steel of the present study, 22MnB5, have the hardness and yielding stress more elevated.
For weld metal from specimen J1, 85% of welding power, the ρS was calculated as 2,0 × 10¹⁵, and ρG was calculated 9.96 × 10¹⁴. So, ρt = 7.42 × 10¹⁵.
The study of the behavior of dislocations in a material is justified by your intrinsic correlations with the mechanical properties of crystal. We cite, as example, BARRET et al. [29]: MORITO et al. [16] who studied the density of dislocations in martensitic microstructures, TAKEBAYASHI et al. [17], who carried out a comparative study of dislocation density in martensitic steels with different degrees of heat treatment, and TANAKA et al. [15], who used IF steel in their study. Despite the differences, the results indicate that the medium hardness methodology for measuring dislocation density is a more viable technique than more complex techniques, such as transmission electron microscopy. JANARDHAN et al. [28], studied a dual-phase (DP600) steel sheets followed by spot-welding in lap-shear configuration, used a different technique in the analysis of density of dislocation where was estimated by X-ray diffraction (XRD) as well as transmission electron microscopy (TEM). JANARDHAN et al. [25] also studied the performance of pre-strained joints in high strength low alloy (HSLA) steel, utilizing X-ray diffraction and TEM analyzes for evaluate the dislocation densities, obtained values for metal base the dislocation density of 7.5 × 10¹³ m-2, for HAZ (heat affected zone) 2.25 × 10¹⁴ and for fusion zone: 3.2 × 10¹⁴.
JIN and YUA [30] done microstructure observation and hardness measurement to determine the strengthening behavior of a material, where the strength in typical areas was characterized by Vickers microhardness.
In the case of the work of KAPOOR et al. [31], the hardening of Fe-9%Cr alloys exposed to irradiation is investigated using nanoindentation. Nanoindentation integrates the depth-dependent hardness over the indentation plastic zone. All these works present a higher density of dislocations, like the ones obtained in this work. The advantage of the microhardness method is its practicality, when compared with transmission electron microscopy and nanoindentation techniques.
NATH et al. [32] realized experiments with 2nd and 3rd generation intermetallic TiAl alloys, where applying nanoindentation, used the theoretical formulations for σS and σG values, and compared with EBSD results, and the final results, beneath others, was found coherent.
The dislocation density measurement methodology has the advantage of versatility, but depends on the measurement accuracy and mechanical properties of the substrate and FZ, when a spot weld joint is used. The choice of fit model is also crucial for calibrating the results obtained with the measurements and loads used in microhardness.
3.5. Residual stresses
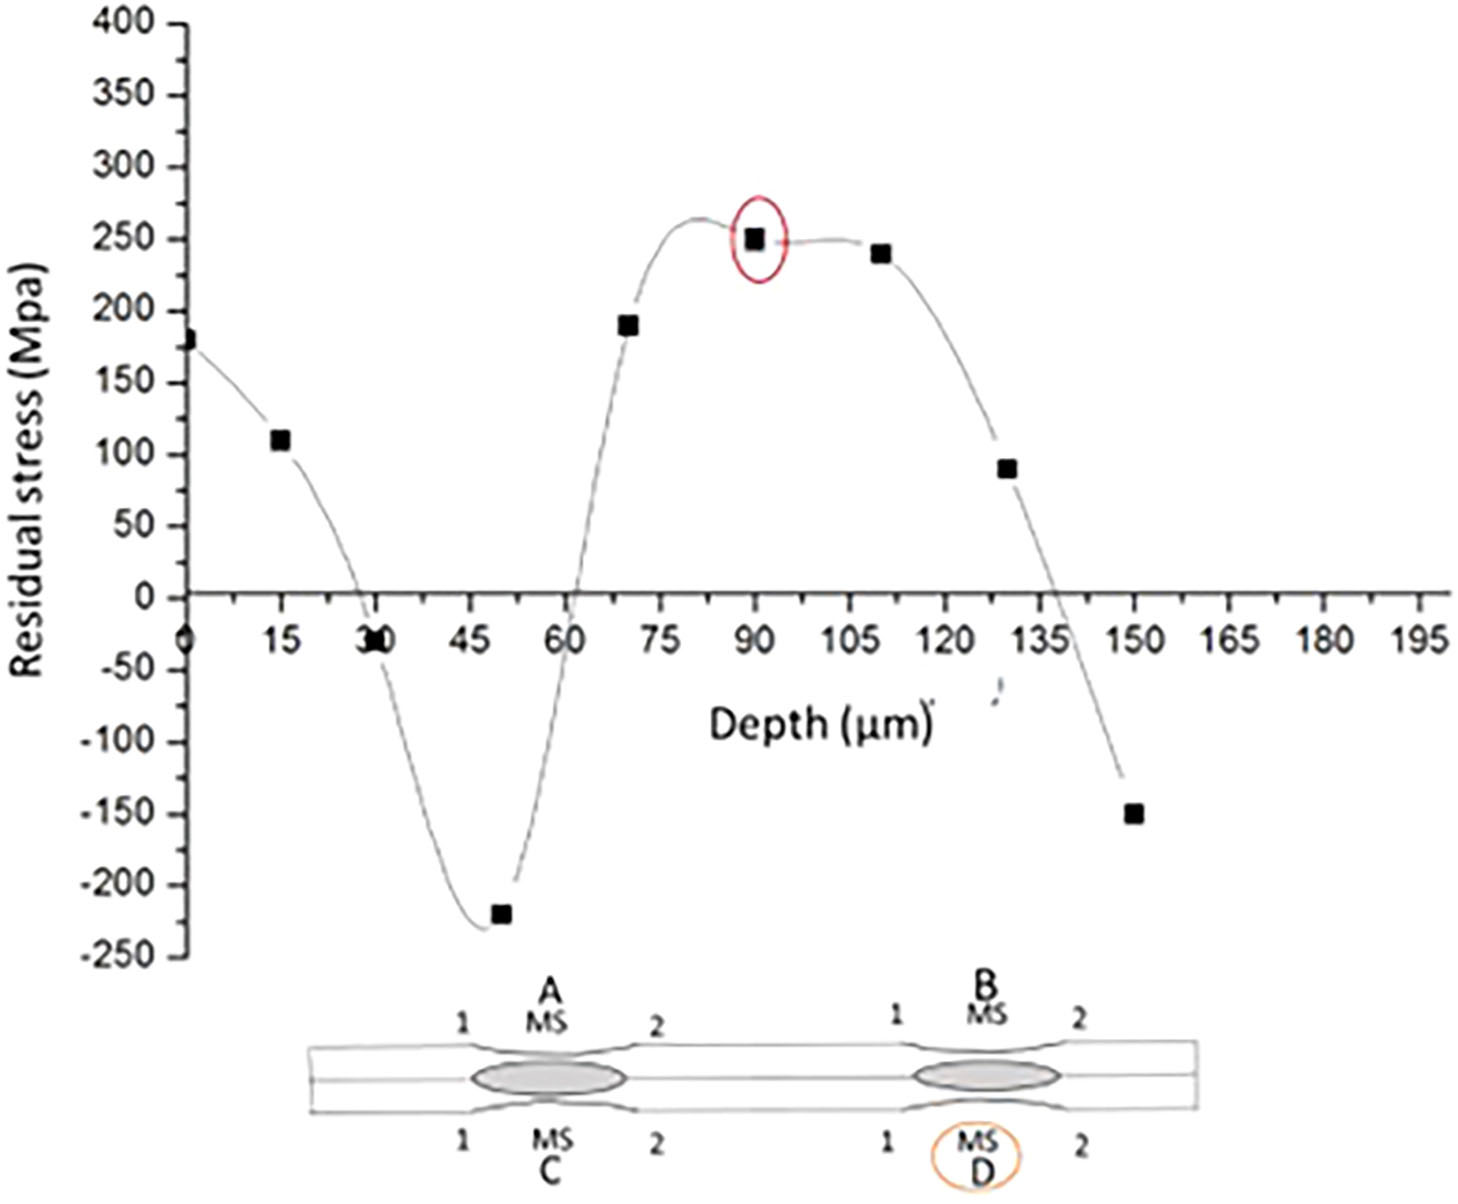
The results of longitudinal surface residual stresses, measured at the center (FZ) and at the edges of the nugget, are shown in Figure 14. Figure 15 shows the behavior of residual stresses in the subsurface layers.


Analyzing Figure 15, it is possible to see that the residual tensile stresses present on the surface change sign at 30 µm in depth, reaching a maximum in compression at 45 µm depth, becoming tensile again at 60 µm depth, where they remain tensile and of high magnitude, and become compressive again 135 µm This behavior is natural, because the residual stresses tend to self-cancel. This typical behavior of subsurface stresses shows the thickness of the layers of each nature and forms the basis for the study of the cross section of the samples.
The study of the residual stresses in the cross section of the samples was carried out according to the denomination of the samples and the applied welding power, presented in Table 8, respectively, and the results are shown in Figures 16 to 22.


The measurements performed in the cross section of sample J1 demonstrate a compressive character at point MS, compressive at point 1 and tensile at point 2. These values have been compared with the results obtained from samples welded at 65% of power. The correlation with dislocation density was established. Other tests were made with samples denominated A, B and C, welded at 85% of power, with results shown in Figures 17 to 19.
Almost all of the measured points show compressive residual stress, both at 65% and 85% of the power. It can be explained by the compression force of the electrodes, including in the points of geometry changing (1 and 2).
The residual stresses always are a matter of concern for designers. In spot welding, several authors studied your effect in spot weld joints, utilizing modeling by finite element and/or experimental procedures. Can be cited the works of NODEH et al. [16], FLOREA et al. [17], RAATH et al. [18], ANASTASSIOU et al. [19]; AFSHARI et al. [20]; COLOMBO et al. [21]; and AO et al. [22].
It can be noted that the values obtained by JANARDHAN et al. [28] are lower than those calculated in this work. It can be explained by the difference between the studied materials. as the 22MnB5 steel is strongest. The mean residual stress in the fusion zone is higher in the specimens welded at 65% and correlated with an increase in hardness measurements. However, for specimens welded at 85%, the mean residual stress is not as compressive as the values at points 1 and 2.
It was found that the threading dislocation density increases with increasing compressive residual stress. BARCHUK et al. [33] and LONG et al. [34] also correlated residual stress and dislocation density and found similar results to the methodology applied in this work.
It has been found that under high load, dislocation density in spot nugget edge is much higher than that in nugget center area, which indicates significant plastic deformation occurred at the edge of spot nugget during fatigue testing [34].
Analyzing the obtained results, we can conclude the importance of the adopted methodology, both in terms of dislocation density and residual stress measurement. It is clear from the literature that the topic of dislocation density is highlighted in several recent works [35,36 37]. These articles provide precise evaluations of dislocation density; however, they often utilize complex techniques that can be challenging to implement in industry, for example. According AMERI et al. [9], is important to note that dislocation density quantification depends on sample preparation process and the initial condition of the as-received material. In this study was used standard mechanical preparation procedures that might cause some surface deformation. Therefore, it is highly recommended to use alternative methods such as electro-polishing or ion beam milling to minimize these effects. This work introduces a novel approach by suggesting simpler techniques that allow for satisfactory results in quantifying dislocation density and residual stress in welded joints. The novelty of this work is the suggestion of simpler techniques that make it possible to obtain satisfactory results in quantifying dislocation density and residual stress in welded joints.
4. CONCLUSIONS
The present work it evaluated the correlation between dislocation density and residual stresses on spot welded joints, obtaining the following conclusions:
-
(1)
The dislocation density for weld metal was ρt = 7.42 × 10 m-2, behavior is consistent with those found in the literature.
-
(2)
In the nugget region and in HAZ of spot weld was found compressive behavior of residual stresses present, due compression force of the electrodes. The measured values for welded joints at 65% of power seens to be 30% above than the joints with weld at 85% of power. Also, for joints welded at 65% of power the residual stress was found 66% than the values founded in joints welded with 85% of power.
-
(3)
Typical microstructure in zones of joints made on prestressed sheets where noted the elongated grains in FZ, indicate the presence of coarse and lath martensite. No defects such as microcracks and pores were found.
-
(4)
The main contributions of this work were the study of a type of advanced high strength steel, evaluating its weldability, and the evaluation of dislocation density through microhardness test. It is an important contribution as it would be an interesting alternative when compared to other techniques such as transmission electron microscopy and nanoindentation.
5. ACKNOWLEDGMENTS
This study was supported in part by the Coordenação de Aperfeiçoamento de Pessoal de Nível Superior - Brasil (CAPES). The authors would also like to thank the Brazilian research agencies CNPq and FAPERJ, for the financial support.
5. BIBLIOGRAPHY
-
[1] BUDIARSA, I.N., ANTARA, I.N.G., KAROHIKA, I.M.M.G., “Indentation size effect of the vickers indentation to improve the accuracy of inverse materials properties modelling based on hardness value”, IOP Conference Series. Earth and Environmental Science, v. 248, pp. 1–7, 2019. doi: http://doi.org/10.1088/1755-1315/248/1/012009.
» https://doi.org/10.1088/1755-1315/248/1/012009 -
[2] ZHOU, X., HE, S., MARIAN, J., “Cross-kinks control screw dislocation strength in equiatomic BCC refractory alloys”, Acta Materialia, v. 211, pp. 1–13, Jun. 2021. doi: http://doi.org/10.1016/j.actamat.2021.116875.
» https://doi.org/10.1016/j.actamat.2021.116875 -
[3] ZHANG, J., CUI, Y., ZUO, X., et al., “Dislocations across interphase enable plain steel with high strength-ductility”, Science Bulletin, v. 66, n. 11, pp. 1058–62, Jun. 2021. doi: http://doi.org/10.1016/j.scib.2021.02.032. PubMed PMID: 36654339.
» https://doi.org/10.1016/j.scib.2021.02.032 -
[4] SCHMITT, J.H., IUNG, T., “New developments of advanced high-strength steels for automotive applications”, Comptes Rendus Physique, v. 19, n. 8, pp. 641–56, Dec. 2018. doi: http://doi.org/10.1016/j.crhy.2018.11.004.
» https://doi.org/10.1016/j.crhy.2018.11.004 - [5] RASHID, K., AL-RUB, R., FARUK, A.N.M., “Dislocation-based model for predicting size-scale effects on the micro and nano indentation hardness of metallic materials”, International Journal of Material Structural Integrity, v. 4, n. 2-4, pp. 251–77, Sep. 2010.
-
[6] Ashby, M.F., “The deformation of plastically non-homogeneous materials”, Philosophical Magazin: A Journal of Theoretical Experimental and Applied Physics, v. 21, n. 170, pp. 399–424, Sep. 1970. doi: http://doi.org/10.1080/14786437008238426.
» https://doi.org/10.1080/14786437008238426 -
[7] KONIJNENBERG, P.J., ZAEFFERER, S., RAABE, D., “Assessment of geometrically necessary dislocations levels derived by 3D EBSD”, Acta Materialia, v. 99, pp. 402–14, Oct. 2015. doi: http://doi.org/ 10.1016/j.actamat.2015.06.051.
» https://doi.org/10.1016/j.actamat.2015.06.051 - [8] AMERICAN WELDING SOCIETY, Recommended practices for test methods for evaluating the resistance spot welding behavior of automotive sheet steel materials, D8.9, Miami, AWS, 1997.
-
[9] AMERI, A.A.H., ELEWA, N.N., ASHRAF, M., et al., “General methodology to estimate the dislocation density from microhardness measurements”, Materials Characterization, v. 131, pp. 324–30, Sep. 2017. doi: http://doi.org/10.1016/j.matchar.2017.06.031.
» https://doi.org/10.1016/j.matchar.2017.06.031 -
[10] NIX, W.D., GAO, H., “Indentation size effects in crystalline materials: a law for strain gradient plasticity”, Journal of the Mechanics and Physics of Solids, v. 46, n. 3, pp. 411–25, Mar. 1998. doi: http://doi.org/10.1016/S0022-5096(97)00086-0.
» https://doi.org/10.1016/S0022-5096(97)00086-0 - [11] CALLISTER, W.D., Materials Science and Engineering: an introduction, 7. ed, EUA, John Wiley & Sons, Inc, 2007.
- [12] HULL, D., BACON, D.J., Introduction to Dislocations, 3 ed, Oxford, Pergamon Press, 1984.
-
[13] DURST, K., FRANKE, O., BÖHNER, A., et al., “Indentation size effect in Ni-Fe solid solutions”, Acta Materialia, v. 55, n. 20, pp. 6825–33, Dec. 2007. doi: http://doi.org/10.1016/j.actamat.2007.08.044.
» https://doi.org/10.1016/j.actamat.2007.08.044 -
[14] LIU, C., ZHENG, X., HE, H., et al., “Effect of work hardening on mechanical behavior of resistance spot welding joint during tension shear test”, Materials & Design, v. 100, pp. 188–97, Jun. 2016. doi: http://doi.org/10.1016/j.matdes.2016.03.120.
» https://doi.org/10.1016/j.matdes.2016.03.120 -
[15] TANAKA, Y., MASUMURA, T., TSUCHIYAMA, T., et al., “Effect of dislocation distribution on the yeld stress in ferritic steel under identical dislocation density conditions”, Scripta Materialia, v. 177, pp. 176–80, Mar. 2020. doi: http://doi.org/10.1016/j.scriptamat.2019.10.018.
» https://doi.org/10.1016/j.scriptamat.2019.10.018 -
[16] MORITO, S., NISHIKAWA, J., MAKI, T., “Dislocation density within lath martensite in Fe-C and Fe-Ni alloys”, ISIJ International, v. 43, n. 9, pp. 1475–7, 2003. doi: http://doi.org/10.2355/isijinternational.43.1475.
» https://doi.org/10.2355/isijinternational.43.1475 -
[17] TAKEBAYASHI, S., KUNIEDA, T., YOSHINAGA, N., et al., “Comparison of the dislocation density in martensitic steels evaluated by some X-ray diffraction methods”, ISIJ International, v. 50, n. 6, pp. 875–82, 2010. doi: http://doi.org/10.2355/isijinternational.50.875.
» https://doi.org/10.2355/isijinternational.50.875 -
[18] NODEH, I.R., SERAJZADEH, S., KOKABI, A.H., “Simulation of welding residual stresses in resistance spot welding, FE modeling and X-ray verification”, Journal of Materials Processing Technology, v. 205, n. 1-3, pp. 60–9, Aug. 2008. doi: http://doi.org/10.1016/j.jmatprotec.2007.11.104.
» https://doi.org/10.1016/j.jmatprotec.2007.11.104 -
[19] FLOREA, R.S., HUBBARD, C.R., SOLANKI, K.N., et al., “Quantifying residual stresses in resistance spot welding of 6061-T6 aluminum alloy sheets via neutron diffraction measurements”, Journal of Materials Processing Technology, v. 212, n. 11, pp. 2358–70, Nov. 2012. doi: http://doi.org/10.1016/j.jmatprotec.2012.06.024.
» https://doi.org/10.1016/j.jmatprotec.2012.06.024 -
[20] RAATH, N.D., NORMAN, D., MCGREGOR, I., et al., “Effect of weld schedule on the residual stress distribution of boron steel spot welds”, Metallurgical and Materials Transactions. A, Physical Metallurgy and Materials Science, v. 48A, n. 6, pp. 2900–15, Jun. 2017. doi: http://doi.org/10.1007/s11661-017-4079-9.
» https://doi.org/10.1007/s11661-017-4079-9 -
[21] ANASTASSIOU, M., BABBIT, M., LEBRUN, J.L., “Residual stresses and microstructure distribution in spot-welded steel sheets: Eelation with fatigue behaviour”, Materials Science and Engineering A, v. 125, n. 2, pp. 141–56, Jun. 1990. doi: http://doi.org/10.1016/0921-5093(90)90166-Z.
» https://doi.org/10.1016/0921-5093(90)90166-Z - [22] AFSHARI, D., SEDIGI, M., KARIMI, M.R., et al., “Prediction of the nugget size in resistance spot welding with a combination of a finite-element analysis and an artificial neural network”, Materials Technology, v. 48, pp. 33–8, 2014.
-
[23] COLOMBO, T.C.A., REGO, R., FARIA, A.R., et al., “Processing-induced residual stresses in TWIP steel weld spots”, Materials and Manufacturing Processes, v. 35, n. 5, pp. 572–8, 2020. doi: http://doi.org/ 10.1080/10426914.2020.1734619.
» https://doi.org/10.1080/10426914.2020.1734619 -
[24] AO, S., LI, C., HUANG, Y., et al., “Determination of residual stress in resistance spot-welded joint by a novel X-ray diffraction”, Measurement, v. 161, pp. 1–4, 2020. doi: http://doi.org/10.1016/j.measurement.2020.107892.
» https://doi.org/10.1016/j.measurement.2020.107892 -
[25] JANARDHAN, G., KISHORE, K., DUTTA, K., et al., “MUKHOPADHYA.Y., “Tensile and fatigue behaviour of resistance spot-welded HSLA steel sheets: effect of pre-strain in association with dislocation density”, Materials Science and Engineering A, v. 793, pp. 1–16, 2020. doi: http://doi.org/10.1016/j.msea.2020.139796.
» https://doi.org/10.1016/j.msea.2020.139796 - [26] SHRAGER, A.M., Elementary metallurgy and metallography, 3 ed., New York, Dover Publications Inc, 1969.
- [27] BLONDEAU, R., Metallurgy and mechanics of welding, Hoboken, John Wiley & Sons, 2013.
-
[28] JANARDHAN, G., DUTTA, K., MUKHOPADHYAY, G., “Influence of work hardening on tensile and fatigue behavior of resistance spot-welded dual-phase steel”, Journal of Materials Engineering and Performance, v. 32, n. 2, pp. 624–37, Jan. 2023. doi: http://doi.org/10.1007/s11665-022-07117-4.
» https://doi.org/10.1007/s11665-022-07117-4 - [29] BARRET, R., NIX, W.D., TETELMAN, A.S., The Principles of Engineering Materials, Englewood Cliffs, New Jersey, Prentice-Hall, Inc., 1973.
-
[30] JIN, Y., YU, H., “Enhanced formability and hardness of AA2195-T6 during electromagnetic forming”, Journal of Alloys and Compounds, v. 890, pp. 1–11, Jan. 2022. doi: http://doi.org/10.1016/j.jallcom.2021.161891.
» https://doi.org/10.1016/j.jallcom.2021.161891 -
[31] KAPOOR, G., CHEKHONIN, P., KADEN, C., et al., “Microstructure-informed prediction and measurement of nanoindentation hardness of an Fe-9Cr alloy irradiated with Fe-ions of 1 and 5 MeV energy”, Nuclear Materials and Energy, v. 30, pp. 1–19, 2022. doi: http://doi.org/10.1016/j.nme.2021.101105.
» https://doi.org/10.1016/j.nme.2021.101105 -
[32] NATH, P., BHATTACHARJEE, A., SEN, I., “Indentation size effect in 2nd and 3rd generation advanced intermetallic TiAl alloys: theoretical and experimental estimation of dislocation density”, Journal of Materials Science, v. 59, n. 7, pp. 3066–86, Feb. 2024. doi: http://doi.org/10.1007/s10853-023-09320-7.
» https://doi.org/10.1007/s10853-023-09320-7 -
[33] BARCHUK, M., RÖDER, C., SHASHEV, Y., et al., “Correlation between the residual stress and the density of threading dislocations in GaN layers grown by hydride vapor phase epitaxy”, Journal of Crystal Growth, v. 386, pp. 1–8, Jan. 2014. doi: http://doi.org/10.1016/j.jcrysgro.2013.09.041.
» https://doi.org/10.1016/j.jcrysgro.2013.09.041 -
[34] LONG, X., KHANNA, S.K., ALLARD, L.F., “Effect of fatigue loading and residual stress on microscopic deformation mechanisms in a spot welded joint”, Materials Science and Engineering A, v. 454/455, pp. 398–406, 2007. doi: http://doi.org/10.1016/j.msea.2006.11.062.
» https://doi.org/10.1016/j.msea.2006.11.062 - [35] Cappola, J., Wang, J., Li, L., “A dislocation-density-based crystal plasticity model for FCC nanocrystalline metals incorporating thermally-activated depinning from grain boundaries”, International Journal of Plasticity, v. 172. pp. 1–27, 2024.
-
[36] TEKUMALLA, S., SEITA, M., ZAEFFERER, S., “Delineating dislocation structures and residual stresses in additively manufactured alloys”, Acta Materialia, v. 262, pp. 1–11, 2024. doi: http://doi.org/10.1016/j.actamat.2023.119413.
» https://doi.org/10.1016/j.actamat.2023.119413 -
[37] ZHOU, C., ZHAN, L., LIU, C., et al., “Dislocation density-mediated creep ageing behavior of an Al-Cu-Li alloy”, Journal of Materials Science and Technology, v. 174, pp. 204–17, 2024. doi: http://doi.org/10.1016/j.jmst.2023.08.011.
» https://doi.org/10.1016/j.jmst.2023.08.011