 Beyond confirmatory approaches: integrating quasi-experimental design, clustering and machine learning for metaverse adoption profiling
Abstract
Purpose This study aims to propose a hybrid methodological framework that integrates quasi-experimental design, unsupervised clustering and supervised machine learning algorithms to identify distinct adoption profiles in metaverse contexts, advancing beyond traditional confirmatory statistical approaches.
Design/methodology/approach A quasi-experimental study involving 310 undergraduates who were exposed to three metaverse applications on Meta Quest devices was conducted. K-means clustering, based on seven constructs, identified segments that were validated using random forest and support vector machine, supported by factor analysis and comparative tests.
Findings Two adoption profiles emerged: Skeptics/pragmatists (38.1%) and enthusiasts (61.9%). Perceived value, perceived usefulness and trust were the strongest predictors, with Social Influence and Enjoyment as supporting factors. Both models showed excellent predictive performance (AUC-ROC = 1.000; 0.994) and large effect sizes, confirming the validity of the segments.
Research limitations/implications This study is limited to a single-university sample, thereby restricting generalizability across diverse organizational contexts. Future research should replicate this methodology across various cultural and organizational settings to validate its generalizability.
Practical implications The results offer actionable insights for leaders and educators on tailoring immersive experiences by emphasizing perceived usefulness, trust and value creation to enhance engagement and participation in Metaverse environments.
Social implications This study highlights the opportunities and risks of immersive technologies, emphasizing gamification and attention management mechanisms to reduce cognitive distraction and enhance focus in educational and organizational contexts.
Originality/value This study combines quasi-experimental design, unsupervised clustering and supervised machine learning as an alternative to confirmatory-only adoption models. This study advances metaverse adoption research by linking segment-based evidence to behavioral interpretation grounded in usefulness, value, trust, presence and immersive engagement.
Metaverse adoption; Quasi-experimental design; Clustering analysis; Machine learning; Random forest; Support vector machine
Introduction
The metaverse has rapidly emerged as a transformative technological frontier with substantial implications for organizational contexts, higher education and social interactions (Dwivedi, Hughes, et al., 2023; Mustafa, Luthia, & Darwashi, 2025). As organizations increasingly experiment with immersive environments for training, collaboration and innovation, understanding user adoption patterns is critical (Ali, Soliman, Weahama, Assalihee, & Mahmud, 2025; Jiang, Wang, & Deng, 2025). While recent literature has explored metaverse applications and adoption drivers, much of the empirical research relies on traditional confirmatory methods such as partial least squares structural equation modeling (PLS-SEM) and covariance-based structural equation modeling (CB-SEM), which assume linear relationships and sample homogeneity. These approaches may not adequately capture the complex and non-linear patterns inherent in technology adoption (Shadish, Cook, & Campbell, 2001).
Although several studies have integrated structural equation modeling (SEM) with artificial neural networks to capture nonlinearities (Akour, Al-Maroof, Alfaisal, & Salloum, 2022; Leong, Hew, Ooi, Tan, & Koohang, 2025; Parhi, Joshi, Wuest, & Akarte, 2022), the present study follows a different trajectory. Rather than estimating causal paths among latent variables, it identifies empirically grounded adoption profiles and tests whether those profiles are stable enough to be recovered by supervised algorithms. This shift from average effects to user profiles adds theoretical value because it shows how adoption mechanisms may differ across user groups.
This is important because average linear effects may conceal distinct adoption logics. A segment-based approach clarifies which levers should be prioritized for different users, such as trust-building and value demonstration among skeptics/pragmatists or richer immersive engagement among enthusiasts.
1.1Opportunities and challenges in metaverse adoption
The metaverse presents unprecedented opportunities for organizational innovation and value creation. Recent studies have highlighted potential applications in immersive education (Ali et al., 2025), virtual collaboration (Cha, Kim, & Tang, 2024), digital marketing (Bazi & Hajawi, 2025) and revenue model innovation (Dwivedi, Kshetri, et al., 2023). In addition, gamification mechanisms in immersive environments have demonstrated significant potential for enhancing user engagement, satisfaction and behavioral intention (Jiang et al., 2025; Laiz-Ibanez, Mendana-Cuervo, & Carus-Candas, 2024).
However, the barriers to adoption remain substantial. Prior research has identified critical challenges, including high equipment costs, cybersickness and motion discomfort, concerns about addiction and identity theft, interoperability limitations and risks of attention fragmentation in educational and professional contexts (Dang et al., 2025; Dwivedi, Kshetri, et al., 2023; Gandhi, Gaur, Kar, & Dwivedi, 2024; Mvondo, 2025). These paradoxical tensions between innovation opportunities and psychological/social risks underscore the need for sophisticated analytical frameworks that can capture heterogeneity in user adoption patterns and identify distinct user profiles with differing risk-benefit perceptions.
1.2Methodological innovation and research gap
Despite the growing scholarly interest in metaverse adoption, a critical methodological gap persists. Most empirical studies use traditional multivariate techniques that assume population homogeneity and linear relationships among constructs. In contrast, contemporary technology adoption often involves heterogeneous user populations with qualitatively different perception profiles (Mvondo, 2025). Identifying these latent profiles and validating their stability through predictive algorithms offers superior practical and theoretical value compared to average treatment effects alone.
This study addresses this gap by proposing a hybrid methodological framework that: (1) uses a quasi-experimental design with naturally formed groups; (2) uses unsupervised clustering to empirically identify adoption profiles without predefined assumptions; (3) applies supervised machine learning to validate segment stability and identify key predictors; and (4) integrates classical multivariate statistics with contemporary predictive analytics.
The study follows a quasi-experimental logic, as all participants were exposed to identical immersive scenarios using the same equipment and tasks, while group formation occurred naturally rather than through random assignments.
1.3Research context and questions
To contextualize adoption perceptions within authentic metaverse experiences, participants in this study were exposed to three applied scenarios: virtual team leadership simulations, digital marketing exercises and innovation/entrepreneurship challenges conducted in immersive environments using meta quest devices. This experiential foundation strengthens ecological validity and ensures that adoption intentions reflect meaningful engagement with metaverse technologies, rather than abstract conceptualizations.
For practice, profiling adoption heterogeneity is more actionable than estimating average effects, as it informs targeted interventions for different user segments (e.g. trust building for skeptics versus engagement design for enthusiasts).
Within this framework, the central research questions are as follows:
RQ1.How can a hybrid methodology combining clustering and machine learning reveal distinct, empirically grounded metaverse adoption profiles?
RQ2.Which adoption-related perceptions (personal innovation, social influence, perceived usefulness, convenience value, perceived value, trust and enjoyment) serve as the strongest predictors of user adoption intention across the identified profiles?
RQ3.To what extent do supervised machine-learning algorithms validate the stability and predictive robustness of empirically derived adoption clusters?
Although the participants were not randomly assigned, the quasi-experimental setting ensured standardized exposure across groups using the same equipment, tasks and session procedures to strengthen internal consistency.
1.4Contribution and study significance
The primary contribution of this research extends beyond the incremental theoretical refinement of technology adoption constructs. Instead, it demonstrates the methodological value of combining quasi-experimental approaches with machine learning techniques, a relatively underexploited combination in metaverse research. By prioritizing empirical segment identification and predictive validation over confirmatory hypothesis testing, this study illustrates how advanced methodological pluralism can enhance the understanding of complex adoption patterns in digital transformation contexts. The findings provide theoretical insights into adoption heterogeneity and practical guidance for the organizational implementation of metaverse technologies.
2.Theoretical foundation
2.1The metaverse: conceptual trajectory and definitions
The term “metaverse” was popularized by Stephenson and has since moved from fiction into academic and managerial debate as immersive, persistent and socially interactive digital environments have become increasingly feasible (Dwivedi et al., 2022; Stephenson, 2001). In this article, the metaverse is understood as an ecosystem of immersive experiences that integrates virtual reality, social interaction, digital identity and organizational applications.
Two complementary perspectives are relevant. A restrictive view treats the metaverse as a specific virtual platform, whereas an expansive view defines it as a distributed and interoperable digital ecosystem connecting physical and virtual realities (Duan et al., 2021). This study adopts an expansive view because adoption was assessed after exposure to multiple educational and organizational scenarios rather than a single platform.
Recent studies reinforce the need to examine not only technical immersion but also psychological presence, identity, engagement and perceived value in virtual environments (Jiang et al., 2025; Lombard & Ditton, 1997).
2.2Strategic opportunities and organizational applications
From an organizational and educational perspective, the metaverse may support experiential learning, distributed collaboration, digital marketing, innovation training and new forms of value creation (Ali et al., 2025; Bazi & Hajawi, 2025; Cha et al., 2024; Mustafa et al., 2025). These opportunities are particularly relevant when immersive environments allow users to practice complex tasks, interact through avatars and experience scenarios that would be costly or difficult to reproduce.
2.3Barriers, risks and adoption challenges
Despite these opportunities, adoption remains constrained by equipment cost, interoperability, cybersickness, privacy concerns, data security risks, addictive use patterns, cognitive distraction and unequal access to immersive infrastructure (Dang et al., 2025; Dwivedi, Kshetri, et al., 2023; Gandhi et al., 2024; Laiz-Ibanez et al., 2024; Mvondo, 2025). These barriers are especially important in educational and organizational settings, where implementation depends not only on user interest but also on institutional resources and digital readiness.
2.4Paradox and analytical implications
These findings reveal a fundamental paradox: the metaverse offers transformative opportunities while also creating psychological, social and organizational risks. This duality renders homogeneous and purely linear explanations insufficient because users may weigh benefits and sacrifices differently.
Consequently, analytical strategies should be capable of identifying heterogeneous adoption profiles, mapping the constructs that distinguish those profiles, and testing whether the resulting segmentation is stable through complementary validation techniques.
2.5Theoretical foundations for adoption constructs
The construct selection builds on technology adoption research, especially technology acceptance model (Davis, Bagozzi, & Warshaw, 1989), and is complemented by theories that are particularly relevant to immersive environments. Presence Theory explains how users experience mediated environments as perceptually real (Lombard & Ditton, 1997); the value-based adoption model explains how users balance perceived benefits and sacrifices (Kim, Chan, & Gupta, 2007); and Cognitive Absorption Theory explains deep engagement, temporal dissociation, curiosity and enjoyment in digital interaction (Agarwal & Karahanna, 2000). These perspectives strengthen the interpretation of the seven constructs adopted from the meta-analytical foundation of Contreras Pinochet, Barbosa and Pardim (2024).
Personal Innovativeness refers to the individual’s propensity to adopt technological innovations, grounded in the psychological predisposition to seek novelty and assume risk (Agarwal & Prasad, 1998). Individuals with high personal innovativeness are expected to demonstrate a greater intention to experiment with the metaverse.
Social Influence captures the degree to which individual reference norms (peers, supervisors and professional community) encourage adoption, reflecting perceived social pressure or the aspiration to conform (Venkatesh, Thong, & Xu, 2012). In organizational contexts, social influence frequently serves as a significant predictor of technology-related decisions.
Perceived Usefulness represents user expectations regarding productivity gains or efficiency improvements provided by technology (Davis et al., 1989). In the metaverse, this encompasses enhanced learning potential, facilitated collaboration and accelerated innovation.
Convenience Value measures ease of use and platform accessibility, reflecting technical and usability barriers affecting willingness to use (Tussyadiah, 2016).
Perceived Value represents a more comprehensive dimension than usefulness, encompassing tangible and intangible benefits, not merely productivity, but also satisfaction, social connection and alignment with personal values (Kim et al., 2007).
Trust reflects the perception of security, privacy and credibility of the metaverse platform and its operators, which is critical given the previously identified risk context (Barnes, Mattsson, & Hartley, 2015; Kankanhalli, Tan, & Wei, 2005).
Enjoyment (or pleasure/entertainment) captures the affective and hedonic dimensions of experience, measuring whether the interaction is perceived as intrinsically rewarding (Hamari, Koivisto, & Sarsa, 2014).
These constructs form a multidimensional adoption perspective that captures utilitarian, social, affective and risk dimensions. Integrating these constructs into a clustering and machine learning analytical framework enables the identification of the dimensions that are most discriminating between user profiles.
3.Method
3.1Research design: quasi-experimental framework and rationale
The study adopts a quasi-experimental logic, as all participants were exposed to the same immersive metaverse scenarios using identical equipment and tasks, while group formation followed naturally occurring characteristics rather than random assignments. This study adopted a quasi-experimental design that combined observational data collection with controlled exposure conditions. Quasi-experimental designs, as established by foundational methodological literature, represent quantitative research approaches wherein group comparisons occur without strict randomization in group formation, allowing researchers to replicate experimental logic while maintaining greater external validity and real-world applicability (Coleman, 2019; Shadish, Cook, & Campbell, 2002). Unlike classical randomized controlled trials, quasi-experiments proceed through observational criteria rather than random assignment, enabling hypothesis testing regarding group differences while acknowledging limitations in strict causal inference.
The quasi-experimental structure of this study was derived from the following characteristics: (1) observational group formation based on natural respondent characteristics rather than random assignment; (2) exposure standardization, wherein all participants experienced identical immersive metaverse conditions; (3) pre-established outcome measures assessing intentions and psychological constructs; and (4) comparative analysis between emergent respondent clusters. This design approach balances the internal validity requirements of controlled environments with the external validity benefits of naturalistic educational contexts. As shown in Figure 1, the quasi-experimental research design comprises seven sequential stages, from standardized immersive exposure to supervised machine learning validation and interpretation.
3.2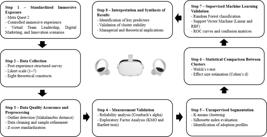
Sample and data collection procedures
The research population comprised undergraduate students enrolled in the Business Administration program at a leading Brazilian public university. This sample is appropriate for the study objective because students represent a relevant early adopter population for immersive educational applications and were directly exposed to the same pedagogical metaverse scenarios: virtual team leadership simulations, digital marketing activities and innovation and entrepreneurship exercises using meta quest devices. Nevertheless, the homogeneity of the sample requires caution when extending the findings to other age groups, professional populations, countries or organizations with different technological infrastructure.
Data collection occurred following immersive experience completion, using a structured questionnaire administered as part of the course “Digital Technologies in Organizations.” The initial sample comprised 325 respondents; however, rigorous data quality assurance procedures (detailed in Section 3.3.1) reduced the final analytical sample to 310 participants, with a retention rate of 95.4%. All procedures adhered to ethical research standards, and informed consent was obtained prior to participation.
The study design intentionally prioritized standardized exposure and measurement consistency. However, future replications should include additional control variables, such as previous virtual reality experience, digital gaming familiarity, digital literacy, prior metaverse use and frequency of immersive technology use, as these factors may influence readiness, comfort and adoption intention.
3.3Measurement instruments and construct operationalization
The instrument used (Appendix 1) was developed based on validated measures from prior studies (Chen, Chen, & Chen, 2019; Dhiman, Arora, Dogra, & Gupta, 2019; Goyal, Chauhan, & Gupta, 2021; Hidayat-ur-Rehman, Ahmad, Akhter, & Ziaur Rehman, 2022; Leong, Hew, Tan, & Ooi, 2013; Liu, Zhao, Chau, & Tang, 2015; Talukder, Chiong, Bao, & Hayat Malik, 2018; Wong, Tan, Tan, & Ooi, 2015) with the tested constructs adopted from Contreras Pinochet et al. (2024), who conducted a meta-analytic study examining the role of personal innovation and the intention to use the metaverse for productivity, following the preferred reporting items for systematic reviews and meta-analyses method. This ensured the theoretical robustness of the questionnaire and allowed for the comparability of the findings with those of prior research. Each theoretical dimension (Personal Innovation, Social Influence, Perceived Usefulness, Convenience Value, Perceived Value, Trust, Enjoyment and Intention to Participate in the Metaverse) was measured using Likert-scale items (1–7). Composite variables were created for each construct by averaging the relevant items. The construction of these composite variables aimed to synthesize information while preserving internal consistency, thereby reducing analytical complexity and ensuring greater robustness in interpreting the results.
3.4Data quality assurance and preprocessing
3.4.1Standardization and normalization procedures.
Modern machine learning applications require robust data preprocessing to ensure analytical reliability (Herwindiati, Hendryli, Sulaiman, & Nagaputra, 2025). Normality tests (Shapiro–Wilk) were significant, which is expected in large samples, and skewness and kurtosis indicated no severe distributional distortions. This transformation is essential for machine learning algorithms, particularly for support vector machines (SVM), which are sensitive to feature scaling and can produce biased results with unscaled input data. Standardization ensures that constructs with different original scales do not disproportionately influence algorithmic decisions, facilitating a fair assessment of variable contributions.
Although the Shapiro–Wilk tests rejected the null hypothesis of normality, this outcome is expected in large samples (N > 300) because the test becomes overly sensitive to minor deviations. The skewness and kurtosis indicators (ranging from −0.8 to 0.2) were within acceptable limits, suggesting that the distributions did not exhibit severe distortions and the constructs were adequate for the analyses. Moreover, this assumption is irrelevant for machine learning techniques that do not require normality assumptions.
The critical value used was derived from the chi-square distribution with seven degrees of freedom at the 97.5% confidence level [χ2(7; 0.975) = 16.01]. The mean Mahalanobis distance was 2.53 (SD = 0.78), with a range of 0.89–6.17. In total, 15 respondents (4.6% of the sample) exhibited atypical profiles and were removed from the sample size. Consequently, the final sample consisted of 310 respondents (95.4%), ensuring greater homogeneity and reducing potential distortions in subsequent clustering and statistical comparisons. In the present study, no cases of missing data were identified, as all questionnaires were completed in full, thereby ensuring the completeness of the data set used for analyses.
4.Results
4.1Reliability and validity of measurement scales
The internal reliability of the constructs was assessed using Cronbach’s alpha coefficient, a technique widely used in administrative research to validate the consistency of measurement instruments. The results indicated satisfactory reliability levels across all constructs, with values ranging from 0.759 (Personal Innovation) to 0.936 (Perceived Usefulness), exceeding the recommended threshold of 0.70. Exploratory factor analysis (EFA) was performed for each construct using the principal components method with Varimax rotation. All constructs demonstrated Kaiser–Meyer–Olkin (KMO) values exceeding 0.60, confirming the sample adequacy for factor analysis. Bartlett’s sphericity test was significant for all constructs (p < 0.001), validating the multidimensional structure of the scales. Table 1 presents the internal consistency indicators and the results of the EFA for all constructs.
4.2Data quality assurance and preprocessing
After data screening and preprocessing (Section 3.4), the final analytical sample comprised 310 respondents in total. All constructs were z-standardized prior to clustering and supervised validation to ensure their comparability across predictors.
4.3Segmentation through K-means and identification of adoption profiles
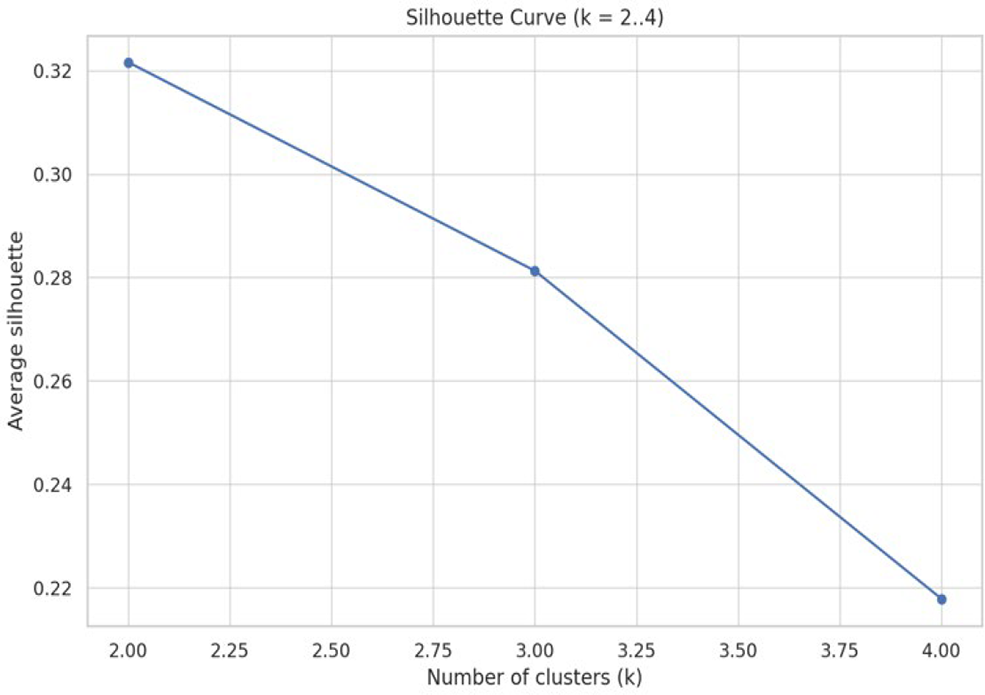
The K-means algorithm was applied to the seven theoretical constructs (Personal Innovation, Social Influence, Perceived Usefulness, Convenience Value, Perceived Value, Trust and Enjoyment) to identify latent clusters. The optimal number of clusters was evaluated using the Silhouette Curve, which simultaneously measures internal cohesion (similarity among individuals within the same group) and external separation (distance between distinct groups). Solutions with k = 2, 3 and 4 clusters were also tested. The solution with k = 2 yielded the highest Silhouette index (μ = 0.32), superior to k = 3 (μ = 0.28) and k = 4 (μ = 0.22), indicating that division into two groups produced greater consistency and clearer distinctions between the profiles. The optimal number of clusters was determined using the silhouette index, as shown in Figure 2.

As an additional methodological precaution, the clustering solution was not interpreted as definitive evidence of causal segmentation. Instead, it was treated as an exploratory classification that required convergent support from statistical comparisons, effect sizes, silhouette analyses and supervised hold-out validations. Future studies should further test stability through hierarchical clustering, latent class analysis, bootstrapped clustering or repeated cross-validation.
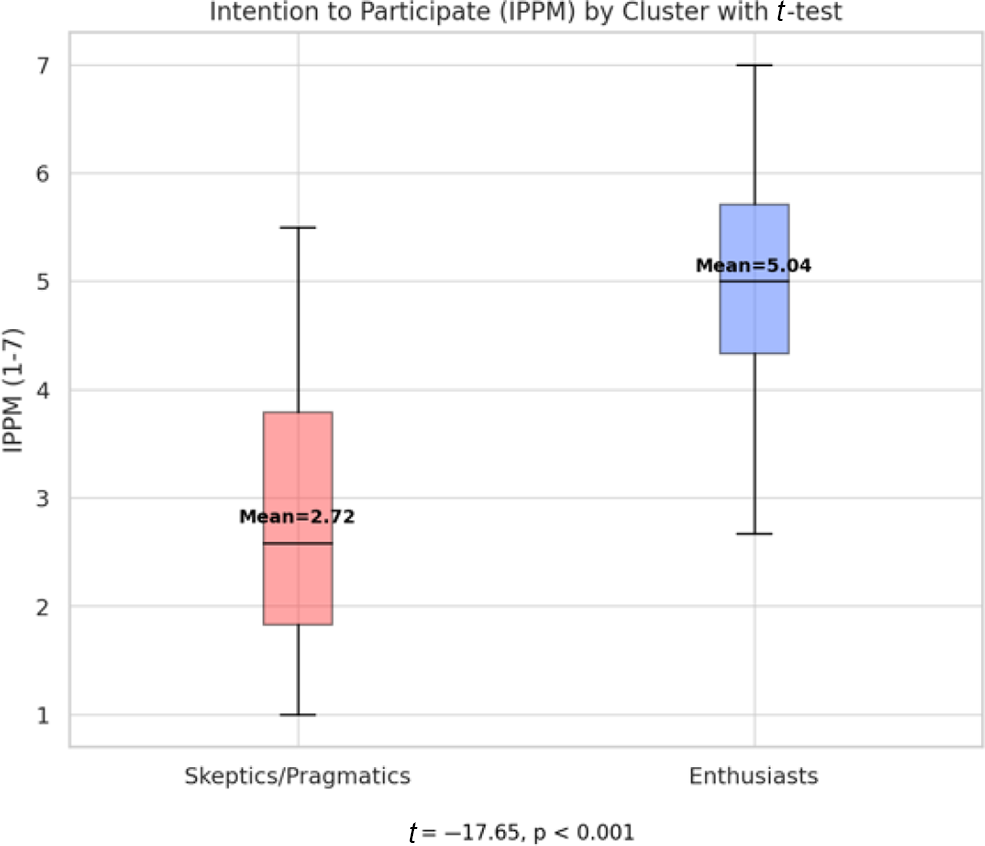
Cluster 0 – Skeptics/Pragmatists (n = 118; 38.1%): This cluster comprised respondents who assigned lower values to virtually all the evaluated constructs. They perceive lower usefulness, demonstrate reduced trust and enjoyment in interactions with immersive environments, and cautiously evaluate the perceived value of the metaverse. Consequently, they reported significantly lower mean scores for the intention to participate (M = 2.72). This profile reflects a cautious and resistant stance toward the adoption of immersive technologies.
Cluster 1 – Enthusiasts (n = 192; 61.9%): This group comprised respondents who perceived the metaverse more positively, assigning higher values to usefulness, trust, enjoyment, perceived value, personal innovation and social influence. They demonstrated significantly higher mean scores for intention to participate (M = 5.04) than the other cluster. Enthusiasts are individuals with a greater propensity to adopt the metaverse for productivity-related activities.
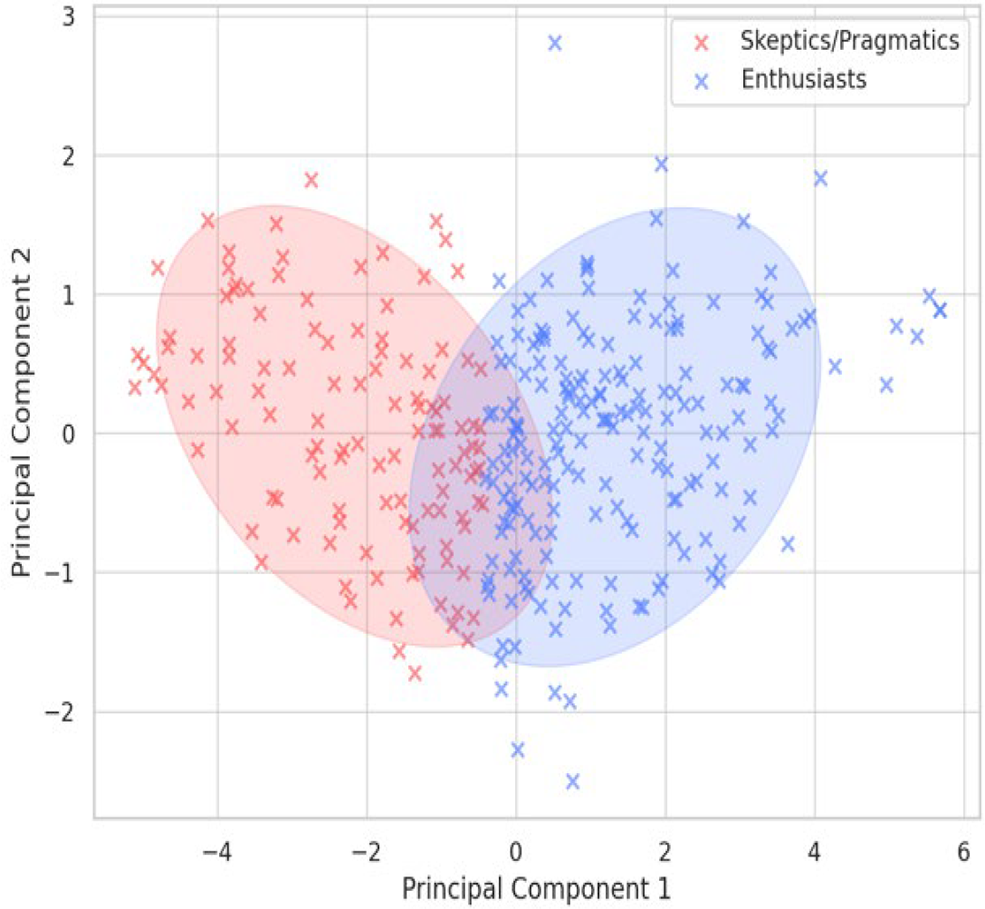
The demographic distribution revealed that in Cluster 0 (Skeptics/Pragmatists), there was a gender balance (50.0% male; 50.0% female), while in Cluster 1 (Enthusiasts), greater male participation (57.6%) was observed compared to female participation (42.4%). Figure 3 shows a two-dimensional visualization of the identified clusters using principal component analysis (PCA) with confidence ellipses.
4.4
Statistical differences between clusters
Welch’s t-tests were conducted to evaluate significant differences between clusters across all theoretical constructs. The results indicated highly significant differences (p < 0.001) in all constructs. Effect sizes, expressed as Cohen’s d, were substantial in all comparisons, ranging from 1.2 to 2.1, demonstrating not only statistical significance but also the substantive relevance of the observed differences. Table 2 reports the effect sizes (Cohen’s d) for all constructs in the two identified clusters.
The most pronounced contrasts emerged in the constructs Perceived Usefulness (d = −2.18), Perceived Value (d = −2.14) and Trust (d = −1.91), suggesting that these factors represent the most decisive dimensions for adoption intention. For the dependent variable (Intention to Participate in the Metaverse), Enthusiasts reported mean scores above 5.0 on a seven-point scale, indicating a strong willingness to adopt the metaverse, while Skeptics/Pragmatists remained close to 3.0, suggesting low engagement with the idea. Figure 4 illustrates the average cluster profiles across all constructs and the intention to participate in the metaverse.
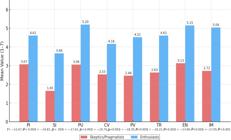
The boxplot analysis of the Intention to Participate (Figure 5) revealed a compact distribution for Enthusiasts (concentrated between four and six points), indicating an internal consensus regarding elevated adoption intention. Conversely, Skeptics/Pragmatists exhibited relatively greater dispersion (between two and three points), suggesting internal heterogeneity, albeit at low intention levels. Welch’s t-test confirmed a highly significant difference (t = 17.65; p < 0.001), with very large effect size (d = 2.0), demonstrating that Intention to Participate is a robust discriminator between profiles.
4.5
Validation of segmentation through supervised machine learning
Supervised machine learning techniques were applied to verify the robustness of the segmentation obtained using K-means. The central objective of this stage was to assess whether the identified groups (Enthusiasts and Skeptics/Pragmatists) could be consistently predicted from the theoretical constructs under evaluation. The high predictive capacity of supervised models when applied to these clusters indicates that the proposed division reflects stable patterns rather than random variations. The technical details of the random forest and SVM models are provided in Appendix 2.
4.5.1Random forest.
The random forest algorithm, an ensemble machine learning method that constructs multiple decision trees and combines their results to improve classification robustness and accuracy, was configured with 500 decision trees and entropy as the splitting criterion. The data set was divided into 70% training and 30% testing sets, with stratification to preserve cluster proportions. The model achieved 94.9% accuracy and AUC-ROC of 0.994, which are considered excellent.
The confusion matrix for the test set revealed 93 correct classifications out of 98 cases (accuracy, 94.9%). Specifically, 34 Skeptics/Pragmatists and 59 Enthusiasts were correctly identified in the sample. Classification errors were limited to only five cases: three skeptics were incorrectly classified as enthusiasts, and two enthusiasts were predicted as skeptics. Recall and precision metrics were consistent: for Skeptics, recall was 91.9% and precision 94.4%; for Enthusiasts, recall was 96.7% and precision was 95.2%. The F1-scores (0.93 for skeptics and 0.96 for enthusiasts) confirmed the balance between precision and sensitivity. Figure 6 shows the confusion matrix for the Random Forest classification model.
4.5.2
Support vector machine.
The SVM algorithm, a supervised learning technique that evaluates group separability in multidimensional space through linear or nonlinear decision boundaries, was applied in two variations: linear kernel and radial basis function (RBF). The confusion matrix of the SVM (RBF) model demonstrated an even more robust performance, with an overall accuracy of 98.9% (97 correct classifications out of 98 cases). Only one Enthusiast was incorrectly classified as a Skeptic, with no errors in the latter class. The model achieved 100% recall and precision for Skeptics and 98.3% recall and 98.4% precision for Enthusiasts. Figure 7 presents the confusion matrix for the SVM (RBF) classification model.
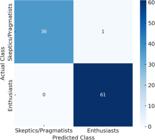
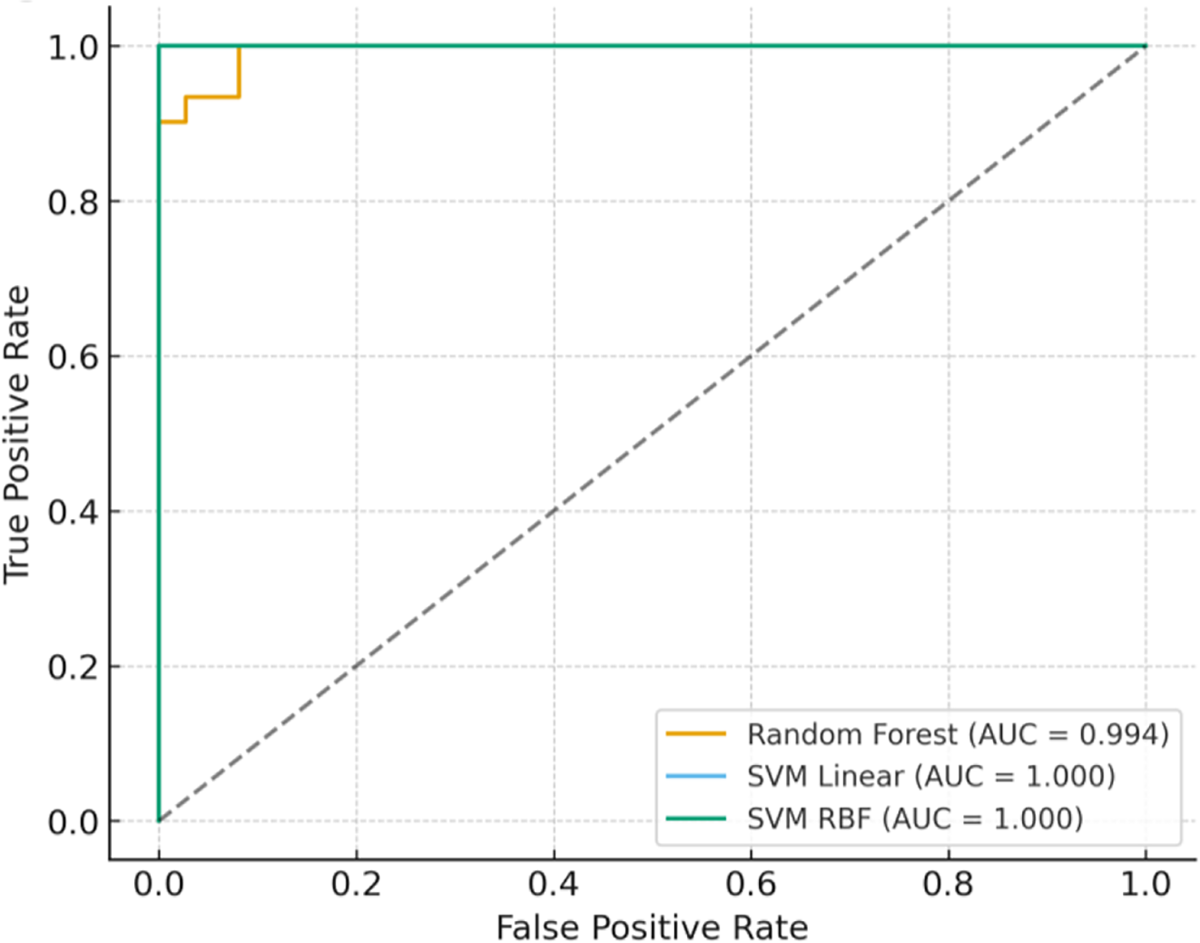
Both SVM variants (Linear and RBF) achieved AUC-ROC = 1.000 on the test set. This result should be interpreted cautiously because the same constructs were used to generate and validate the clusters, and the supervised models did not demonstrate external predictive validity. Rather, they function as a robustness check, showing that the profiles are highly separable within the construct space. The near-perfect AUC may also reflect the strong dependence between clustering inputs and classification predictors, reinforcing the need for future validation with external behavioral outcomes or independent samples.
4.5.3Relative importance of variables.
The relative importance of the constructs for classification, calculated using the mean decrease in impurity across the Random Forest trees, revealed a clear hierarchy among the predictors, as illustrated in Figure 8. The importance was normalized to sum to 100%, demonstrating that the explanatory core of the distinction between profiles resides in the Perceived Value, Perceived Usefulness and Trust constructs, which theoretically support the assessment of benefits, performance expectations, security and credibility of the environment. Social Influence and Enjoyment emerged as relevant supporting factors, whereas Personal Innovativeness and Convenience Value provided additional but comparatively smaller contributions.

Beyond classification accuracy, the Random Forest variable-importance analysis also provides an explainable AI layer to the proposed framework. Rather than treating machine learning as a black-box procedure, the model allows for the identification of which behavioral perceptions most strongly contribute to profile separation. In this sense, this study connects machine learning validation with behavioral analytics by translating algorithmic results into interpretable adoption insights. The prominence of Perceived Value, Perceived Usefulness and Trust indicates that the distinction between Skeptics/Pragmatists and Enthusiasts is not only statistically robust but also behaviorally meaningful. For managers, educators and platform developers, this interpretability is particularly relevant because it supports evidence-based interventions aimed at increasing perceived value, demonstrating practical usefulness and reducing trust-related barriers to immersive technology implementation.
4.6Synthesis of results
The convergence between unsupervised segmentation and supervised validation provides evidence of meaningful adoption profiles but not of causal prediction. K-means clustering revealed two distinct groups, and Random Forest and SVM recovered these profiles with high hold-out performance. Thus, classification performance is interpreted as internal segmentation stability rather than proof that the model can predict metaverse behavior beyond the measured constructs.
High AUC-ROC values, substantial effect sizes across all constructs, and low misclassification rates indicate that the identified profiles do not reflect random variation but rather stable patterns in the construct space. Importantly, because supervised models were trained to predict cluster membership derived from the same construct set, the classification performance was interpreted as a robustness check of segmentation stability rather than as predictive accuracy for an external behavioral outcome.
Across models, Perceived Value, Perceived Usefulness and Trust consistently emerged as the most influential dimensions differentiating adoption profiles, while Social Influence and Enjoyment played supporting roles. Collectively, these findings confirm the empirical validity of the proposed hybrid methodological framework.
5.Discussion
5.1Addressing the research questions
This study was designed to address three specific research questions that guided the investigation of metaverse adoption heterogeneity and the mechanisms driving distinct user profiles.
The findings indicate that metaverse adoption is heterogeneous (RQ1). The results provide clear evidence that metaverse adoption is heterogeneous, with two distinct and internally consistent profiles emerging from the unsupervised segmentation. This aligns with the broader metaverse literature, which emphasizes paradoxical dynamics and uneven user responses to immersive environments, where opportunities and risks co-exist and shape different adoption logics (Dwivedi et al., 2022; Dwivedi, Kshetri, et al., 2023; Mvondo, 2025). Importantly, these findings reinforce the notion that approaches focused only on average effects can mask meaningful subpopulations, supporting the need for segmentation-based inference in immersive technology.
Regarding the factors that differentiate adoption profiles, the results show that perceived value, perceived usefulness and trust play a central role (RQ2). Across statistical contrasts, supervised validation and variable importance, Perceived Value (PV), Perceived Usefulness (PU) and trust (TR) were the most discriminative dimensions, while Social Influence (SI) and enjoyment (ENJ) played supporting roles and Personal Innovativeness (PI) and Convenience Value (CV) contributed comparatively less. This pattern is coherent with established adoption theories, where usefulness and value-based evaluations shape intention (Davis et al., 1989; Kim et al., 2007), and trust becomes central under heightened privacy and security concerns (Barnes et al., 2015; Kankanhalli et al., 2005; Laiz-Ibanez et al., 2024).
Regarding methodological robustness, the hybrid combination of unsupervised clustering and supervised validation was effective (RQ3). The near-perfect separation of clusters by SVM and the excellent performance of Random Forest provide strong evidence for the unsupervised profiles. Rather than being an artifact of random variation, the segmentation reflects stable patterns in the construct space, consistent with the methodological motivation to go beyond traditional confirmatory-only approaches in metaverse adoption research (Akour et al., 2022; Leong et al., 2025; Loia, Capolupo, & Adinolfi, 2025; Parhi et al., 2022). This is particularly relevant given that many empirical metaverse studies still rely heavily on confirmatory SEM frameworks that assume linearity and homogeneity, which may be restrictive when adoption mechanisms differ across user groups (Shadish et al., 2002).
5.2Heterogeneity in immersive technology adoption
The identification of Skeptics/Pragmatists and Enthusiasts supports the argument that metaverse adoption (Chen et al., 2019; Dhiman et al., 2019; Goyal et al., 2021; Hidayat-ur-Rehman et al., 2022; Leong et al., 2013; Liu et al., 2015; Talukder et al., 2018; Wong et al., 2015) is not adequately represented by a single homogeneous process. The metaverse simultaneously enables innovation, learning, and new organizational forms while introducing psychological, cognitive and societal risks that can polarize user perceptions (Dwivedi et al., 2022; Dwivedi, Kshetri, et al., 2023; Gandhi et al., 2024). In this sense, heterogeneity is not merely statistical; it reflects qualitatively different user interpretations of benefits versus costs, consistent with emerging findings on public resistance and uneven acceptance of immersive experiences (Mvondo, 2025).
Methodologically, these results support the rationale for using approaches that are sensitive to nonlinearities and subgroup structures. While SEM and structural equation modeling–artificial neural network hybrids have been proposed to capture nonlinear patterns (Akour et al., 2022; Leong et al., 2025; Parhi et al., 2022), this study advances an alternative trajectory that prioritizes empirical profiling with predictive stability checks. This choice consists of quasi-experimental logic in applied social research, where controlled exposure strengthens internal consistency, even without strict random assignment (Shadish et al., 2002). The practical implication is direct: when adoption is heterogeneous, “one-size-fits-all” interventions are likely to be inefficient because different segments respond to different levers.
5.3Perceived usefulness, perceived value and trust as predominant antecedents
The predominance of PU, PV and TR suggests that immersive technology adoption is driven by pragmatic benefit-risk evaluation. PU captures whether users believe that the metaverse improves learning, work or productivity; PV captures whether these benefits justify the time, cost, effort and equipment demands; and TR captures whether users perceive the environment as reliable and safe. This combination explains why these constructs dominate the profiles: immersive systems require users to invest attention, disclose data, learn new interfaces and tolerate possible discomfort, making value and trust the central conditions for adoption.
The emergence of trust (TR) as a central separator is consistent with the risk-intensive nature of metaverse environments. Prior studies have highlighted privacy and information security risks in immersive systems, including continuous data capture and heightened vulnerability to misuse (Goyal et al., 2021; Laiz-Ibanez et al., 2024; Leong et al., 2013). More broadly, trust has been treated as a decisive antecedent in contexts where uncertainty, perceived vulnerability and platform dependence are high (Barnes et al., 2015; Kankanhalli et al., 2005). In metaverse settings, trust is additionally intertwined with fears of identity theft, harassment and nonconsensual surveillance, which can disproportionately affect risk-sensitive users and help explain the lower adoption intention of Skeptics/Pragmatists (Dwivedi, Kshetri, et al., 2023; Laiz-Ibanez et al., 2024).
For Skeptics/Pragmatists, the adoption barrier is not simply a lack of enjoyment or novelty-seeking; it reflects doubts about practical payoffs, credibility and risk. For Enthusiasts, the same constructs operate as accelerators, indicating that positive evaluations of usefulness, value and trust can transform immersion into a credible productivity experience rather than a merely entertaining one.
5.4Social influence and enjoyment as supporting factors
Although SI and ENJ were not the strongest discriminators, they remained important supporting forces. Social endorsement may reduce uncertainty during early implementation, and enjoyment can sustain engagement after initial exposure. This interpretation is consistent with Presence Theory and Cognitive Absorption Theory, because immersive environments may become more persuasive when users feel present, absorbed and socially supported in them.
Social Influence (SI) represents normative pressure and social endorsement from relevant referents (Chen et al., 2019; Dhiman et al., 2019; Goyal et al., 2021; Talukder et al., 2018; Venkatesh et al., 2012; Wong et al., 2015). In educational and organizational contexts, SI can be shaped by instructors, peers, and leaders who frame immersive technologies as legitimate and valuable tools. Higher SI among enthusiasts suggests that the social environment may reinforce adoption through legitimacy and peer effects, which is consistent with UTAUT/UTAUT2-based arguments about social mechanisms in technology uptake.
Enjoyment (ENJ) captures hedonic motivation, which has been widely connected to engagement in gamified and immersive environments. Metaverse research increasingly highlights gamification as a mechanism that enhances engagement and experiential value, but also warns that poorly designed stimulation can heighten distraction and reduce focus. The present results are consistent with this duality: enjoyment supports adoption, but it should be managed in alignment with task goals, especially in productivity-oriented metaverse use where attention and learning quality matter.
5.5Personal innovation and convenience value: comparatively smaller contributions
Personal Innovativeness (PI) reflects an individual’s predisposition to try new technologies and accept novelty-related uncertainty. While PI differed substantially between profiles, it played a smaller role than PU, PV and TR in separating the groups. This suggests that general openness to innovation is insufficient for adoption in high-immersion contexts: users still require clear usefulness and value signals and adequate trust guarantees.
Convenience Value (CV), which reflects usability and accessibility constraints, also showed a lower relative contribution. This result can be interpreted in two ways. First, standardized exposure conditions may have reduced the variability in perceived convenience within the study context. Second, metaverse adoption is often limited by structural barriers, such as device costs and infrastructure, which may indirectly influence perceived convenience through feasibility perceptions rather than interface usability alone. From an implementation standpoint, CV remains relevant because accessibility friction can disproportionately deter Skeptics/Pragmatists even when other perceptions improve.
5.6Practical implications for educational and organizational implementation
The findings suggest three strategies. First, educators and managers should begin implementation with clearly structured use cases that demonstrate productivity gains, such as simulations, collaborative problem solving, onboarding, training or innovation workshops. Second, platform developers and institutional leaders should reduce perceived risks by communicating data governance, privacy safeguards, security procedures and technical support in accessible language. Third, Skeptics/Pragmatists should receive low-risk trial experiences, guided tutorials and evidence of concrete value before being exposed to more complex immersive tasks, whereas Enthusiasts may be engaged through advanced scenarios, gamified challenges and co-creation activities.
Because adoption depends on infrastructure, these implications should be applied cautiously in contexts with limited access to VR devices, unstable connectivity or low digital literacy. In such settings, hybrid or shared-device strategies may be more realistic than full-scale immersive deployments.
6.Conclusion
This study shows that metaverse adoption is not uniform and can be more accurately understood through a hybrid methodological framework that integrates quasi-experimental exposure, unsupervised clustering and supervised machine learning validation. Using a controlled immersive context with naturally formed groups, we identified two empirically grounded adoption profiles, namely, Skeptics/Pragmatists and Enthusiasts, confirming that adoption patterns reflect meaningful heterogeneity rather than minor variations around an average effect.
Across analyses, Perceived Value, Perceived Usefulness and Trust emerged as the most discriminative dimensions separating profiles, while Social Influence and Enjoyment played supporting roles. The convergence between the segmentation and classification results provides consistent evidence that these profiles are stable in the construct space and actionable for understanding different adoption logics in immersive technology settings.
Future research should extend this framework by replicating the design using organizational, cross-cultural and longitudinal samples. Additional studies should test whether similar profiles emerge when external behavioral indicators are available, such as actual usage logs, task performance, learning outcomes, retention and repeated use over time. This would reduce concerns about circularity and strengthen the external validity beyond the present single-institution sample.
Funding:
Data availability statement
Data are available in a public, open access repository.
Disclosure
This manuscript was edited with the assistance of ChatGPT, AnswerThis and Paperpal Prime Plan for grammar correction and stylistic improvements. All content, intellectual contributions and final interpretations remain the responsibility of the authors, who have thoroughly reviewed and approved the final version of this manuscript.
Authors’ contribution
Vanessa Itacaramby Pardim: Conceptualization (Equal), Data curation (Equal), Investigation (Equal), Methodology (Equal), Project administration (Equal), Resources (Equal), Validation (Equal), Visualization (Equal), Writing – original draft (Equal), Writing – review & editing (Equal). Luis Hernan Contreras Pinochet: Conceptualization (Equal), Data curation (Equal), Formal analysis (Equal), Funding acquisition (Equal), Methodology (Equal), Project administration (Equal), Supervision (Equal), Validation (Equal), Writing – original draft (Equal), Writing – review & editing (Equal). Yogesh K. Dwivedi: Methodology (Equal), Supervision (Equal), Validation (Equal), Visualization (Equal), Writing – review & editing (Equal).
References
-
Agarwal, R., & Karahanna, E. (2000). Time flies when you’re having fun: Cognitive absorption and beliefs about information technology usage. MIS Quarterly, 24(4), 665-694, 10.2307/3250951.
» https://doi.org/10.2307/3250951 -
Agarwal, R., & Prasad, J. (1998). A conceptual and operational definition of personal innovativeness in the domain of information technology. Information Systems Research, INFORMS, 9(2), 204-215, 10.1287/isre.9.2.204.
» https://doi.org/10.1287/isre.9.2.204 -
Akour, I. A., Al-Maroof, R. S., Alfaisal, R., & Salloum, S. A. (2022). A conceptual framework for determining metaverse adoption in higher institutions of Gulf area: An empirical study using hybrid SEM-ANN approach. Computers and Education: Artificial Intelligence, 3, 100052, 10.1016/j.caeai.2022.100052.
» https://doi.org/10.1016/j.caeai.2022.100052 -
Ali, R. A., Soliman, M., Weahama, M. R., Assalihee, M., & Mahmud, I. (2025). Investigating continuous intention to use metaverse in higher education institutions: A dual-staged structural equation modeling-artificial neural network approach. Smart Learning Environments, 12(1), 3, 10.1186/s40561-024-00357-y.
» https://doi.org/10.1186/s40561-024-00357-y -
Barnes, S. J., Mattsson, J., & Hartley, N. (2015). Assessing the value of real-life brands in virtual worlds. Technological Forecasting and Social Change, 92, 12-24, 10.1016/j.techfore.2014.10.017.
» https://doi.org/10.1016/j.techfore.2014.10.017 -
Bazi, S., & Hajawi, D. (2025). Customer inspiration in the metaverse: Antecedents, mechanisms, and outcomes. Journal of Retailing and Consumer Services, 87, 104439, 10.1016/j.jretconser.2025.104439.
» https://doi.org/10.1016/j.jretconser.2025.104439 - Cha, S.-S., Kim, C. Y., & Tang, Y. (2024). Gamification in the metaverse: Affordance, perceived value, flow state, and engagement. International Journal of Tourism Research, 26(2), e2635.
-
Chen, W.-C., Chen, C.-W., & Chen, W.-K. (2019). Drivers of mobile payment acceptance in China: An empirical investigation. Information, Multidisciplinary Digital Publishing Institute, 10(12), 384, 10.3390/info10120384.
» https://doi.org/10.3390/info10120384 -
Coleman, R. (2019). Designing experiments for the social sciences: How to plan, create, and execute research using experiments Teller Road, Thousand Oaks CA, SAGE Publications, 91320. 10.4135/9781071878958.
» https://doi.org/10.4135/9781071878958 -
Contreras Pinochet, L. H., Barbosa, T. N., & Pardim, V. I. (2024). Developing a Meta-Analysis on personal innovation and intention to participate in productivity in the metaverse: A step-by-step guide. Procedia Computer Science, 242, 904-911, 10.1016/j.procs.2024.08.270.
» https://doi.org/10.1016/j.procs.2024.08.270 -
Dang, T.-Q., Nguyen, T.-M., Tran, P.-T., Phan, T.-T. C., Huynh, T.-B., & Nguyen, L.-T. (2025). From reality to virtuality: Unveiling gen Z’s purchasing behavior through virtual influencers in the metaverse. Digital Business, 5(2), 100141, 10.1016/j.digbus.2025.100141.
» https://doi.org/10.1016/j.digbus.2025.100141 -
Davis, F. D., Bagozzi, R. P., & Warshaw, P. R. (1989). User acceptance of computer technology: A comparison of two theoretical models. Management Science, INFORMS, 35(8), 982-1003, 10.1287/mnsc.35.8.982.
» https://doi.org/10.1287/mnsc.35.8.982 -
Dhiman, N., Arora, N., Dogra, N., & Gupta, A. (2019). Consumer adoption of smartphone fitness apps: An extended UTAUT2 perspective. Journal of Indian Business Research, 12(3), 363-388, 10.1108/JIBR-05-2018-0158.
» https://doi.org/10.1108/JIBR-05-2018-0158 -
Duan, H., Li, J., Fan, S., Lin, Z., Wu, X., & Cai, W. (2021). Metaverse for social good: a university campus prototype. Proceedings of the 29th ACM International Conference on Multimedia, Association for Computing Machinery, New York, NY, 153–161, 10.1145/3474085.3479238.
» https://doi.org/10.1145/3474085.3479238 -
Dwivedi, Y. K., Hughes, L., Baabdullah, A. M., Ribeiro-Navarrete, S., Giannakis, M., Al-Debei, M. M., Dennehy, D., Metri, B., Buhalis, D., Cheung, C. M. K., Conboy, K., Doyle, R., Dubey, R., Dutot, V., Felix, R., Goyal, D. P., Gustafsson, A., Hinsch, C., Jebabli, I., Janssen, M., Kim, Y.-G., Kim, J., Koos, S., Kreps, D., Kshetri, N., Kumar, V., Ooi, K.-B., Papagiannidis, S., Pappas, I. O., Polyviou, A., Park, S.-M., Pandey, N., Queiroz, M. M., Raman, R., Rauschnabel, P. A., Shirish, A., Sigala, M., Spanaki, K., Tan, G. W.-H., Tiwari, M. K., Viglia, G., & Wamba, S. F. (2022). Metaverse beyond the hype: multidisciplinary perspectives on emerging challenges, opportunities, and agenda for research, practice and policy. International Journal of Information Management, 66, Article , 10.1016/j.ijinfomgt.2022.102542.
» https://doi.org/10.1016/j.ijinfomgt.2022.102542 -
Dwivedi, Y. K., Hughes, L., Wang, Y., Alalwan, A. A., Ahn, S. J., Balakrishnan, J., & Barta, S. (2023). Metaverse marketing: How the metaverse will shape the future of consumer research and practice. Psychology & Marketing, 40(4), 750-776, 10.1002/mar.21767.
» https://doi.org/10.1002/mar.21767 -
Dwivedi, Y. K., Kshetri, N., Hughes, L., Rana, N. P., Baabdullah, A. M., Kar, A. K., & Koohang, A. (2023). Exploring the darkverse: A Multi-Perspective analysis of the negative societal impacts of the metaverse. Information Systems Frontiers, 25(5), 2071-2114, 10.1007/s10796-023-10400-x.
» https://doi.org/10.1007/s10796-023-10400-x -
Gandhi, M., Gaur, A., Kar, A. K., & Dwivedi, Y. K. (2024). Crafting user experiences in the metaverse: A design science study. Technological Forecasting and Social Change, 209, 123759, 10.1016/j.techfore.2024.123759.
» https://doi.org/10.1016/j.techfore.2024.123759 -
Goyal, S., Chauhan, S., & Gupta, P. (2021). Users’ response toward online doctor consultation platforms: SOR approach. Management Decision, 60(7), 1990-2018, 10.1108/MD-02-2021-0268.
» https://doi.org/10.1108/MD-02-2021-0268 -
Hamari, J., Koivisto, J., & Sarsa, H. (2014). Does gamification work? – A literature review of empirical studies on gamification. 2014 47th Hawaii International Conference on System Sciences, presented at the 2014 47th Hawaii International Conference on System Sciences, HI, 3025-3034, 10.1109/HICSS.2014.377.
» https://doi.org/10.1109/HICSS.2014.377 -
Herwindiati, D., Hendryli, J., Sulaiman, A., & Nagaputra, H. (2025). The performance of data cleaning on machine learning model for mapping land cover. International Journal of Advances in Soft Computing and Its Applications, 17(3), 10.15849/IJASCA.251130.21.
» https://doi.org/10.15849/IJASCA.251130.21 -
Hidayat-Ur-Rehman, I., Ahmad, A., Akhter, F., & Ziaur Rehman, M. (2022). Examining consumers’ adoption of smart wearable payments. Sage Open, 12(3), 21582440221117796, 10.1177/21582440221117796.
» https://doi.org/10.1177/21582440221117796 -
Jiang, X., Wang, J., & Deng, N. (2025). Creating existential authenticity experience by combining technology capability with gamification in the metaverse: An affordance perspective. Technology in Society, 83, 103019, 10.1016/j.techsoc.2025.103019.
» https://doi.org/10.1016/j.techsoc.2025.103019 - Kankanhalli, A., Tan, B. C. Y., & Wei, K.-K. (2005). Contributing knowledge to electronic knowledge repositories: An empirical Investigation1. MIS Quarterly, 29(1), 113-144.
-
Kim, H.-W., Chan, H. C., & Gupta, S. (2007). Value-based adoption of mobile internet: An empirical investigation. Decision Support Systems, 43(1), 111-126, 10.1016/j.dss.2005.05.009.
» https://doi.org/10.1016/j.dss.2005.05.009 -
Laiz-Ibanez, H., Mendana-Cuervo, C., & Carus-Candas, J. L. (2024). The metaverse: Privacy and information security risks. SSRN, 10.2139/ssrn.4803584.
» https://doi.org/10.2139/ssrn.4803584 -
Leong, L.-Y., Hew, T.-S., Ooi, K.-B., Tan, G. W.-H., & Koohang, A. (2025). An SEM-ANN Approach – Guidelines in information systems research. Journal of Computer Information Systems, Taylor & Francis, 65(6), 706-737, 10.1080/08874417.2024.2329128.
» https://doi.org/10.1080/08874417.2024.2329128 -
Leong, L.-Y., Hew, T.-S., Tan, G. W.-H., & Ooi, K.-B. (2013). Predicting the determinants of the NFC-enabled mobile credit card acceptance: A neural networks approach. Expert Systems with Applications, 40(14), 5604-5620, 10.1016/j.eswa.2013.04.018.
» https://doi.org/10.1016/j.eswa.2013.04.018 -
Liu, F., Zhao, X., Chau, P. Y. K., & Tang, Q. (2015). Roles of perceived value and individual differences in the acceptance of mobile coupon applications. Internet Research, 25(3), 471-495, 10.1108/IntR-02-2014-0053.
» https://doi.org/10.1108/IntR-02-2014-0053 -
Loia, F., Capolupo, N., & Adinolfi, P. (2025). Training me softly. Metaverse-based immersive and gamified learning through a knowledge management perspective. Journal of Knowledge Management, 29(5), 1465-1489, 10.1108/JKM-08-2024-0929.
» https://doi.org/10.1108/JKM-08-2024-0929 -
Lombard, M., & Ditton, T. (1997). At the heart of it all: The concept of presence. Journal of Computer-Mediated Communication, 3(2), JCMC321, 10.1111/j.1083-6101.1997.tb00072.x.
» https://doi.org/10.1111/j.1083-6101.1997.tb00072.x -
Mustafa, S., Luthia, M., & Darwashi, R. (2025). Fostering the Metaverse to Drive Digital Leadership, Productivity, and an Inclusive Work Environment, 309-338, 10.4018/979-8-3373-0071-9.ch011.
» https://doi.org/10.4018/979-8-3373-0071-9.ch011 -
Mvondo, G. F. N. (2025). Why immersive experiences fall short: Exploring public resistance to metaverse adoption. Technology in Society, 83, 102961, 10.1016/j.techsoc.2025.102961.
» https://doi.org/10.1016/j.techsoc.2025.102961 -
Parhi, S., Joshi, K., Wuest, T., & Akarte, M. (2022). Factors affecting industry 4.0 adoption – A hybrid SEM-ANN approach. Computers & Industrial Engineering, 168, 108062, 10.1016/j.cie.2022.108062.
» https://doi.org/10.1016/j.cie.2022.108062 - Shadish, W. R., Cook, T. D., & Campbell, D. T. (2001). Experimental and Quasi-Experimental designs for generalized causal inference, Belmont, CA, Cengage Learning.
- Shadish, W. R., Cook, T. D., & Campbell, D. T. (2002). Experimental and Quasi-Experimental designs for generalized causal inference. Boston, MA, Houghton, Mifflin and Company, p. 623.
- Stephenson, N. (2001). Snow Crash, Demco Media, Published 1 July 2001, English edition, ISBN-10: 0606216367, ISBN-13: 978-0606216364.
-
Talukder, M. S., Chiong, R., Bao, Y., & Hayat Malik, B. (2018). Acceptance and use predictors of fitness wearable technology and intention to recommend: An empirical study. Industrial Management & Data Systems, 119(1), 170-188, 10.1108/IMDS-01-2018-0009.
» https://doi.org/10.1108/IMDS-01-2018-0009 -
Tussyadiah, I. P. (2016). The influence of innovativeness on on-site smartphone use among American travelers: Implications for Context-Based push marketing. Journal of Travel & Tourism Marketing, Routledge, 33(6), 806-823, 10.1080/10548408.2015.1068263.
» https://doi.org/10.1080/10548408.2015.1068263 -
Venkatesh, V., Thong, J. Y. L., & Xu, X. (2012). Consumer acceptance and use of information technology: Extending the unified theory of acceptance and use of technology. MIS Quarterly, 36(1), 157-178, 10.2307/41410412.
» https://doi.org/10.2307/41410412 -
Wong, C.-H., Tan, G. W.-H., Tan, B.-I., & Ooi, K.-B. (2015). Mobile advertising: The changing landscape of the advertising industry. Telematics and Informatics, 32(4), 720-734, 10.1016/j.tele.2015.03.003.
» https://doi.org/10.1016/j.tele.2015.03.003
Appendix 1
Appendix 2. Technical details of supervised machine learning validation
-
Random Forest Classification
Random Forest is a supervised ensemble learning algorithm that constructs multiple decision trees and aggregates their predictions to improve classification robustness and reduce overfitting. In this study, cluster membership served as the dependent variable, while the seven adoption constructs constituted the predictor set.
The probability that an individual belongs to a class is estimated by averaging the predictions of all trees, as expressed in Equation (1):
where:
= number of trees in the model;
= prediction of tree ; and
= the class probability estimated by tree .
Variable importance was assessed using the Mean Decrease in Impurity criterion, which quantifies the reduction in node impurity attributable to each predictor across all trees. Higher values indicate greater contribution to class separation.
-
Support Vector Machine: Linear Kernel
The linear SVM seeks to identify a hyperplane that maximizes the margin between classes in the feature space. The optimization problem can be expressed as Equation (2):
where:
= weight vector (defines the orientation of hyperplane);
= bias or intercept (defines the offset of hyperplane);
= attribute vector (training point);
= class label of example ;
(slack variables) = allow margin violations, that is, misclassified points or points located within the margin of the hyperplane;
= regularization term that controls the margin width;
= penalty parameter (trade-off between maximizing the margin and minimizing the classification errors);
Constraint = ensures that each point lies on the correct side of the hyperplane, allowing for a violation up to ; and
Intuition = minimizing maximizes the margin; minimizing reduces classification errors.
-
Support Vector Machine: RBF Kernel
To accommodate nonlinear separability, the RBF kernel was used. The kernel function is defined as Equation (3):
where:
= kernel function (measures the similarity between two points);
= squared Euclidean distance between the points; and
= RBF kernel parameter; controls the “width” of the Gaussian function.
Large values → highly localized function (each point has a minimal influence).
Small values → more “spread-out” function (global influence).
The kernel replaces the inner product , allowing data to be projected into a higher-dimensional space without explicitly computing the transformation (Equation 4):
where:
= decision function used to classify the new points;
= Lagrange multipliers associated with each sample (nonzero only for support vectors);
= class label of each support vector;
= kernel that measures the similarity between the support vector and the new point ; and
= bias.
Classification:
If positive class ;
If negative class .
-
Interpretation of Classification Performance
Supervised models were trained on 70% of the sample and evaluated on a 30% hold-out test set. Performance was assessed using accuracy, precision, recall, F1-score, confusion matrices, and AUC-ROC. As cluster labels were derived from the same construct space, classification performance is interpreted as evidence of segmentation stability rather than external predictive validity.
The results demonstrated a high-level performance for SVM variants. The Linear SVM achieved an accuracy of approximately 0.98 and an AUC-ROC of 1.000, while the RBF SVM reached an accuracy of 0.99 and an AUC-ROC of 1.000. The confusion matrix revealed an extremely low number of misclassifications, corroborating the model’s effectiveness in separating groups. The comparative analysis of ROC curves showed that SVM variants achieved an AUC-ROC of 1.000 in the test hold-out, slightly surpassing Random Forest (AUC ≈ 0.994), which indicates virtually perfect separability between respondent profiles.
The performance of the SVM models corroborates the robustness of the segmentation obtained with K-means, confirming that the profiles of Enthusiasts and Skeptics/Pragmatists exhibit highly discriminable patterns. Moreover, the results suggest that the constructs Personal Innovativeness (PI), Social Influence (SI), Perceived Usefulness (PU), Convenience Value (CV), Perceived Value (PV), Trust (TR) and enjoyment (ENJ) are highly predictive of cluster membership, reinforcing the theoretical and empirical consistency of the adopted analytical model.
Figure A1 compares the ROC curves of the Random Forest and SVM models, highlighting their discriminative performance. Both SVM variants achieved an AUC-ROC of 1.000 in the test set, whereas the Random Forest reached an AUC-ROC of approximately 0.994, indicating a strong and consistent separation capacity.

*
Luis Hernan Contreras Pinochet can be contacted at: E-mail: luis.hernan@usp.brASSOCIATE EDITOR: