ABSTRACT
Objective
To evaluate the association between sugar-sweetened beverages consumption and dietary quality in adolescents, adults, and older adults living in São Paulo, Brazil.
Methods
Data were drawn from a cross-sectional population-based study conducted in 2008 in a representative urban city sample involving 1494 consumers of sugar-sweetened beverages. Dietary intake was evaluated through two 24-Hour Dietary Recalls, and the usual sugar-sweetened beverages consumption was estimated using the Multiple Source Method. Dietary quality was evaluated using the Brazilian Healthy Eating Index – Revised. The association between total score of the revised index and components with sugar-sweetened beverages consumption tertiles was assessed using multiple linear regression models for each age group, considering the sample design.
Results
Regardless of age group, the increase of sugar-sweetened beverages consumption was associated with a decrease in the total Healthy Eating Index – Revised score and in the components “total fruit”; “whole fruit”; “meat, eggs and legumes”, and the “solid fat, alcohol and added sugar”.
Conclusion
The results of our study suggest that higher sugar-sweetened beverages consumption was associated with poorer dietary quality. Planning public health policies aimed at decreasing sugar-sweetened beverages consumption is essential to increase dietary quality and reduce the incidence of noncommunicable diseases.
Keywords
Beverages; Diet; Life Style; Nutrition Surveys
RESUMO
Objetivo
Avaliar a associação entre a qualidade da dieta e o consumo de bebidas açucaradas em adolescentes, adultos e idosos residentes da cidade de São Paulo, Brasil.
Métodos
Foram utilizados dados provenientes do Inquérito de Saúde de São Paulo de 2008, estudo transversal de base populacional, com amostra composta por 1494 consumidores de bebidas açucaradas. O consumo alimentar foi avaliado por meio de dois Recordatórios Alimentares de 24 Horas e o consumo habitual de bebidas açucaradas foi estimado por meio do Multiple Source Method. A qualidade da dieta foi determinada usando o Índice de Qualidade da Dieta Revisado. A associação entre o índice revisado e a ingestão de bebidas açucaradas foi avaliada por meio de modelos de regressão linear para cada grupo etário, considerando o desenho amostral.
Resultados
Independente da faixa etária, o aumento do consumo de bebidas açucaradas foi associado à diminuição da pontuação total do Índice de Qualidade da Dieta-Revisado e dos componentes “frutas integrais”, “frutas totais”, “carne, ovos e leguminosas” e “gordura sólida, álcool e açúcar de adição”.
Conclusão
A maior ingestão de bebidas açucaradas está associada à pior qualidade da dieta. O planejamento de políticas públicas visando à diminuição do consumo de bebidas açucaradas é essencial para aumentar a qualidade da dieta e reduzir a incidência de doenças crônicas não transmissíveis.
Palavras-chave
Bebidas; Dieta; Estilo de vida; Inquéritos nutricionais
INTRODUCTION
The consumption of Sugar-Sweetened Beverages (SSB) has been associated with the development of several noncommunicable diseases [11 Malik V, Popkin B, Bray G, Desprs J-P, Hu F. Sugar-sweetened beverages, obesity, type 2 diabetes mellitus, and cardiovascular disease risk. Circulation. 2010;121(11):1356-64. http://dx.doi.org/10.1161/circulationaha.109.876185
https://doi.org/10.1161/circulationaha.1...
]. A global study using data from 187 countries evaluated the burden of disease associated with SSB consumption in 2010 and found that 184000 deaths worldwide were attributable to SSB consumption: 72.3% from diabetes, 24.2% from cardiovascular disease, and 3.5% from cancers. Furthermore, 8.5 million Disability-Adjusted Life-Years (DALY) were related to consumption of SSB [22 Singh GM, Micha R, Khatibzadeh S, Lim S, Ezzati M, Mozaffarian D, et al. Estimated global, regional, and national disease burdens related to sugar-sweetened beverage consumption in 2010. Circulation. 2015;132:639-66. http://dx.doi.org/10.1161/circulationaha.114.010636
https://doi.org/10.1161/circulationaha.1...
].
A cross-sectional study of 1,752 Iranian adults of both sexes verified a positive association between higher SSB consumption (more than 3 times per week) with energy intake when compared to SSB consumption of less than once a week [33 Khosravi-Boroujeni H, Sarrafzadegan N, Mohammadifard N, Alikhasi H, Sajjadi F, Asgari S, et al. Consumption of sugar-sweetened beverages in relation to the metabolic syndrome among Iranian adults. Obes Facts. 2012;5:527-37. http://dx.doi.org/10.1159/000341886
https://doi.org/10.1159/000341886...
]. Moreover, studies have suggested that liquid calories from SSB imply a weaker satiety response and lower degree of dietary compensation in subsequent meals, resulting in an increase of food consumption and total daily energy intake [44 Cassady BA, Considine RV, Mattes RD. Beverage consumption, appetite, and energy intake: What did you expect? Am J Clin Nutr. 2012;95(3):587-93. http://dx.doi.org/10.3945/ajcn.111.025437
https://doi.org/10.3945/ajcn.111.025437...
].
The consumption of SSB may represent a marker of an unhealthy lifestyle and poorer dietary quality [55 Khan TA, Sievenpiper JL. Controversies about sugars: Results from systematic reviews and meta-analyses on obesity, cardiometabolic disease and diabetes. Eur J Nutr. 2016;55(Suppl.2):25-43. http://dx.doi.org/10.1007/s00394-016-1345-3
https://doi.org/10.1007/s00394-016-1345-...
]. Individuals who have a higher SSB consumption tend to consume more calories, be more sedentary, and to present a lower adherence to the Mediterranean dietary pattern [33 Khosravi-Boroujeni H, Sarrafzadegan N, Mohammadifard N, Alikhasi H, Sajjadi F, Asgari S, et al. Consumption of sugar-sweetened beverages in relation to the metabolic syndrome among Iranian adults. Obes Facts. 2012;5:527-37. http://dx.doi.org/10.1159/000341886
https://doi.org/10.1159/000341886...
,66 Barrio-Lopez MT, Martinez-Gonzalez MA, Fernandez-Montero A, Beunza JJ, Zazpe I, Bes-Rastrollo M. Prospective study of changes in sugar-sweetened beverage consumption and the incidence of the metabolic syndrome and its components: The SUN cohort. Br J Nutr. 2013;110(9):1722-31. http://dx.doi.org/10.1017/S0007114513000822
https://doi.org/10.1017/S000711451300082...
]. Regarding dietary quality, those with a higher SSB consumption tend to have a dietary pattern with more refined grains, French fries, processed and red meat, desserts [77 Fung TT, Willett WC, Stampfer MJ, Manson JE, Hu FB. Dietary patterns and the risk of coronary heart disease in women. Arch Intern Med. 2000;161(15):1857-62.], saturated and trans-fats, and a lower consumption of fiber and dairy products [88 Pereira MA, Kartashov AI, Ebbeling CB, Van Horn L, Slattery ML, Jacobs Junior DR, et al. Fastfood habits, weight gain, and insulin resistance (the CARDIA study): 15-year prospective analysis. Lancet. 2005;365(9453):36-42. http://dx.doi.org/10.1016/S0140-6736(04)17663-0
https://doi.org/10.1016/S0140-6736(04)17...
].
Diet quality indexes have been proposed in order to evaluate dietary quality and synthesize the qualitatively characteristics of eating patterns [99 Anderson SA, Ramsden M, Kaye G. Diet qualities: Healthy and unhealthy aspects of diet quality in preschool children. Am J Clin Nutr. 2016;103(6):1507-13. http://dx.doi.org/10.3945/ajcn.115.128454
https://doi.org/10.3945/ajcn.115.128454...
]. In this context, some studies evaluated the impact of SSB on diet quality using these indexes, however, in Brazil this association was brief explored [1010 Valisa EH, Brenda MD, Wen Y, Kathleen JP, Paul AE, Jamie MZ. Dietary quality changes in response to a sugar-sweetened beverage-reduction intervention: Results from the talking health randomized controlled clinical trial. Am J Clin Nutr. 2017;105(4):824-33. http://dx.doi.org/10.3945/ajcn.116.144543
https://doi.org/10.3945/ajcn.116.144543...
11 Leung CW, DiMatteo G, Gosliner WA, Ritchie LD. Sugar-sweetened beverage and water intake in relation to diet quality in u.s. children. Am J Prev Med. 2018;54(3):394-402. http://dx.doi.org/10.1016/j.amepre.2017.11.005
https://doi.org/10.1016/j.amepre.2017.11...
-1212 Ruopeng AN. Beverage consumption in relation to discretionary food intake and diet quality among US adults, 2003 to 2012. J Acad Nutr Diet. 2016;116(1):28-37. http://dx.doi.org/10.1016/j.jand.2015.08.009
https://doi.org/10.1016/j.jand.2015.08.0...
].
Therefore, we hypothesized that individuals with a higher SSB consumption would have poorer dietary quality. Considering the link between SSB and some burdensome pathologic conditions, understanding this relationship is important for planning interventions and public policies to reduce the incidence of noncommunicable diseases. The present study aimed to evaluate the association between SSB consumption and dietary quality in adolescents, adults, and older adults living in São Paulo, Brazil.
METHODS
Study sample
The study used data from a cross-sectional population-based survey, namely, Inquérito de Saúde de São Paulo (HSP, Health Survey of São Paulo) 2008. The study was designed to collect health and nutrition information as well as life conditions in a probabilistic sample of urban residents of São Paulo, Brazil.
Two-stage cluster sampling was performed comprising census tracts and households. In the first stage, 70 census tracts were randomly selected from among 267 census tracts in the Pesquisa Nacional por Amostra de Domicílios (PNAD, Brazilian National Household Sample Survey) 2005 register of the Instituto Brasileiro de Geografia e Estatística (IBGE, Brazilian Institute of Geography and Statistics). In the second stage, a total of 16,607 households were randomly selected within the census tracts. Eight domains were defined, as follows: children under one year (both sexes); children aged between 1 and 11 years old (both sexes); adolescent aged between 12 and 19 years (males and females); adult aged between 20 and 59 years (males and females); older adult aged 60 years and over (males and females). To preserve the representativeness of each domain and to adjust for differences in the relative participation of age groups within the São Paulo city population, different sampling fractions were applied. The sample size was calculated to estimate proportions of 0.5 with a sample error of 0.07 at a 5% significance level and a design effect of 1.5.
The survey comprised 3,271 individuals recruited from September 2008 to March 2009. Of these, 2,691 individuals aged 12 years or more answered questions concerning socioeconomic, demographic, and lifestyle conditions. The first 24-Hour Dietary Recall (24HR) was collected in a subsample of 1662 individuals aged 12 years or more. Therefore, for this study, 1494 consumers of SSB (541 adolescents, 542 adults and 411 older adults) comprised the study sample.
This investigation was approved by the Ethics Committee of the Public Health School of the Universidade de São Paulo (USP, University of São Paulo) (CAAE nº66161717.0.0000.5421). All participants provided written informed consent before any procedure.
Data collection and processing
A structured questionnaire was administered at the participants’ homes, using qualified interviewers to obtain information with regard to demographic, socioeconomic, and lifestyle characteristics.
Self-reported ethnicity was classified as “white” and “other ethnicities” (black, brown, yellow, and indigenous). The head of the household’s level of education was categorized according to the number of years of study, as follows: less than nine years of study, or ten or more years of study. Household family income per capita was calculated as the sum of the income of all family members divided by the number of family members. Smoking status was classified as being either a former smoker, never having smoked, or a current smoker. Participants were also classified as consumers or non-consumers of alcoholic beverages.
Physical activity levels were assessed using the long version of the International Physical Activity Questionnaire validated for the Brazilian population [1313 Matsudo S, Araújo T, Matsudo V, Andrade D, Andrade E, Oliveira C, et al. Questionário Internacional de Atividade Física (IPAQ): estudo de validade e reprodutibilidade no Brasil. Rev Bras Ativ Fís Saúde. 2001;6(2):5-12. http://dx.doi.org/10.12820/rbafs.v.6n2p5-18
https://doi.org/10.12820/rbafs.v.6n2p5-1...
]. Leisure time physical activity was classified as either insufficiently active, or sufficiently active (physical activity practiced for at least 30 minutes daily, 5 days per week at a moderate intensity, or at least 20 minutes daily, 3 days per week, at a vigorous intensity).
Body Mass Index (BMI) was calculated based on self-reported weight and height and classified according to cut-off values for adolescents [1414 Onis M, Onyango AW, Borghi E, Siyam A, Nishida C, Siekmann J. Development of a WHO growth reference for school-aged children and adolescents. Bull World Health Org. 2007;85(9):660-7.], adults [1515 World Health Organization. Consultation on obesity: Preventing and managing the global epidemic. Geneva: WHO; 1998. WHO Technical Report Series No.894.] and older adults [1616 Lebrão ML, Duarte YAO. Health, well-being and aging: The SABE study in São Paulo, Brazil. Brasília: Pan American Health Organization; 2003.]. This information has been previously validated in study with the same population [1717 Carvalho AM, Piovezan LG, Selem SSAC, Fisberg RM, Marchioni DML. Validation and calibration of self-reported weight and height from individuals in the city of São Paulo. Rev Bras Epidemiol. 2014;17(3):735-46. http://dx.doi.org/10.1590/1809-4503201400030013
https://doi.org/10.1590/1809-45032014000...
].
Dietary intake data
Food and beverage consumption was measured using two nonconsecutive 24HR. The first 24HR information was collected by trained interviewers present at the participant’s home, according to procedures described in the Multiple Pass Method [1818 Guenther PM, DeMaio TJ, Ingwersen LA, Berlin M. The multiple-pass approach for the 24-Hour Recall in the Continuing Survey of Food Intakes by Individuals (CSFII) 1994-1996. In: International Conference on Dietary Assessment Methods. Boston: Mass; 1995.]. Information for the second 24HR was collected via telephone interview, using the Automated Multiple Pass Method, and replicated in 832 participants.
Data collection was refined using the Nutrition Data System for Research software 2007 version, developed by the Nutrition Coordinating Center at the University of Minnesota (Minneapolis, Minnesota, United States). After dietary data collection, the household measures reported in each 24HR were converted into grams and milliliters according to Brazilian publications [1919 Pinheiro ABV, Lacerda EMA, Benzecry EH, Gomes MCS, Costa VM. Tabela para Avaliação de Consumo Alimentar em Medidas Caseiras. São Paulo: Atheneu; 2000.,2020 Fisberg RM, Villar BS. Manual de receitas e medidas caseiras para cálculo de inquéritos alimentares: manual elaborado para auxiliar o processamento de inquéritos alimentares. São Paulo: Signus; 2002.]. Every food and beverage reported had its nutritional adequacy of food consumption data verified using a national food composition table.
Misreporting the percentage of each individual’s energy requirements was determined using the following equation: Energy intake – EER (Estimated Energy Requirements)/EERx100 [2121 Kelly MT, Rennie KL, Wallace JM, Robson PJ, Welch RW, Hannon-Fletcher M, et al. Associations between the portion sizes of food groups consumed and measures of adiposity in the British National Diet and Nutrition Survey. Br J Nutr. 2009;101(9):1413-20. http://dx.doi.org/10.1017/S0007114508060777
https://doi.org/10.1017/S000711450806077...
].
Sugar-sweetened beverages
The SSB definition used in this study was defined as any beverage containing a caloric sweetener, either intrinsic to product formulation or added prior to consumption [2222 Miller PE, McKinnon RA, Krebs-Smith SM, Subar AF, Chrique J, Kahle L, et al. Sugar-sweetened beverage consumption in the U.S.: Novel assessment methodology. Am J Prev Med. 2012;45:416-21. http://dx.doi.org/10.1016/j.amepre.2013.05.014
https://doi.org/10.1016/j.amepre.2013.05...
]. If the respondent responded that he/she had added sugar to the consumed beverage, the amount reported was considered. Where there was mention of sugar consumption in the 24HR, but there was no information detailing the quantity of sugar added prior to consumption, a figure of 5% sugar was added to the beverage (5g of sugar for each 100mL of beverage). The usual SSB consumption was estimated using the Multiple Source Method (MSM).
Brazilian Healthy Eating Index
The Brazilian Healthy Eating Index – Revised (BHEI-R) was adapted and validated from the Healthy Eating Index 2005 (HEI-2005) [2323 Previdelli AN, Andrade SC, Pires MM, Ferreira SRG, Fisberg RM, Marchioni DM. A revised version of the Health Eating Index for the Brazilian population. Rev Saúde Pública. 2011;45(4):794-8. http://dx.doi.org/10.1590/S0034-89102011005000035
https://doi.org/10.1590/S0034-8910201100...
,2424 Andrade SC, Previdelli AN, Marchioni DM, Fisberg RM. Avaliação da confiabilidade e validade do Índice de Qualidade da Dieta Revisado. Rev Saúde Pública. 2013;47(4):675-83. http://dx.doi.org/10.1590/S0034-8910.2013047004267
https://doi.org/10.1590/S0034-8910.20130...
]. Twelve components comprise the BHEI-R: nine food groups (“oils”, “meat, eggs and legumes”, “milk and dairy”, “whole grains”, “total grains”, “total vegetables”, “dark green and orange vegetables and legumes”, “whole fruit”, and “total fruit”), two nutrients (“sodium” and “saturated fat”), and one component representing the energy derived from “Solid Fats, Added Sugar and Alcohol” (SoFAAS). The usual intake of components was estimated using the MSM. The total BHEI-R score ranges from 0 to 100, using food energy density as parameters.
Statistical analyses
The participants’ characteristics are presented as percentages. The mean score of total BHEI-R and components are described according to tertiles of SSB consumption for each age group. Radar charts were used to demonstrate BHEI-R component scores according to tertiles of SSB consumption for each age group. Differences between the total score and each component tertile of SSB consumption were tested using univariate linear regression models.
The association between total BHEI-R and components with tertiles of SSB consumption was assessed using multiple linear regression models for each age group. The dependent variable was the BHEI-R, and the independent variable involved the tertiles of SSB consumption. All the models were adjusted for sex, household family income per capita, the head of household’s level of education, self-reported ethnicity, smoking status, alcohol consumption, leisure time physical activity, BMI, and misreporting. All the models were accepted after residual analysis.
All analyses considered the complexity of the sample design, using the survey module of Stata version 13.0 (Stata Corporation, College Station, Texas, United States). A p-value <0.05 was considered statistically significant.
RESULTS
The majority of participants in this study were female (56.2%), adolescents (40.9%), with the head of the household having up to 9 years of education (63.1%), and a household family income per capita ≤1 minimum wage (US$260.00 in 2008) (51.8%). Most of the participants self-reported being of white skin color (56.4%), never having smoked (72.3%) and not being consumers of alcohol (58.6%). Excess body weight was observed in 40.3% of the participants and 83.8% were insufficiently active.
In adolescent participants, the mean total BHEI-R score was 60.17, 58.41, and 58.20 for T1, T2 and T3 of SSB consumption, respectively. In adult participants, the mean total BHEI-R score was 62.70 for T1, 61.58 for T2, and 58.86 for T3. In older adult participants, the mean total BHEI-R score was 66.43, 64.99, and 63.31 for T1, T2, and T3 of SSB consumption, respectively.
In adolescents, the SSB consumption was associated with the “milk and dairy” components, “sodium”, “SoFAAS”, and the total BHEI-R score. SSB consumption in adults was associated with the “total grains”, “meat, eggs and legumes”, “sodium”, “SoFAAS” components and the total BHEI-R score. In older adults, the components “whole fruit”, “total grains”, “milk and dairy”, “sodium”, “SoFAAS” and total BHEI-R score were associated with SSB consumption. These results are plotted in the radar charts (Figure 1, 2 and 3).
Radar chart of mean values of Brazilian Healthy Eating Index components according tertil of sugar sweetened beverage intake in adolescents, São Paulo (SP), Brazil, 2008.
Radar chart of mean values of Brazilian Healthy Eating Index components according tertil of sugar sweetened beverage intake in adults, São Paulo (SP), Brazil, 2008.
Radar chart of mean values of Brazilian Healthy Eating Index components according tertil of sugar sweetened beverage intake in older adults, São Paulo (SP), Brazil, 2008.
After adjustment for confounding variables, adolescents in the upper tertile of SSB consumption (T3) presented an increase of 1.15 points in the component “milk and dairy” when compared to adolescents in the lower tertile (T1). For the “SoFAAS” component, there was a decrease of 1.97 and 3.62 points for T2 and T3, respectively. The total BHEI-R score decreased 2.18 and 2.28 points for adolescents in T2 and T3, respectively (Table 1).
Brazilian Healthy Eating Index – Revised components associated with tertiles (T) of sugar-sweetened beverage intake in adolescents, adults and older adults participating in the Health Survey of São Paulo 2008. São Paulo (SP), Brazil, 2008.
Adults in the upper tertile of SSB consumption presented a decrease of 0.51 points in the “total fruits” component when compared to adults in the lower tertile of consumption. In the “total grains” component, there was an increase of 0.13 and 0.11 points for T2 and T3, respectively. There was an increase of 0.01 points in the “total vegetables” component for adults in the upper tertiles of SSB consumption. In the “meats, eggs and legumes” component, there was a decrease of 0.33 points for the adults in the T3 compared to those in the T1. In the “SoFAAS” component, there was a decrease of 1.33 and 3.25 points for T2 and T3, respectively. The total BHEI-R score decreased 1.65 and 3.31 points for adults on T2 and T3, respectively (Table 1).
In the older adults, there was a decrease of 0.41 points in the “whole fruits” component for the individuals in the upper tertile when compared to those in the T1. In the “total grains” component, there was an increase of 0.15 points for individuals in T3. In the “meats, eggs and legumes” component, the older adults in the upper SSB consumption tertile showed a reduction of 0.58 points when compared to those in the lower SSB consumption. In the “milk and dairy” component, there was an increase of 1.15 points for those in T3 of SSB consumption. In the “SoFAAS” component, there was a decrease of 1.95 and 2.63 points for T2 and T3, respectively. The total BHEI-R score decreased 2.60 points for the older adults in T3 compared to the older adults in the lower SSB consumption tertile (Table 1).
DISCUSSION
In the present study, an increased SSB consumption was associated with a decrease in the total BHEI-R score for the healthy dietary components and for the “SoFAAS” component. Our results demonstrated that SSB consumption was associated with poorer dietary quality, regardless of age group. Similar results were observed in a cross-sectional study with data involving 22513 adults from a United States National Health and Nutrition Examination Survey (NHANES), undertaken between 2003 and 2012,evaluated the association between SSB consumption and dietary quality and found that SSB consumption was associated with decreased dietary quality, measured using the HEI-2010. Furthermore, SSB consumption was most strongly and consistently associated with reduced dietary quality in all subgroups of the population study [1212 Ruopeng AN. Beverage consumption in relation to discretionary food intake and diet quality among US adults, 2003 to 2012. J Acad Nutr Diet. 2016;116(1):28-37. http://dx.doi.org/10.1016/j.jand.2015.08.009
https://doi.org/10.1016/j.jand.2015.08.0...
].
Evidence from a Multiethnic Cohort shows that HEI-2010 scores were inversely associated with risk of mortality from all causes, cardiovascular diseases, and cancer in adult men and women [2525 Harmon BE, Boushey CJ, Shvetsov YB, Ettienne R, Reedy J, Wilkens LR, et al. Associations of key diet-quality indexes with mortality in the Multiethnic Cohort: The Dietary Patterns Methods Project. Am J Clin Nutr. 2015;101(3):587-97. http://dx.doi.org/10.3945/ajcn.114.090688
https://doi.org/10.3945/ajcn.114.090688...
].
Adults and older adults who consumed more SSB presented a decreased score in terms of healthy dietary components, such as “total fruit” and “whole fruit”. A prospective study undertaken in Spain with 8,157 adults of both sexes found that individuals with a higher SSB consumption presented lower adherence to the Mediterranean dietary pattern, which is characterized with a higher consumption of fruits [66 Barrio-Lopez MT, Martinez-Gonzalez MA, Fernandez-Montero A, Beunza JJ, Zazpe I, Bes-Rastrollo M. Prospective study of changes in sugar-sweetened beverage consumption and the incidence of the metabolic syndrome and its components: The SUN cohort. Br J Nutr. 2013;110(9):1722-31. http://dx.doi.org/10.1017/S0007114513000822
https://doi.org/10.1017/S000711451300082...
]. In another prospective cohort study comprising 5,115 young adults of both sexes living in the United States, the Coronary Artery Risk Development in Young Adults study verified that participants who had a higher SSB consumption also presented with a lower consumption of dietary fiber [88 Pereira MA, Kartashov AI, Ebbeling CB, Van Horn L, Slattery ML, Jacobs Junior DR, et al. Fastfood habits, weight gain, and insulin resistance (the CARDIA study): 15-year prospective analysis. Lancet. 2005;365(9453):36-42. http://dx.doi.org/10.1016/S0140-6736(04)17663-0
https://doi.org/10.1016/S0140-6736(04)17...
], which may reflect low fruit intake. Meta-analysis of 95 prospective studies observed that fruit intake reduces the risk for coronary heart disease for stroke, cardiovascular disease and total cancer and estimated that 5.6 million premature deaths worldwide in 2013 may be attributable to a fruit and vegetable intake below 500g/day [2626 Aune D, Giovannucci E, Boffetta P, Fadnes LT, Keum N, Norat T, et al. Fruit and vegetable intake and the risk of cardiovascular disease, total cancer and all-cause mortality: A systematic review and dose-response meta-analysis of prospective studies. Int J Epidemiol. 2017;46(3)1029-56. http://dx.doi.org/10.1093/ije/dyw319
https://doi.org/10.1093/ije/dyw319...
].
Studies have demonstrated that SSB consumption has been associated with an unhealthy dietary pattern [55 Khan TA, Sievenpiper JL. Controversies about sugars: Results from systematic reviews and meta-analyses on obesity, cardiometabolic disease and diabetes. Eur J Nutr. 2016;55(Suppl.2):25-43. http://dx.doi.org/10.1007/s00394-016-1345-3
https://doi.org/10.1007/s00394-016-1345-...
,2727 Bleich SN, Wolfson JA. U.S. adults and child snacking patterns among sugar sweetened beverage drinkers and non-drinkers. Prev Med. 2015;72:8-14. http://dx.doi.org/10.1016/j.ypmed.2015.01.003
https://doi.org/10.1016/j.ypmed.2015.01....
], and may result in a decreased adherence to local traditional dietary patterns. A cross-sectional study that evaluated the association between dietary patterns and metabolic cardiovascular risk factors in São Paulo, Brazil, found that the ‘Traditional’ pattern showed a negative effect on obesity, suggesting a protective role of the ‘Traditional’ pattern against weight gain, increased fat mass, and abdominal fat accumulation [2828 Castro MA, Baltar VL, Marchioni DM, Fisberg RF. Examining associations between dietary patterns and metabolic CVD risk factors: A novel use of structural equation modelling. Br J Nutr. 2016;115(Suppl.9):1586-97. http://dx.doi.org/10.1017/S0007114516000556
https://doi.org/10.1017/S000711451600055...
]. However, studies indicate a decreased adherence to the ‘Traditional’ pattern and a change in dietary patterns by Brazilians. These changes are consistent with an increase in noncommunicable diseases and, in particular, with an increase in excess body weight in Brazil.
Adults and older adults who consumed higher SSB volumes presented an increased score in the “total grains” component. Foods that contribute the most energy from this component are: white rice (35.56%), French bread (18.56%), white flour (6.46%), crackers (3.48%), potatoes (3.19%), white spaghetti noodles (3.05%), chocolate cookies (2.41%), white bread loaf (2.20%), cassava (1.96%), and other types of cookies (1.48%) (data not shown). Results from a cross-sectional study of 24809 individuals who participated in a United States NHANES, from 1999 to 2010, showed that adults and older adults who were SSB consumers demonstrated a higher consumption of salty and sweet snacks, such as grains, pastas, crackers, all types of chips, cakes, cookies, pastries, and other simple carbohydrates-rich foods, than individuals who were not SSB consumers [2727 Bleich SN, Wolfson JA. U.S. adults and child snacking patterns among sugar sweetened beverage drinkers and non-drinkers. Prev Med. 2015;72:8-14. http://dx.doi.org/10.1016/j.ypmed.2015.01.003
https://doi.org/10.1016/j.ypmed.2015.01....
].
Adolescents and older adults who consumed more SSB presented higher scores in the “milk and dairy” component. Our findings are similar to a national cross-sectional study that found adolescents and older adults consumed more milk and dairy products than adults did. Moreover, this same study verified that dairy products accounted for 4.3% of the total daily energy of added sugars, being an important contributor to the added sugars and fat intake, affecting dietary quality [2929 Murphy MM, Barraj LM, Toth LD, Harkness LS, Bolster DR. Daily intake of dairy products in Brazil and contributions to nutrient intakes: A cross-sectional study. Public Health Nutr. 2015;19(3):393-400. http://dx.doi.org/10.1017/S1368980015001780
https://doi.org/10.1017/S136898001500178...
]. However, milk and dairy products are nutrient-rich and provide micronutrients, energy, high-quality protein, and essential fatty acids. In addition, milk and dairy products may help to prevent weight gain and changes to body composition [3030 Nezami M, Segovia-Siapco G, Beeson WL, Sabaté J. Association between consumption of dairy foods and anthropometric indicators of health in adolescents. Nutrients. 2016;8(7):1-16. http://dx.doi.org/10.3390/nu8070427
https://doi.org/10.3390/nu8070427...
]. Therefore, nutritional education aimed at choosing dairy products with lower sugar levels may play a key role in decreasing added sugar intake, especially among adolescents [3131 Pan American Health Organization. Plan of action for the prevention of obesity in children and adolescents. Washington (DC): Pan American Health Organization; 2014.].
Several strategies and public health policies could be implemented with the objective of reducing SSB consumption within the population, such as food and nutrition education, SSB taxation, regulation of the marketing of these food items, control of the sale of beverages in schools, and adoption of front-of-pack nutritional labels with warnings that identify unhealthy foods [3232 Silver LD, Ng SW, Ryan-Ibarra S, Taillie LS, Induni M, Miles DR, et al. Changes in prices, sales, consumer spending, and beverage consumption one year after a tax on sugar-sweetened beverages in Berkeley, California, US: A before-and-after study. PLos Med. 2017;14(4):1-19. http://dx.doi.org/10.1371/journal.pmed.1002283
https://doi.org/10.1371/journal.pmed.100...
].
Studies have shown that SSB taxation has a marked effect [3333 Ramírez R, Sternsdorff N, Pastor C. Chile’s Law on Food Labelling and Advertising: A replicable model for Latin America? Santiago: Llorente e Cuenca; 2016 [cited 2017 Oct 28]. Available from: http://www.desarrollando-ideas.com/wp-content/uploads/sites/5/2016/05/160504_DI_report_food_chile_ENG.pdf
http://www.desarrollando-ideas.com/wp-co...
,3434 Câmara dos Deputados (Brasil). Projeto de Lei nº3.606, de 2015. Disciplina a prevenção da obesidade infantil e a promoção da alimentação adequada nas escolas de educação básica das redes públicas e privadas do país, e dá outras providências. 2015 [cited 2017 Nov 5] Available from: http://www.camara.gov.br/proposicoesWeb/fichadetramitacao?idProposicao=2054519
http://www.camara.gov.br/proposicoesWeb/...
]. Since 2001, some municipal and state laws have operated within public and private schools to restrict the commercialization of products such as soft drinks and artificial juices in Brazilian schools. At a national level, since 2015, Bill No.3606 of 2015 [3434 Câmara dos Deputados (Brasil). Projeto de Lei nº3.606, de 2015. Disciplina a prevenção da obesidade infantil e a promoção da alimentação adequada nas escolas de educação básica das redes públicas e privadas do país, e dá outras providências. 2015 [cited 2017 Nov 5] Available from: http://www.camara.gov.br/proposicoesWeb/fichadetramitacao?idProposicao=2054519
http://www.camara.gov.br/proposicoesWeb/...
] is in process in the National Congress. This Bill is intended to prohibit establishments located in public or private schools from marketing beverages and foods that are not suitable for child or adolescent nutrition, aiming to prevent obesity in childhood and adolescence, as well as to encourage the formation of healthy eating habits [3535 Instituto Brasileiro de Defesa do Consumidor. São Paulo: IDEC apresenta novo modelo de rotulagem nutricional à ANVISA. 2017 [citado 2017 out 15]. Disponível em: https://idec.org.br/noticia/idec-apresenta-novo-modelo-de-rotulagem-nutricional-anvisa
https://idec.org.br/noticia/idec-apresen...
].
In Brazil, updating and improving the current nutritional labeling model has also been discussed. This model has been further elaborated by the Brazilian Institute of Consumer Protection, which suggested the inclusion of front-of-pack nutrition labels with warnings identifying unhealthy foods, such as SSB [3434 Câmara dos Deputados (Brasil). Projeto de Lei nº3.606, de 2015. Disciplina a prevenção da obesidade infantil e a promoção da alimentação adequada nas escolas de educação básica das redes públicas e privadas do país, e dá outras providências. 2015 [cited 2017 Nov 5] Available from: http://www.camara.gov.br/proposicoesWeb/fichadetramitacao?idProposicao=2054519
http://www.camara.gov.br/proposicoesWeb/...
]. Studies in countries adopting front-of-pack nutrition label shave shown a positive effect in terms of choice and food item purchasing, and suggest an increased awareness in the population concerning the nutritional aspects of the products [3636 Bix L, Sundar RP, Bello NM, Peltier C, Weatherspoon LJ, Becker MW. To see or not to see: Do front of pack nutrition labels affect attention to overall nutrition information? PLos One. 2015;10(10):1-20. http://dx.doi.org/10.1371/journal.pone.0139732
https://doi.org/10.1371/journal.pone.013...
,3737 Georgina RC, Burke PF, Waller DS, Wei E. The impact of front-of-pack marketing attributes versus nutrition and health information on parents’ food choices. Appetite. 2017;116:323-38. http://dx.doi.org/10.1016/j.appet.2017.05.001
https://doi.org/10.1016/j.appet.2017.05....
].
Limitations of this study include the dietary consumption assessment method used, that may involve errors in respect of dietary estimations due to recall errors, omissions, and errors in portion size estimation. To overcome these aspects and enhance data reliability, procedures were applied to structure data collection and analysis such as the Multiple Pass Method, the MSM used to estimate usual intake, and the adjustment of under- and over-reporters of energy intake. Another limitation involved the definition of SSB. Some studies evaluating SSB consumption have used different definitions, which limit comparisons between studies. Despite these limitations, this study improves understanding concerning the relationship between SSB consumption and dietary quality, and highlights the importance of investigating the dietary quality of SSB consumers in one of the world’s largest cities located in a middle-income country, where the majority of SSB consumption and most of the disease-related burden occurs [44 Cassady BA, Considine RV, Mattes RD. Beverage consumption, appetite, and energy intake: What did you expect? Am J Clin Nutr. 2012;95(3):587-93. http://dx.doi.org/10.3945/ajcn.111.025437
https://doi.org/10.3945/ajcn.111.025437...
].
CONCLUSION
The results suggest that a higher SSB consumption was associated with a poorer dietary quality with decreased fruit intake, meat, eggs and legumes, and increased intake of solid fat, alcohol and added sugar in the residents of São Paulo, Brazil. Diet is a multifaceted exposure and clustering of unhealthy food items was shown in this study, suggesting that SSB intake is a marker of poor diet quality. Public health policies aiming to decrease SSB consumption are essential to improve dietary quality and reduce the incidence of noncommunicable diseases and premature deaths associated with a poorer dietary pattern.
ACKNOWLEDGMENTS
Prof. Dr. Chester Luiz Galvão Cesar, Prof. Dr. Moisés Goldbaum, Maria Cecilia Goi Porto Alves, all Health Survey of São Paulo staff and the Food Consumption Research Group (GAC).
-
Support: São Paulo Municipal Health Department [no grant number], National Council for Scientific and TechnologicalDevelopment (CNPq; process nº481176/2008-0 e 473100/2009-6), Foundation for Research Support of the State of São Paulo (FAPESP process nº2009/15831-0).
REFERENCES
-
1Malik V, Popkin B, Bray G, Desprs J-P, Hu F. Sugar-sweetened beverages, obesity, type 2 diabetes mellitus, and cardiovascular disease risk. Circulation. 2010;121(11):1356-64. http://dx.doi.org/10.1161/circulationaha.109.876185
» https://doi.org/10.1161/circulationaha.109.876185 -
2Singh GM, Micha R, Khatibzadeh S, Lim S, Ezzati M, Mozaffarian D, et al Estimated global, regional, and national disease burdens related to sugar-sweetened beverage consumption in 2010. Circulation. 2015;132:639-66. http://dx.doi.org/10.1161/circulationaha.114.010636
» https://doi.org/10.1161/circulationaha.114.010636 -
3Khosravi-Boroujeni H, Sarrafzadegan N, Mohammadifard N, Alikhasi H, Sajjadi F, Asgari S, et al Consumption of sugar-sweetened beverages in relation to the metabolic syndrome among Iranian adults. Obes Facts. 2012;5:527-37. http://dx.doi.org/10.1159/000341886
» https://doi.org/10.1159/000341886 -
4Cassady BA, Considine RV, Mattes RD. Beverage consumption, appetite, and energy intake: What did you expect? Am J Clin Nutr. 2012;95(3):587-93. http://dx.doi.org/10.3945/ajcn.111.025437
» https://doi.org/10.3945/ajcn.111.025437 -
5Khan TA, Sievenpiper JL. Controversies about sugars: Results from systematic reviews and meta-analyses on obesity, cardiometabolic disease and diabetes. Eur J Nutr. 2016;55(Suppl.2):25-43. http://dx.doi.org/10.1007/s00394-016-1345-3
» https://doi.org/10.1007/s00394-016-1345-3 -
6Barrio-Lopez MT, Martinez-Gonzalez MA, Fernandez-Montero A, Beunza JJ, Zazpe I, Bes-Rastrollo M. Prospective study of changes in sugar-sweetened beverage consumption and the incidence of the metabolic syndrome and its components: The SUN cohort. Br J Nutr. 2013;110(9):1722-31. http://dx.doi.org/10.1017/S0007114513000822
» https://doi.org/10.1017/S0007114513000822 -
7Fung TT, Willett WC, Stampfer MJ, Manson JE, Hu FB. Dietary patterns and the risk of coronary heart disease in women. Arch Intern Med. 2000;161(15):1857-62.
-
8Pereira MA, Kartashov AI, Ebbeling CB, Van Horn L, Slattery ML, Jacobs Junior DR, et al Fastfood habits, weight gain, and insulin resistance (the CARDIA study): 15-year prospective analysis. Lancet. 2005;365(9453):36-42. http://dx.doi.org/10.1016/S0140-6736(04)17663-0
» https://doi.org/10.1016/S0140-6736(04)17663-0 -
9Anderson SA, Ramsden M, Kaye G. Diet qualities: Healthy and unhealthy aspects of diet quality in preschool children. Am J Clin Nutr. 2016;103(6):1507-13. http://dx.doi.org/10.3945/ajcn.115.128454
» https://doi.org/10.3945/ajcn.115.128454 -
10Valisa EH, Brenda MD, Wen Y, Kathleen JP, Paul AE, Jamie MZ. Dietary quality changes in response to a sugar-sweetened beverage-reduction intervention: Results from the talking health randomized controlled clinical trial. Am J Clin Nutr. 2017;105(4):824-33. http://dx.doi.org/10.3945/ajcn.116.144543
» https://doi.org/10.3945/ajcn.116.144543 -
11Leung CW, DiMatteo G, Gosliner WA, Ritchie LD. Sugar-sweetened beverage and water intake in relation to diet quality in u.s. children. Am J Prev Med. 2018;54(3):394-402. http://dx.doi.org/10.1016/j.amepre.2017.11.005
» https://doi.org/10.1016/j.amepre.2017.11.005 -
12Ruopeng AN. Beverage consumption in relation to discretionary food intake and diet quality among US adults, 2003 to 2012. J Acad Nutr Diet. 2016;116(1):28-37. http://dx.doi.org/10.1016/j.jand.2015.08.009
» https://doi.org/10.1016/j.jand.2015.08.009 -
13Matsudo S, Araújo T, Matsudo V, Andrade D, Andrade E, Oliveira C, et al Questionário Internacional de Atividade Física (IPAQ): estudo de validade e reprodutibilidade no Brasil. Rev Bras Ativ Fís Saúde. 2001;6(2):5-12. http://dx.doi.org/10.12820/rbafs.v.6n2p5-18
» https://doi.org/10.12820/rbafs.v.6n2p5-18 -
14Onis M, Onyango AW, Borghi E, Siyam A, Nishida C, Siekmann J. Development of a WHO growth reference for school-aged children and adolescents. Bull World Health Org. 2007;85(9):660-7.
-
15World Health Organization. Consultation on obesity: Preventing and managing the global epidemic. Geneva: WHO; 1998. WHO Technical Report Series No.894.
-
16Lebrão ML, Duarte YAO. Health, well-being and aging: The SABE study in São Paulo, Brazil. Brasília: Pan American Health Organization; 2003.
-
17Carvalho AM, Piovezan LG, Selem SSAC, Fisberg RM, Marchioni DML. Validation and calibration of self-reported weight and height from individuals in the city of São Paulo. Rev Bras Epidemiol. 2014;17(3):735-46. http://dx.doi.org/10.1590/1809-4503201400030013
» https://doi.org/10.1590/1809-4503201400030013 -
18Guenther PM, DeMaio TJ, Ingwersen LA, Berlin M. The multiple-pass approach for the 24-Hour Recall in the Continuing Survey of Food Intakes by Individuals (CSFII) 1994-1996. In: International Conference on Dietary Assessment Methods. Boston: Mass; 1995.
-
19Pinheiro ABV, Lacerda EMA, Benzecry EH, Gomes MCS, Costa VM. Tabela para Avaliação de Consumo Alimentar em Medidas Caseiras. São Paulo: Atheneu; 2000.
-
20Fisberg RM, Villar BS. Manual de receitas e medidas caseiras para cálculo de inquéritos alimentares: manual elaborado para auxiliar o processamento de inquéritos alimentares. São Paulo: Signus; 2002.
-
21Kelly MT, Rennie KL, Wallace JM, Robson PJ, Welch RW, Hannon-Fletcher M, et al Associations between the portion sizes of food groups consumed and measures of adiposity in the British National Diet and Nutrition Survey. Br J Nutr. 2009;101(9):1413-20. http://dx.doi.org/10.1017/S0007114508060777
» https://doi.org/10.1017/S0007114508060777 -
22Miller PE, McKinnon RA, Krebs-Smith SM, Subar AF, Chrique J, Kahle L, et al Sugar-sweetened beverage consumption in the U.S.: Novel assessment methodology. Am J Prev Med. 2012;45:416-21. http://dx.doi.org/10.1016/j.amepre.2013.05.014
» https://doi.org/10.1016/j.amepre.2013.05.014 -
23Previdelli AN, Andrade SC, Pires MM, Ferreira SRG, Fisberg RM, Marchioni DM. A revised version of the Health Eating Index for the Brazilian population. Rev Saúde Pública. 2011;45(4):794-8. http://dx.doi.org/10.1590/S0034-89102011005000035
» https://doi.org/10.1590/S0034-89102011005000035 -
24Andrade SC, Previdelli AN, Marchioni DM, Fisberg RM. Avaliação da confiabilidade e validade do Índice de Qualidade da Dieta Revisado. Rev Saúde Pública. 2013;47(4):675-83. http://dx.doi.org/10.1590/S0034-8910.2013047004267
» https://doi.org/10.1590/S0034-8910.2013047004267 -
25Harmon BE, Boushey CJ, Shvetsov YB, Ettienne R, Reedy J, Wilkens LR, et al Associations of key diet-quality indexes with mortality in the Multiethnic Cohort: The Dietary Patterns Methods Project. Am J Clin Nutr. 2015;101(3):587-97. http://dx.doi.org/10.3945/ajcn.114.090688
» https://doi.org/10.3945/ajcn.114.090688 -
26Aune D, Giovannucci E, Boffetta P, Fadnes LT, Keum N, Norat T, et al Fruit and vegetable intake and the risk of cardiovascular disease, total cancer and all-cause mortality: A systematic review and dose-response meta-analysis of prospective studies. Int J Epidemiol. 2017;46(3)1029-56. http://dx.doi.org/10.1093/ije/dyw319
» https://doi.org/10.1093/ije/dyw319 -
27Bleich SN, Wolfson JA. U.S. adults and child snacking patterns among sugar sweetened beverage drinkers and non-drinkers. Prev Med. 2015;72:8-14. http://dx.doi.org/10.1016/j.ypmed.2015.01.003
» https://doi.org/10.1016/j.ypmed.2015.01.003 -
28Castro MA, Baltar VL, Marchioni DM, Fisberg RF. Examining associations between dietary patterns and metabolic CVD risk factors: A novel use of structural equation modelling. Br J Nutr. 2016;115(Suppl.9):1586-97. http://dx.doi.org/10.1017/S0007114516000556
» https://doi.org/10.1017/S0007114516000556 -
29Murphy MM, Barraj LM, Toth LD, Harkness LS, Bolster DR. Daily intake of dairy products in Brazil and contributions to nutrient intakes: A cross-sectional study. Public Health Nutr. 2015;19(3):393-400. http://dx.doi.org/10.1017/S1368980015001780
» https://doi.org/10.1017/S1368980015001780 -
30Nezami M, Segovia-Siapco G, Beeson WL, Sabaté J. Association between consumption of dairy foods and anthropometric indicators of health in adolescents. Nutrients. 2016;8(7):1-16. http://dx.doi.org/10.3390/nu8070427
» https://doi.org/10.3390/nu8070427 -
31Pan American Health Organization. Plan of action for the prevention of obesity in children and adolescents. Washington (DC): Pan American Health Organization; 2014.
-
32Silver LD, Ng SW, Ryan-Ibarra S, Taillie LS, Induni M, Miles DR, et al Changes in prices, sales, consumer spending, and beverage consumption one year after a tax on sugar-sweetened beverages in Berkeley, California, US: A before-and-after study. PLos Med. 2017;14(4):1-19. http://dx.doi.org/10.1371/journal.pmed.1002283
» https://doi.org/10.1371/journal.pmed.1002283 -
33Ramírez R, Sternsdorff N, Pastor C. Chile’s Law on Food Labelling and Advertising: A replicable model for Latin America? Santiago: Llorente e Cuenca; 2016 [cited 2017 Oct 28]. Available from: http://www.desarrollando-ideas.com/wp-content/uploads/sites/5/2016/05/160504_DI_report_food_chile_ENG.pdf
» http://www.desarrollando-ideas.com/wp-content/uploads/sites/5/2016/05/160504_DI_report_food_chile_ENG.pdf -
34Câmara dos Deputados (Brasil). Projeto de Lei nº3.606, de 2015. Disciplina a prevenção da obesidade infantil e a promoção da alimentação adequada nas escolas de educação básica das redes públicas e privadas do país, e dá outras providências. 2015 [cited 2017 Nov 5] Available from: http://www.camara.gov.br/proposicoesWeb/fichadetramitacao?idProposicao=2054519
» http://www.camara.gov.br/proposicoesWeb/fichadetramitacao?idProposicao=2054519 -
35Instituto Brasileiro de Defesa do Consumidor. São Paulo: IDEC apresenta novo modelo de rotulagem nutricional à ANVISA. 2017 [citado 2017 out 15]. Disponível em: https://idec.org.br/noticia/idec-apresenta-novo-modelo-de-rotulagem-nutricional-anvisa
» https://idec.org.br/noticia/idec-apresenta-novo-modelo-de-rotulagem-nutricional-anvisa -
36Bix L, Sundar RP, Bello NM, Peltier C, Weatherspoon LJ, Becker MW. To see or not to see: Do front of pack nutrition labels affect attention to overall nutrition information? PLos One. 2015;10(10):1-20. http://dx.doi.org/10.1371/journal.pone.0139732
» https://doi.org/10.1371/journal.pone.0139732 -
37Georgina RC, Burke PF, Waller DS, Wei E. The impact of front-of-pack marketing attributes versus nutrition and health information on parents’ food choices. Appetite. 2017;116:323-38. http://dx.doi.org/10.1016/j.appet.2017.05.001
» https://doi.org/10.1016/j.appet.2017.05.001
Publication Dates
-
Publication in this collection
2019
History
-
Received
11 June 2018 -
Reviewed
05 Dec 2018 -
Accepted
10 Dec 2018

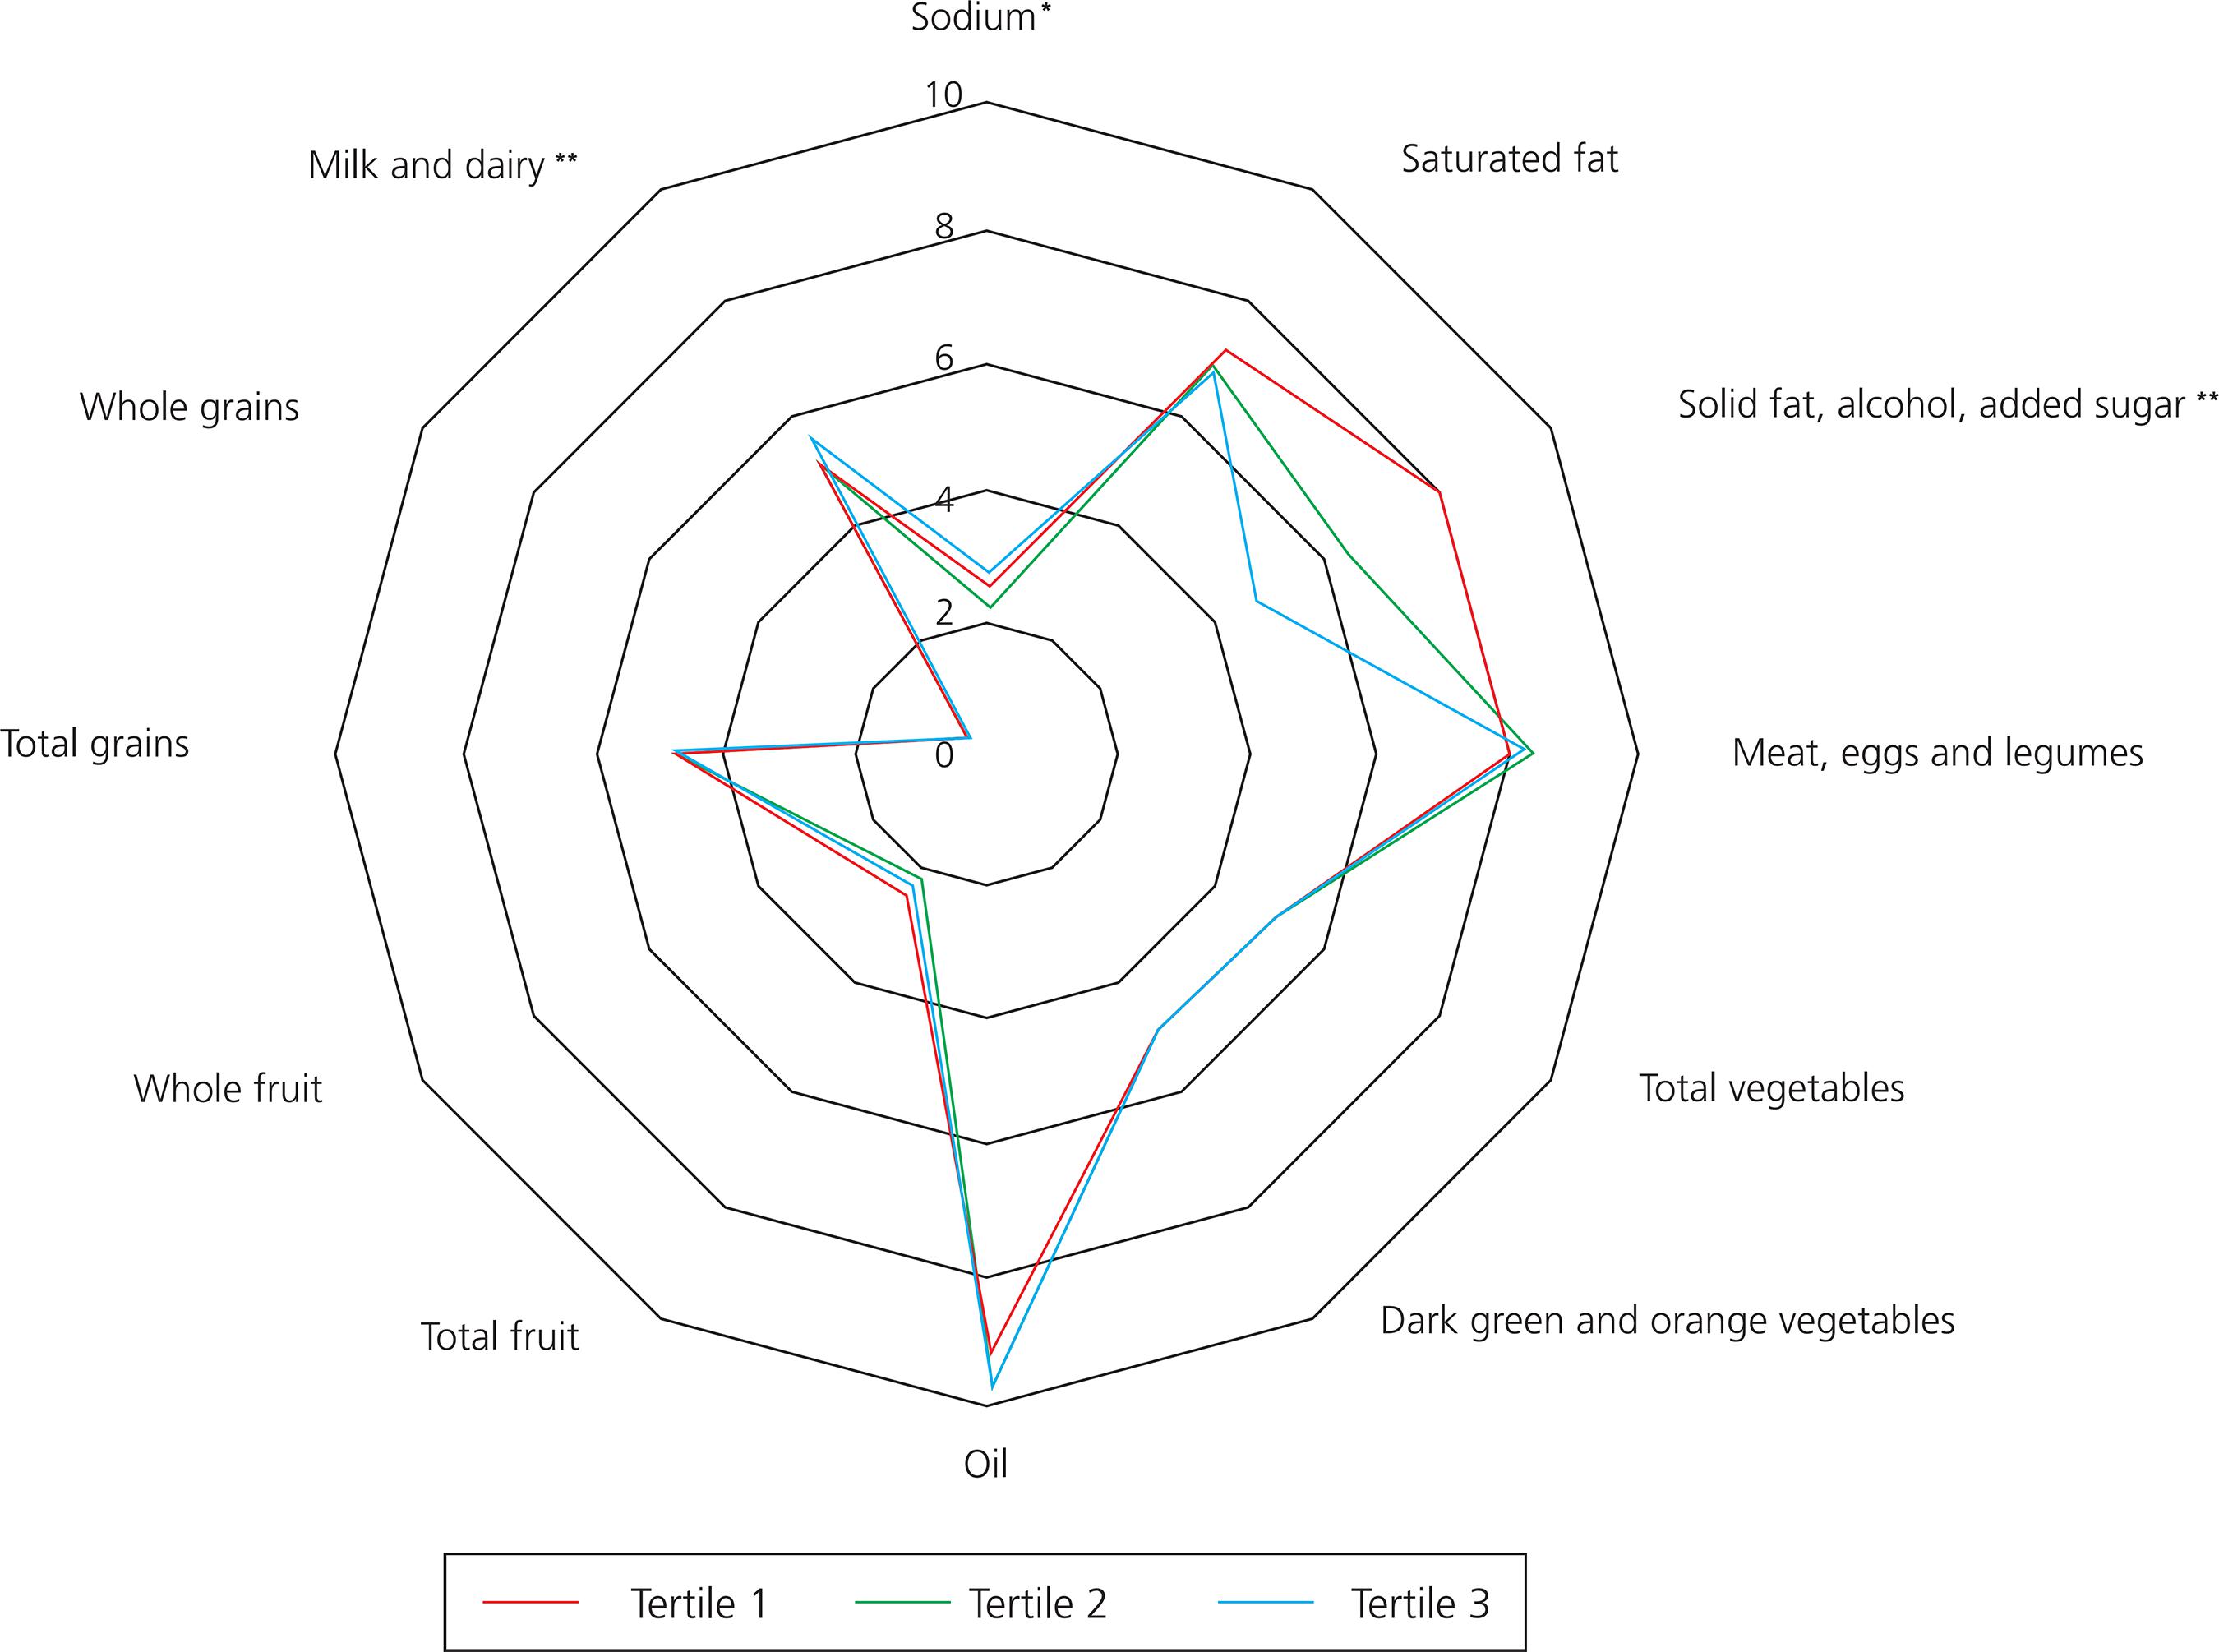 Note: *p<0.05, **p<0.001. Tertile 1: 341.55mL of sugar-sweetened beverage/day; Tertile 2: 628.07mL of sugar-sweetened beverage; Tertile 3: 1120.11mL of sugar-sweetened beverage/day.
 Note: *p<0.05, **p<0.001. Tertile 1: 311.49mL of sugar-sweetened beverage/day; Tertile 2: 609.02 mL of sugar-sweetened beverage; Tertile 3: 1069.63mL of sugar-sweetened beverage/day.
 Note: *p<0.05, **p<0.001. Tertile 1: 292.52mL of sugar-sweetened beverage/day; Tertile 2: 602.34mL of sugar-sweetened beverage; Tertile 3: 928.77mL of sugar-sweetened beverage/day.